 Nfamara K. Dampha
 Colette Salemi
 Stephen Polasky
 Amare Gebre Egziabher4
 Wendy Rappeport
- 1Department of Applied Economics, Natural Capital Project-The Earth Economy Modelers (NatCap TEEMs), Institute on the Environment, University of Minnesota, Minneapolis, MN, United States
- 2World Bank-UNHCR Joint Data Center on Forced Displacement, Copenhagen, Denmark
- 3Department of Economics, University of Victoria, Victoria, BC, Canada
- 4Department of Ecology, Evolution and Behavior, Institute on the Environment, University of Minnesota, Minneapolis, MN, United States
- 5UNHCR Rwanda Office, Kigali, Rwanda
Climate change hazards pose significant risks to vulnerable populations, particularly refugees residing in camps within environmentally sensitive areas. This study assesses climate and disaster risks in refugee-hosting districts in Rwanda using GIS-based risk mapping, decision science tools (AHP), remote sensing, and econometric analysis. The findings reveal spatial variability in hazard exposure across camps, with Mahama and Mugombwa refugee camps experiencing the highest flood risks, while Gihembe, Kiziba, and Kigeme camps are most susceptible to landslides. Between 2013 and 2021, landslides resulted in the damage of 324 hectares of cropland in Gihembe district and caused 110 fatalities in Kiziba’s district in 2016 alone. The study also finds that Mahama camp is highly vulnerable to drought, reflecting national data indicating that 4.2 million Rwandans were affected by droughts between 1974 and 2018. In addition, Kiziba camp exhibits severe soil erosion, with up to 19 million tons of annual soil loss in its watershed area. This erosion, exacerbated by deforestation due to firewood harvesting and construction material collection, weakens slope stability, intensifying landslide risks and increasing sediment transport into local water sources, thereby impacting water quality. Our results support recent disaster management decisions by the Government of Rwanda and UNHCR, including the closure of Gihembe camp in 2021 due to landslide risks and the relocation of vulnerable populations from Kigeme camp due to erosion-induced ravine formation. While these interventions reduce immediate risks, continued efforts are needed to enhance camp resilience, strengthen early warning systems, and integrate nature-based solutions into long-term disaster risk management.
1 Introduction
The costs of climate change are already manifesting in many low-income countries, where poverty and weak institutions reduce household capacity to cope with increasingly frequent natural hazards, such as floods, droughts, and landslides (Barbier and Hochard, 2018). There is growing concern that the resulting natural disasters (Blaikie et al., 1994) will fuel additional forced displacement (Bronen, 2012; Intergovernmental Panel on Climate Change, 1990). Evidence of environmentally-induced migration is indeed growing (Beltran and Hadzi-Vascov, 2023; Burzyński et al., 2022; Thalheimer et al., 2023), but it is additionally vital to evaluate the climate change vulnerabilities of populations displaced by conflict, particularly those experiencing protracted displacement.1
Analyzing vulnerability to climate change requires assessing exposure, sensitivity, and adaptive capacity through a multidimensional approach. This includes climate hazard mapping to identify risks like floods, droughts, and landslides, alongside socioeconomic analysis to evaluate household resilience, income levels, and access to services (Khosravi et al., 2019). Environmental indicators, such as vegetation loss and soil erosion, help assess land degradation, while institutional readiness examines the effectiveness of national disaster risk reduction (DRR) policies and refugee protection frameworks (Tall et al., 2022). Integrating these elements ensures a comprehensive vulnerability analysis, guiding policy and intervention strategies in refugee-hosting areas.
In some countries, such as Rwanda, the majority of refugees (more than 90%) reside in camps managed by the government, the United Nations High Commissioner for Refugees (UNHCR), and other humanitarian organizations. Government planners often site camps close to poor, peripheral host communities, in an effort to target the positive spillovers of inclusive camp services2 to vulnerable hosts (Maystadt and Verwimp, 2014). Planners also minimize the cost of the land, preferring land (often under government or communal tenure) that is freely available (Salemi, 2021). Given the cost incentives, the area planners designate for encampments may be of lower value than other areas, which could result in higher natural hazard risks in these areas (Fransen et al., 2024).
There is a limited but growing body of knowledge on the prevalence of climate and natural hazards in refugee camps. Fransen et al. (2024) examine natural hazard risks across encampment areas in East Africa, Jordan, Pakistan, and Bangladesh. The study argues that these encampment areas are especially susceptible to drought, extreme temperatures, and in Bangladesh, extreme rainfall. Similarly, Bernhofen et al. (2023) find evidence of elevated flood risk in Ethiopia’s refugee camps. Focusing on the local distribution of risks, Owen et al. (2023) examine natural hazard risk levels for refugee camps in South Sudan, Kenya, Ethiopia, Uganda, and Tanzania, comparing the locally defined risk profile in the camp area to other border regions without encampments. Seven of the 17 camps the study examined exhibit elevated risk levels, suggesting that some, but not all camp areas experience above-average exposure to natural hazard events. We align as much as possible with Owen et al. (2023) in our focus of how risk levels near camps compare to risk levels in other areas of the country.
This study assesses the biophysical risk levels of refugee camp areas to extreme weather and climate-related hazards such as floods, landslides, droughts, and soil erosion in Rwanda. The study’s primary objective is to evaluate the relative risk and vulnerability levels of different refugee-hosting districts in Rwanda. Our goal is to provide evidence-based results to inform policy and operational decision-making processes at local, national, and international levels.
2 Study area
2.1 Country context
Our study is a national-level analysis with specific details on refugee-hosting districts. Rwanda is one of the most densely populated countries in Africa, given its small territorial size and growing population. The land-locked nation with a landmass of 26,338 square kilometers (2,633,800 ha) bordered Uganda (north), Burundi (south), DRC (west), and Tanzania (east). Rwanda is among the fastest-growing economies in Africa, with an annual GDP growth rate of 8.2 percent in 2023 (Figure A3). The national poverty rate fell from 58.9 percent to 38.2 percent between 2000 and 2017 (Bagstad et al., 2020).
Figure 1 provides a map of our study context and illustrates Rwanda’s watersheds. Precipitation patterns vary across provinces and districts in Rwanda. Rwanda has two distinct wet seasons: heavy rains regularly occur during the long wet season (March to May), while rainfall varies geographically during the short rainy season (October to December). The western parts of the country receive more precipitation events than the eastern locations. The highest monthly rainfall amount is often recorded in April. In 2020, for instance, April precipitation ranged from 155 mm in the eastern area to 269 mm in the western region (Fick and Hijmans, 2017). In Rwanda, global warming has reduced rainy days with a marked increase in the frequency and intensity of torrential rainfall events. Unlike percipitation, evapotranspiration in Rwanda is relatively higher in the eastern than in the western region (Brooks et al., 2013).
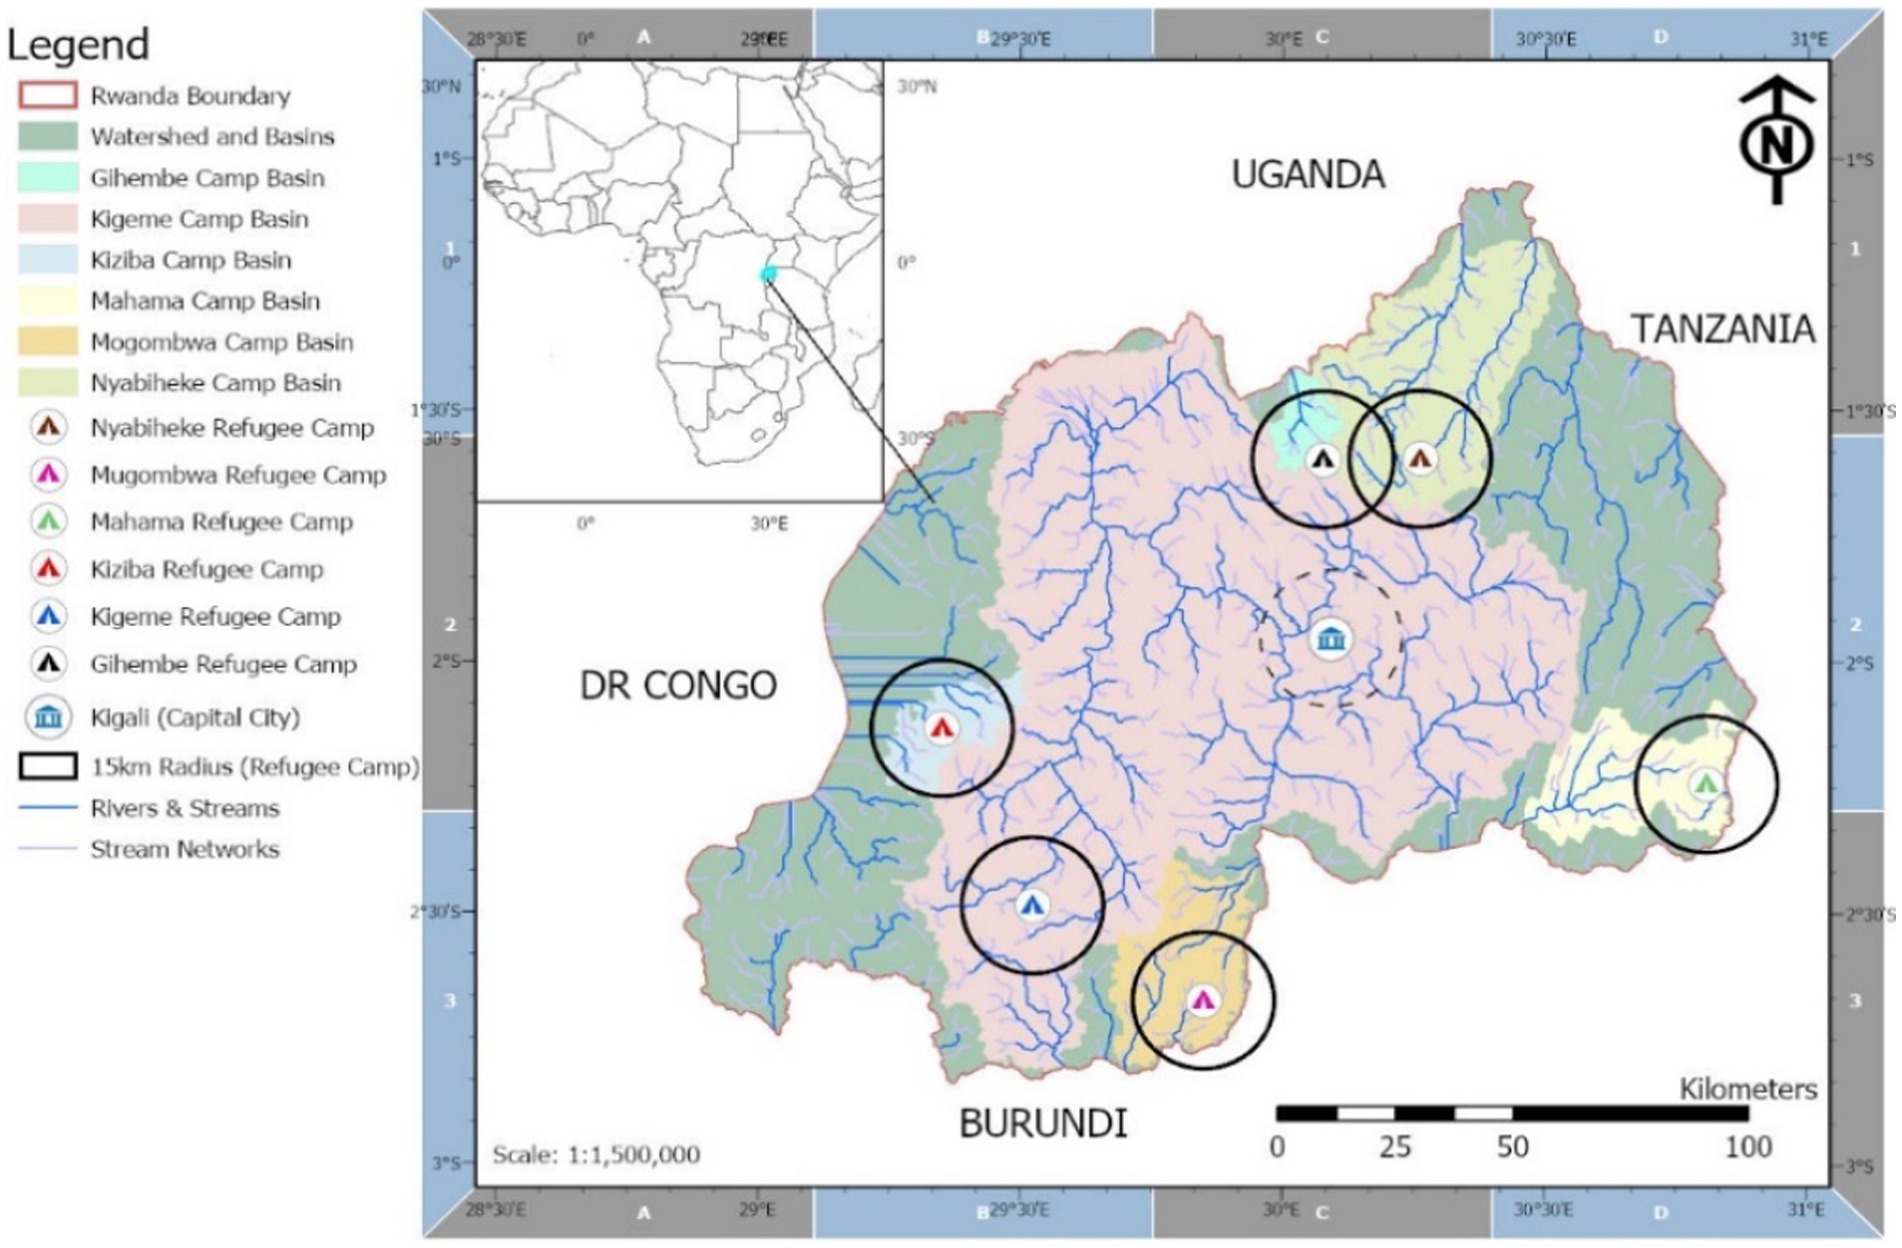
Figure 1. Study area illustrating watershed and sub-watersheds (basins) contributing to and receiving flow accumulation of water and sediment loads. The different colors show the watershed boundaries. The 15 km buffer distance around all refugee camps includes more than one watershed boundary, except for the Kigeme refugee camp.
Our assessment also incorporates land cover, elevation, and slope. The land cover is one of the most critical factors for assessing and understanding the hydrological dynamics for any given watershed area. For instance, highly vegetated or forested areas gain more infiltration capacity during precipitation events. Infiltration capacity represents the permeability of water from surface areas into the ground, potentially contributing to baseflow and recharging groundwater aquifers, which serve as a primary source of clean drinking water. Croplands dominate a vast area for Rwanda’s vegetation cover and significantly enhance national food security and food sovereignty conditions. Similarly, with a mountainous topographic, Rwanda’s elevation levels range from 1,525 to over 4,500 meters above global mean sea level. The highest altitude areas are found in the northwestern and southwestern regions (Nsengiyumva et al., 2018).
2.2 Refugees in Rwanda
Rwanda is currently home to over 130,000 refugees. Its principal refugee-sending countries are the Democratic Republic of the Congo (DRC) (62 percent) and Burundi (37 percent) (UNHCR, 2024b). A meaningful share of the Congolese refugee population has been displaced in Rwanda since the 1990s, a consequence of the First Congo War. Ongoing violence in the Democratic Republic of Congo has fueled continual population displacement into Rwanda. The Burundian refugees mainly arrived in the country following the post-2015 election-induced tensions and conflicts in Burundi (UNHCR, 2021a).
The Government of Rwanda (GoR) is a signatory of the 1951 Refugee Convention and other related protocols and agreements, and the Ministry in Charge of Emergency Management (MINEMA) oversees the protection of refugees and management of refugee response (MINEMA, 2021).
Rwanda upholds progressive refugee-related policies: refugees are not required to live in camps, and those who do reside in encampment areas have free mobility. Encamped refugees receive food assistance from the World Food Program (WFP), and all refugees receive cash assistance for nonfood items (UNHCR, 2021b, 2024c). Those living in camps obtain healthcare and schooling through UNHCR and humanitarian partners. As of 2019, urban-based refugees have access to the national Community Based Health Insurance scheme (Karinganire, 2022). Rwanda guarantees access to free primary and secondary schooling for all refugee children, and those living in or near camps can obtain UNHCR support for school meals and uniforms (UNHCR, n.d.). Importantly, refugees can work legally (MINEMA and World Bank, 2019), though they face social and market barriers to employment, resulting in a high employment rate (Bilgili and Loschmann, 2018).
A small fraction (about 10%) of refugees live in urban areas, mainly in Kigali City and Nyamata (MINEMA and World Bank, 2019). Presently, the majority of refugees reside in one of the following refugee camps: Nyabiheke, Kiziba, Kigeme, Mugombwa, and Mahama. Prior to 2021, Rwanda also operated the Gihembe camp in Gicumbi district. Gihembe was notably closed due to natural hazard threats, but since it was operating during the development of this study, and given its value as a comparison to still-active sites, we keep the Gicumbi camp in our analysis.
The locations of all six camps are shown in Figure 1, and we provide satellite imagery of the camps in Figure 2. Mahama is the largest, accommodating 47% of the total refugee population as of 2024. Kiziba and Kigeme Camp residents each account for 11% of the refugee population, while Nyabiheke and Mugombwa each represent about 9% of the population (UNHCR, 2024a). In this study, the 15 km area is identified as the exposure extent of refugees and host communities to various hydro-climatological risks. This buffer area usually goes beyond the official boundary of a single administrative district or a hydrologically delineated watershed extent. Focusing on the 15 km radius around camps aligns with UNHCR policy frameworks in identifying the refugees’ host community area to support resource allocation prioritization for refugee and host-community support.
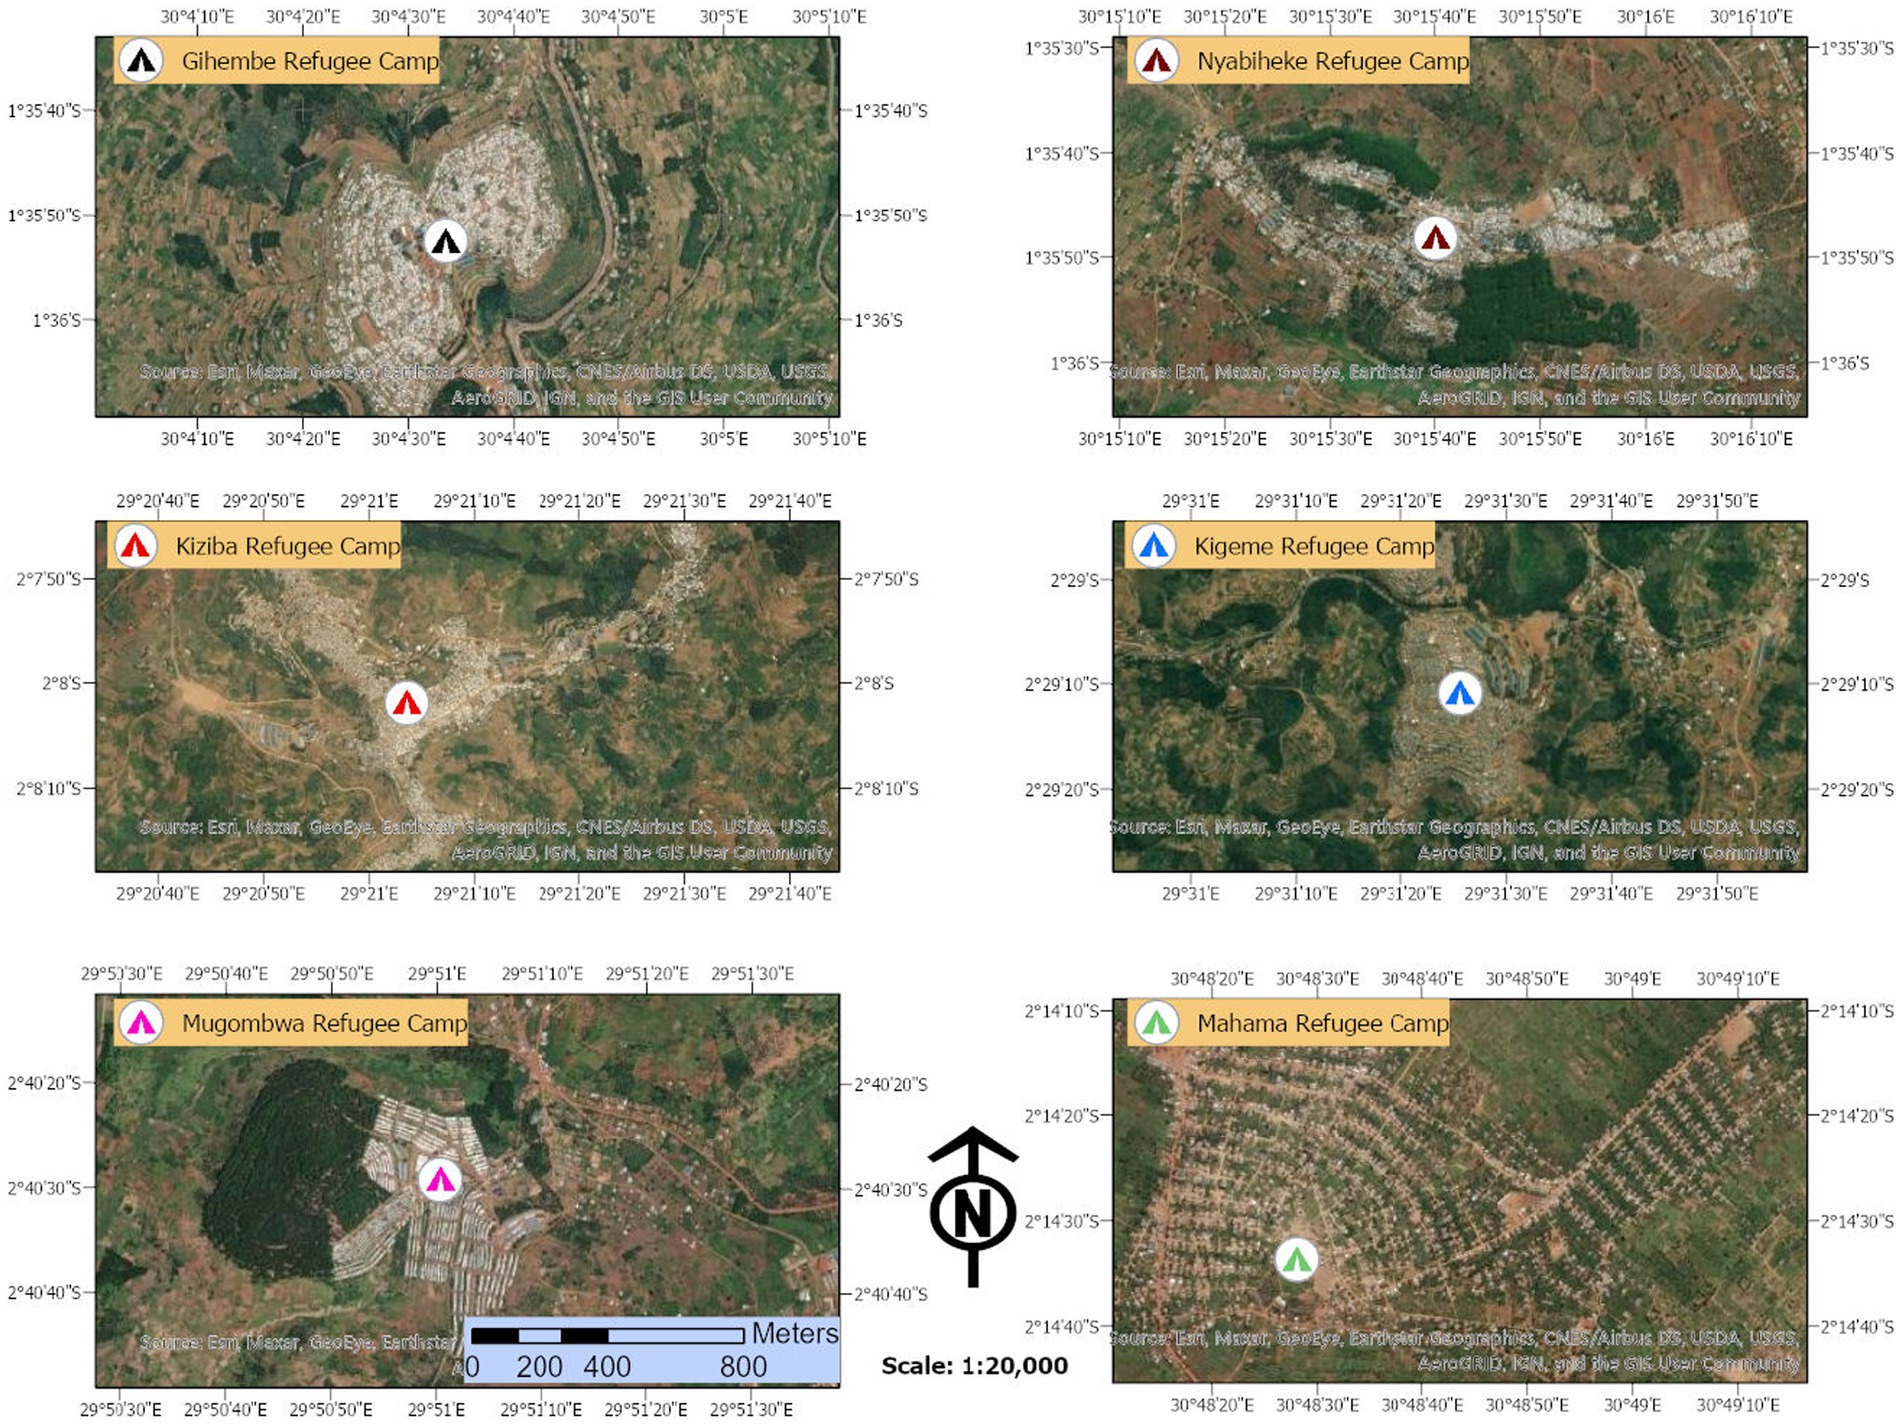
Figure 2. Satellite imagery of Rwanda’s refugee camps. Maps produced by study team using ArcGIS pro basemap (Esri et al., 2021).
3 Data description
3.1 Geospatial data layers
The geospatial data included in this analysis were primarily GIS and remotely sensed layers from various sources. Incorporated map layers capture land cover (LC), elevation, precipitation, evapotranspiration, hydrological soil groups, the normalized difference vegetation index, and compound topographic index (Table 1). Compound Topographic Index (CTI) also called the Topographic Wetness Index (TWI), measures how water accumulates in a landscape based on slope and upstream drainage area. Higher values indicate areas prone to saturation, making it useful for identifying flood-prone and landslide-susceptible zones. Normalized Difference Vegetation Index (NDVI) derived from land cover satellite imagery that measures vegetation health and density. To generate the NDVI layer, we used Band 4 and 5 of Landsat 8 to calculate the NDVI (Band 5 – Band 4)/(Band 5 + Band 4) and eventually incorporated into spatial multi-criteria flood risk analysis. NDVI helps assess land cover changes, flood vulnerability, and drought conditions, as greener areas absorb more water and reduce runoff. Drought Index (scPDSI—Self-Calibrating Palmer Drought Severity Index) is a measure of long-term drought severity, adjusted for different climate zones. This index combines precipitation, evapotranspiration, and soil moisture data to track dry conditions, particularly relevant for monitoring water scarcity risks in refugee-hosting districts. Hydrologic Soil Group (HSG) is a classification of soil types based on infiltration and runoff potential, critical for flood and erosion modeling. Soils are grouped from A (high infiltration, low runoff) to D (low infiltration, high runoff), helping predict areas prone to waterlogging or surface runoff. Digital Elevation Model (DEM) is a 3D representation of terrain elevation, derived from Shuttle Radar Topography Mission (SRTM). DEMs are used for mapping watersheds, modeling landslides, and assessing soil erosion risk by identifying steep slopes, drainage paths, and elevation changes.
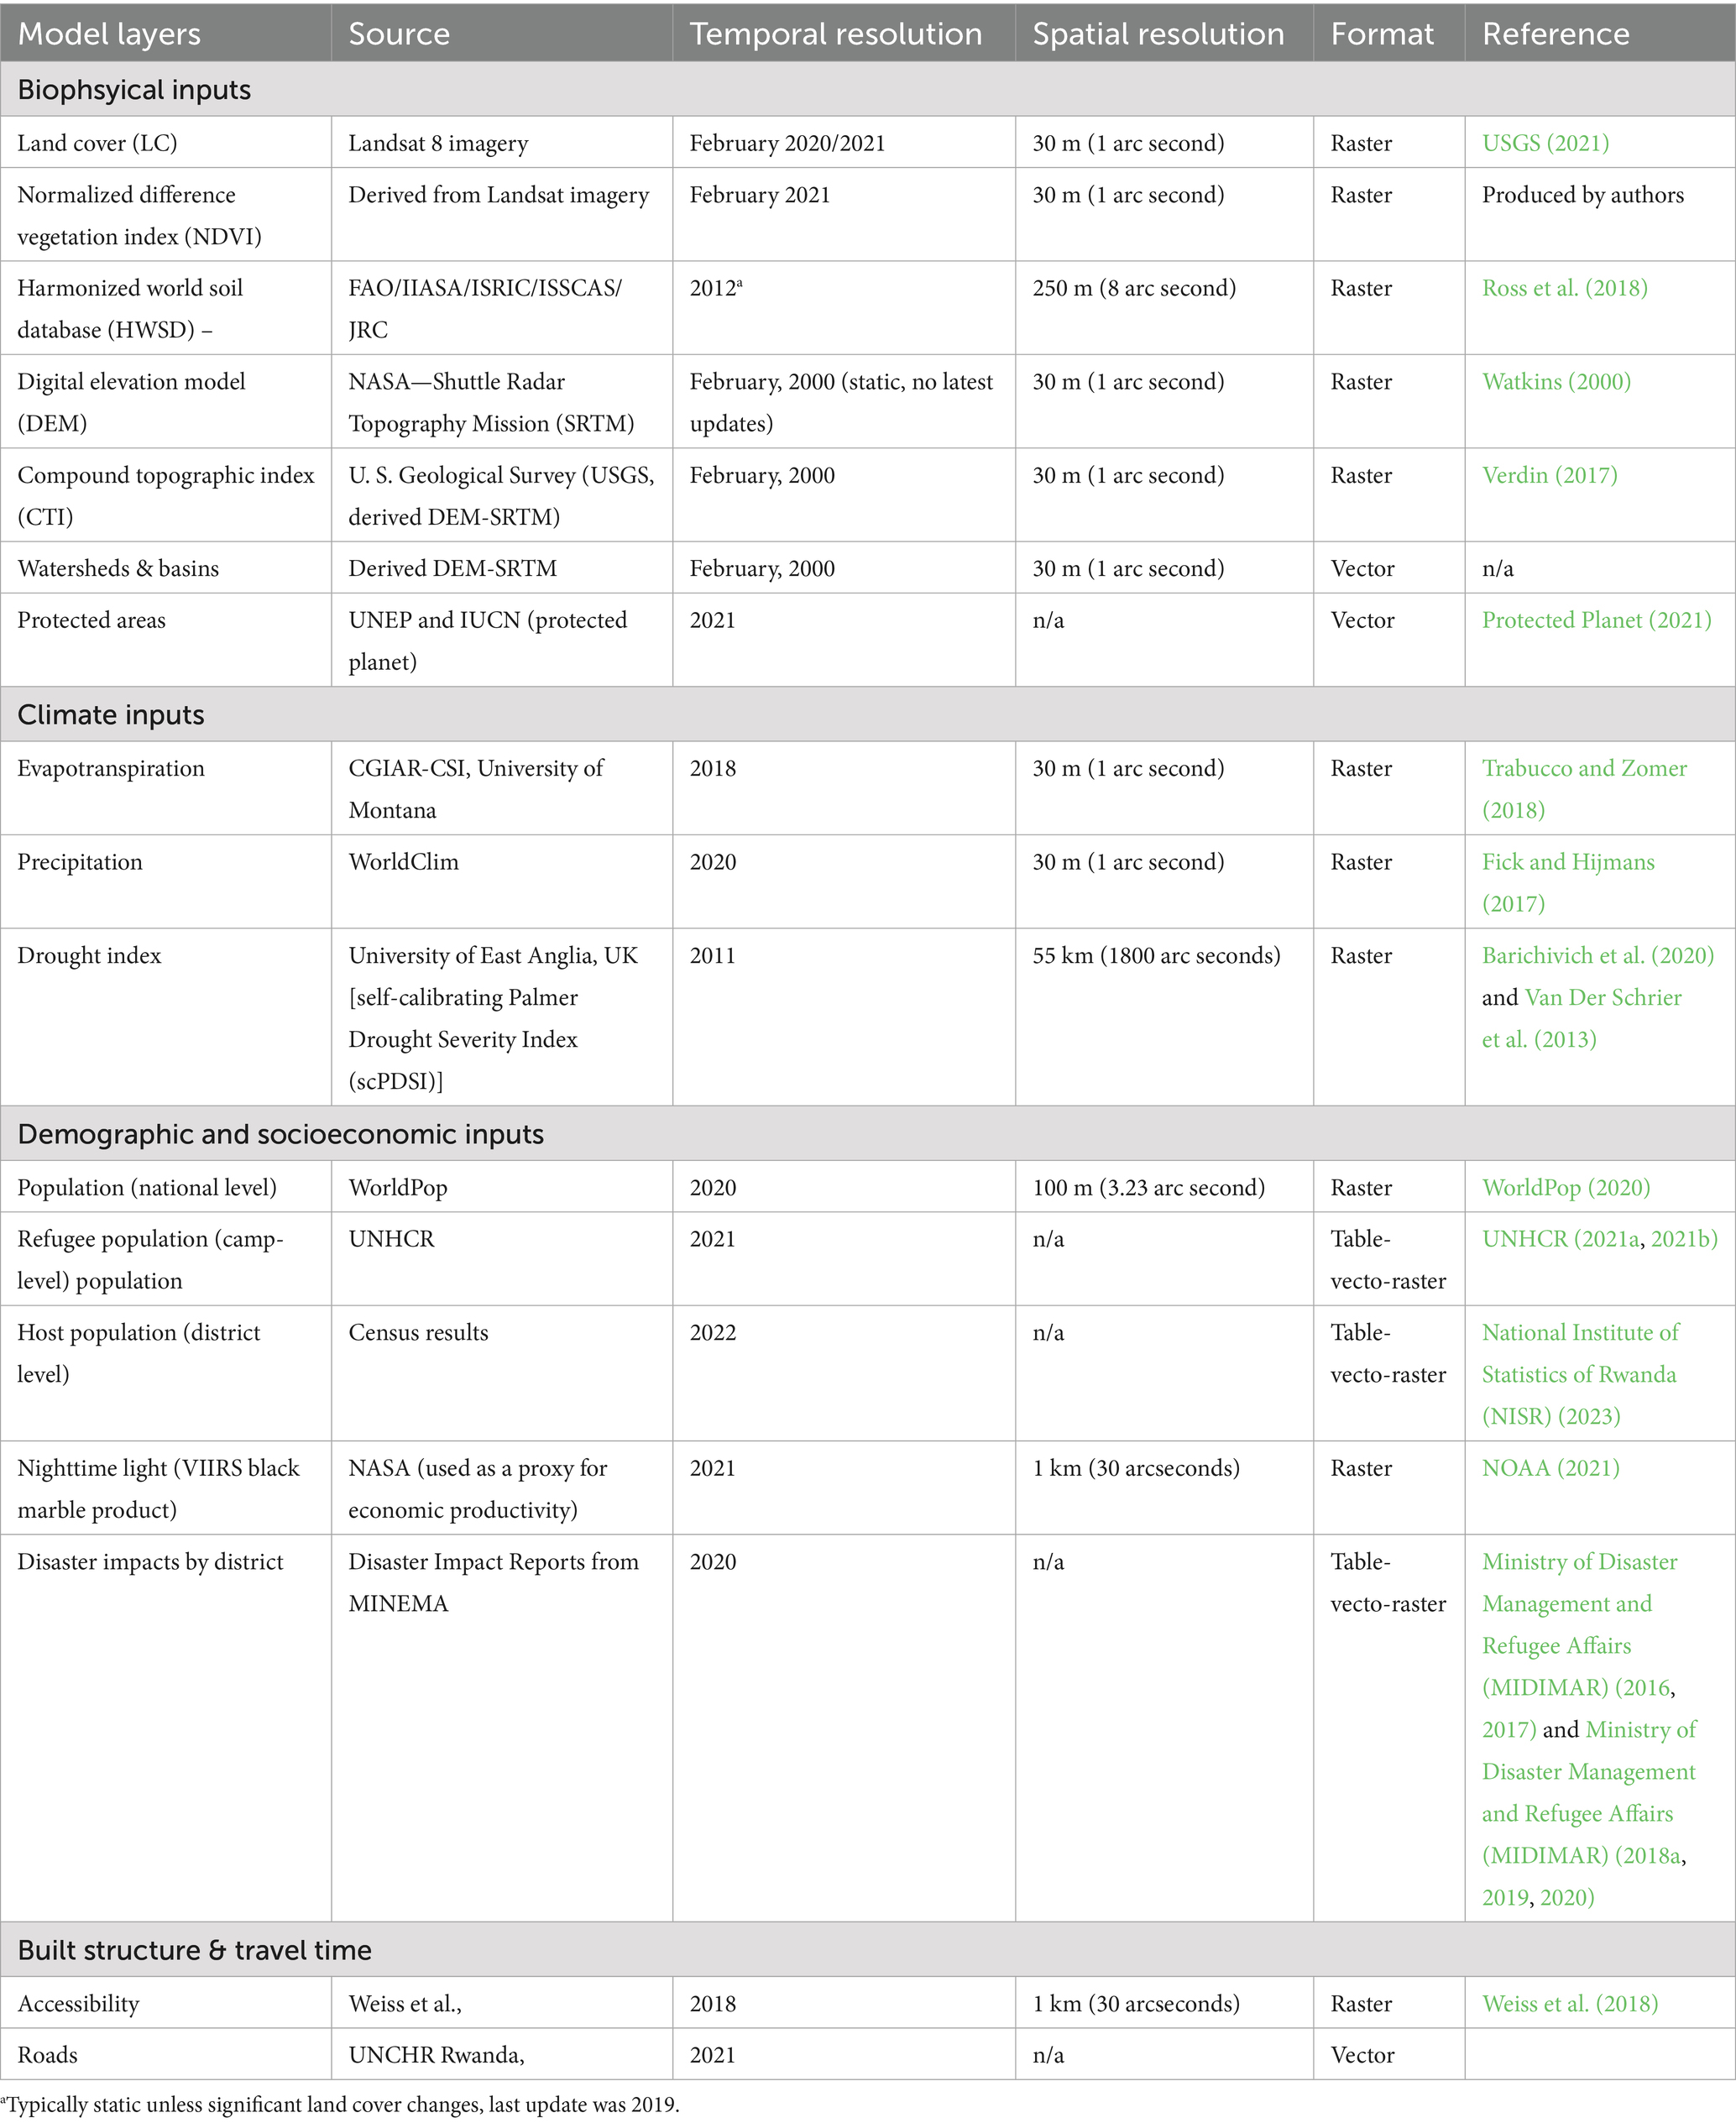
Table 1. Geospatial data description and sources.
Previous studies have identified and used these thematic layers for assessing flood, drought, and erosion risks in various locations [Ahmadisharaf et al., 2016; Chitsaz and Banihabib, 2015; De Brito et al., 2018; Kanani-Sadat et al., 2019; Khosravi et al., 2019; Kowalski et al., 2009; Rahmati et al., 2016; Shadmehri Toosi et al., 2019; Tang et al., 2018; World Wildlife Fund (WWF), 2016]. As described below, most of the data used are publicly available and required limited pre-processing, as included in our modeling, except for the LULC map, which required pre-processing and image classification.
To examine Rwanda’s land cover, we used Landsat 8 spectral imagery with less than 10 percent cloud cover (30 m resolution). To avoid temporal data mismatches while controlling for seasonal effects, we restricted our spectral imagery sample to data captured in January and February 2020/2021, falling between Rwanda’s long and short-wet seasons. Due to atmospheric distortions from cloud cover, we could not use finer resolution land cover data from the European Space Agency’s (ESA) Copernicus satellite, Sentinel-2 A/B (10 m resolution).
The land cover (LC) class identification and training process was informed by previous LC maps created by the Regional Center for Mapping of Resources for Development [RCMRD, 2015; Regional Center for Mapping of Resources for Development (RCMRD), 2013], following the RCMRD (2015) methodology, classes with less producer’s accuracy were thoroughly considered during the training stage of image processing.3 The image processing, including the training sample generation and map creations, was carried out using the ArcGIS Pro software (Version 2.4.0, 2019). We used a pixel-based supervised classification method for image processing based on the random forest algorithm. The land cover map (Figure 3) is a key input for the InVEST Sediment Delivery Ratio (SDR) model, as it determines how different land cover types influence soil erosion and sediment transport (see methodology section).
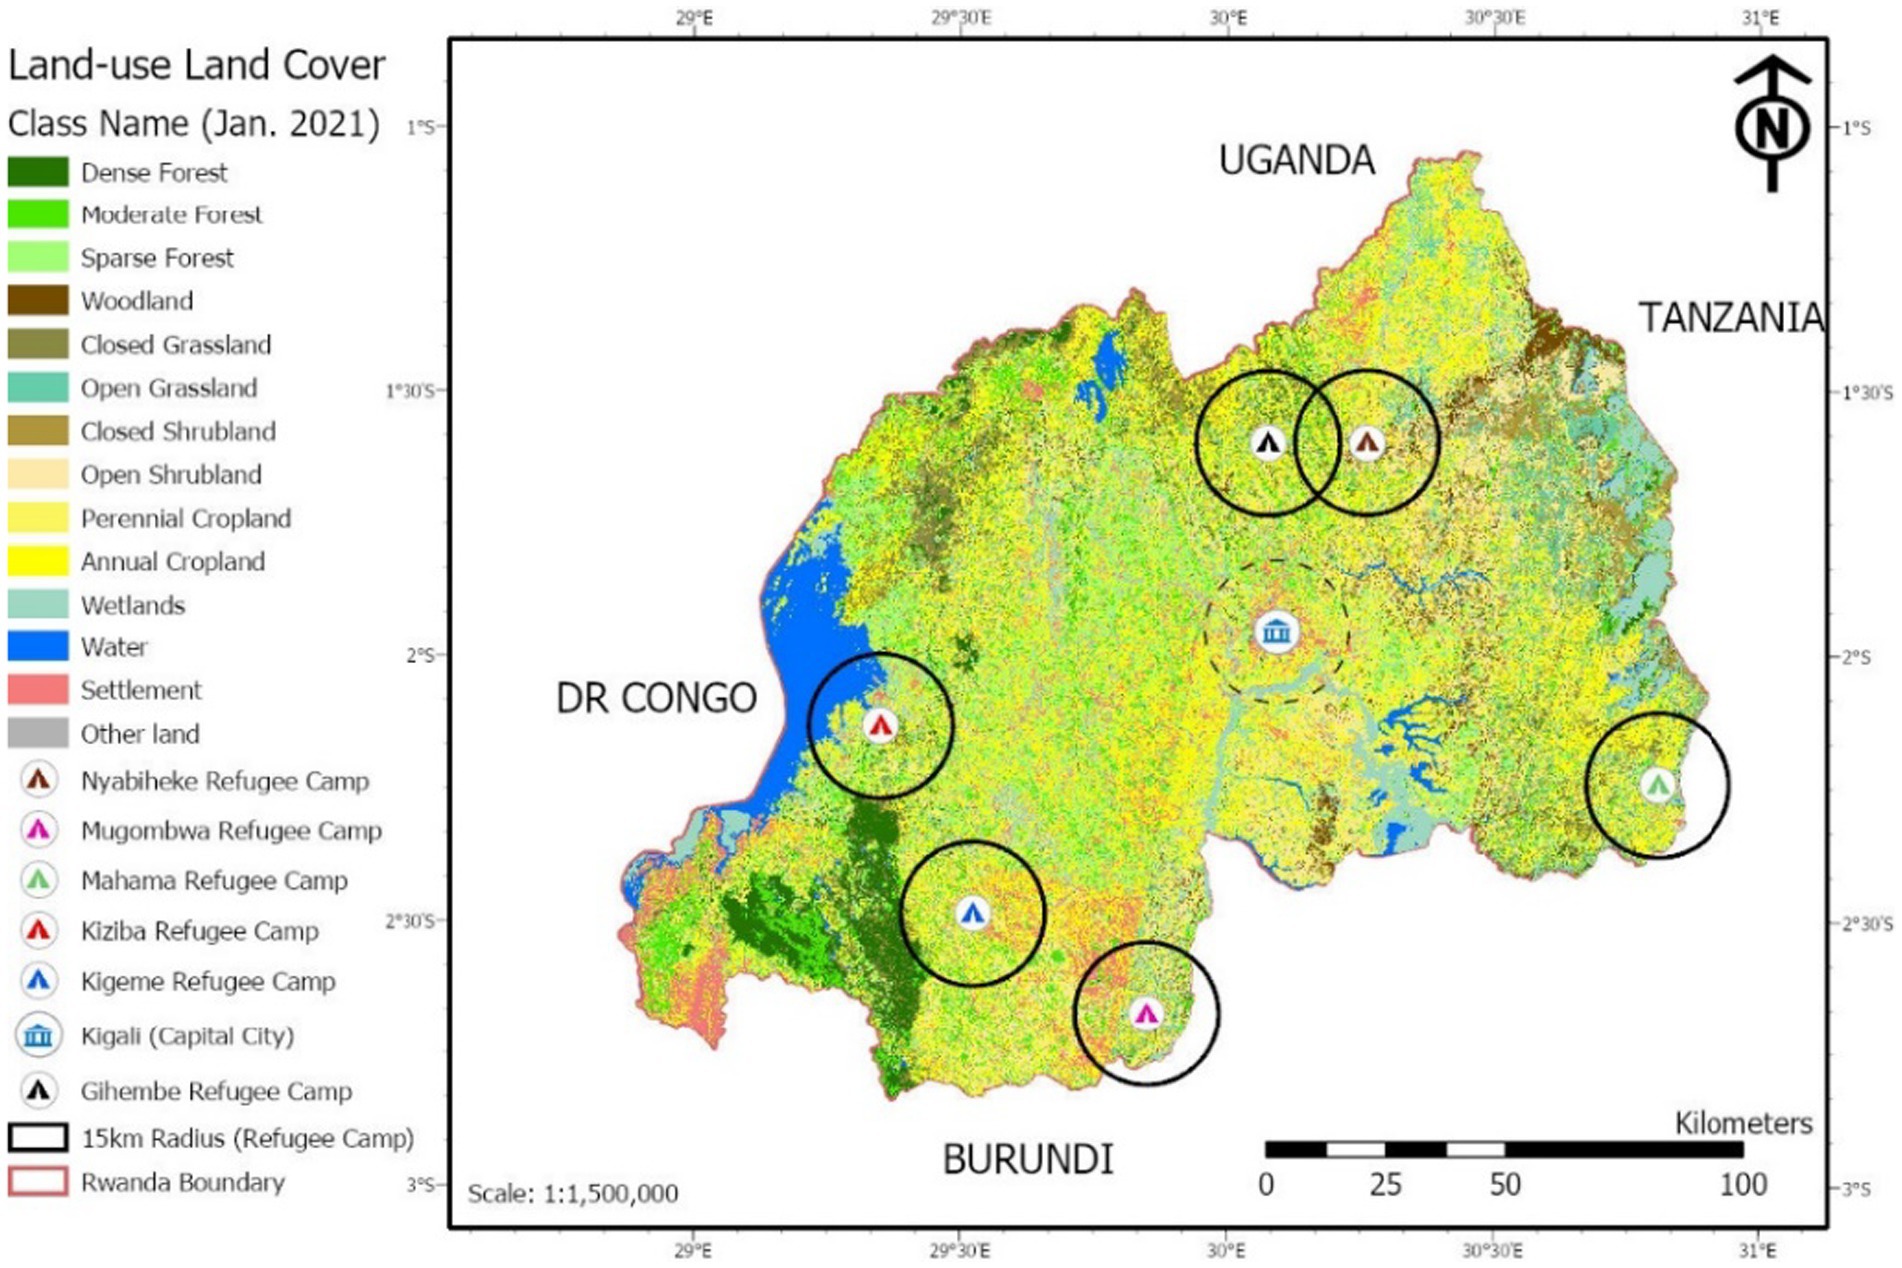
Figure 3. Land cover map of UNHCR Rwanda (2021). The map is created using a composite of Landsat 8 images captured in January and February 2020/2021. A composite was necessary due to cloud cover.
4 Methodology
4.1 Flood mapping
This study uses flood hazard mapping based on a spatial multi-criteria decision-making (MCDM) approach using applications of the analytical hierarchy process (AHP), geographic information system (GIS) techniques, and remote sensing algorithms. These methods have been widely applied and evaluated as quite useful in informing decision-making processes, specifically in limited or no-data regions in many developing countries (Rahmati et al., 2016). The spatial MCDM method assesses, evaluates, and integrates multiple layers to inform a flood risk modeling process (Feizizadeh and Blaschke, 2013). The spatial MCDM method is one of the most widely used data-driven statistical models for prediction science, including hazard mapping and risk assessment (Khosravi et al., 2019).
The AHP approach, one of the MCDM techniques, has the most widespread application for flood vulnerability assessment and risk mapping, according to a thorough review of 128 papers using different MCDM methods (Khosravi et al., 2019). The MCDM tool has been applied to numerous recent flood susceptibility studies around the world (Khosravi et al., 2019; Tang et al., 2018; De Brito et al., 2018; Ahmadisharaf et al., 2016; Rahmati et al., 2016). Similarly, Shadmehri Toosi et al. (2019) incorporated a hydrological model (SWAT) with the MCDM technique to generate comprehensive potential flood hazard maps for northeast Iran.
The AHP technique assigns weights to each input data layer, as suggested by Saaty (1980) (see also Al-Hanbali et al., 2011; Collins et al., 2001; Feizizadeh and Blaschke, 2013). The causal factor determines the relative importance of each map layer when compared to others (Bunruamkaew and Murayama, 2011; Dampha, 2020). In this study, each data type generates an input map layer included in the model as a contributing causal risk factor for assessing the overall biophysical and socio-economic vulnerability of Rwandans and refugees to fluvial and pluvial flood risks. The spatial MCDM model evaluates and harmonizes tradeoffs among various input factors in relation to their flood risk susceptibility scores and weights (Table 2). For example, high-altitude locations might be considered less flood-prone, all else constant. Studies confirm that “at higher elevations, an increase in rainfall can actually reduce the occurrence of flooding” (Nkwunonwo et al., 2020). However, the LULC composition (e.g., highly impervious surfaces) of the same elevation site with a flat terrain could expose the location to a higher flood risk level.
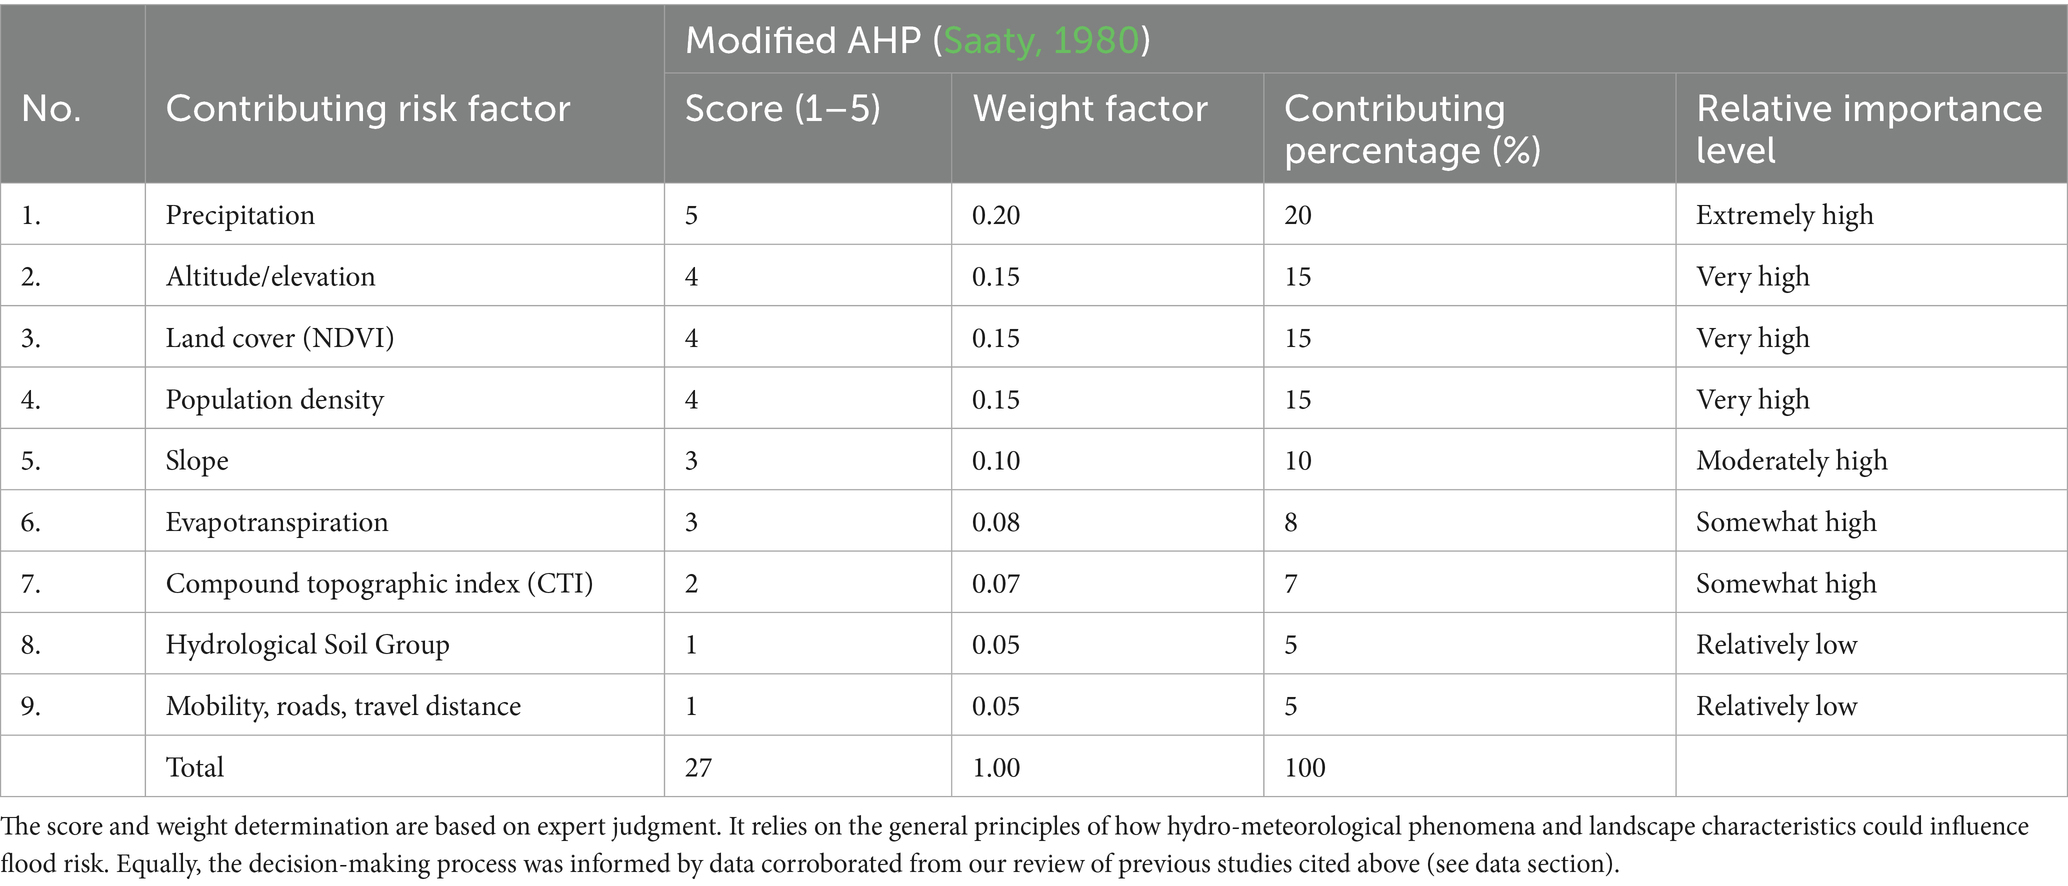
Table 2. Contributing risk factor weights used in ArcGIS pro’s weighted overlay method.
We map these contribution risk factors in Figure 4. After processing all input layers and assigning their corresponding weights, we used ArcGIS’s reclassify spatial analyst tool to categorize the raster values into five different classes, ranging from lowest (1) to highest (5) risk and vulnerability levels (Table 3). We used the natural breaks method in dividing the feature classes into their “natural groupings” using the ArcGIS Pro software. Evidence shows that the severity of each reclassified flood risk contributing factor should be based on the characteristics of the individual input feature (Tran et al., 2009). The more significant the layer’s contribution, the higher the assigned flood risk score and weight (Table 2). For instance, locations near rivers and stream networks were considered highly exposed as they are the most likely to be affected by fluvial flood events. Also, vegetated areas are likely less prone to a particular flood event than areas with a lot more impervious surfaces, especially when the infiltration rate is highest and stormflow (i.e., direct runoff) volume is at its lowest velocity. Similarly, locations with good road networks and less travel time distance are considered less vulnerable in an extreme flood event than places with difficulties in relocating residents.
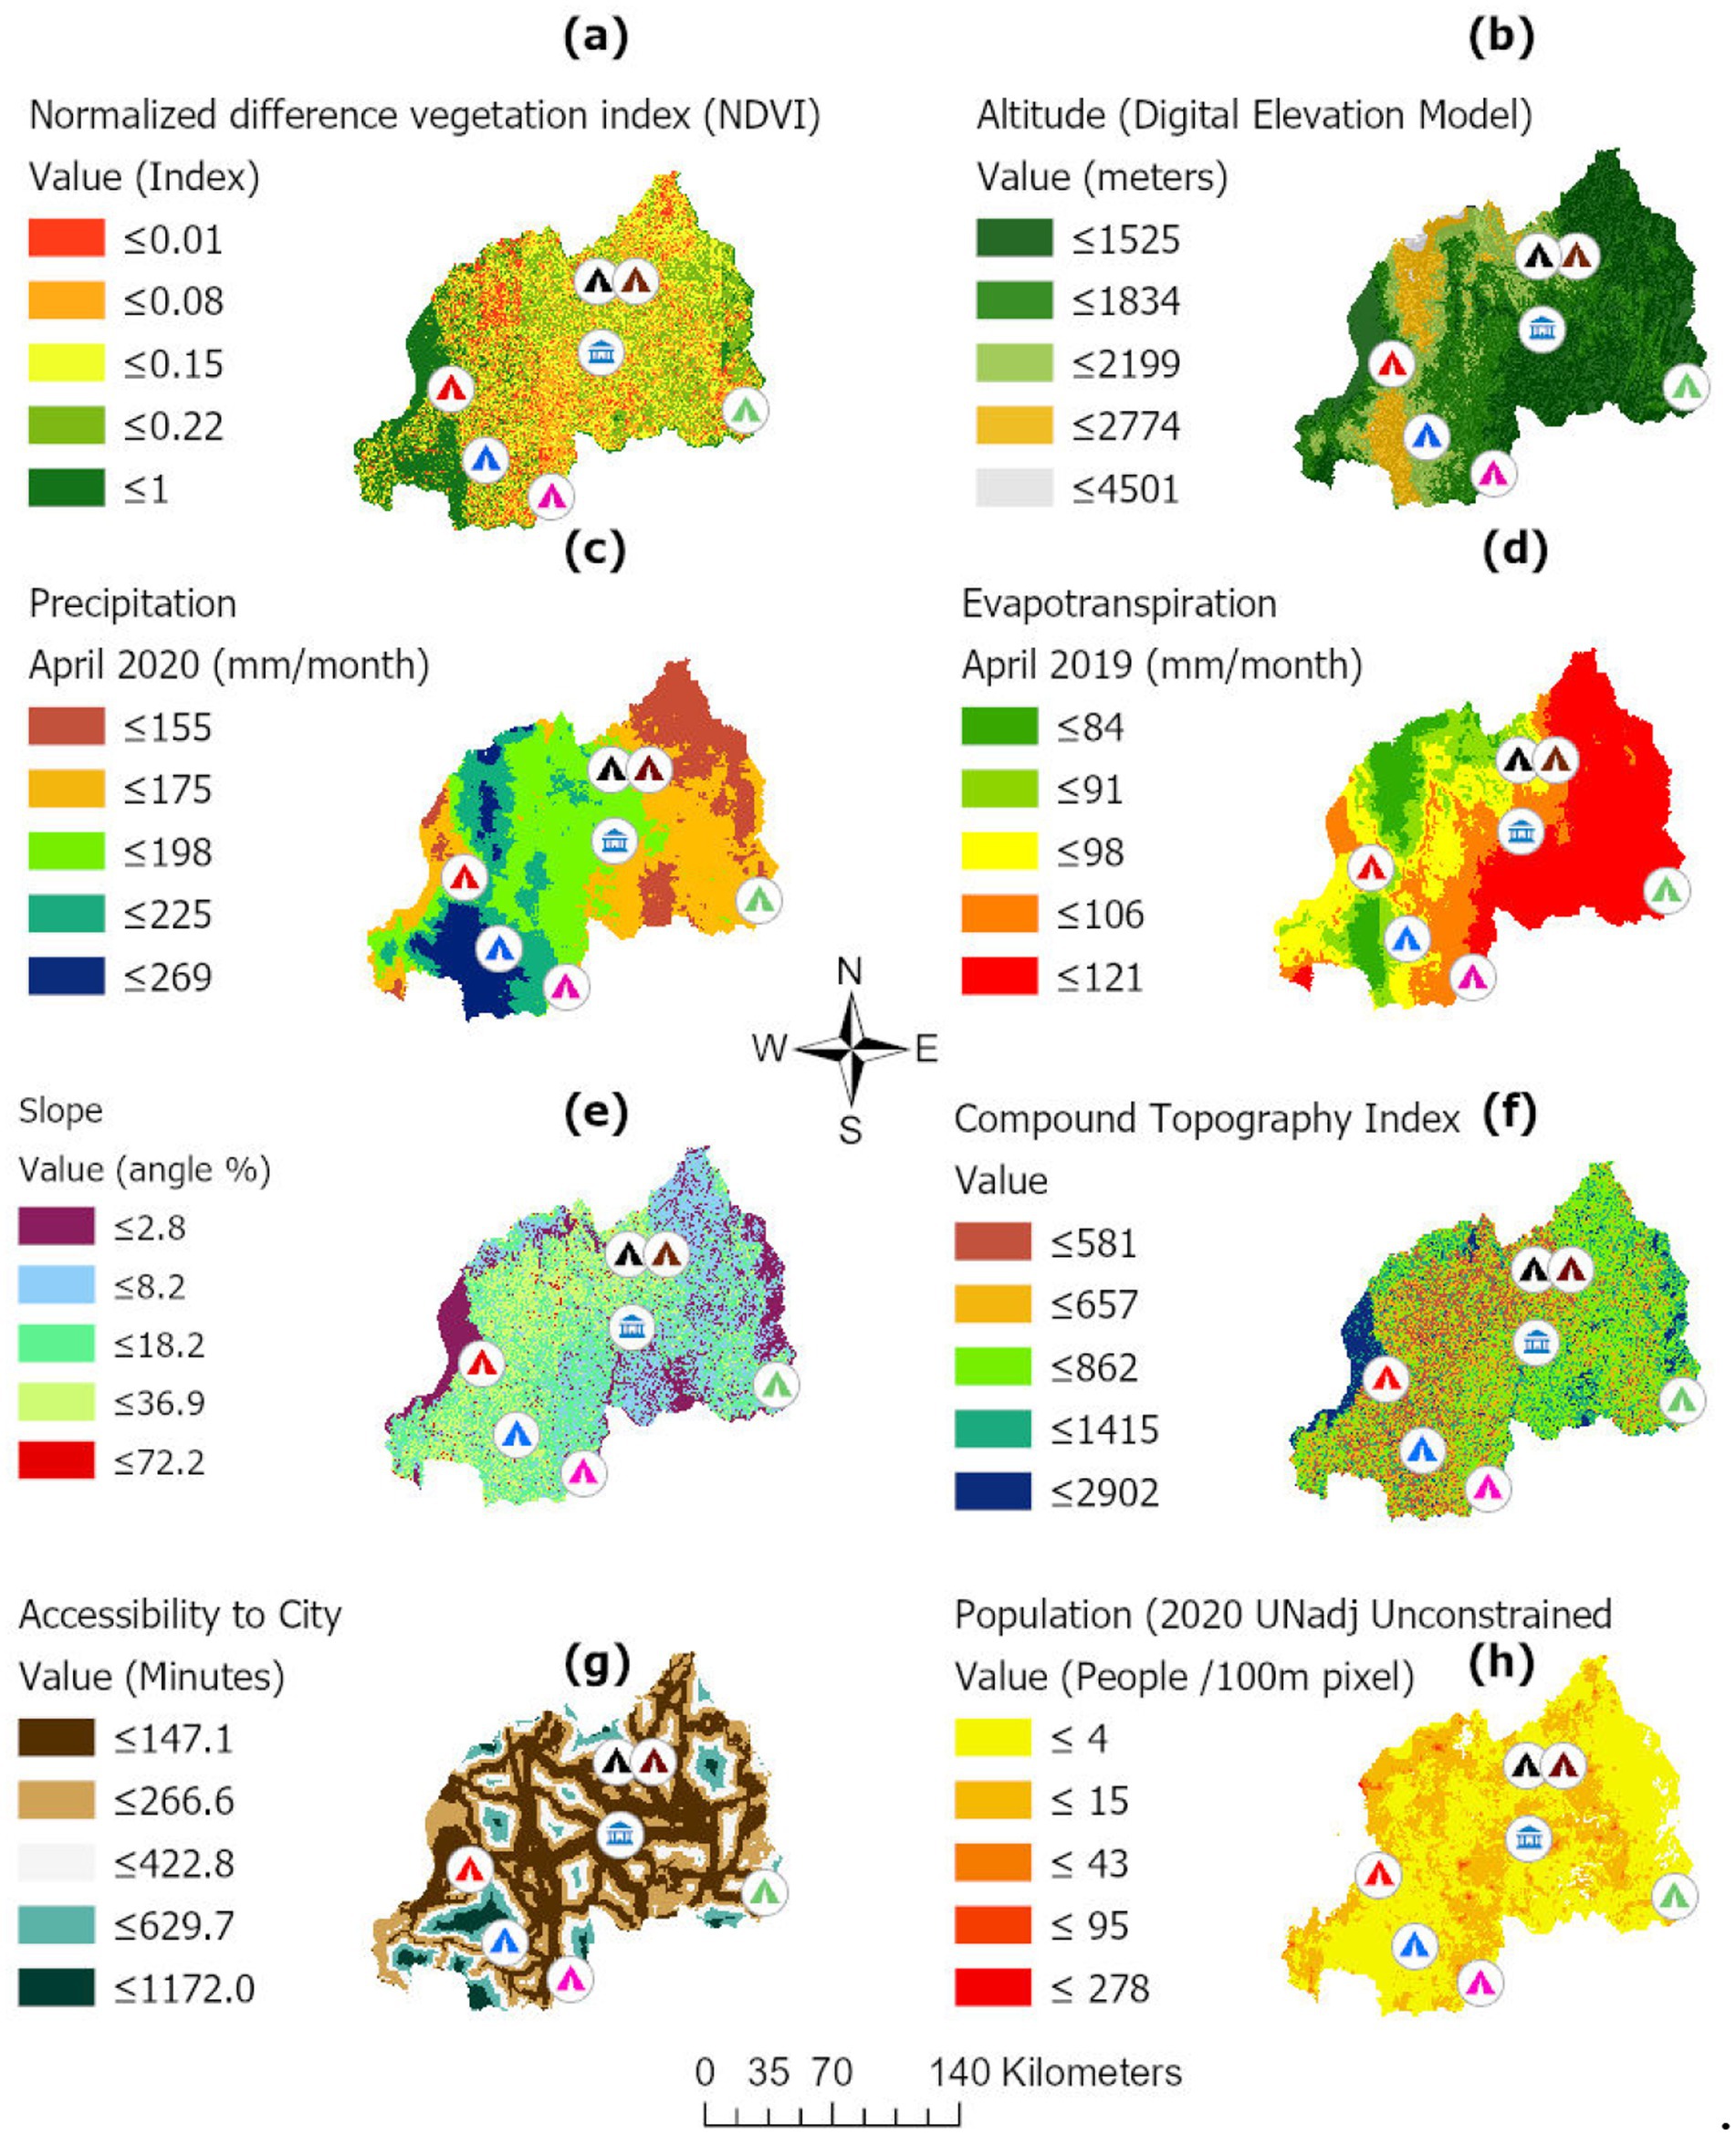
Figure 4. Flood risk conditioning factors for flood risk mapping in Rwanda. The different triangular colored shapes show the locations of refugee camps selected for this analysis. The subpanels display the spatial distribution of key variables used in the flood risk model: (a) Normalized Difference Vegetation Index (NDVI), (b) Altitude (Digital Elevation Model), (c) Precipitation for April 2020, (d) Evapotranspiration for April 2019, (e) Slope (angle in percent), (f) Compound Topography Index (CTI), (g) Accessibility to City (travel time in minutes), and (h) Population density based on the 2020 UN-adjusted dataset (people per 100-meter pixel). These biophysical and socio-economic variables were integrated using a spatial multi-criteria decision-making approach to assess flood exposure and vulnerability in refugee-hosting areas across Rwanda.
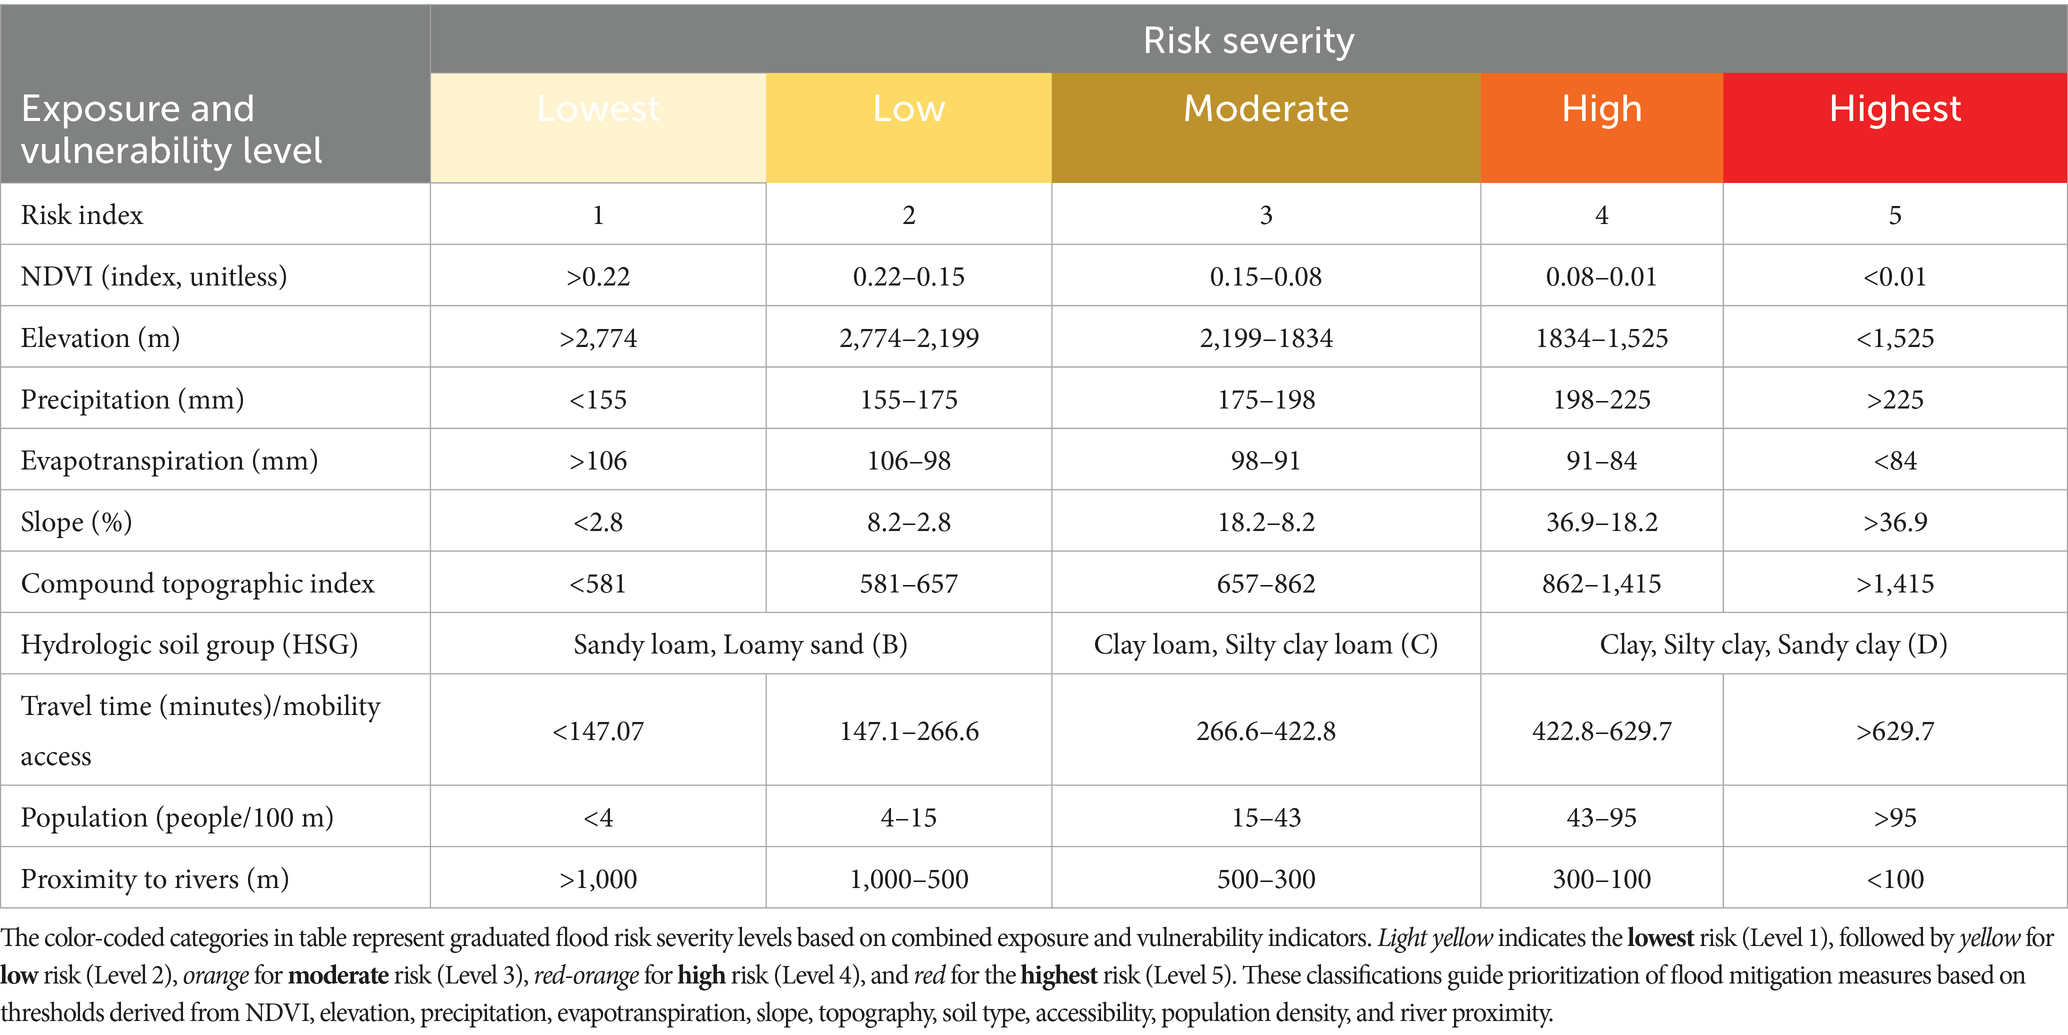
Table 3. Flood risk severity and vulnerability levels of major flood risk conditioning factors.
The flood risk map generated from the spatial MCDM modeling approach is an aggregated overlay of weighted cells representing all reclassified input map layers. The weighted overlay tool in ArcGIS Pro was used for running the final analysis. The flood risk mapping is mathematically defined as:
In the above equation, is the risk composite score, is the weight assigned to the factor i, is the score of factor i, is a multiplicative sum of the constraints, and represents constraint j score (0 or 1). For a pixel area, if the constraint factor is zero (meaning not at risk), the composite risk score of that area becomes zero, resulting in the exclusion of the site from the analysis.
4.2 Landslide mapping
Landslides are one of the deadliest types of natural hazard event that occurs in Rwanda. Nsengiyumva et al. (2018) conducted a nationwide landslide susceptibility assessment in Rwanda (Figure 5). Similar to our flood modeling approach, they applied the Spatial Multi-Criteria Evaluation Model (SMCE) using eight input map layers identified as causal factors of landslide occurrences. These include slope, distance to roads, lithology, precipitation, soil texture, soil depth, altitude, and land cover (Nsengiyumva et al., 2018). Landslide incidences are primarily attributed to extreme and intense precipitation events (Ministry in charge of Emergency Management (MINEMA), 2019; Nsengiyumva et al., 2018). Landslide incidences in Rwanda are most frequent during the two wet rainy seasons (March to May) and (October to December). Nsengiyumva et al. (2018) landslide modeling results were validated by 980 past landslide-affected locations based on Rwanda’s Ministry in Charge of Emergency Management (MINEMA) data. Similar studies have supported using the causal factors included in Nsengiyumva et al. (2018) landslide susceptibility assessment (Duc, 2013; Tegeje, 2017; Kato and Mutonyi, 2011; NASA Earth Observatory, 2010; Uwihirwe et al., 2020). For example, similar studies attributed severe landslide events in Uganda (2010) and Vietnam (2005) to extreme precipitation hazards (Duc, 2013; Kato and Mutonyi, 2011; NASA Earth Observatory, 2010).
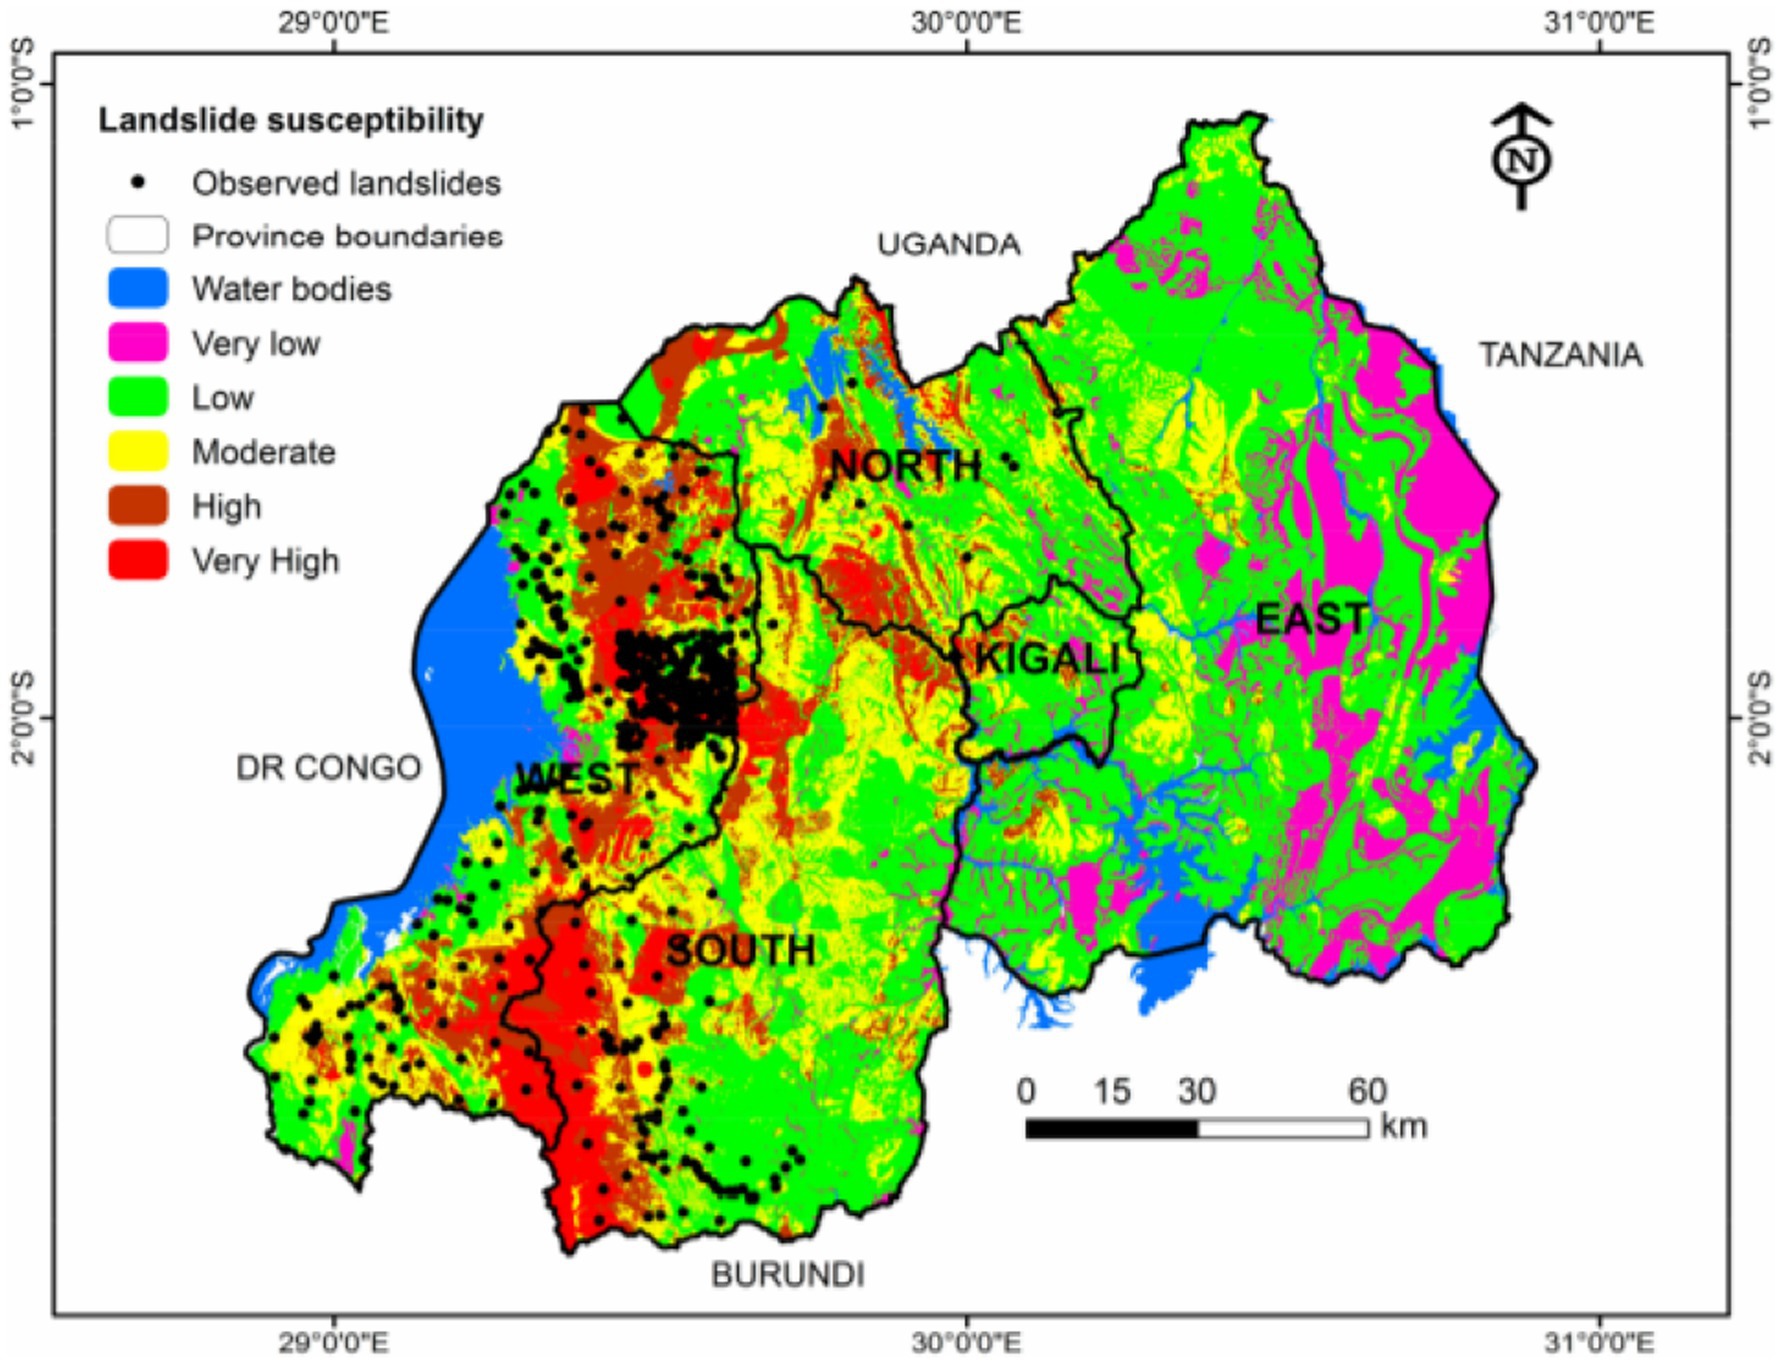
Figure 5. Landslide risk mapping with observed landslide events.
To avoid duplication of research efforts, we used the landslide susceptibility map from Nsengiyumva et al. (2018) to inform our target refugee-hosting districts’ exposure and vulnerability to landslide hazards. In addition we compiled the most recent MINEMA records of past landslide-reported disasters from 2013 to 2021 for all refugee-hosting districts in Rwanda. Using these data, we evaluate the effects of landslide incidences on the loss of lives, destruction of livelihood sources, and damage to private properties and public infrastructure in refugee-hosting districts.
4.3 Disaster impact mapping
Using disaster panel data from Rwanda’s Ministry in Charge of Emergency Management (MINEMA), we conducted a district-level risk mapping of recorded disaster impacts from 2016 to 2020, mainly validating our modeling results. The mapping is based on the assessed losses of human lives, injuries, destruction to private properties and public infrastructure, and damage to people’s livelihood options. The disaster impact mapping focuses more on refugee-hosting districts using protracted time-series data from 2013 to 2021 (Table A1). The 2016–2020 dataset was later imported into the ArcGIS pro software for additional analysis (i.e., from vectorization, rasterization, reclassification, weighted aggregation to map visualization). The combined disaster risk map is weighted because the impacts of disaster types cannot be considered equal. For example, a disaster impact resulting in loss of human lives was weighted higher than impacts leading to damage to public infrastructure such as schools, markets, etc.
4.4 Soil erosion mapping
We use a widely applied spatially explicit model, the Integrated Valuation of Ecosystem Services and Tradeoffs (InVEST) Sediment Delivery Ratio (SDR) or Sediment Rentention, to map out soil erosion dynamics in Rwanda (Figure 6). Developed by the Natural Capital Project, the model assesses soil erosion impacts in our study area (Sharp et al., 2020). As applied in this study, the InVEST SDR model offers relevant information about soil erosion, sediment export, sediment deposit, and potential sediment retention. For the purpose of this analysis, our results focuses on soil erosion effects at watersheds scale (30 meter spatial resolution) with a particular focus on camps areas – i.e., within a 15 km radius from the centroid of the refugee camps. A 30-meter resolution provides a balance between detail and computational efficiency. This resolution captures fine-scale changes in terrain, vegetation, and land cover, relevant for detecting erosion hotspots, crucial for targeted erosion control measures. We ran the InVEST SDR based on the same parameters used in Bagstad et al. (2020) study of accessing Rwanda’s ecosystem accounts (Table A2). The methodological details of these models can be accessed here (Sharp et al., 2020).
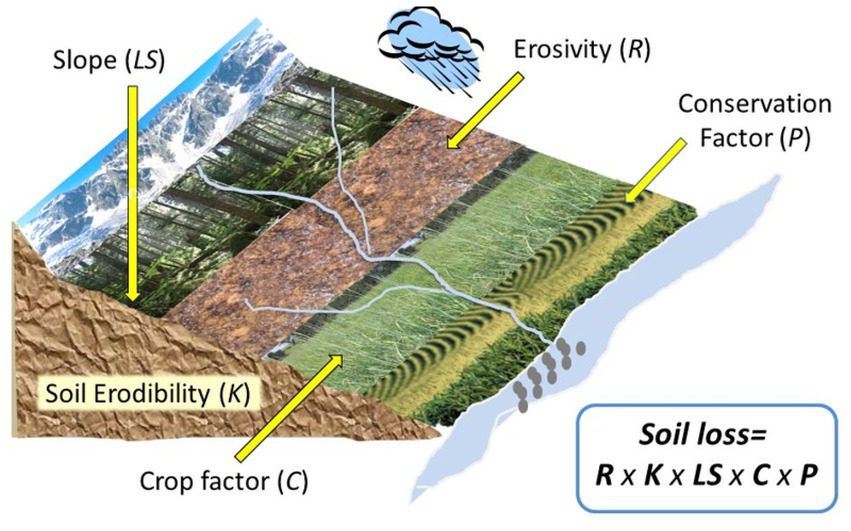
Figure 6. Illustration of in InVEST sediment delivery ratio (SDR) model (Sharp et al., 2020).
The InVEST SDR model’s soil erosion as illustrated in Figure 6 is centered around estimating soil loss due to rainfall and runoff using the Revised Universal Soil Loss Equation (RUSLE). The model calculates annual soil loss for each pixel within the study area by considering factors such as rainfall intensity (R Factor), soil susceptibility to erosion (K Factor), topography (LS Factor), land cover (C Factor), and soil conservation practices (P Factor). These factors impact soil erosion dynamics, highlighting the interaction between land-use management choices and natural processes.
For instance, landscape conditions such as topography or terrain represent a crucial role in influencing erosion risk, represented by the LS Factor, which accounts for slope length and steepness. For example, steeper slopes or longer slopes tend to accelerate more soil loss, increasing the erosion potential. On the other hand, human management choices represented by the C and P factors account for the effects of vegetation cover and erosion control measures, respectively. A low C value, for example, indicates more vegetative protection, leading to lesser soil loss, while effective soil management practices reflected in a low p value help reduce erosion.
The model outputs a raster map showing the potential annual soil loss across the landscape, highlighting areas more vulnerable to severe erosion, with a zoom into refugee campus areas. These erosion hotspots as shown below provide valuable insights for conservation planning and land management practices through vegetation cover, contour farming, or other erosion control measures. This detailed pixel-based approach at 30-meters resolutions offers deeper analysis of localized erosion risks which could better inform targeted interventions in refugee camp surroundings. However, the model performs well in capturing overland erosion processes such as rill and inter-rill erosion and does not perform well for detecting gully erosion or streambank erosion.
4.5 Drought mapping
We also included the drought index data, based on the self-calibrating Palmer Drought Severity (scPDSI), which is globally available at a spatial resolution of 0.5 degrees. The dataset offers salient information on drought-prone locations, particularly among refugee-hosting districts. The scPDSI data used spans from 1901 to 2020, driven by the preliminary version of the CRU TS4.05 monthly climate dataset. The scPDSI is determined based on time series data on precipitation and evapotranspiration. It also incorporates parameters reflecting the characteristics of a location’s soil and surface (Barichivich et al., 2020; Van Der Schrier et al., 2013).
5 Risk analysis results
5.1 Flood risk assessment
In Rwanda, our study demonstrates high risks to various climate change impacts across encampment areas, though the type of risk varies (Table 4). The country’s current physical flood risk is relatively high. Approximately 18% of the country’s total land area falls under the ‘highest’ and ‘high’ flood-prone categories (Figure 7). Additionally, 64 percent of the national territory currently falls under areas classified as “moderate” flood zones (Figure 8). In urban areas like Kigali, the capital city, flood risk exposure is highly significant, due to the increased presence of impervious surfaces and relatively large human settlement areas within the city. The rising exposure of agricultural lands to flood risks in rural areas poses additional threats to household food security, especially for those engaged in subsistence agriculture.
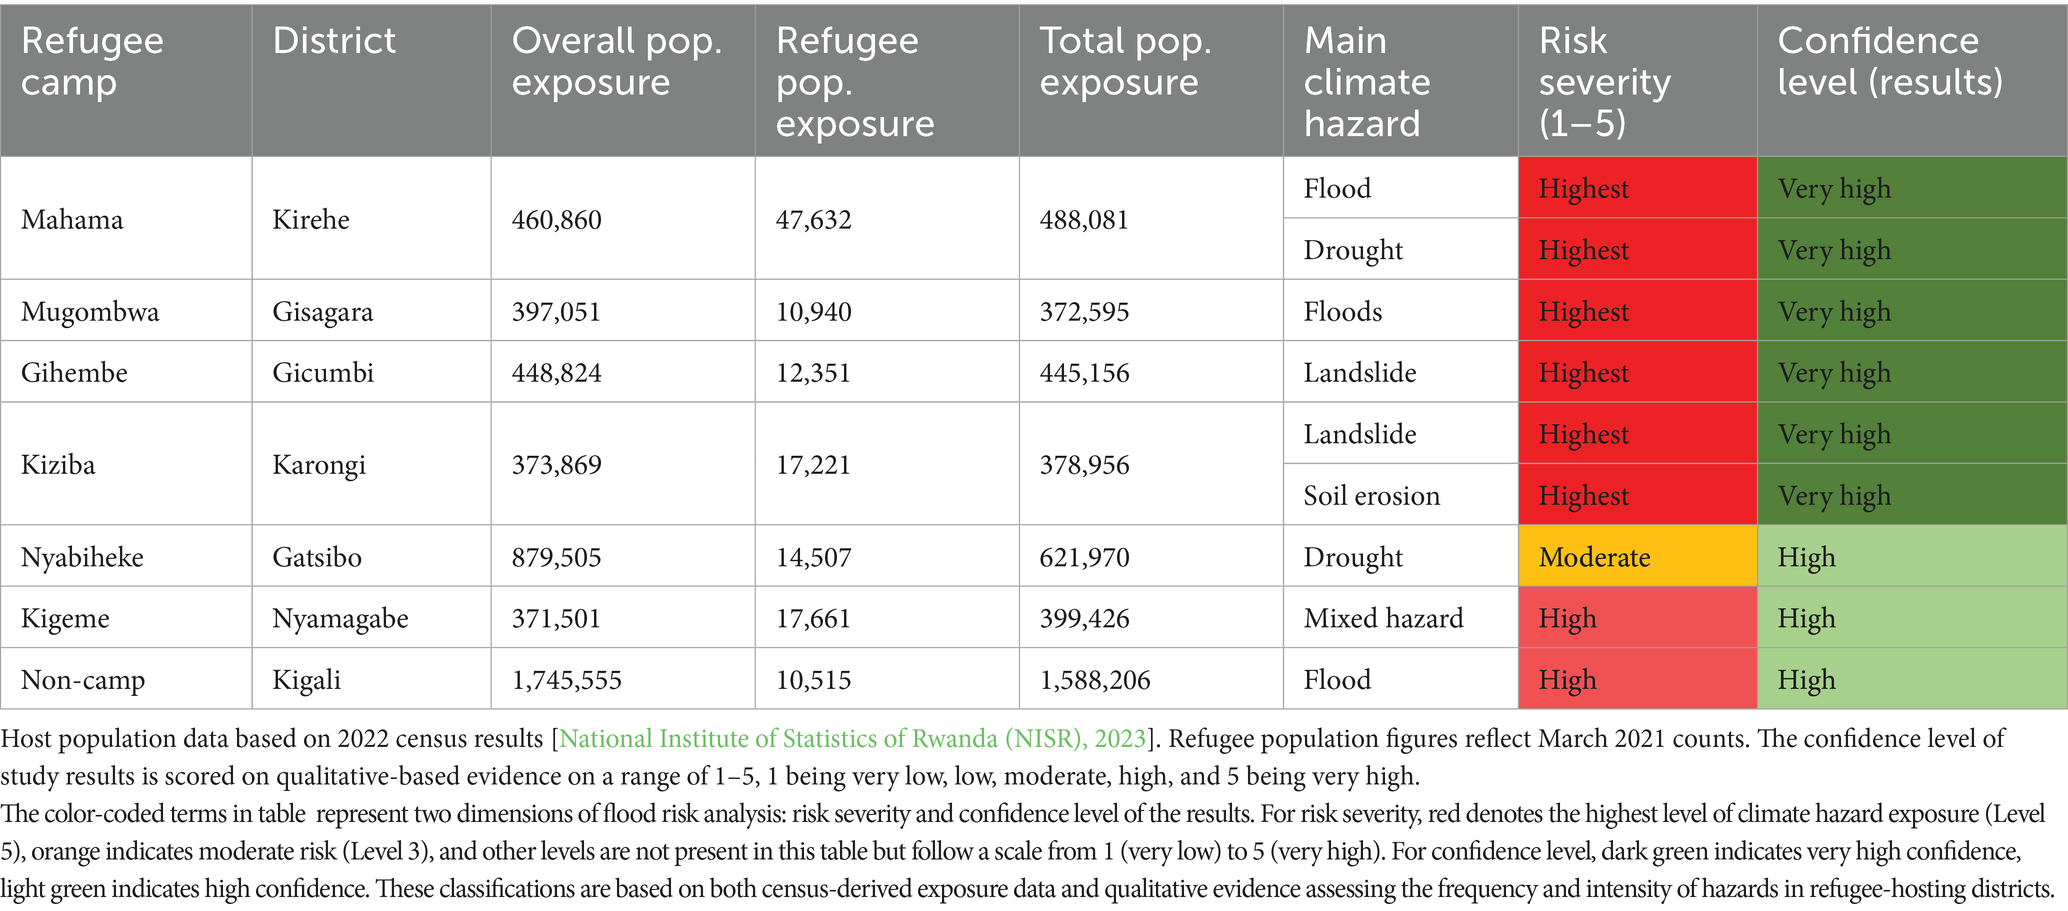
Table 4. Risk severity level of the leading climate hazards by refugee camps for all refugee-hosting districts in Rwanda.
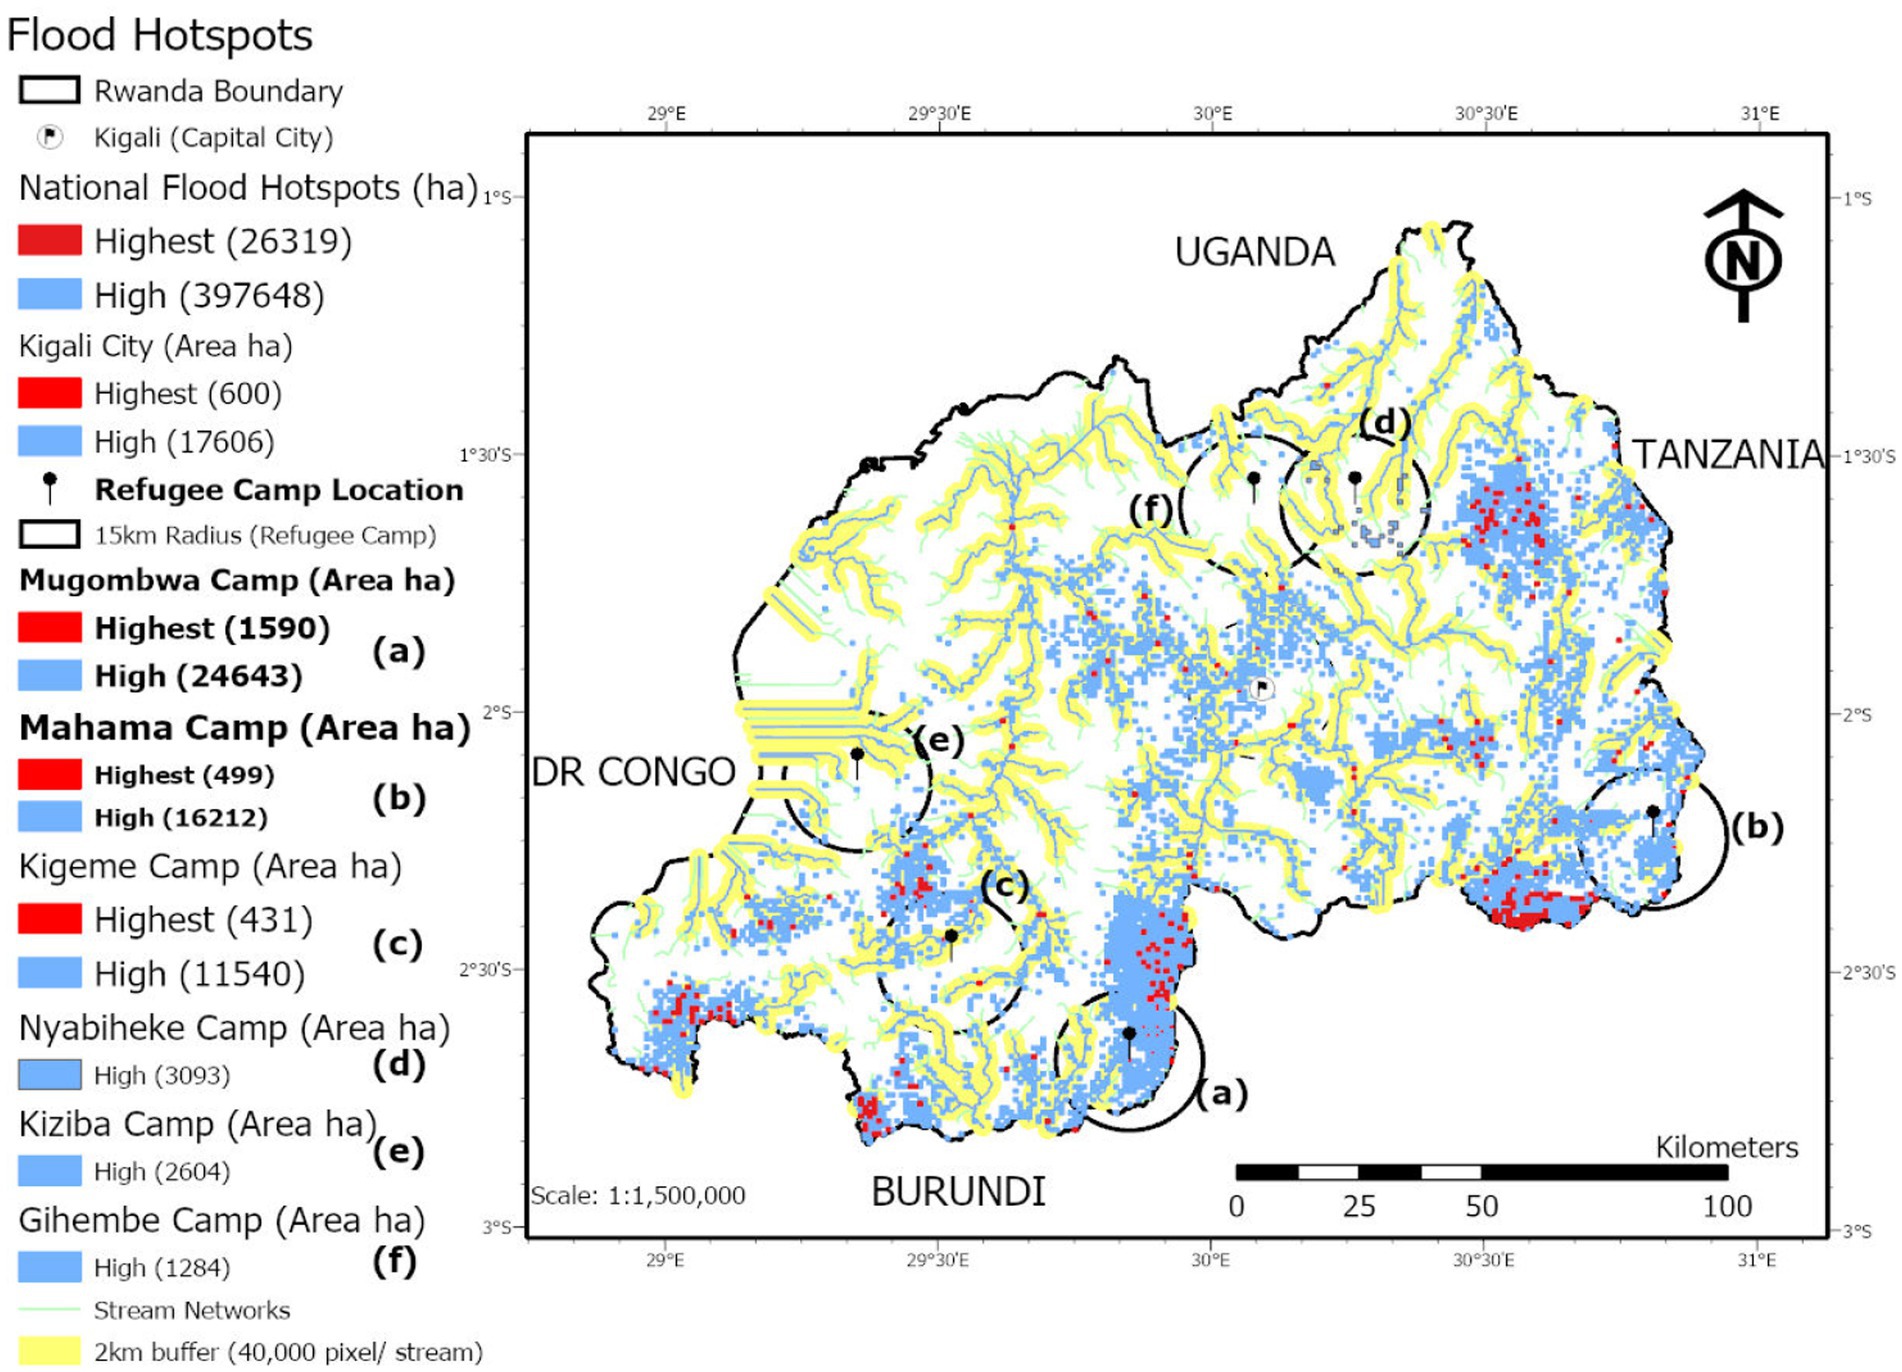
Figure 7. Flood risk zones showing the areas (ha) most vulnerable to pluvial and fluvial floods. The map above presents the national hotspots for flooding and highlights in (red and blue) the most susceptible areas to flood risk within the 15 km radius from the centroid of the selected refugee camps in Rwanda. The push pin (black) points to the exact location of the refugee camps. The alphabetical letters (a, b, c, d, e, f) show the specific camps’ names (Mugombwa, Mahama, Kigeme, Nyabiheke, Kiziba, and Gihembe). Gihembe camp is now officially closed. The camps are ordered in the legend in terms of the areal exposure extent to flood hazards. The Mugombwa and Mahama camps are highlighted as the two most vulnerable camps exposed to pluvial and fluvial flood hazards.
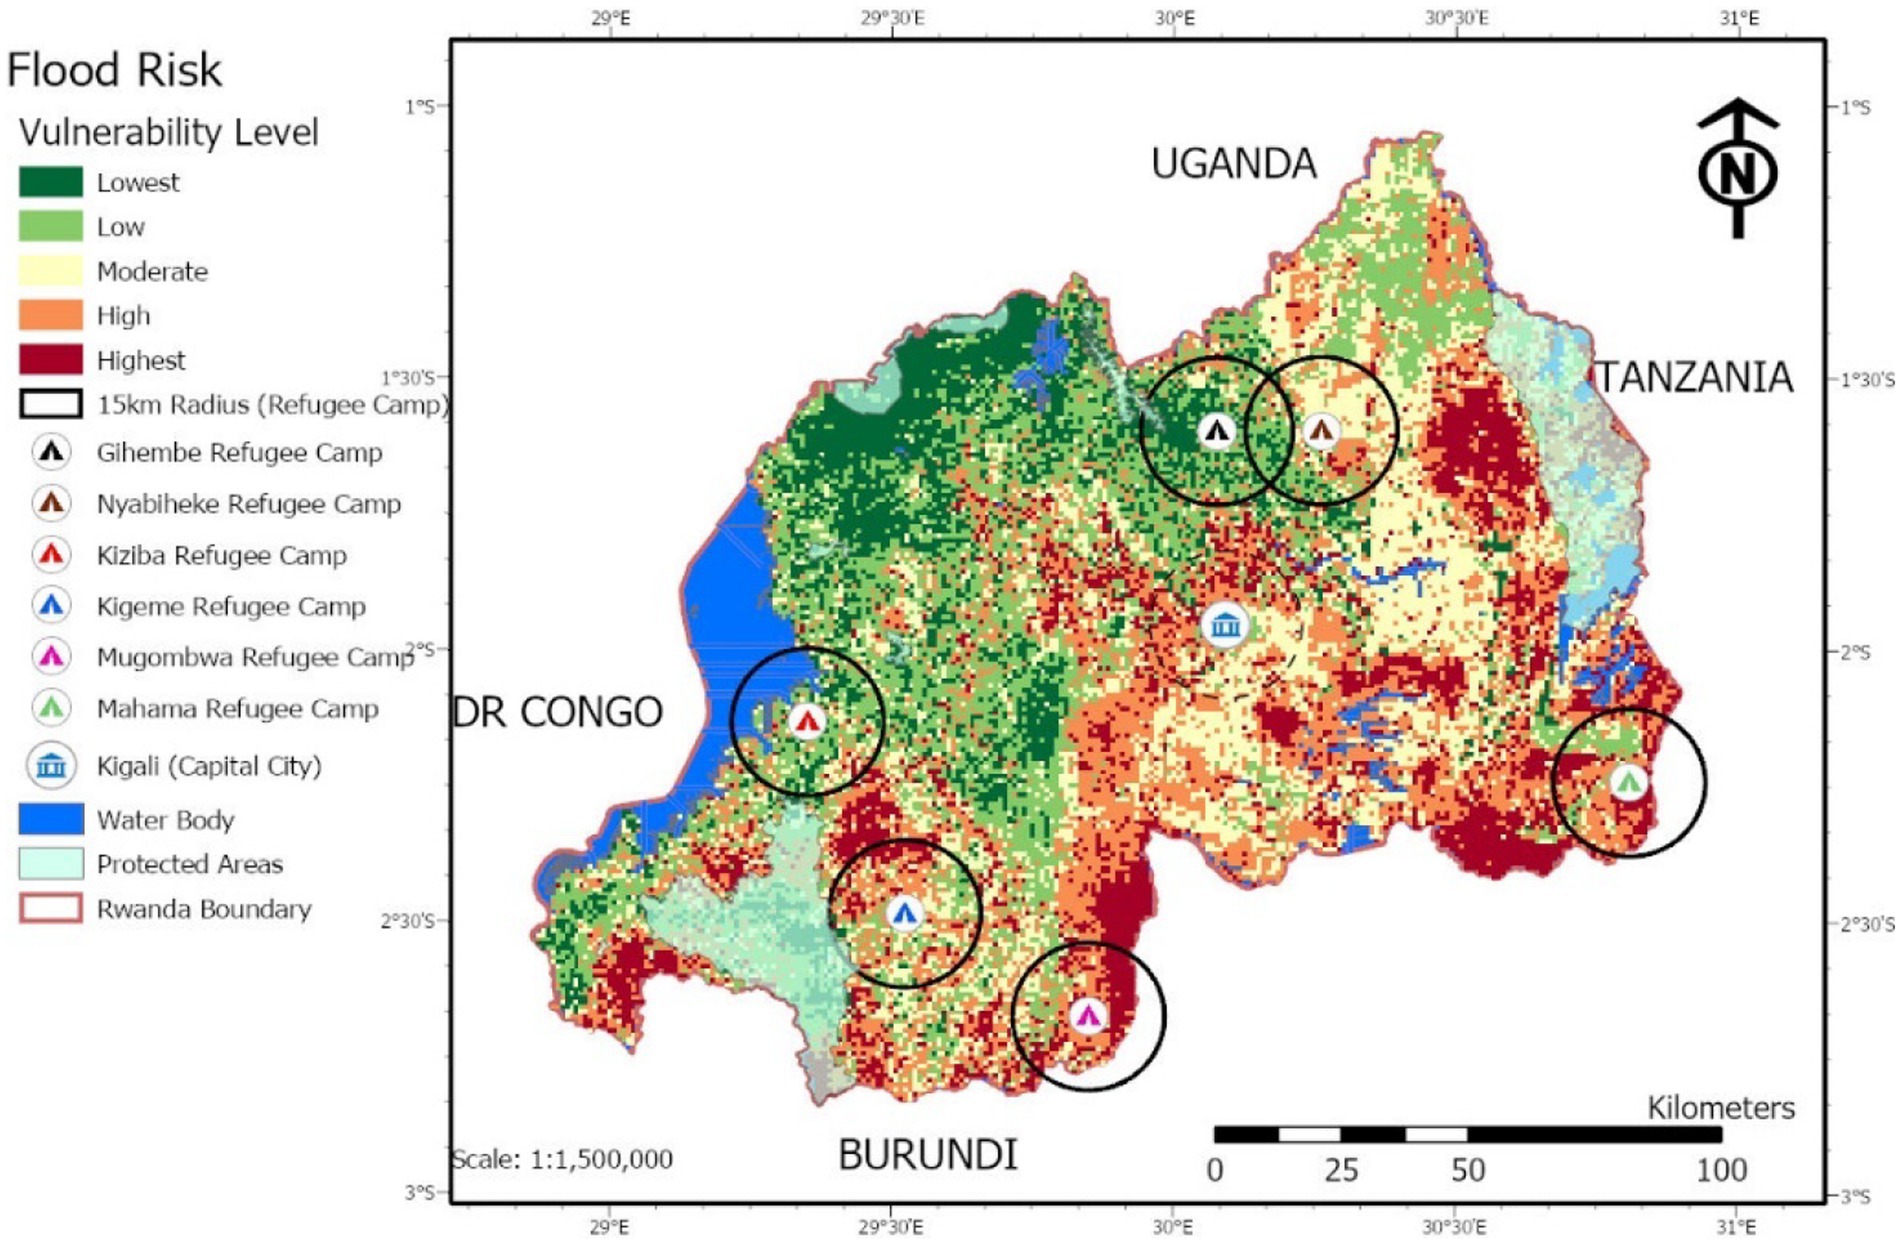
Figure 8. Landscape and population exposure to flood risk in Rwanda. This map represents only the biophysical vulnerability and population exposure to risk in Rwanda. It excludes socio-economic vulnerabilities to flood risk.
Physical flood risk levels are equally high in refugee-hosting districts and within a 15 km radius from the refugee camps’ centroid (Figure 9). Among these locations, Mugombwa and Mahama refugee camp areas exhibit the highest physical flood risk potential. In Mugombwa and Mahama, an estimated 26,234 ha (39%) and 16,711 ha (24%) of the landscape within the 15 km radius of camps’ centroids, respectively, are classified as ‘high’ flood-prone areas. Flood exposure levels for both refugees and host communities are also relatively higher in the Mugombwa refugee-hosting district than in the Mahama refugee camp locations. The next highest flood hotspot among all refugee-hosting sites is the Nyamagabe district, which houses the Kigeme refugee camp. Of the total land area (70,630 ha) within the 15 km radius from the Kigeme refugee camp’s centroid, 17% (approximately 11,971 hectares) is classified as high flood risk zones, affecting both settlements and cropland areas.
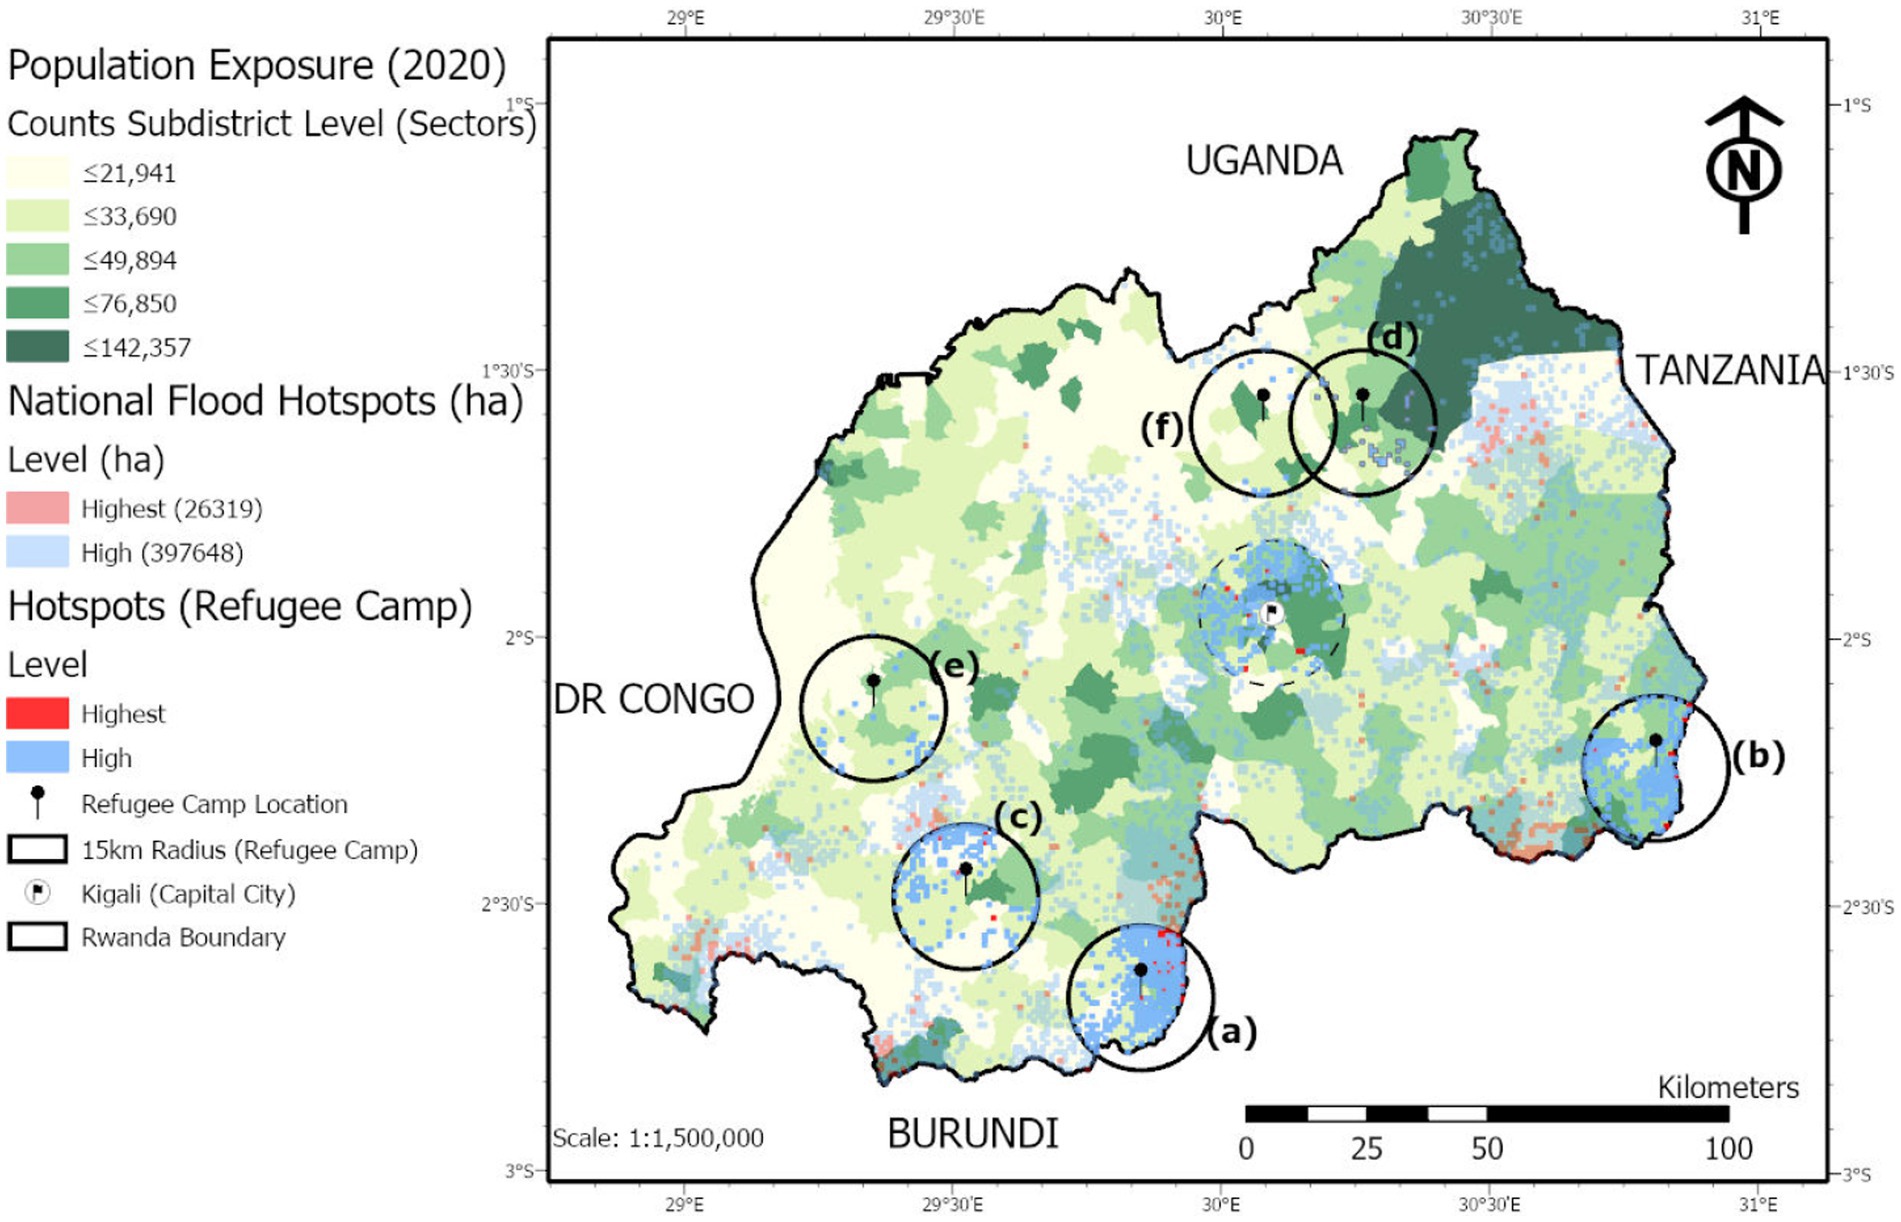
Figure 9. Population exposure to flood risk zones. The map presents the national hotspots for flooding. It highlights in (red and blue) the most vulnerable areas to flooding risk within the 15 km radius from the centroid of the selected refugee camps in Rwanda. The push pin (black) points to the exact location of the refugee camps. The alphabetical letters (a, b, c, d, e, f) show the specific camps’ names (Mugombwa, Mahama, Kigeme, Nyabiheke, Kiziba, and Gihembe).
5.2 Landslide risk assessment
Using the landslide risk mapping from Nsengiyumva et al. (2018) (Figure 10), we find that Rwanda’s western and northern regions are highly prone to landslide hazards compared to the eastern parts of the country. This past assessment suggests that landslide risk is highest in the Kigeme and Kiziba camp hosting areas. But the landslide risk predictions in Nsengiyumva et al. (2018) do not classify the Gihembe encampment area as facing high risk. Disaster damage data shows that landslides are additionally of high concern in this region. These contrasting findings highlight the potential shortcomings of risk prediction methodologies, demonstrating the importance of triangulating evidence whenever possible.
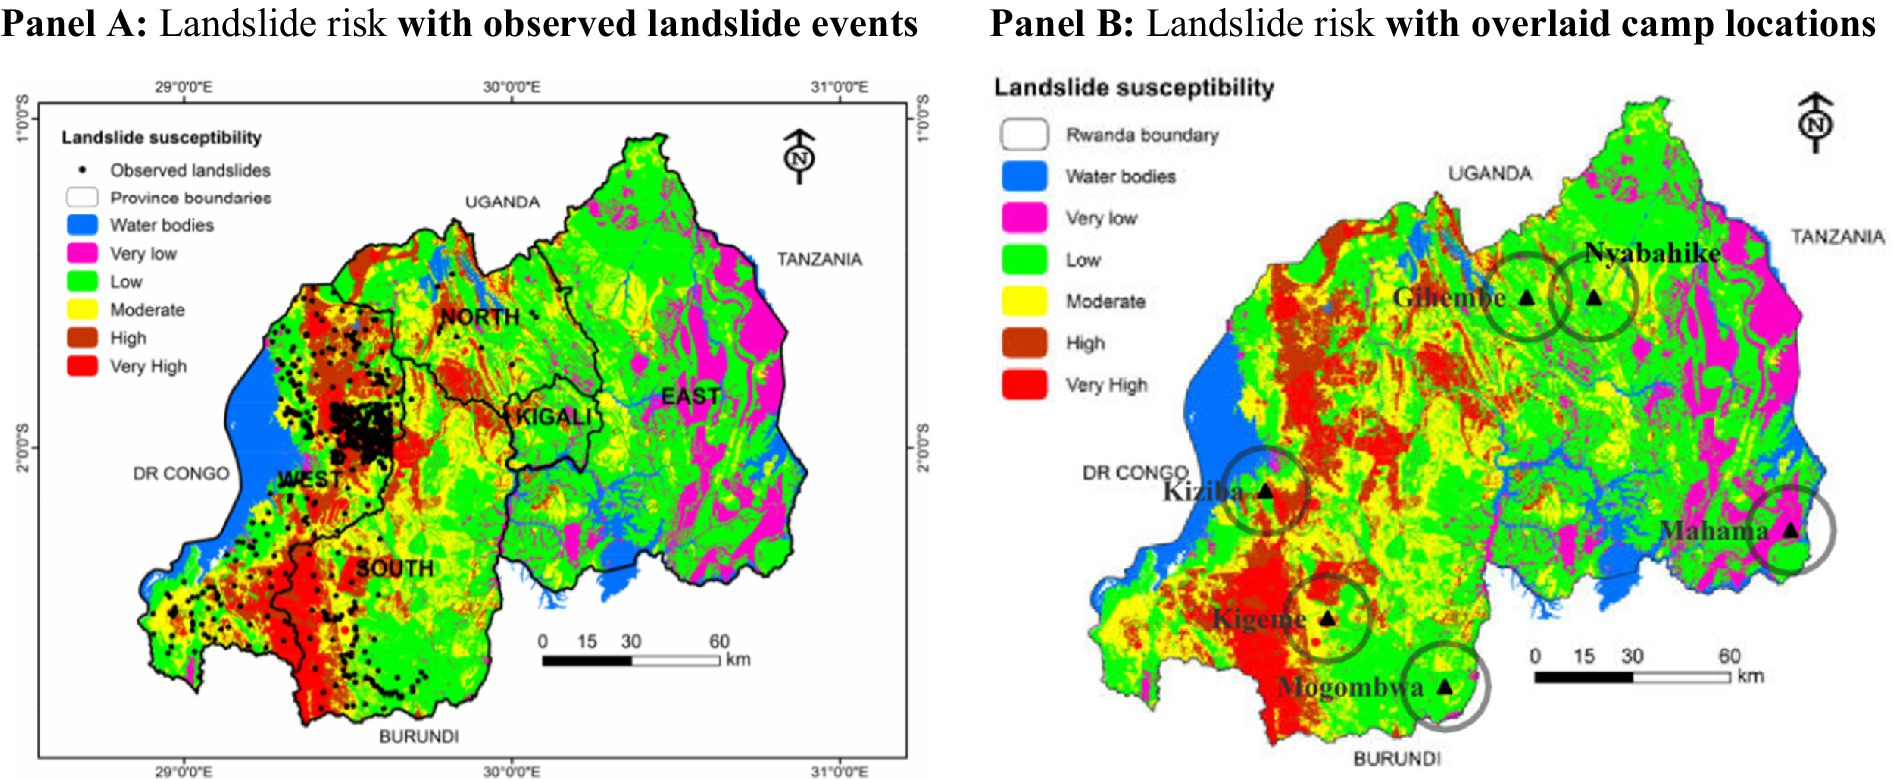
Figure 10. Landslide risk mapping with overlaid camp locations. Map from Nsengiyumva et al. (2018). (A) includes a set of past landslide observations. We georeferenced the image to add refugee camp locations to (B).
Figure 11 provides information on landslide related damages. Between 2013 and 2021, landslide disasters resulted in 28 deaths in the Kiziba refugee-hosting district (Karongi) and 11 deaths in the Gihembe refugee-hosting district (Gicumbi). Comparatively, refugee-hosting communities in the eastern and southern parts of the country, like Kirehe (Mahama refugee camp) and Gisagara (Mugombwa refugee camp), have recorded no deaths or casualties since 2013. Regarding damages to residential houses, landslide disaster impacts have either partially or completely destroyed 207 private properties and 23 public infrastructure facilties in the Kiziba refugee camp district between 2013 and 2021. Similarly, 85 private houses and 21 public infrastructure facilities were affected in the Gihembe refugee camp district. Moreover, landslides resulted in damages to croplands, undermining rural livelihood sustenance for both refugees and their host community members. For instance, in the Gihembe refugee-hosting district, 324 hectares of croplands and 104 units of livestock were damaged by or lost to landslides.
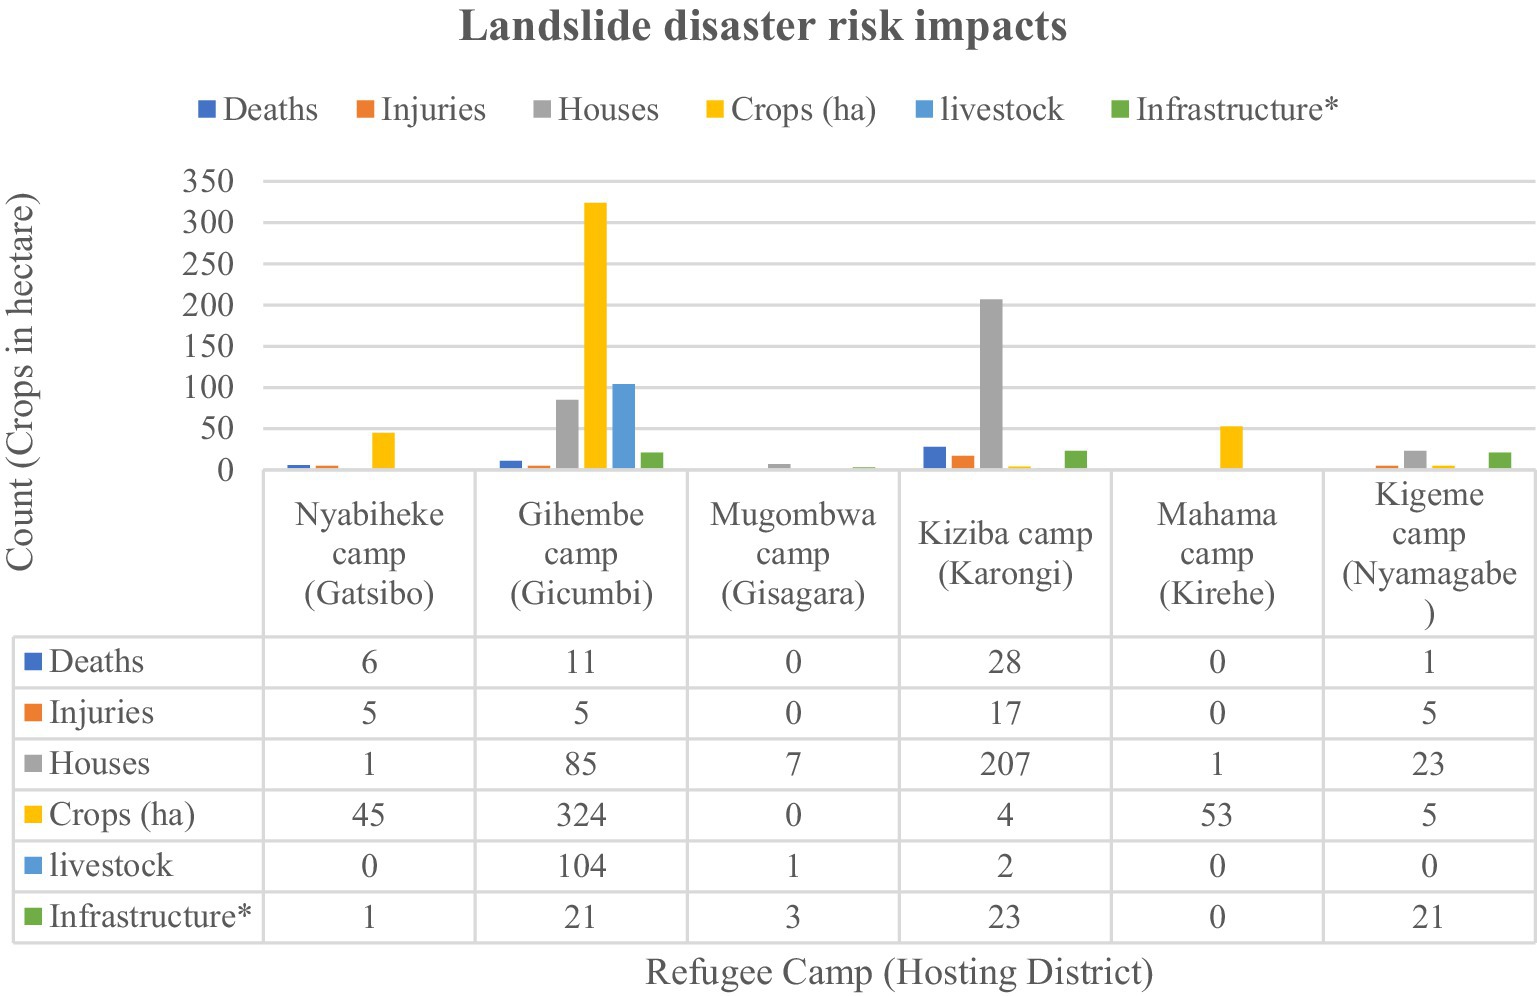
Figure 11. Recorded landslides effects on refugee-hosting districts from 2013 to 2021. Deaths and injuries refer to the total number of people reported to have died or were injured as direct results of landslides from 2013–2021. Effects on houses include homes damaged and destroyed within the assessment period. The livestock outcome accounts for the loss of cattle and other livestock. Landslides’ impacts on infrastructure* include classrooms, health centers, roads, churches, bridges, administrative offices, water supply infrastructure, transmission lines, markets, and factories. Crops damanges refers to areas of cropland that are reported to have been severely affected or destroyed. Because of its high exposure to natural hazards such as landslides, the Gihembe camp was officially closed in August 2021.
5.3 Disaster risk assessment
The recorded effects of climate-related disasters in Rwanda sharply increased in 2018 and 2019. The 2018 year exhibits very high disaster impacts on croplands (food security source), properties (houses) and human casualties (deaths and injuries) (Figure A1). Figure 12 maps the weighted recorded impacts of weather and climate-induced disasters by administrative districts in Rwanda from 2016 to 2020.
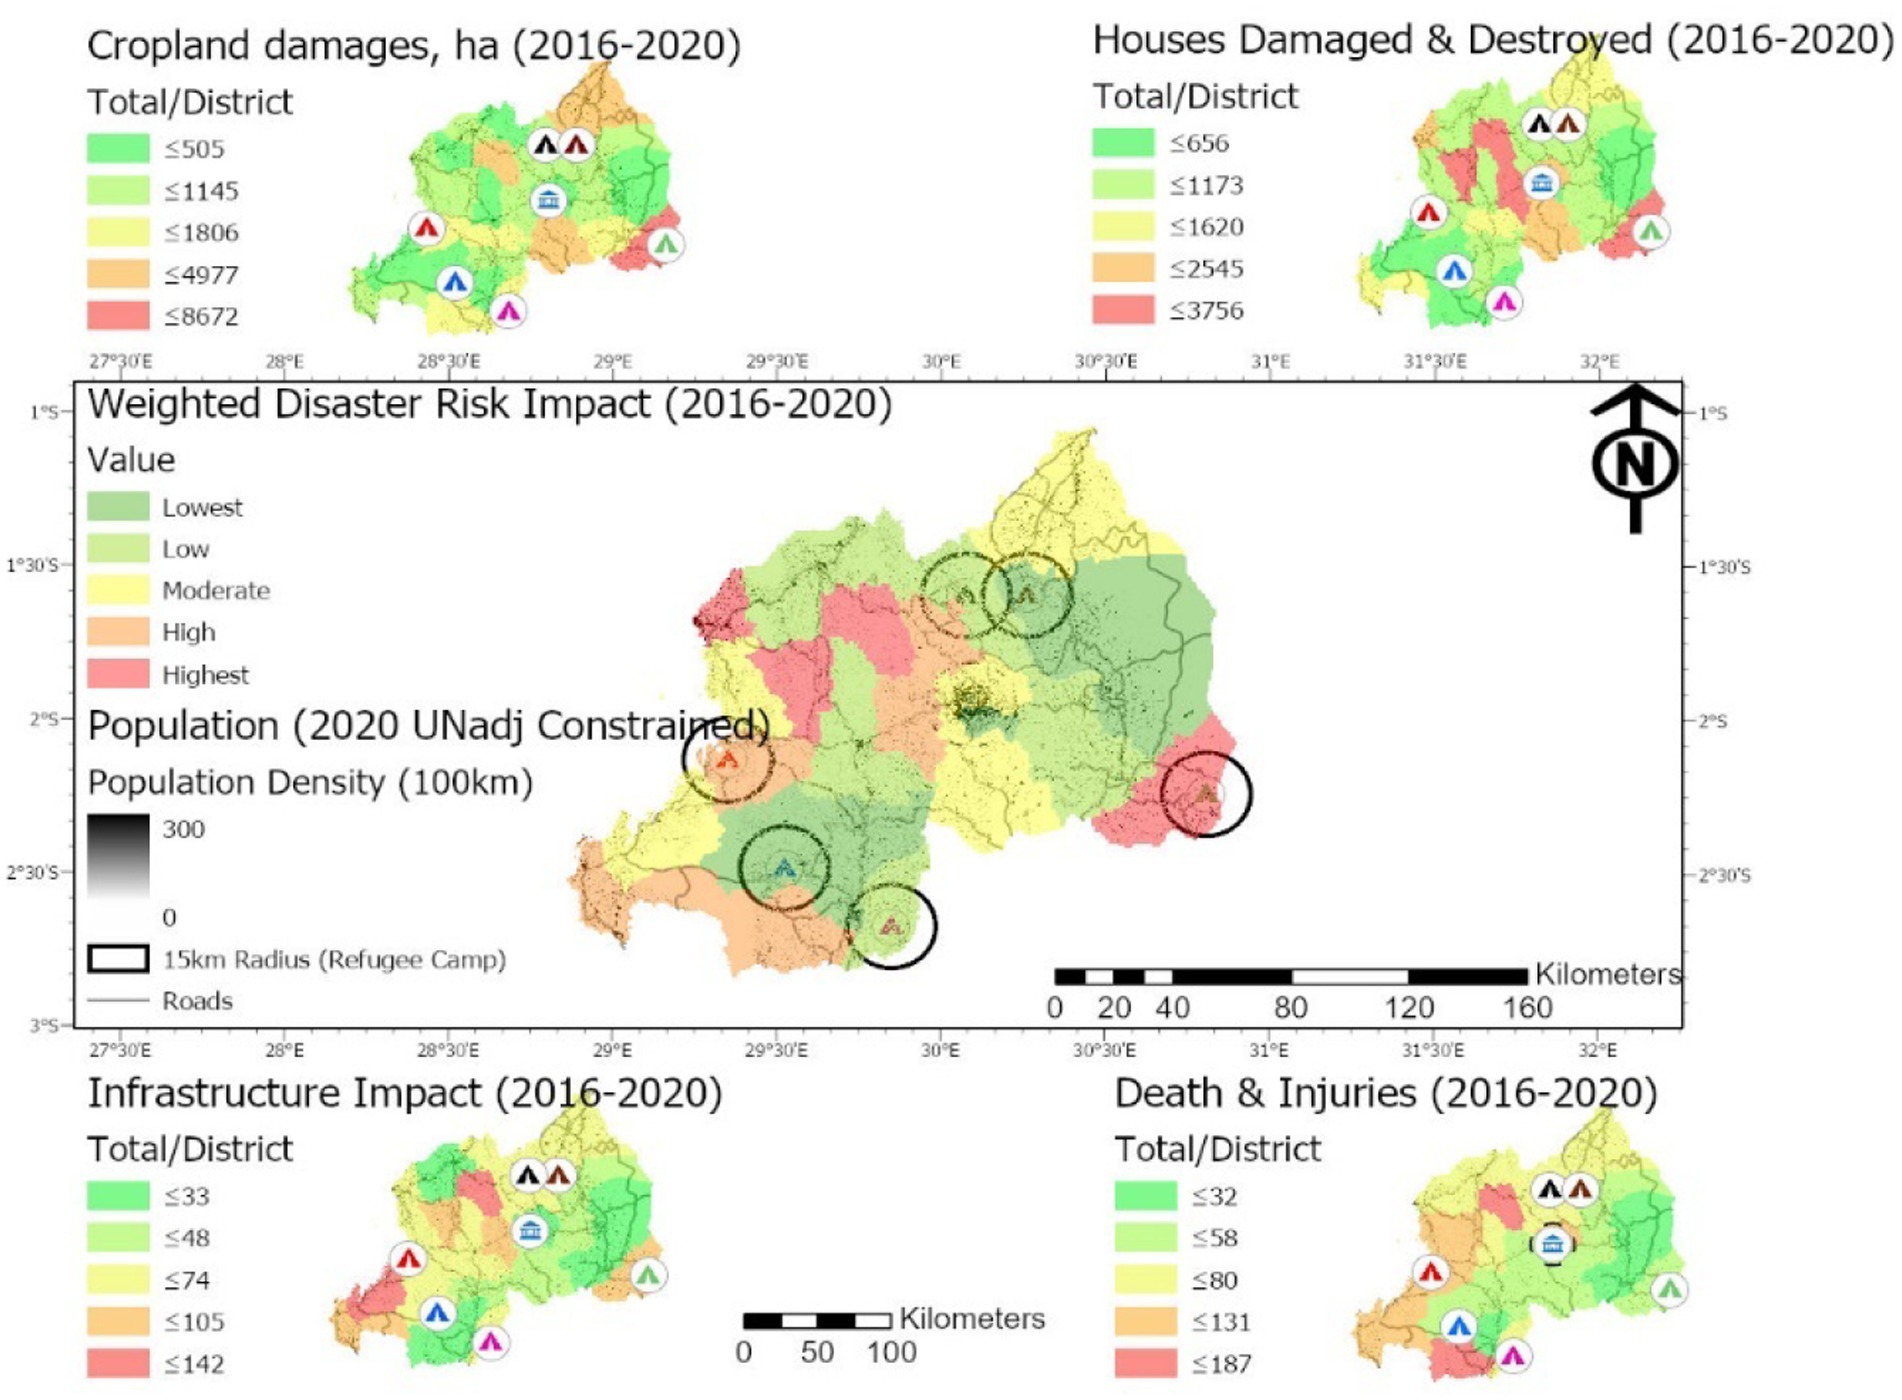
Figure 12. Extreme and climate-related disaster risk impacts based on recorded data from 2016 to 2020. Data source: Ministry of Disaster Management and Refugee Affairs (MIDIMAR) (2016, 2017) and Ministry in charge of Emergency Management (MINEMA) (2018a, 2018b, 2019, 2020). Note that some of the separate categories of disaster impacts as indicated in the reports are summed up here only for the purpose of this analysis.
The disaster impact results reveal that among all refugee-hosting districts that fall within a 15 km radius areas from the camp’s centroid, the Mahama camp area has experienced the most recorded damages. For instance, between 2013 and 2021, over 7,767 ha of croplands were damaged in this location. Additionally, 3,897 houses were damaged and destroyed within the 15 km buffer distance area around the Mahama refugee camp (Figure 13).
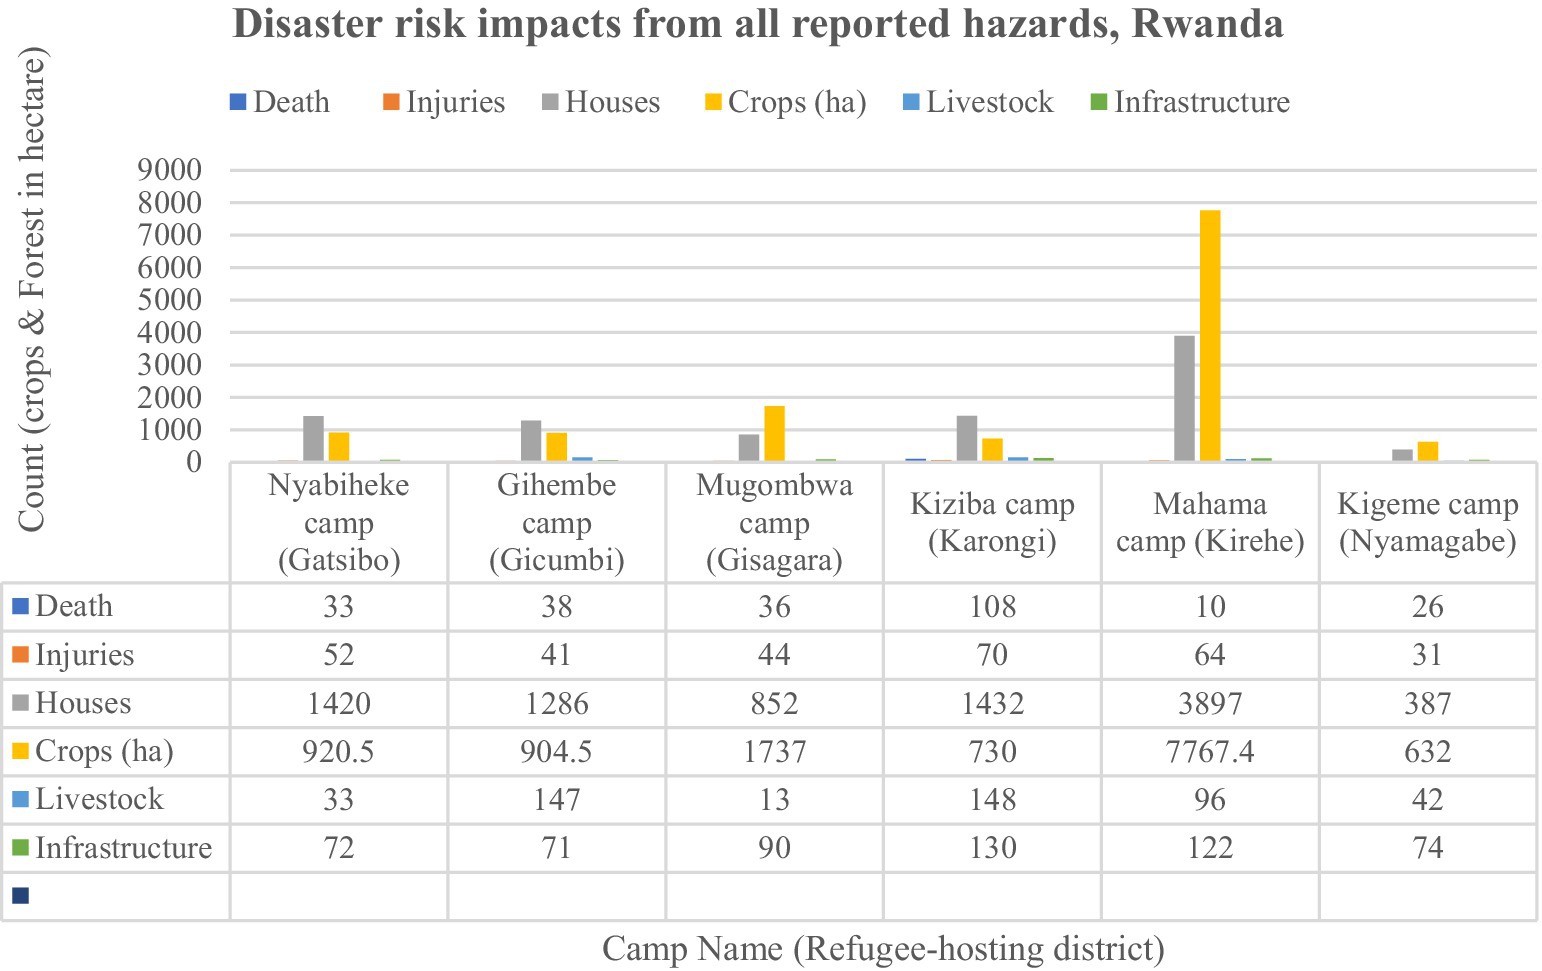
Figure 13. Recorded effects of weather and climate-induced disasters affecting refugee-hosting districts from 2013 to 2021. The weather and climate-related hazards causing these disaster impacts include landslides, floods, rainstorms, windstorms, earthquakes, hailstorms, fires, mines, and lightning.
To aggregate the data by hazards of interest to this study, we added the disaster risk impact findings from the following precipitation-related events (i.e., floods, rainstorms, and lightning) and landslides (as mentioned above) for only refugee-hosting disasters. First, on precipitation-related hazards such as pluvial flooding, rainstorms, and lightning, the vulnerability of the Mahama refugee camp district remains significantly high relative to the recorded disaster impacts in other refugee-hosting communities. The second most affected refugee-hosting district from precipitation-related damages is Gisagara, where the Mugombwa refugee camp is located. The results support our flood risk modeling conclusions that Mugombwa and Mahama refugee camps are the most vulnerable hotspots to physical flood risk. Indeed, they remain the most impacted by precipitation-related disasters, as shown in Figure 14.
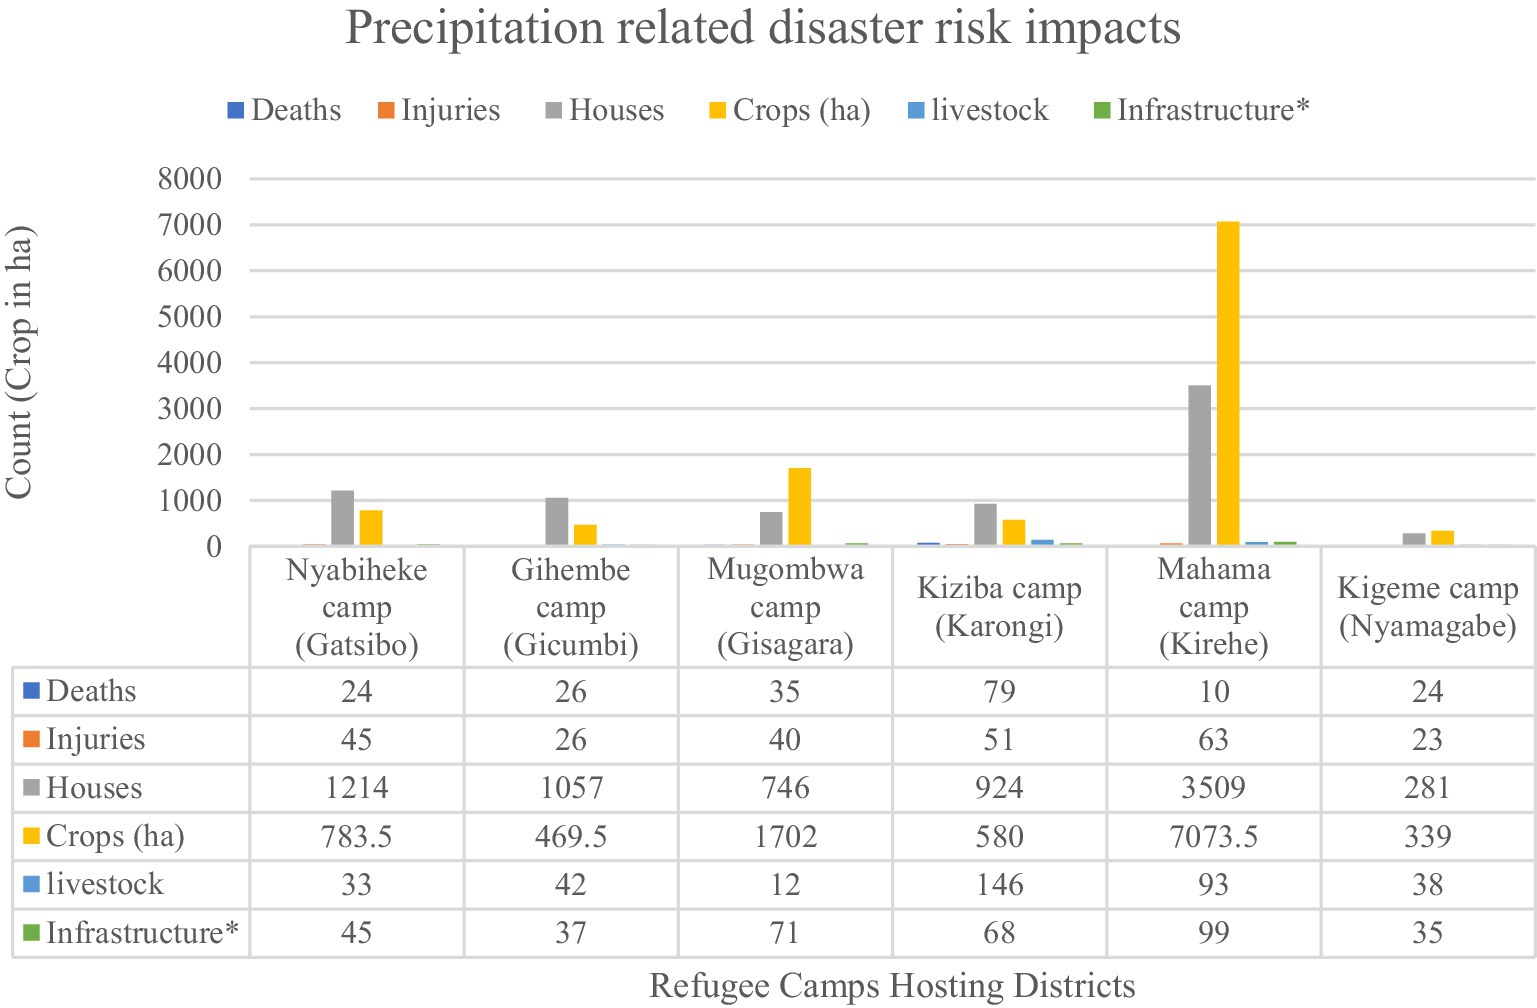
Figure 14. Recorded precipitation-related (floods, rainstorms, lightning) disaster effects in refugee-hosting districts from 2013 to 2021.
5.4 Soil erosion risk assessment
As mentioned above, our results focuses on soil erosion effects at watersheds scale (30 meter spatial resolution) with a particular focus on camps areas – i.e., within a 15 km radius from the centroid of the refugee camps. The result shows that the Kiziba refugee campsite watershed boundary has the greatest soil erosion issues, with an estimated an annual soil loss of upto 19 million tons within the watershed area. Comparatively, yearly total soil losses are lowest in Mahama and Mugombwa refugee camps areas (< 41,000 ton/watershed). Our model also suggests that soil erosion risks are moderately in the Kigeme and Gihembe encampment regions (Figure 15). This corresponds to the recent development of deep ravines in Kigeme, which have motivated population relocations and reforestation initiatives (Karinganire, 2023). The findings could enable decision-makers to prioritize sustainable land and watershed management plans around camps.
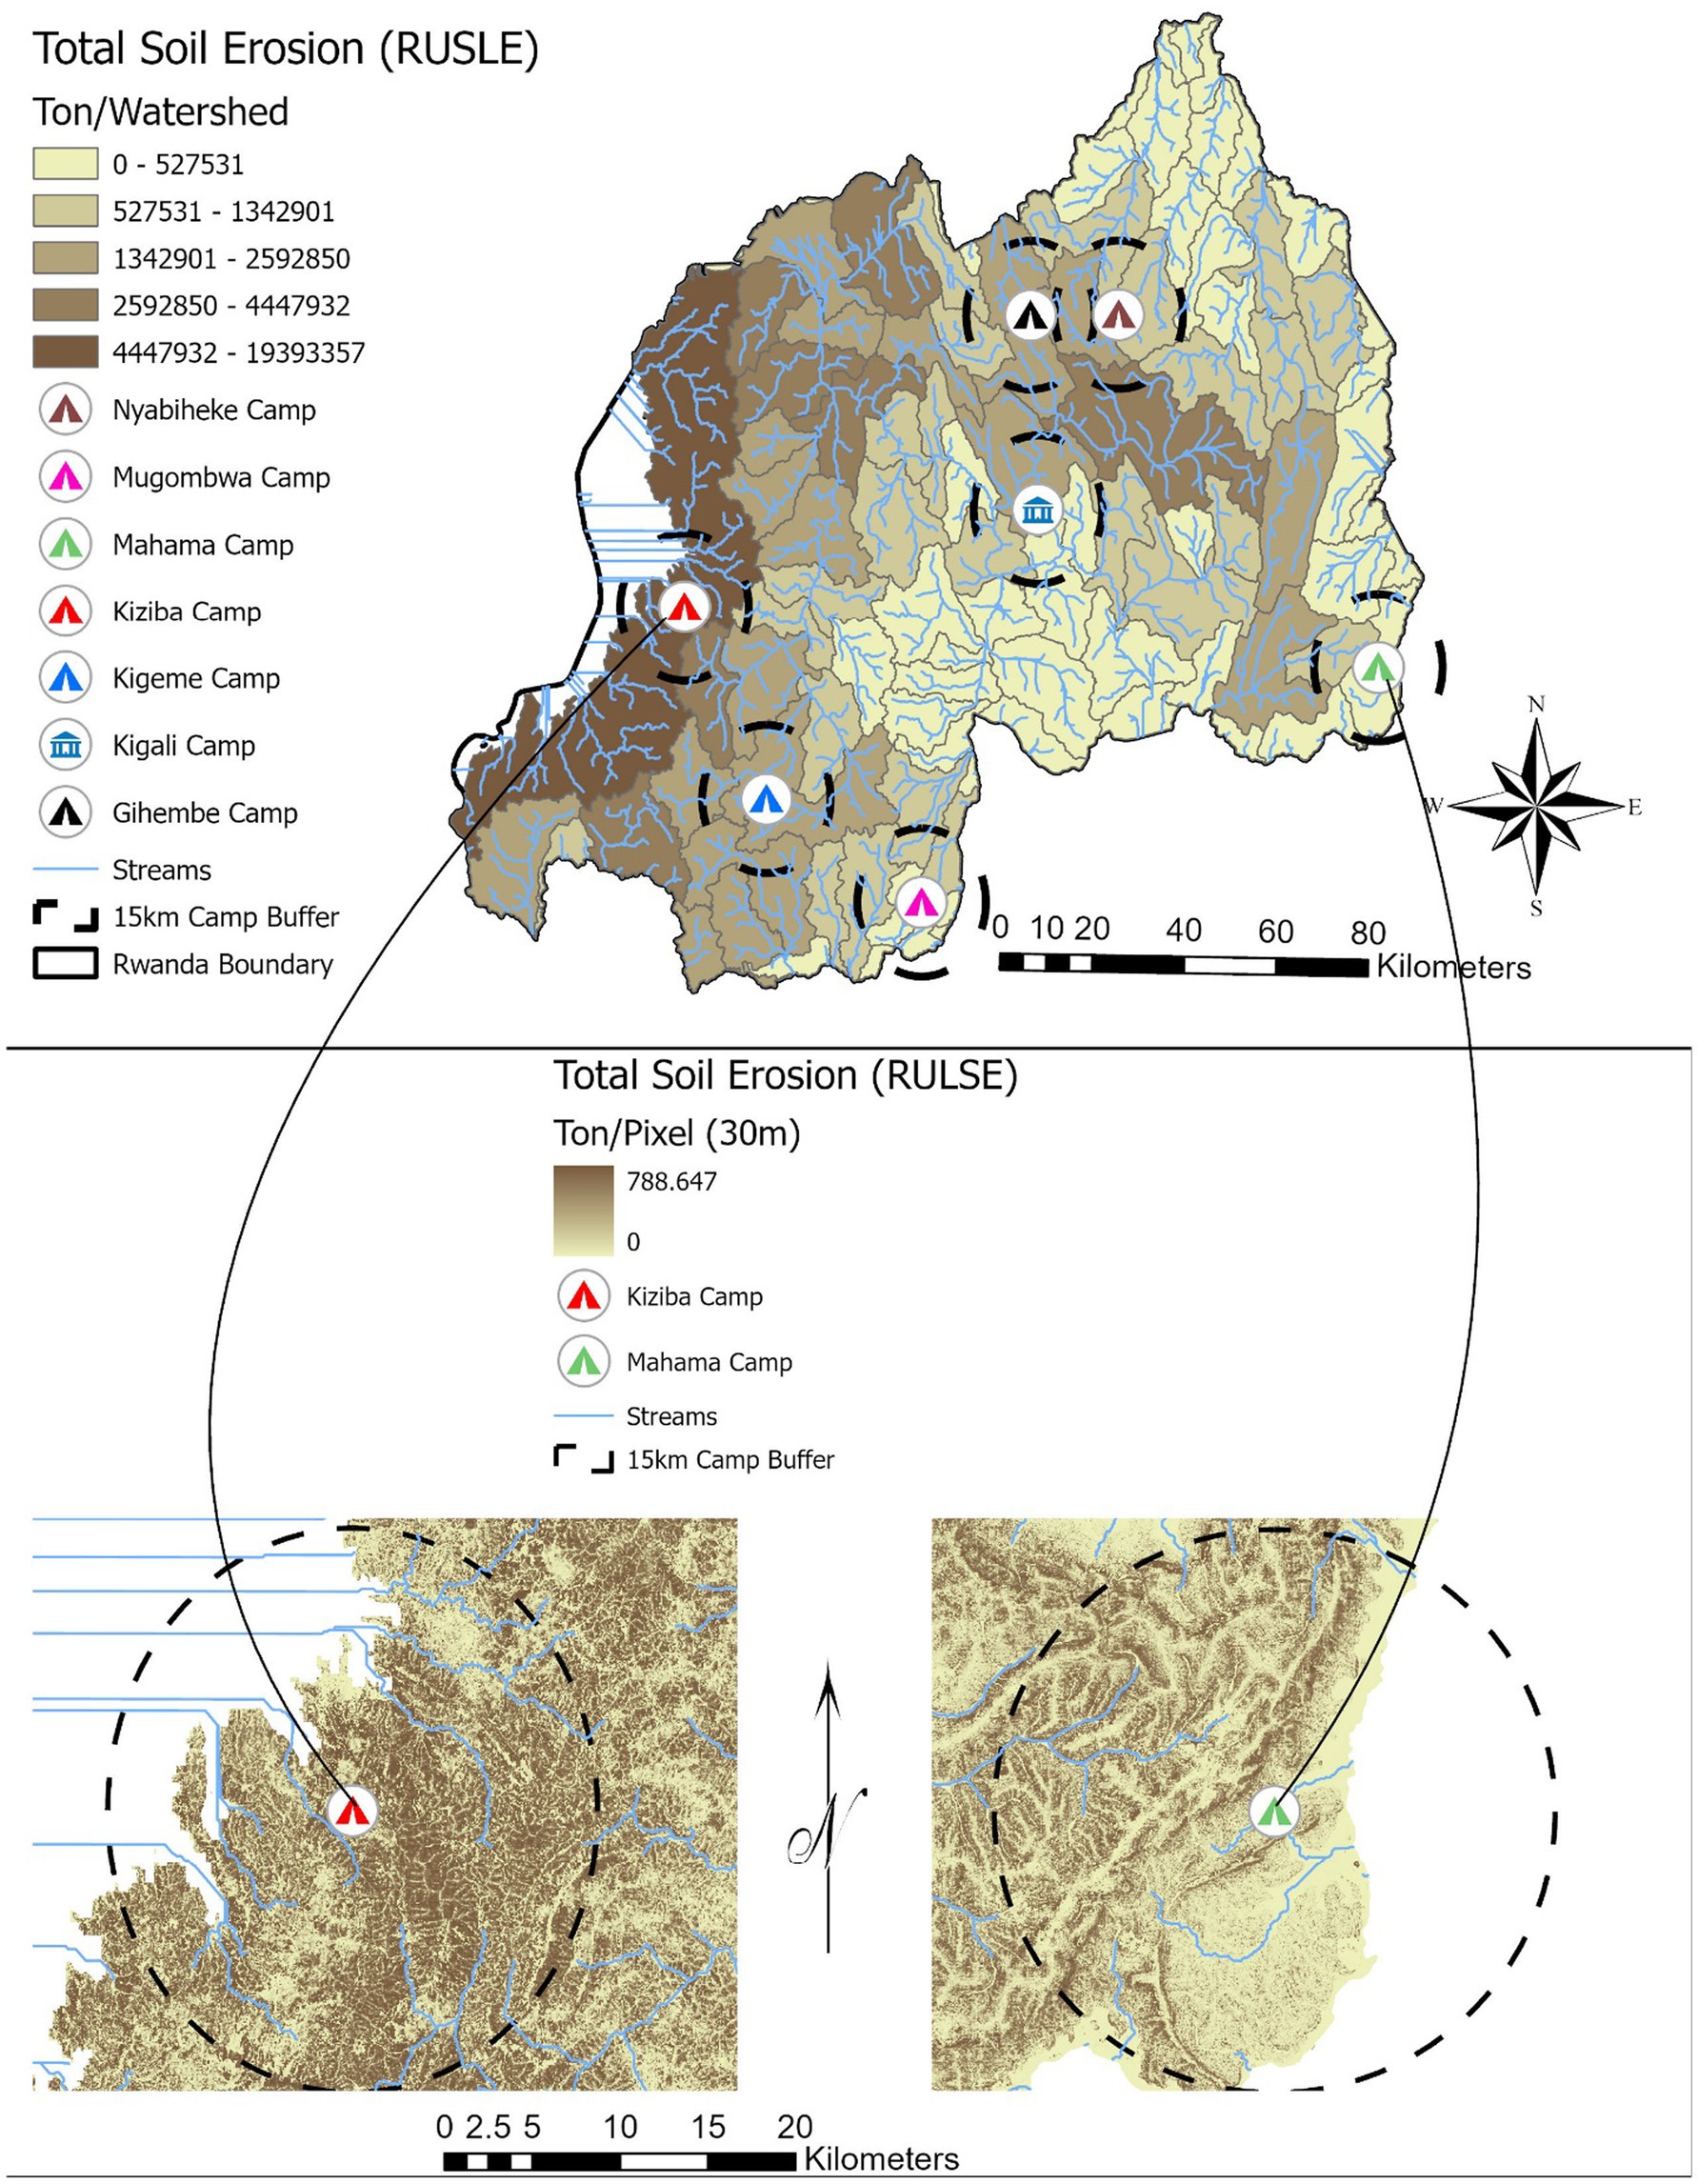
Figure 15. Soil erosion dynamics in refugee camp areas.
5.5 Drought risk assessment
Using the drought index map from the University of East Anglia, UK [self-calibrating Palmer Drought Severity Index (scPDSI)] (Barichivich et al., 2020), it appears that Rwanda’s drought risk is highest in its southeastern region (Map 17). Hence, we can state with some confidence that the Mahama refugee camp is located in an area that is highly prone to climate-related drought risk. Given the elevated flood risks we identified in the Mahama encampment area, our work suggests that this area is vulnerable to both extreme lows and highs in terms of precipitation. Mugombwa camp sits close to the western extent of the southeastern drought-prone region. While Mugombwa exhibits rather low risk of landslide, soil erosion, or flood, our drought risk assessment suggests that droughts may be the one risk type this encampment area may be susceptible to. Other encampment areas by contrast, have rather low drought risk profiles (see Figure 16).
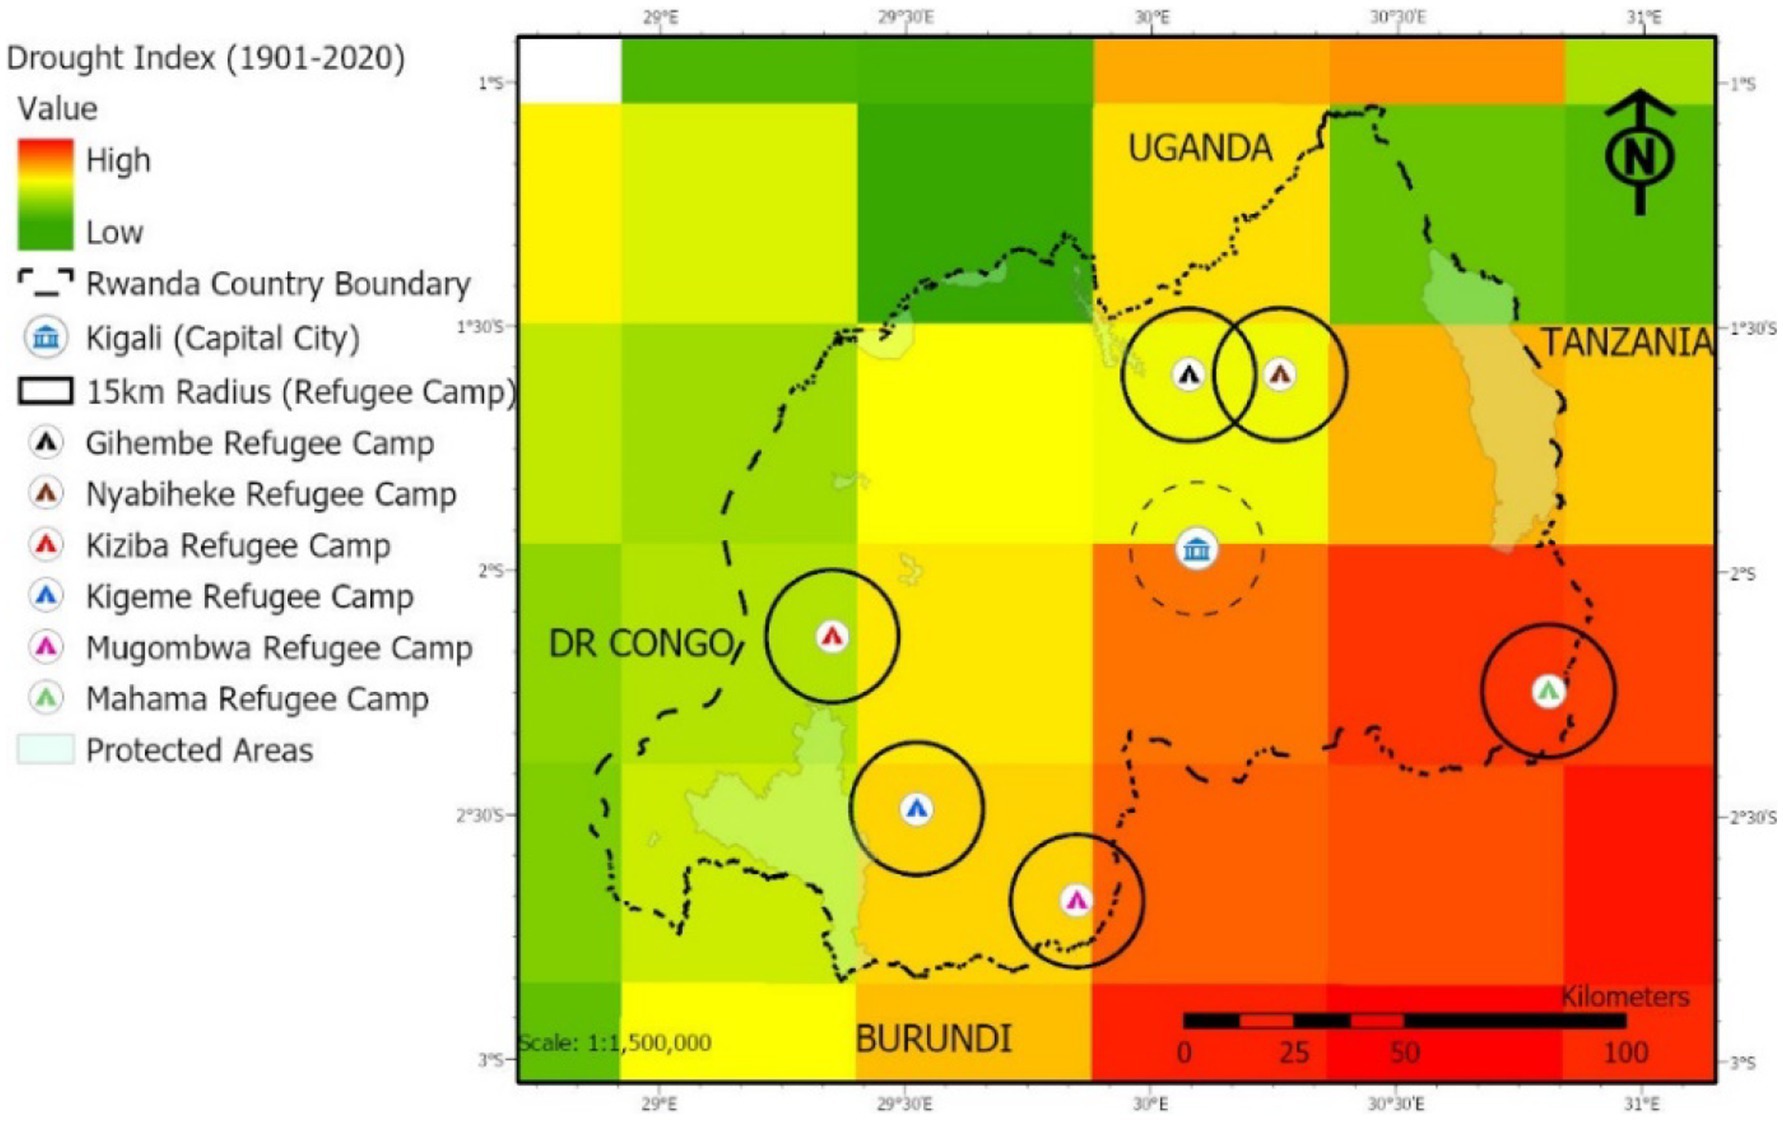
Figure 16. Drought index, Rwanda. Because of the large grid size of the data, we extend the map areas into neighboring countries for better visualization. The map was created using the globally available self-calibrating palmer drought severity index (scPDSI). For more detail about the data, see Barichivich et al. (2020) and Van Der Schrier et al. (2013).
6 Discussion
The frequency and intensity of weather, climate, and water-related disasters, including floods, droughts, and landslides, have increased globally and are expected to become more severe due to climate change, particularly in Africa (Tzachor et al., 2023). In 2023 alone, extreme weather events in Africa resulted in the deaths of at least 15,700 people and negatively affected 34 million others (Dunne, 2023). Rwanda is highly susceptible to these hazards, and in spring 2023, flooding killed 131 people and destroyed over 6,000 homes (International Federation of Red Cross and Red Crescent Societies (IFRC), 2023).
6.1 Climate risks in refugee-hosting areas
Our study demonstrates that climate-induced hazards vary spatially across refugee-hosting districts in Rwanda. The hilly and densely populated country is heavily deforested (REMA, 2011), which has augmented the risk of damaging landslide events (Vodacek, 2021). Without sufficient mitigation and adaptation measures, such climate hazards could reduce the safety and livelihood security of all residents of Rwanda. Such hazards are particularly dangerous for vulnerable households, that may struggle to cope with climate risk impacts, including refugees and poor households in nearby host communities.
Rwanda also faces high flood risk in many areas (Mind'je et al., 2019), as well as drought risk, particularly in the Eastern Province (Niyonsenga et al., 2024). Our findings reveals that flood risk is highest in southeastern locations, particularly in districts hosting Mugombwa and Mahama refugee camps. Disaster impact data show significant precipitation-related damages in Mahama’s home district in recent years. Similarly, landslide risk is particularly high in the former Gihembe camp area, as well as in the western districts hosting Kiziba and Kigeme camps. Between 2013 and 2021, landslides in the district hosting Gihembe camp damaged 324 hectares of cropland, while in 2016 alone, landslides in Kiziba camp’s district claimed 110 lives and injured 52 people (MIDIMAR, 2016).
These risks have influenced recent Government of Rwanda (GoR) and UNHCR policies, such as the closure of Gihembe camp in 2021 due to landslide risks (UNHCR Rwanda, 2021). Additionally, Rwanda’s southeastern region faces increasing drought risks, which will likely persist due to climate change-driven precipitation variability. Between 1974 and 2018, an estimated 4.2 million people were affected by droughts in Rwanda (United Nations Office for Disaster Risk Reduction (UNDRR), 2020). Our analysis indicates that Mahama and Mugombwa refugee camps are particularly vulnerable to droughts and water scarcity.
6.2 Soil Erosion and land degradation in encampment areas
Soil erosion is a critical challenge in Karongi district, where Kiziba refugee camp is located. Using the InVEST Sediment Delivery Ratio (SDR) model, we find that sediment delivery significantly increased in all encampment areas, with Kiziba exhibiting the highest levels. Soil erosion has reduced agricultural productivity in many parts of the country (Kagabo et al., 2013). Refugee camps often contribute to increased deforestation for firewood and shelter materials, reducing vegetation cover and accelerating soil erosion and sediment transport (Food and Agriculture Organization of the United Nations (FAO), 2022). The loss of tree cover weakens slope stability, exacerbating landslide risks and increasing sediment loads in nearby rivers and streams, which threatens water quality (Emadi-Tafti et al., 2021). Also, a large share of Kigeme camp’s population has been relocated to Mahama due to erosion effects and the resulting deep ravines (Karinganire, 2023). In response, reforestation efforts are also underway. For example, in Kigeme camp, tree planting undertaken by refugees and host community members intends to reduce landslide vulnerability (Karinganire, 2023). Our study highlights the ongoing hazard threat in many encampment areas that continue to support large refugee populations: with one exception (Nyabahike), each has at least one climate risk of concern, if not more.
6.3 Refugee-host community protections and policy integration in Rwanda
In terms of refugee integration, Rwanda has a progressive asylum policy that aligns with international refugee protection frameworks, including the 1951 Refugee Convention and the OAU 1969 Refugee Convention (Ministry in charge of Emergency Management (MINEMA), 2021; Organization of African Unity, 1969). The government has also taken steps to mainstream refugee needs and concerns into national development plans, particularly through its National Strategy for Economic Inclusion of Refugees and Host Communities (2021–2024) (Ministry in Charge of Emergency Management (MINEMA) and United Nations High Commissioner for Refugees (UNHCR), 2021). This approach integrates refugees into public services, health care, and education, reducing dependence on humanitarian aid. The country provides refugees with the right to work reflecting its commitment to inclusive policies. As a signatory to the Global Compact on Refugees (GCR), Rwanda actively promotes self-reliance and socio-economic inclusion of refugees through initiatives like the Comprehensive Refugee Response Framework (CRRF) (Global Compact on Refugees, 2025). In addition to its social protection systems, the Rwandan government has taken steps to address the threats of climate-related disasters. As a signatory of the United Nations Framework Convention on Climate Change (UNFCCC), Rwanda is advancing strategies to reduce greenhouse gas emissions and build resilience (Republic of Rwanda, 2020). Rwanda has adopted the Sendai Framework of Action for disaster risk reduction (2015–30) and has invested in educating Rwandans on natural and climate hazard risks (Nahayo et al., 2018). Rwanda has mainstreamed refugee affairs and disaster risk reduction (DRR) strategies into some of its national sectoral policies and district development plans such as National Disaster Risk Reduction and Management Policy (MINEMA, 2023), National Contingency Plan for Storms (MINEMA, 2018b), Revised Green Growth and Climate Resilience Strategy (GGCRS) (Republic of Rwanda, 2022) Additionally, the country has developed regulations and contingency plans to mitigate, respond, and recover from natural and climate-related disasters. Rwanda also maintains a national disaster loss database to monitor impact. The database supports analytical scientific studies like ours to inform public policy (United Nations Office for Disaster Risk Reduction (UNDRR), 2018).
Despite these national and local efforts, many people in Rwanda remain highly vulnerable to climate change impacts. For a large share of Rwandan households, livelihoods are heavily dependent on economic activities that are the most vulnerable to negative shocks related to natural hazards. This is especially the case for agriculture, but also applies to those engaged in forestry, tourism, and fisheries. Over the past two decades, the frequency and intensity of natural and climate-induced disasters, particularly floods and droughts, increased significantly, leading to an increase in the toll of deaths and injuries as well as economic and environmental losses (United Nations Office for Disaster Risk Reduction (UNDRR), 2020). Natural hazard damages have also resulted in increasingly negative consequences for agricultural production, as well as augmenting infrastructural damages (Ministry of Disaster Management and Refugee Affairs (MIDIMAR), 2016, 2017; Ministry in charge of Emergency Management (MINEMA), 2018a, 2019, 2020).
6.4 Limitations and future research directions
Our analysis acknowledges limitations due to scale mismatches and data availability constraints. We integrate high-resolution hazard models (30 m–100 m) with district-level disaster records, ensuring spatial coherence, but camp-specific disaster data remain limited. The multi-criteria GIS modeling approach involves some subjectivity in factor weighting, which, while informed by previous research, would benefit from further ground-truth validation. Additionally, while broad-scale drought indices (e.g., scPDSI) provide regional and district-level insights, they may not fully capture localized water stress within refugee settlements.
Future research should prioritize high-resolution monitoring using drone imagery, LiDAR, and Sentinel-2 data to better track land cover changes in encampment areas. Improving spatial disaggregation techniques for disaster impact data would refine linkages between district-wide hazards and refugee camp risks. Finally, integrating scenario-based climate projections (CMIP6) and hydrological models could strengthen long-term risk assessments. Finally, policy-driven research on nature-based solutions and infrastructure adaptation could support resilience-building efforts in refugee-hosting areas.
7 Conclusion
The severity of climate-induced hazards varies spatially across Rwanda’s districts, including in refugee-hosting areas. This study highlights the importance of profiling encampments and host communities to assess their unique climate hazard risks. While not all refugee camps face the same level of exposure, we identify specific locations where particular climate risks, such as flooding, landslides, drought, and soil erosion, are of concern. For example, Mahama and Mugombwa camps are highly vulnerable to flooding and drought, while landslides and soil erosion pose significant risks in Kiziba and Kigeme camps. Addressing these challenges will require integrated climate change mitigation, adaptation, disaster risk reduction (DRR), and socioeconomic resilience strategies. Given the limited availability of alternative safe relocation sites, national efforts with international support should focus on enhancing climate resilience in existing encampments through improved early warning systems, infrastructure strengthening, sustainable land management, and nature-based solutions.
Recognizing these risks, the Government of Rwanda and UNHCR have taken steps to mitigate climate hazards. In August 2021, Gihembe Refugee Camp in Gicumbi District was closed due to landslide risks, leading to the relocation of refugees to Mahama Camp in Kirehe District (UNHCR Rwanda, 2021). Additionally, over 3,200 Congolese refugees have been relocated from Kigeme and Gihembe camps to Mahama Camp to ensure their protection and improve their living conditions (Ashimwe, 2021). Furthermore, refugees and locals have collaborated on reforestation initiatives, such as in Kigeme Camp, where over 37,000 trees have been planted to combat soil erosion and environmental degradation (Karinganire, 2023).
Despite these efforts, challenges remain in ensuring long-term sustainability of refugee livelihoods and improving disaster resilience in settlements. Currently, climate-related vulnerabilities persist in many areas hosting refugees in Rwanda. Continued efforts to integrate refugee-inclusive DRR strategies into broader climate adaptation and land-use planning will be critical. Expanding data collection on refugee settlement risks, strengthening early warning systems, and enhancing infrastructure resilience are key areas for future policy action.
Data availability statement
The raw data supporting the conclusions of this article will be made available by the authors, without undue reservation.
Author contributions
ND: Conceptualization, Data curation, Formal analysis, Investigation, Methodology, Visualization, Writing – original draft, Writing – review & editing. SP: Writing – review & editing. AG: Conceptualization, Data curation, Writing – original draft, Writing – review & editing. WR: Writing – original draft, Writing – review & editing. CS: Conceptualization, Data curation, Formal analysis, Investigation, Methodology, Visualization, Writing – original draft, Writing – review & editing.
Funding
The author(s) declare that financial support was received for the research and/or publication of this article. This work was supported through the Research Fellowship program offered by the World Bank-UNHCR Joint Joint Data Center on Forced Displacement (JDC). It is part of the program “Building the Evidence on Protracted Forced Displacement: A Multi-Stakeholder Partnership.’’ This initiative is funded by the United Kingdom’s Foreign, Commonwealth and Development Office (FCDO), is managed by the World Bank Group (WBG), and was established in partnership with the United Nations High Commissioner for Refugees (UNHCR).
Acknowledgments
The scope of the program is to expand the global knowledge on forced displacement by funding quality research and disseminating results for the use of practitioners and policy makers. We further thank FCDO for additional funding support through its Knowledge for Change (KCP) program. The study team would like to extend our gratitude to the JDC as well as the UNHCR Rwanda field office for their invaluable support. This study does not reflect the views of FCDO, the WBG or UNHCR.
Conflict of interest
The authors declare that the research was conducted in the absence of any commercial or financial relationships that could be construed as a potential conflict of interest.
Publisher’s note
All claims expressed in this article are solely those of the authors and do not necessarily represent those of their affiliated organizations, or those of the publisher, the editors and the reviewers. Any product that may be evaluated in this article, or claim that may be made by its manufacturer, is not guaranteed or endorsed by the publisher.
Supplementary material
The Supplementary material for this article can be found online at: https://www.frontiersin.org/articles/10.3389/fclim.2025.1465223/full#supplementary-material
Footnotes
1. ^We follow Loescher and Milner (2005) in characterizing a protracted refugee situation as one in which refugees encounter extended periods of exile. In extreme cases, refugees may face a state of “limbo” for decades.
2. ^By “inclusive camp services,” we are referring to services mobilized by refugee-motivated humanitarian aid that are accessible to hosts and refugees alike, such as access to potable water, school facilities, etc.
3. ^The producer’s accuracy is simply the probability that a real feature on the ground (based on a high resolution Google Earth imagery) is correctly shown on the classified map (Landsat 8).
References
Ahmadisharaf, E., Kalyanapu, A. J., and Chung, E. S. (2016). Spatial probabilistic multi-criteria decision making for assessment of flood management alternatives. J. Hydrol. 533, 365–378. doi: 10.1016/j.jhydrol.2015.12.031
Al-Hanbali, A., Alsaaideh, B., and Kondoh, A. (2011). Using GIS-based weighted linear combination analysis and remote sensing techniques to select optimum solid waste disposal sites within Mafraq city, Jordan. J. Geogr. Inf. Syst. 3, 267–278. doi: 10.4236/jgis.2011.34023
Ashimwe, E. (2021). Rwanda: over 3,200 refugees relocated from Kigeme, Gihembe camps. allAfrica. Available online at: https://allafrica.com/stories/202103250455.html
Bagstad, K. J., Ingram, J. C., Lange, G., Masozera, M., Ancona, Z. H., Bana, M., et al. (2020). Towards ecosystem accounts for Rwanda: tracking 25 years of change in flows and potential supply of ecosystem services. People Nat. 2, 163–188. doi: 10.1002/pan3.10062
Barbier, E. B., and Hochard, J. P. (2018). The impacts of climate change on the poor in disadvantaged regions. Rev. Environ. Econ. Policy 12, 26–47. doi: 10.1093/reep/rex023
Barichivich, J., Osborn, T. J., Harris, I., van der Schrier, G., and Jones, P. D. (2020). State of the climate in 2019. Bull. Am. Meteorol. Soc. 101. doi: 10.1175/2020BAMSStateoftheClimate.1
Beltran, P., and Hadzi-Vascov, M. (2023). Climate and cross-border migration. IMF Working Papers 2023:1. doi: 10.5089/9798400261879.001
Bernhofen, M. V., Blenkin, F., and Trigg, M. A. (2023). Unknown risk: assessing refugee camp flood risk in Ethiopia. Environ. Res. Lett. 18:064041. doi: 10.1088/1748-9326/acd8d0
Bilgili, Ö., and Loschmann, C. (2018). Refugees and host communities in the Rwandan labour market. Forced Migr. Rev. 58, 22–23.
Blaikie, P., Cannon, T., Davis, I., and Wisner, B. (1994). At risk: natural hazards, people’s vulnerability and disasters. London, UK: Routledge.
Bronen, R. (2012). Climate-induced community relocations: creating an adaptive governance framework based in human rights. UNFCCC. Retrieved from https://unfccc.int/files/adaptation/groups_committees/loss_and_damage_executive_committee/application/pdf/bronen_climate_induced_community_relocations_creating_an__adaptive_governance_framework_based_in_human_rights_doctrine_2011.pdf
Brooks, K. N., Ffolliott, P. F., and Magner, J. A. (2013). Hydrology and the Management of Watersheds : John Wiley & Sons, Inc.
Bunruamkaew, K., and Murayama, Y. (2011). Site suitability evaluation for ecotourism using GIS & AHP: a case study of Surat Thani Province, Thailand. Procedia. Soc. Behav. Sci. 21, 269–278. doi: 10.1016/j.sbspro.2011.07.024
Burzyński, M., Deuster, C., Docquier, F., and de Melo, J. (2022). Climate change, inequality, and human migration. J. Eur. Econ. Assoc. 20, 1145–1197. doi: 10.1093/jeea/jvab054
Chitsaz, N., and Banihabib, M. E. (2015). Comparison of different multi criteria decision-making models in prioritizing flood management alternatives. Water Resour. Manag. 29, 2503–2525. doi: 10.1007/s11269-015-0954-6
Collins, M. G., Steiner, F. R., and Rushman, M. J. (2001). Land-use suitability analysis in the United States: historical development and promising technological achievements. Environ. Manag. 28, 611–621. doi: 10.1007/s002670010247
Dampha, N. K. (2020). Ecosystem services and coastal adaptation to climate change: An interdisciplinary science-based application in The Gambia (Doctoral dissertation). University of Minnesota Digital Conservancy. https://conservancy.umn.edu/handle/11299/219226
De Brito, M. M., Evers, M., and Delos, A. (2018). Participatory flood vulnerability assessment: a multi-criteria approach. Hydrol. Earth Syst. Sci. 22, 373–390. doi: 10.5194/hess-22-373-2018
Duc, D. M. (2013). Rainfall-triggered large landslides on 15 December 2005 in Van canh district, Binh Dinh province, Vietnam. Landslides 10, 219–230. doi: 10.1007/s10346-012-0362-4
Dunne, D. (2023). Analysis: Africa’s extreme weather has killed at least 15,000 people in 2023—carbon brief. CarbonBrief. Available online at: https://www.carbonbrief.org/analysis-africas-extreme-weather-have-killed-at-least-15000-people-in-2023/
Emadi-Tafti, M., Ataie-Ashtiani, B., and Hosseini, S. M. (2021). Integrated impacts of vegetation and soil type on slope stability: a case study of kheyrud forest, Iran. Ecol. Model. 446:109498. doi: 10.1016/j.ecolmodel.2021.109498
Esri (2021). Satellite Imagery [basemap]. In ArcGIS Pro Basemaps. Esri. Retrieved https://pro.arcgis.com/en/pro-app/latest/help/mapping/map-authoring/author-a-basemap.htm
Food and Agriculture Organization of the United Nations (FAO) (2022). Restoring degraded land in Rohingya refugee camps in Cox’s Bazar, Bangladesh: SOLAW21 technical background report. Rome, Italy: FAO. Retrieved from https://openknowledge.fao.org/server/api/core/bitstreams/64716592-d871-46a8-81d9-4759f72dd951/content
Feizizadeh, B., and Blaschke, T. (2013). Land suitability analysis for Tabriz County, Iran: a multi-criteria evaluation approach using GIS. J. Environ. Plan. Manag. 56, 1–23. doi: 10.1080/09640568.2011.646964
Fick, S. E., and Hijmans, R. J. (2017). Worldclim 2: new 1-km spatial resolution climate surfaces for global land areas. Int. J. Climatol. 37, 4302–4315. doi: 10.1002/joc.5086
Fransen, S., Werntges, A., Hunns, A., Sirenko, M., and Comes, T. (2024). Refugee settlements are highly exposed to extreme weather conditions. Proc. Natl. Acad. Sci. 121:e2206189120. doi: 10.1073/pnas.2206189120
Global Compact on Refugees. (2025). Rwanda: an overview of how the global compact on refugees is being turned into action in Rwanda. Available online at: https://globalcompactrefugees.org/gcr-action/countries/rwanda#:~:text=The%20goal%20of%20this%20strategy,districts%2C%20benefitting%20both%20population%20groups
International Federation of Red Cross and Red Crescent Societies (IFRC). (2023). Operational update: Rwanda — Floods and landslides (MDRRW022) [Situation report]. Retrieved from: https://reliefweb.int/report/rwanda/rwanda-floods-and-landslides-operational-update-mdrrw022 (Accessed June 11, 2025).
Intergovernmental Panel on Climate Change. (1990). Climate change: The IPCC scientific assessment (J. T. Houghton, G. J. Jenkins, & J. J. Ephraums, Eds.). Cambridge, United Kingdom: Cambridge University Press. ISBN 0-521-40360-X
Kagabo, D. M., Stroosnijder, L., Visser, S. M., and Moore, D. (2013). Soil erosion, soil fertility and crop yield on slow-forming terraces in the highlands of Buberuka, Rwanda. Soil Tillage Res. 128, 23–29. doi: 10.1016/j.still.2012.11.002
Kanani-Sadat, Y., Arabsheibani, R., Karimipour, F., and Nasseri, M. (2019). A new approach to flood susceptibility assessment in data-scarce and ungauged regions based on GIS-based hybrid multi criteria decision-making method. J. Hydrol. 572, 17–31. doi: 10.1016/j.jhydrol.2019.02.034
Karinganire, E. D. (2022). Community-based health insurance gives urban refugees and students in boarding schools in Rwanda a sigh of relief. UNHCR Rwanda. Available online at: https://www.unhcr.org/rw/18507-community-based-health-insurance-gives-urban-refugees-and-students-in-boarding-schools-in-rwanda-a-sigh-of-relief.html
Karinganire, E. D. (2023). Refugees and locals join hands to restore the environment in Rwanda. UNHCR US. Available online at: https://www.unhcr.org/us/news/stories/refugees-and-locals-join-hands-restore-environment-rwanda
Kato, S., and Mutonyi, R. (2011) The challenges of managing increasing landslides vulnerability in mount Elgon ecosystem, Uganda: A case of human interactions with its environment on the verge of collapsing. Retrieved from https://iasc2011.fes.org.in/papers/docs/564/submission/original/564.pdf
Khosravi, K., Shahabi, H., Pham, B. T., Adamowski, J., Shirzadi, A., Pradhan, B., et al. (2019). A comparative assessment of flood susceptibility modeling using multi-criteria decision-making analysis and machine learning methods. J. Hydrol. 573, 311–323. doi: 10.1016/j.jhydrol.2019.03.073
Kowalski, K., Stagl, S., Madlener, R., and Omann, I. (2009). Sustainable energy futures: methodological challenges in combining scenarios and participatory multi-criteria analysis. Eur. J. Oper. Res. 197, 1063–1074. doi: 10.1016/j.ejor.2007.12.049
Loescher, G., and Milner, J. (2005). The long road home: protracted refugee situations in Africa. Survival 47, 153–174. doi: 10.1080/00396330500156636
Maystadt, J.-F., and Verwimp, P. (2014). Winners and losers among a refugee-hosting population. Econ. Dev. Cult. Change 62, 769–809. doi: 10.1086/676458
Ministry of Disaster Management and Refugee Affairs (MIDIMAR) (2016). Annual report: Damages by disaster types (Annual report). Kigali, Rwanda: MIDIMAR. Retrieved from Rwanda Ministry of Environment website. https://www.minema.gov.rw/index.php?eID=dumpFile&f=9437&t=f&token=8193dd26daa46e2b4f35ede04e28712b65b87db0&utm_source
Ministry of Disaster Management and Refugee Affairs (MIDIMAR). (2017). Annual report: Disaster effects situation (No. 6, 2018). Kigali, Rwanda: MIDIMAR. Retrieved from https://e-ihuriro.rcsprwanda.org/books/annual-disaster-effects-report-2017/?utm_source
Mind'je, R., Li, L., Amanambu, A. C., Nahayo, L., Nsengiyumva, J. B., Gasirabo, A., et al. (2019). Flood susceptibility modeling and hazard perception in Rwanda. Int. J. Disaster Risk Reduct. 38:101211. doi: 10.1016/j.ijdrr.2019.101211
Ministry in charge of Emergency Management (MINEMA). (2018a). Annual report: Disaster effects situation by type of disaster.
Ministry in charge of Emergency Management (MINEMA) (2018b). National contingency plan for storms. Available online at: https://www.minema.gov.rw/fileadmin/user_upload/Minema/Publications/Contingency_Plans/Contingency_Plan_for_Storm.pdf
Ministry in charge of Emergency Management (MINEMA) (2019). Annual report: Disaster effects situation by type of disaster. September, 1–50.
Ministry in charge of Emergency Management (MINEMA). (2020). Annual report: Disaster damages by disaster types (January-December 2020).
Ministry in charge of Emergency Management (MINEMA) (2021). Refugees Management. Available online at: https://www.minema.gov.rw/refugees-management
Ministry in charge of Emergency Management (MINEMA). (2023). National disaster risk reduction and management policy. Available online at: https://www.minema.gov.rw/index.php?eID=dumpFile&t=f&f=70104&token=1e6bdd5b22ad6a5455e3c313753ea76b327568a3
Ministry in Charge of Emergency Management (MINEMA) and United Nations High Commissioner for Refugees (UNHCR) (2021). Ministry in charge of emergency management (MINEMA) and United Nations high commissioner for refugees (UNHCR) joint strategy on economic inclusion for refugees and hsot communities in Rwanda: 2021–2024. Kigali, Rwanda: MINEMA & UNHCR. Retrieved June 11, 2025, from https://data.unhcr.org/en/documents/details/89117?utm_source
MINEMA and World Bank (2019) Economic activity and opportunity for refugee inclusion. Available online at: https://reliefweb.int/report/rwanda/rwanda-economic-activity-and-opportunity-refugee-inclusion
Nahayo, L., Li, L., Habiyaremye, G., Richard, M., Mukanyandwi, V., Hakorimana, E., et al. (2018). Extent of disaster courses delivery for the risk reduction in Rwanda. Int. J. Disaster Risk Reduct. 27, 127–132. doi: 10.1016/j.ijdrr.2017.09.046
NASA Earth Observatory (2010) Large Landslide in Uganda [Satellite image]. Data acquired March 11, 2010. Greenbelt, MD: NASA Earth Science Division. Retrieved from https://visibleearth.nasa.gov/images/43130/large-landslide-in-uganda
National Institute of Statistics of Rwanda (NISR) (2023). The fifth Rwanda population and housing census, main indicators report (Report No. RPHC5). Kigali, Rwanda: NISR. Retrieved from https://dataspace.princeton.edu/handle/88435/dsp017h149t11t
Niyonsenga, S., Eziz, A., Kurban, A., Yuan, X., Umwali, E. D., Azadi, H., et al. (2024). Spatiotemporal analysis of drought characteristics and their impact on vegetation and crop production in Rwanda. Remote Sens. 16:1455. doi: 10.3390/rs16081455
Nkwunonwo, U. C., Whitworth, M., and Baily, B. (2020). A review of the current status of flood modelling for urban flood risk management in the developing countries. Sci. Afr. 7:e00269. doi: 10.1016/j.sciaf.2020.e00269
NOAA (2021). NOAA/NGDC—earth observation group—defense meteorological satellite Progam, boulder. Available onlne at: https://ngdc.noaa.gov/eog/viirs/download_ut_mos.html
Nsengiyumva, J. B., Luo, G., Nahayo, L., Huang, X., and Cai, P. (2018). Landslide susceptibility assessment using spatial multi-criteria evaluation model in Rwanda. Int. J. Environ. Res. Public Health 15:243. doi: 10.3390/ijerph15020243
Organization of African Unity. (1969). OAU convention governing the specific aspects of refugee problems in Africa (OAU Refugee Convention). 1001 U.N.T.S. 45. Addis Ababa, Ethiopia. Entered into force June 20, 1974. Retrieved June 11, 2025, from https://www.refworld.org/legal/agreements/oau/1969/en/13572
Owen, M., Kruczkiewicz, A., and Van Den Hoek, J. (2023). Indexing climatic and environmental exposure of refugee camps with a case study in East Africa. Sci. Rep. 13:7533. doi: 10.1038/s41598-023-31140-7
Protected Planet (2021). Explore the world’s protected areas. Available online at: https://www.protectedplanet.net/en
Rahmati, O., Zeinivand, H., and Besharat, M. (2016). Flood hazard zoning in Yasooj region, Iran, using GIS and multi-criteria decision analysis. Geomat. Nat. Hazards Risk 7, 1000–1017. doi: 10.1080/19475705.2015.1045043
RCMRD (2015). Rwanda 2015 land cover accuracy assessment report—GeoNode. Available online at: http://geoportal.rcmrd.org/documents/640
Regional Center for Mapping of Resources for Development (RCMRD). (2013). A gis & remote sensing approach in reducing vulnerabilities to climate change impacts in africa leg regional training workshop on adaptation for anglophone african least developed countries lcd’s rcmrd-servir africa (Workshop report). Nairobi, Kenya: RCMRD.
REMA (2011). Atlas of Rwanda’s changing environment: Implications for climate change resilience : Rwanda Environment Management Authority (REMA).
Republic of Rwanda. (2022). Revised green growth and climate resilience: national strategy for climate change and low carbon development. Available online at: https://www.rema.gov.rw/fileadmin/user_upload/Rwanda_Green_Growth___Climate_Resilience_Strategy_06102022.pdf
Ross, C. W., Prihodko, L., Anchang, J., Kumar, S., Ji, W., and Hanan, N. P. (2018). HYSOGs250m, global gridded hydrologic soil groups for curve-number-based runoff modeling. Sci. Data 5:180091. doi: 10.1038/sdata.2018.91
Saaty, T. L. (1980). The analytic hierarchy process: Planning, priority setting, resource allocation. New York: McGraw-Hill. https://www.amazon.com/Analytic-Hierarchy-Process-Planning-Allocation/dp/0070543712
Salemi, C. (2021). Refugee camps and deforestation in sub-Saharan Africa. J. Dev. Econ. 152:102682. doi: 10.1016/j.jdeveco.2021.102682
Shadmehri Toosi, A., Calbimonte, G. H., Nouri, H., and Alaghmand, S. (2019). River basin-scale flood hazard assessment using a modified multi-criteria decision analysis approach: a case study. J. Hydrol. 574, 660–671. doi: 10.1016/j.jhydrol.2019.04.072
Sharp, R., Douglass, J., Wolny, S., Arkema, K., Bernhardt, J., Bierbower, W., et al. (2020). InVEST 3.9.0. User’s guide. The natural capital project, Stanford University, University of Minnesota, the nature conservancy, and World Wildlife Fund. Retrieved from https://storage.googleapis.com/releases.naturalcapitalproject.org/invest/3.9.0/userguide/index.html
Tall, A., Dampha, N. K., Ndayiragije, N., Von Berg, M., Raina, L., and Manirambona, A. (2022). Tackling climate change, land degradation and fragility – Diagnosing drivers of climate and environmental fragility in Burundi’s colline landscapes: Towards a multi-sector investment plan to scale up climate resilience. A World Bank advisory services and analytics (ASA) report. Washington, DC: International Bank for Reconstruction and Development.
Tang, Z., Yi, S., Wang, C., and Xiao, Y. (2018). Incorporating probabilistic approach into local multi-criteria decision analysis for flood susceptibility assessment. Stoch. Environ. Res. Risk Assess. 32, 701–714. doi: 10.1007/s00477-017-1431-y
Tegeje, J. A. (2017). Review of spatial and temporal distribution of landslides in Tanzania. J. Ecosyst. Ecograp. 7. doi: 10.4172/2157-7625.1000243
Thalheimer, L., Schwarz, M. P., and Pretis, F. (2023). Large weather and conflict effects on internal displacement in Somalia with little evidence of feedback onto conflict. Glob. Environ. Change 79:102641. doi: 10.1016/j.gloenvcha.2023.102641
Trabucco, A., and Zomer, R. J. (2018). Global aridity index and potential evapotranspiration (ET0) climate database v2 : CGIAR consortium for spatial information (CGIAR-CSI). doi: 10.6084/m9.figshare.7504448.v3
Tran, P., Shaw, R., Chantry, G., and Norton, J. (2009). GIS and local knowledge in disaster management: a case study of flood risk mapping in Viet Nam. Disasters 33, 152–169. doi: 10.1111/j.1467-7717.2008.01067.x
Tzachor, A., Richards, C. E., Gudoshava, M., Nying’uro, P., Misiani, H., Ongoma, J. G., et al. (2023). How to reduce Africa’s undue exposure to climate risks. Nature 620, 488–491. doi: 10.1038/d41586-023-02557-x
United Nations Office for Disaster Risk Reduction (UNDRR). (2018). Rwanda advances with Sendai framework | UNDRR. Available online at: https://www.undrr.org/news/rwanda-advances-sendai-framework
United Nations Office for Disaster Risk Reduction (UNDRR). (2020). Rwanda: Risk-sensitive budget review – Analysis of public investment planning for disaster risk reduction [Report]. Retrieved June 11, 2025, from https://www.preventionweb.net/publication/rwanda-risk-sensitive-budget-review
UNHCR. (2021a). Refugees – UNHCR Rwanda. Available online at: https://www.unhcr.org/rw/refugees
UNHCR. (2024a). Operational Data Portal: Rwanda. Operational Data Portal. Available online at: https://data.unhcr.org/en/country/rwa
UNHCR. (n.d.). Education. UNHCR Rwanda. Retrieved June 8, 2024. Available online at: https://help.unhcr.org/rwanda/services/education/https%3A%2F%2Fhelp.unhcr.org%2Frwanda%2Fservices%2Feducation%2F
UNHCR Rwanda. (2021). Joint communique: relocation of refugees from Gihembe to Mahama camp. UNHCR Rwanda. Available online at: https://www.unhcr.org/rw/16673-joint-communique-relocation-of-refugees-from-gihembe-to-mahama-camp.html
USGS. (2021). EarthExplorer. Available online at: https://earthexplorer.usgs.gov/
Uwihirwe, J., Hrachowitz, M., and Bogaard, T. A. (2020). Landslide precipitation thresholds in Rwanda. Landslides 17, 2469–2481. doi: 10.1007/s10346-020-01457-9
Van Der Schrier, G., Barichivich, J., Briffa, K. R., and Jones, P. D. (2013). A scPDSI-based global data set of dry and wet spells for 1901-2009. J. Geophys. Res. Atmos. 118, 4025–4048. doi: 10.1002/jgrd.50355
Verdin, K. L. (2017). Hydrologic derivatives for modeling and applications (HDMA) database: U.S. geological survey data release. Available online at: https://www.sciencebase.gov/catalog/item/591f6cf9e4b0ac16dbdde1c5
Vodacek, A. (2021). A more dynamic understanding of landslide risk. Nat. Sustain. 4, 930–931. doi: 10.1038/s41893-021-00762-y
Watkins, D. (2000). 30-meter SRTM elevation data downloader. Available online at: http://dwtkns.com/srtm30m/
Weiss, D. j., Nelson, A., Gibson, H. S., Temperley, W., Peedell, S., Lieber, A., et al. (2018). A global map of travel time to cities to assess inequalities in accessibility in 2015. Nature 553, 333–336. doi: 10.1038/nature25181
World Bank. (2024). GDP growth (annual %) [dataset]. Available online at: https://data.worldbank.org/indicator/NY.GDP.MKTP.KD.ZG
World Wildlife Fund (WWF). (2016). Natural and Nature-Based Flood Management: A Green Guide [Flood Green Guide]. Washington, DC: WWF. Retrieved from https://files.worldwildlife.org/wwfcmsprod/files/Publication/file/538k358t40_WWF_Flood_Green_Guide_FINAL.pdf
WorldPop. (2020). (www.worldpop.org—School of geography and environmental science, University of Southampton; Department of Geography and Geosciences, University of Louisville; Departement de Geographie, Universite de Namur) and Center for International Earth Science Inf. Available online at: https://www.worldpop.org/geodata/listing?id=69
Keywords: Rwanda, flooding, landslide, natural hazards, refugee camps, erosion
Citation: Dampha NK, Salemi C, Polasky S, Egziabher AG and Rappeport W (2025) Refugees and host communities’ vulnerability to climate and disaster risks in Rwanda. Front. Clim. 7:1465223. doi: 10.3389/fclim.2025.1465223
Edited by:
Sk Ajim Ali, Aligarh Muslim University, IndiaReviewed by:
Manob Das, Bankura University, IndiaJamon Van Den Hoek, Oregon State University, United States
Copyright © 2025 Dampha, Salemi, Polasky, Egziabher and Rappeport. This is an open-access article distributed under the terms of the Creative Commons Attribution License (CC BY). The use, distribution or reproduction in other forums is permitted, provided the original author(s) and the copyright owner(s) are credited and that the original publication in this journal is cited, in accordance with accepted academic practice. No use, distribution or reproduction is permitted which does not comply with these terms.
*Correspondence: Nfamara K. Dampha, ZGFtcGgwMDJAdW1uLmVkdQ==; Colette Salemi Y3NhbGVtaUB1dmljLmNh