 Fangyuan Li
 Pragathi Jha
 David R. Johnson
- 1Edwardson School of Industrial Engineering, Purdue University, West Lafayette, IN, United States
- 2Department of Political Science, Purdue University, West Lafayette, IN, United States
Coastal communities face increasing flood risks due to sea level rise and climate change, necessitating more proactive risk reduction strategies. Pre-disaster relocations, supported by government subsidies, offer a potentially cost-effective solution, enabling at-risk homeowners to relocate before catastrophic losses occur. This study estimates the potential effectiveness and equity implications of two pre-disaster relocation strategies using an optimization framework and high-resolution flood risk and structural data from Louisiana’s Coastal Master Plan. Our findings indicate that a total investment of about $8 billion US in pre-disaster relocations could achieve approximately $0.5 billion in flood risk reduction annually over the next 50 years, with greater benefits in later years corresponding to increasing hazard as sea levels rise. Subsidies are allocated proportionally to flood risk, ensuring procedural fairness, though potential distributional inequities remain. While pre-disaster relocation strategies improve cost-effectiveness and risk mitigation, they do not fully resolve barriers to relocation, including housing affordability, community attachment, and structural inequities in flood exposure. This study provides quantitative insights into relocation feasibility and trade-offs, informing future research on adaptive relocation strategies and equity-focused flood mitigation policies.
1 Introduction
Global climate change poses huge challenges for coastal and riverine communities facing floods. Under the Intergovernmental Panel on Climate Change’s Representative Concentration Pathway (RCP) 2.6 scenario, median global sea-level rise (SLR) is projected to be 35 cm by the year 2,100 relative to a 1985–2005 reference period, leading to annual flooding for 0.2–2.9% of the global population and expected annual losses accounting for 0.3–5.0% of global gross domestic production (Hinkel et al., 2014). Global annual costs for building, updating, and maintaining dikes are prohibitively high, ranging from $12–31 billion US under RCP2.6 to $27–71 billion US under RCP8.5. Structural measures such as dams, levees, and sea walls are designed to physically alter the landscape and protect communities from inundation (US Army Corps of Engineers, 2024). Levees in the United States are commonly designed to defend against flood depths with a 1 percent annual chance of occurring or being exceeded (i.e., “100-year floods”), so they may breach or be overtopped in the event of more severe floods. In 2005, Hurricane Katrina hit Louisiana and left more than half of the state’s 3,560 miles of levees damaged, breached, or destroyed, which led to flooding in 80% of New Orleans (Van Heerden, 2007). Hydraulic infrastructures also engender a false sense of security known as the “levee effect” (White et al., 2001), which encourages continuous urban development behind levees while most homeowners are unaware of the actual flood risks (Ludy and Kondolf, 2012), possibly causing larger losses in the future. Even though structural measures are still important for flood risk management, past failures and dramatic global climate change urge decision-makers to pay more attention to nonstructural mitigation and adaptation measures.
Nonstructural flood mitigation measures, which do not alter local hydrology or hydrodynamics, aim to reduce flood losses by minimizing exposure and vulnerability rather than preventing flood occurrences. At the building level, common interventions include floodproofing, elevating structures, and home buyouts (Zarekarizi et al., 2020). Despite their benefits, floodproofing and elevation-in-place leave residual risks that are expected to become more pronounced due to climate change (Shan et al., 2022). Consequently, there is a growing consensus that managed retreat, including home buyouts, will be a necessary component of flood mitigation strategies (National Academies of Sciences, Engineering, and Medicine, 2024; Reidmiller et al., 2018). Voluntary buyout programs relocate willing homeowners from high-risk areas by acquiring properties, demolishing or relocating structures, and converting the land into open space that can provide additional community benefits, such as floodwater absorption and recreational use (Siders and Gerber-Chavez, 2021; Brody and Highfield, 2013; Greer et al., 2022). Research on buyouts spans multiple dimensions, including homeowner and community experiences (Binder et al., 2015; Bukvic and Owen, 2017; Greer and Brokopp Binder, 2017; Kick et al., 2011), implementation practices (Bier et al., 2020; Binder et al., 2020; Green and Olshansky, 2012; Wang et al., 2020), flood risk reduction effects (Atoba et al., 2021; Mobley et al., 2020; Nelson and Camp, 2020; Wang et al., 2020), and equity considerations (De Vries, 2017; Loughran and Elliott, 2019; Siders, 2019). While most studies analyze buyouts at an aggregated scale, advances in computational power, asset inventory datasets, and hydrological modeling have enabled assessments at the community or household level.
Wang et al. (2020) developed a computational framework for the government to minimize societal flood losses in Eastern North Carolina via insurance price regulation, retrofit grants, and acquisition offers. Household-level homeowner decisions were simulated by several discrete choice models and incorporated into the decision framework of the government. A total of $60 million government investment was estimated to result in $500 million damage mitigated in the event of a 100-year flood. This case study results also showed that when the government budget is limited ($20 million), more grants are allocated to retrofit programs than acquisition programs, while acquisition programs are more desirable when the government budget is higher. Acquisition programs are more cost-effective at reducing risks for very high-risk properties, but they can be more expensive. When the budget is limited, funds are exhausted sooner in acquisition programs, resulting in a smaller coverage and thus retrofit programs that can provide larger scale protection are favored. When the budget is higher, more funds are allocated to acquisition programs because of their cost-effectiveness. Nofal and Van De Lindt (2021) considered buyouts as one of the mitigation measures, illustrated its risk reduction effects, and suggested that diverse mitigation techniques should be jointly considered to achieve the best performance. These household-level and community-level quantitative methods enable policymakers to quantify the effects of applying different mitigation measures and make risk-informed decisions. However, in these analyses, all decisions are made at the beginning of the planning horizon and are not adaptive.
Although effective, buyout programs face several challenges. The majority are implemented post-disaster, when both homeowners and government agencies have already incurred substantial losses. In the United States, 89% of buyout funding is sourced from the Federal Emergency Management Agency’s (FEMA) Hazard Mitigation Grant Program (HMGP), which is only available following a presidential disaster declaration, whereas just 9% of buyout programs operate independently of specific events (Weber and Moore, 2019). Federal buyouts typically require 2 to 5 years to complete (Curran-Groome et al., 2021), during which homeowners may endure financial strain, housing instability, and psychological distress due to unsafe living conditions or the burden of maintaining both mortgage and rental payments. The prolonged timeline and associated hardships contribute to program attrition, reducing the overall ability to mitigate flood risk and achieve cost efficiency (Weber and Moore, 2019).
To address limitations of post-disaster buyout programs, researchers have explored pre-disaster relocation strategies. Bier et al. (2020) developed a game-theoretic framework that leverages differences in discount rates between the government and homeowners to design a subsidized pre-disaster relocation scheme. In this model, the homeowner decides on which year to relocate by comparing future flood risks and the cost of relocation, while the government chooses which year to offer the subsidy to minimize the sum of flood losses and subsidy expenses. Using Rayleigh-distributed flood probabilities, their analysis suggested that relocation could be advanced by more than a decade, yielding substantial risk reduction benefits. Expanding on this approach, Zhou (2022) employed an agent-based model to simulate relocation decision in Brooklyn, New York, examining the influence of discount rates, relocation costs, and network effects on household relocation behavior. However, limitations in data sources – such as the incompleteness of Zillow sales data and the use of tide station-derived flood risk estimates rather than household-level assessments – introduce potential uncertainties into the model’s predictions.
In this paper, we apply a modified version of the modeling framework developed by Zhou (2022) to hazard and structure data generated for Louisiana’s 2023 Comprehensive Master Plan for a Sustainable Coast (2023CMP). This plan is a 50-year, approximately $50 billion portfolio of recommended investments in integrated coastal management to prevent land loss and reduce flood risk. By examining economically optimal subsidies for relocations using high-fidelity hazard curves and structure attributes, we intend to answer the following questions: (1) What are the potential risk reduction outcomes of pre-disaster relocation, and how do different subsidization schemes affect these outcomes? (2) Where and under what circumstances do subsidies to incentivize relocation make economic sense? In other words, how sensitive are relocation outcomes to assumed discount rates, hazard estimates and structure attributes? (3) Would any communities and/or demographic groups in coastal Louisiana be disproportionally impacted by a large-scale relocation effort?
2 Materials and methods
2.1 Study area and data
The study area is coastal Louisiana in the United States, encompassing regions with at least a 0.05% annual probability of flooding (i.e., the “2,000-year floodplain”), as projected 50 years into the future (Johnson et al., 2023); see Figure 2 in this citation for a visual depiction of the model domain. The region faces severe flood risks, which are expected to intensify due to sea level rise, more extreme storms, and land loss. Figure 1 shows the flood depth associated with a 1% annual exceedance probability in the study area in 2040 if no protective action is taken; 2040 is chosen as it represents the end of the planning horizon in our analysis. Under a moderate environmental scenario, most coastal areas could experience flooding of 10–13 feet without protective measures. To address these risks, the Louisiana Coastal Protection and Restoration Authority (CPRA) was established after major hurricanes Katrina and Rita in 2005 to develop and implement the state’s coastal Master Plan, a 50-year, $50 billion strategy for flood protection and coastal restoration. The plan is updated every 6 years to incorporate advances in modeling and coastal management (Coastal Protection and Restoration Authority, 2023).
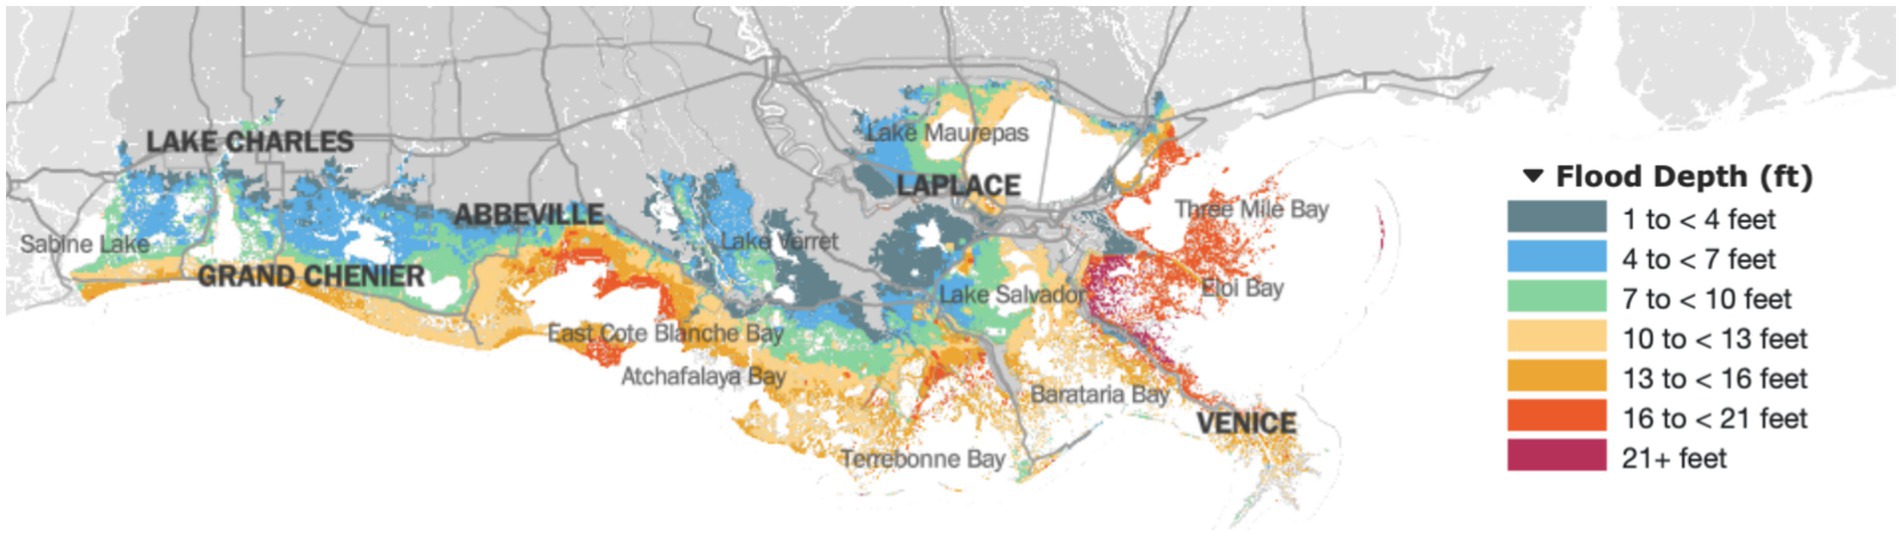
Figure 1. Study area and projected flood depths under a 1% annual exceedance probability (Lower Scenario in 2040 without protective action) (CPRA, 2023).
The Coastal Louisiana Risk Assessment (CLARA) model, developed to support the plan, utilizes high-resolution hydrodynamic simulations and the joint probability method with optimal sampling (JPM-OS) statistical framework to estimate flood depths with an annual exceedance probability (AEP) ranging from 50 to 0.05% (i.e., the “2-year flood” to the “2,000-year flood”). The model also estimates direct economic damage AEP distributions and expected annual damage (EAD) at the structure level (EAD is calculated via numerical integration of the damage associated with damage associated with 23 return periods). Monte Carlo simulation is used to estimate risks under a range of assumptions about future environmental and economic conditions and with different combinations of structural and nonstructural risk reduction projects on the landscape (Johnson et al., 2023). The study area is divided into 126,174 grid cells, with the topographic elevation assigned to each grid calculated as the median topographic elevation of all pixels from the digital elevation model within the grid cell. A baseline structure inventory consisting of 811,871 buildings in Louisiana was derived by combining a handful of different structure- and parcel-level datasets. The inventory contains each structure’s topographic elevation, foundation height, number of stories, total square footage, presence of garages, community median household income, and other attributes relevant to estimating its replacement cost and the damage that would accrue from various levels of flooding (known as a depth-damage relationship). Full details related to the CLARA model are available in Fischbach et al. (2021) and Johnson et al. (2023).
From the comprehensive CLARA datasets, we can generate useful inputs for our study. The expected annual damage of homeowner in year , denoted as , is calculated as described above. For homeowner , we approximate the market value of their structure by its replacement cost , which is calculated as the product of an estimated unit cost per square foot and the total square footage (Federal Emergency Management Agency, 2021). The unit cost per square foot differs by factors such as the number of stories, construction class (economy, average, custom, luxury), presence of garages, and community median household income. The government is responsible for demolishing the structure of homeowner if the homeowner chooses to relocate. The cost to demolish the structure of homeowner h,1 , is approximately calculated by the sum of a fixed cost ($7,275) and a variable cost proportional to the total square foot of the structure ($12 per square foot), where these values are taken from a professional site planning company (Fixr.com, 2022). The expected annual damage, replacement costs and relocation costs are expressed in 2020 U.S. dollars, with inflation adjustments made to account for inflation up to that year. And thus, replacement costs and relocation costs are assumed to remain constant in real terms over the next 50 years.
2.2 Homeowner relocation decisions
We consider a 20-year planning horizon. From year 0 to year 20, homeowners decide whether to relocate or not by comparing the cost of relocation with future flood risks at the beginning of each year. For the purposes of this analysis, we ignore the possibility that homeowners in high-risk regions would sell their houses, assuming that either revised zoning restrictions or the loss of market value associated with high flood hazard makes this a less attractive option. Therefore, we assume homeowners who choose to relocate will forfeit the current market value of their houses and purchase a house of comparable value at a new location. Under such an assumption, the cost of relocation for homeowner is the market value of their house, which is approximated by the replacement cost . We also assume homeowners have an annual discount rate and the government has a discount rate . We acknowledge that our assumption—equating relocation costs to a home’s replacement cost—is a simplification, as relocation expenses often exceed structural value due to factors such as moving costs, housing market differentials, and financial burdens on homeowners (Greer et al., 2022; Loughran and Elliott, 2019; Siders, 2019). In year , the future flood risks perceived by homeowner are calculated as the net present value of future flood loss over a 30-year period
where is the future flood loss mitigated if homeowner decides to relocate in year . When homeowners make their relocation decisions spontaneously without intervention from the government, we call this setting self-relocation. Under the self-relocation, homeowner will not relocate until the first year that the future flood loss mitigated by the relocation is greater than the cost of relocation , and the relocation year of self-relocation is denoted as .
When the government wishes to influence the homeowners’ decision-making process, there are two possible settings, fixed-subsidy-relocation and optimal-subsidy-relocation. Under fixed-subsidy-relocation, to motivate earlier relocation, the government is willing to offer a subsidy valued at a fixed percentage of the house’s market value to each homeowner. Homeowner will not relocate until the first year that the future flood loss mitigated by the relocation is greater than the cost of relocation , and the relocation year of homeowner under the fixed-subsidy-relocation is denoted as . The government implicitly affects homeowners’ relocation decisions under the fixed-subsidy-relocation; however, this might not be the optimal solution for the government. By tailoring the year to offer subsidy and the subsidy amount offered to each homeowner, the government can minimize the sum of flood losses and subsidy expenses. This setting is what we call optimal-subsidy-relocation, and how it works is elaborated in the Government-Homeowners Interaction section that follows.
2.3 Government-homeowners interaction
The government is interested in expanding the collective social welfare, meaning that it aims to minimize collective flood losses before relocations and the costs required to incentivize any desirable relocations. As part of the government’s objective function, the collective expected flood losses are calculated as the sum of flood losses between year 0 and the relocation year for all homeowners, discounted by the government discount rate . There is no interaction between the government and homeowners in the case of self-relocation, and collective flood losses of self-relocation are calculated as
Note that we thus make an implicit simplifying assumption that families who relocate move to an area that does not experience flood losses over the rest of the timeline. As flood losses are a function of an expected annual damage, the left-hand side of this and other equations is an expected value, but we leave this out of the mathematical notation for clarity.
Collective flood losses in the case of fixed-subsidy-relocation are calculated in a similar way, with the self-relocation year being replaced by the fixed-subsidy-relocation year,
Under optimal-subsidy-relocation, suppose the government is willing to offer a subsidy to motivate homeowner to relocate in year . The subsidy must be at least equal to to ensure that homeowner accepts the offer, as the flood risk reduction from relocation exceeds the cost. The government can tailor the subsidy amount offered to homeowner under optimal-subsidy-relocation. The government seeks to minimize collective flood losses and subsidy expenses by optimizing the year to offer the subsidy, which is the solution to the following optimization problem:
Once the year to offer a subsidy is optimized for each homeowner, collective flood losses in the case of optimal-subsidy-relocation can be calculated as,
To prevent a large amount of subsidy from being allocated to mitigate a small amount of flood losses, we introduce a benefit–cost qualification procedure for both fixed-subsidy-relocation and optimal-subsidy-relocation. Suppose is the motivated relocation year for homeowner and is the amount of subsidy offered. If the dollar value of flood losses mitigated by accepting the buyout in the given year is less than the subsidy offered, i.e., , then the government will not offer a subsidy to homeowner , and instead, the homeowner may relocate later under the self-relocation setting.
3 Case study results
We evaluate the outcomes of two subsidized relocation modes under both Lower and Higher environmental scenarios, and we perform a sensitivity analysis to assess how varying discount rate assumptions influence these outcomes. Equity considerations are integrated into the baseline results. Given the uncertainty surrounding future climate-related environmental conditions, a scenario-based approach is critical for informed decision-making. The Lower and Higher scenarios differ in their assumptions regarding future climate drivers (e.g., sea level rise, storm intensity, precipitation) and other factors like land subsidence. The Lower scenario represents a more moderate future condition, while the higher scenario represents a more severe condition (Coastal Protection and Restoration Authority, 2023) with respect to underlying flood hazard. We do not assign probabilities to either scenario but instead present relocation outcomes for both.
In the baseline case, we set the government’s discount rate at 3%, a standard rate commonly applied by the U. S. Army Corps of Engineers in the evaluation of flood protection projects (US Army Corps of Engineers, 2020). The homeowners’ discount rate is set at 12%, which lies between the approximate average return on real estate investments (10%) (Abdul-Samad, 2018), and the typical interest rate on credit card debts (18%), for consistency with previous work in this area (Bier et al., 2020).
3.1 Relocation number and risk mitigation
Figure 2 illustrates the cumulative number of relocations over time (top panels) and the yearly Expected Annual Damage (EAD) reduction (bottom panels) under both fixed-subsidy-relocation and optimal-subsidy-relocation. A substantial number of self-relocations (approximately 16,000 homeowners) occur earlier in the planning horizon, highlighting the considerable flood risks currently faced in coastal Louisiana. The difference between total relocations and self-relocations in any given year represents the cumulative number of motivated relocations up to that year. Overall, optimal-subsidy-relocation results in a higher number of motivated relocations compared to fixed-subsidy-relocation. However, in the later years (except the final year), there are more motivated relocations under fixed-subsidy-relocation than under optimal-subsidy-relocation, particularly under the Higher scenario. This occurs because, under fixed-subsidy-relocation, subsidies are immediately provided when projected flood risks exceed relocation coasts. In contrast, under the optimal-subsidy-relocation, the government may delay subsidies if relocation is not yet deemed optimal. In the final year, even if it is not optimal to provide subsides earlier, the government is still likely to offer subsidies to homeowners who meet the benefit–cost qualification, as doing so minimizes the government’s objective within the planning horizon. This explains the sharp increase in relocations in the final year under optimal-subsidy-relocation, reflecting a degree of flexibility inherent in this approach.
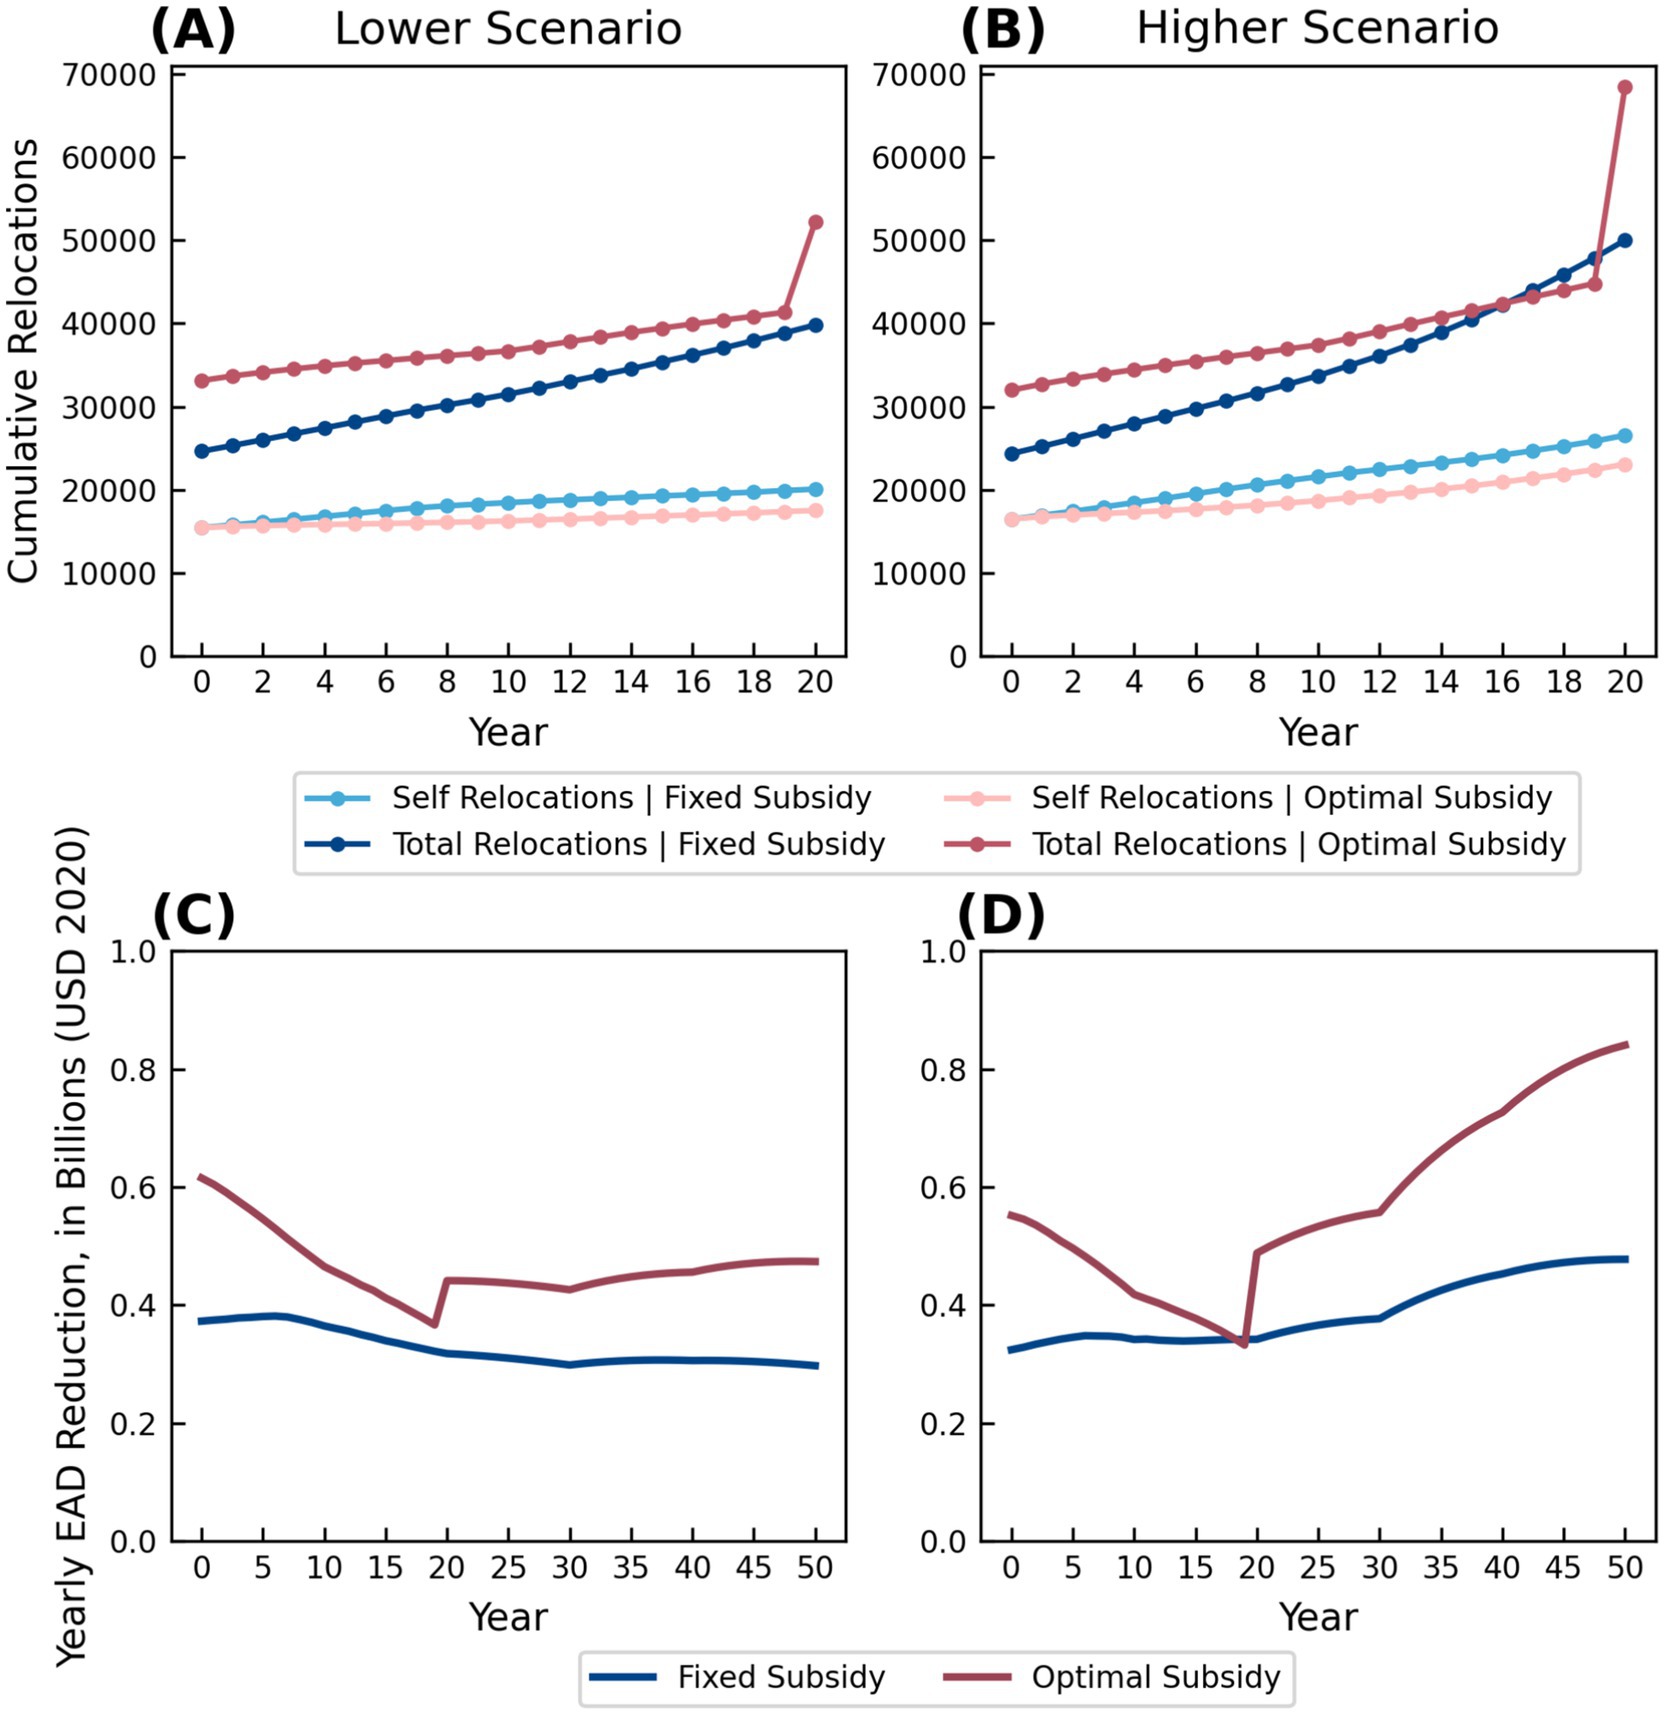
Figure 2. Relocation outcomes of the baseline case ( ). Panels (A,B) depict the cumulative number of relocations over a 20-year planning horizon, disaggregated into self-relocations (light blue/red) and total relocations (dark blue/red) for fixed-subsidy-relocation and optimal-subsidy-relocation under Lower (A) and Higher (B) environmental scenarios. Panels (C,D) illustrate the yearly Expected Annual Damage (EAD) reduction (in billions, USD 2020) for fixed-subsidy-relocation (in dark blue) and optimal-subsidy-relocation (in dark red) under Lower (C) and Higher (D) environmental scenarios, respectively. The yearly EAD reduction extends beyond the 20-year planning period due to the rolling 30-year evaluation window.
The EAD reduction in year is calculated as the difference between the sum of discounted EAD for all homeowners who have not relocated by year under self-relocation, and the sum of discounted EAD for all homeowners who have not relocated by year under fixed/optimal-subsidy-relocation. Both subsidized relocation strategies show substantial yearly EAD reductions within and beyond the planning horizon; keep in mind that the relocation policy offers subsidies over a 20-year period, but the decision to offer or accept a subsidy is based on the net present value of expected losses and subsidy costs over a rolling 30-year window, resulting in EAD reduction extending over a 50-year period. Fixed-subsidy-relocation achieves a stable yearly EAD reduction of approximately $0.3 billion/$0.4 billion under the Lower/Higher scenario, respectively. Optimal-subsidy-relocation results in a yearly EAD reduction of at least $0.4 billion under both scenarios, with reductions reaching up to $0.6 billion/$0.85 billion under the Lower/Higher scenario. Notably, optimal-subsidy-relocation demonstrates superior risk reduction effects beyond the planning horizon, particularly under the Higher scenario. This is due to the large number of motivated relocations in the final year, which effectively eliminate future flood risks for a substantial number of homeowners. As a result, optimal-subsidy relocation achieves greater overall risk reduction, especially in the more severe scenario.
3.2 Benefit–cost analysis
We calculate the benefit–cost ratio for each subsidized relocation and rank all relocations in descending order based on their benefit–cost ratios. Figure 3 illustrates the relationship between the cumulative benefit–cost ratio and the cumulative subsidy (i.e., “cumulative” as subsidies are offered to marginally less attractive properties). Optimal-subsidy-relocation outperforms fixed-subsidy-relocation, as the cumulative benefit–cost ratio for optimal-subsidy-relocation is consistently higher than that of fixed-subsidy-relocation for the same subsidy budget. This underscores the superior ability of optimal-subsidy-relocation to target the most cost-effective subsidized relocations. Under the Lower scenario, the highest benefit–cost ratio for fixed-subsidy-relocation is approximately 9.0, whereas it exceeds 20.0 for optimal-subsidy-relocation. This disparity arises because flood risks for some homeowners remain stable and moderate, with future flood risks close to but not exceeding the self-relocation costs. In fixed-subsidy-relocation, the government must offer 50% of the market value of these structures to incentivize relocations. However, in optimal-subsidy-relocation, the government can strategically lower subsidies by leveraging homeowners’ awareness of future flood risks, resulting in a higher benefit–cost ratio from the government perspective. For both relocation modes, the cumulative benefit–cost ratio curve shifts upward and to the right under the Higher scenario compared to the Lower scenario. This shift reflects the increased cost-effectiveness of pre-disaster relocations in the Higher scenario, where projected flood risks—due to intensified storm activity and accelerated sea level rise—lead to greater long-term damages if no action is taken. When the subsidy budget is unlimited, both subsidized relocation modes achieve an overall benefit–cost ratio of approximately 2.5, further demonstrating the overall effectiveness of nonstructural flood risk mitigation projects.
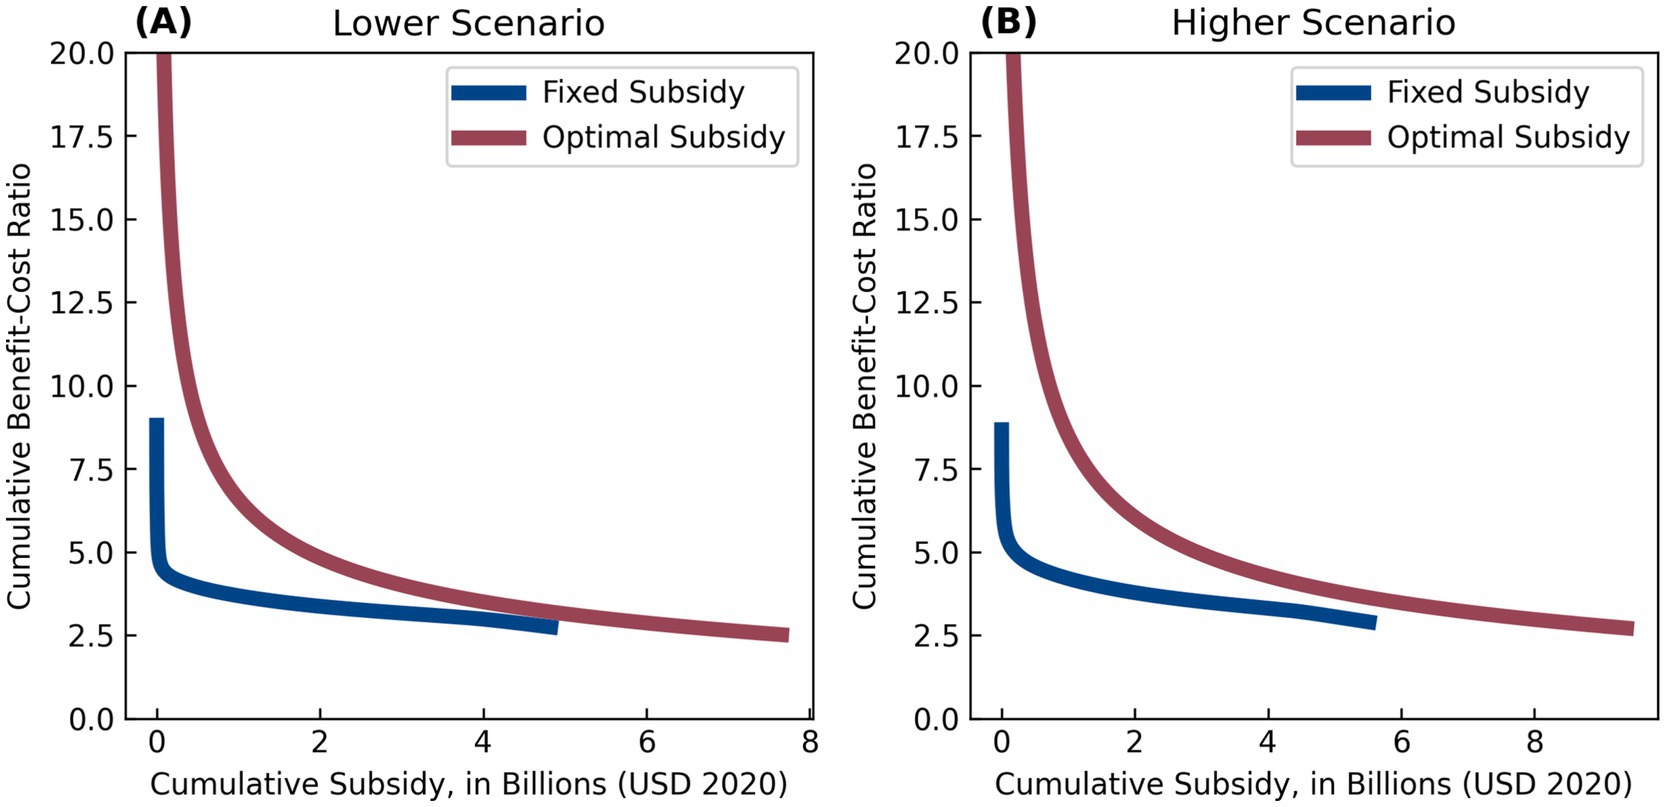
Figure 3. Cumulative benefit–cost ratio performance of fixed-subsidy-relocation (blue) and optimal-subsidy-relocation (red) under Lower (A) and Higher (B) environmental scenarios.
3.3 Distributional impacts by race and income
By integrating census block group-level demographic data into the relocation outcomes, we analyze the distributional impacts of subsidized relocations across racial and income groups. Figure 4 presents the estimated flood risk reduction benefits and subsidy costs disaggregated by race (Figures 4A,B) and poverty-income ratio (PIR) (Figures 4C,D). All monetary values are discounted to year 0 and measured in billions of USD (2020). To estimate the distribution of costs and benefits, this study assumes demographic homogeneity within census block groups. This means that for a block group where 40% of households have a PIR between 1 and 2, and 60% have a PIR over 2, 40% of the cost of subsidizing a household in that block group is allocated to the PIR 1–2 category, and 60% to the PIR above 2 category. This proportional allocation allows for an unbiased estimation of equity impacts when aggregated at the coastal zone level.
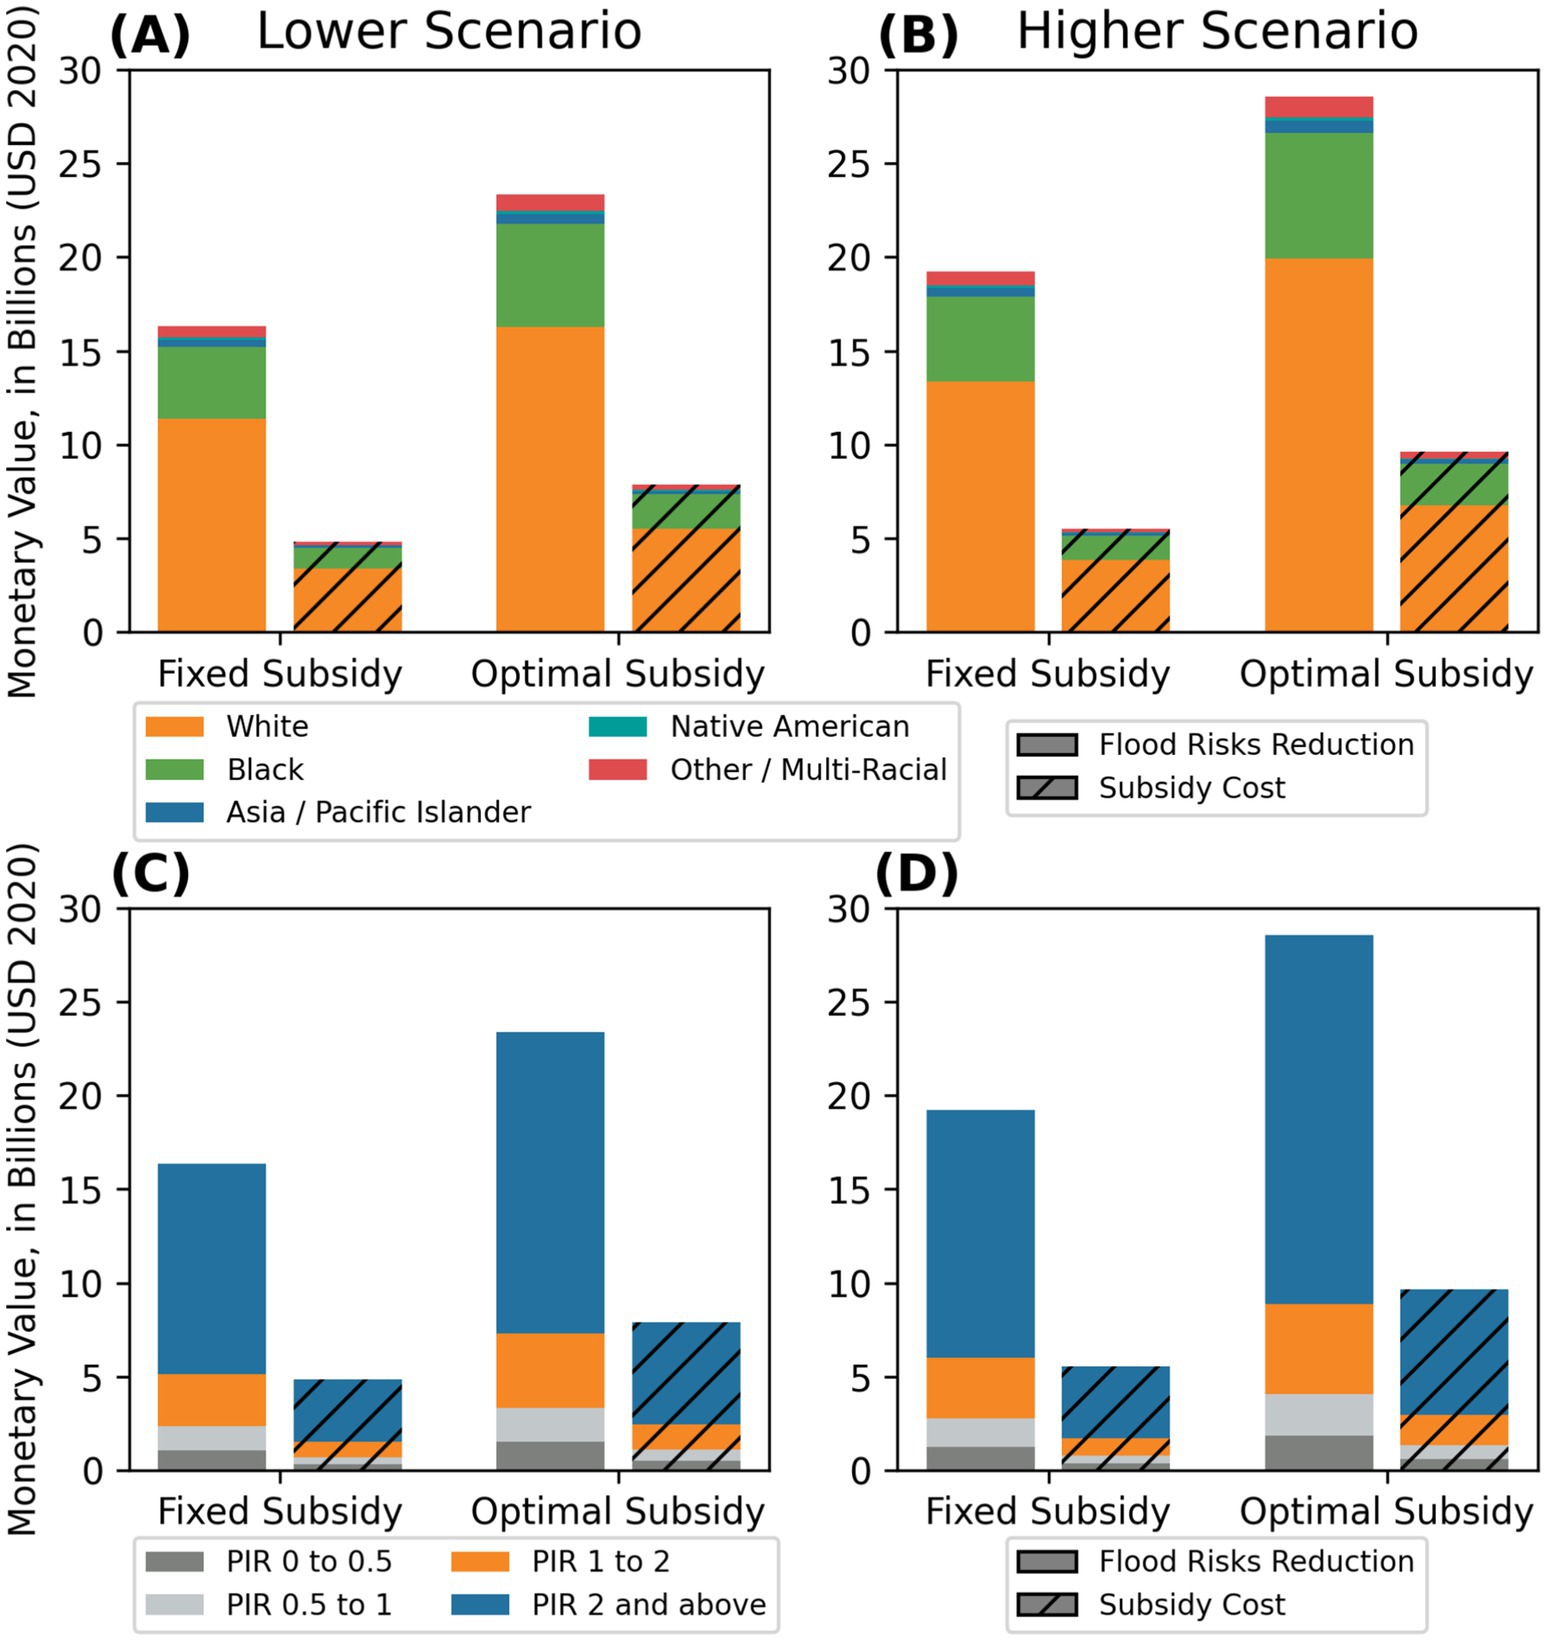
Figure 4. Distributional impacts of subsidized relocations by race and income group. Panels (A,B) show the distribution of flood risk reduction benefits and subsidy costs disaggregated by racial groups, while panels (C,D) present the same outcomes categorized by poverty-income ratio (PIR). Fixed-subsidy-relocation and optimal-subsidy-relocation are compared under two different future scenarios: Lower Scenario (A,C) and Higher Scenario (B,D). The stacked bars represent the total monetary value (in billions, USD 2020), with different colors corresponding to demographic subgroups. The striped portion of each bar represents the subsidy cost, while the solid portion represents the total flood risk reduction achieved through relocation. All monetary values are discounted to 2020.
Our results indicate that both fixed-subsidy-relocation and optimal-subsidy-relocation predominantly benefit white households and those with a PIR of 2 or higher. These groups also receive the largest portion of subsidy allocations. For example, in the study area, 66.70% of households belong to the White population. Under the Lower scenario, this group receives $3.37 billion/$5.49 billion in subsidies and gains approximately $16.26 billion/$11.38 billion in flood risk reduction in the optimal/fixed-subsidy-relocation, respectively. This accounts for 69.66%/69.67% of total subsidies and 69.65%/69.61% of total flood risk reduction under the optimal/fixed-subsidy-relocation, respectively. Despite these differences in absolute benefits, the benefit–cost rations remain consistent across all racial and income groups, indicating that subsidy allocation does not introduce significant disparities in utility across demographic categories. Our findings suggest that subsidized pre-disaster relocations do not exacerbate existing procedural equity issues, as subsidy efficiency remains comparable across groups under both relocation modes.
Examining relocation outcomes at the per capita level provides additional insights into equity considerations. Figure 5 presents the demographic composition, average expected structural damage (self-relocation vs. optimal-subsidy-relocation), average flood risks (self-relocation vs. optimal-subsidy-relocation), and average subsidy across different racial and income groups under the Lower scenario. Results for other settings are also provided in Supplementary material. Expected Annual Structural Damage (EASD) is a flood risk metric analogous to Expected Annual Damage (EAD), with the key distinction that EASD assumes uniform value or replacement cost for all structures. Specifically, EASD estimates the expected annual structural damage, expressed as a proportion of its replacement cost. By treating all structures as having equal value, EASD provides a more objective measure of flood severity across structures. Since structures may undergo repetitive floods, and the same level of damage in any given year impacts homeowners equally, the EASD value is not discounted to present value (Year 0, i.e., 2020). Instead, we sum up the yearly EASD before relocation for each structure to account for its total expected structural damage. Figure 5 shows that average flood risk reduction and average structural damage reduction are similar across racial and income groups. However, the Black and Native American populations receive lower average subsidies compared to the White and Asia/Pacific populations. Given that average structural damage levels are comparable across racial and income groups, and the relative distribution of average subsidies mirrors the distribution of average flood risks, it is the value of structures and their contents that influences resource allocation (i.e., disparities in average structure replacement costs across racial and income groups).
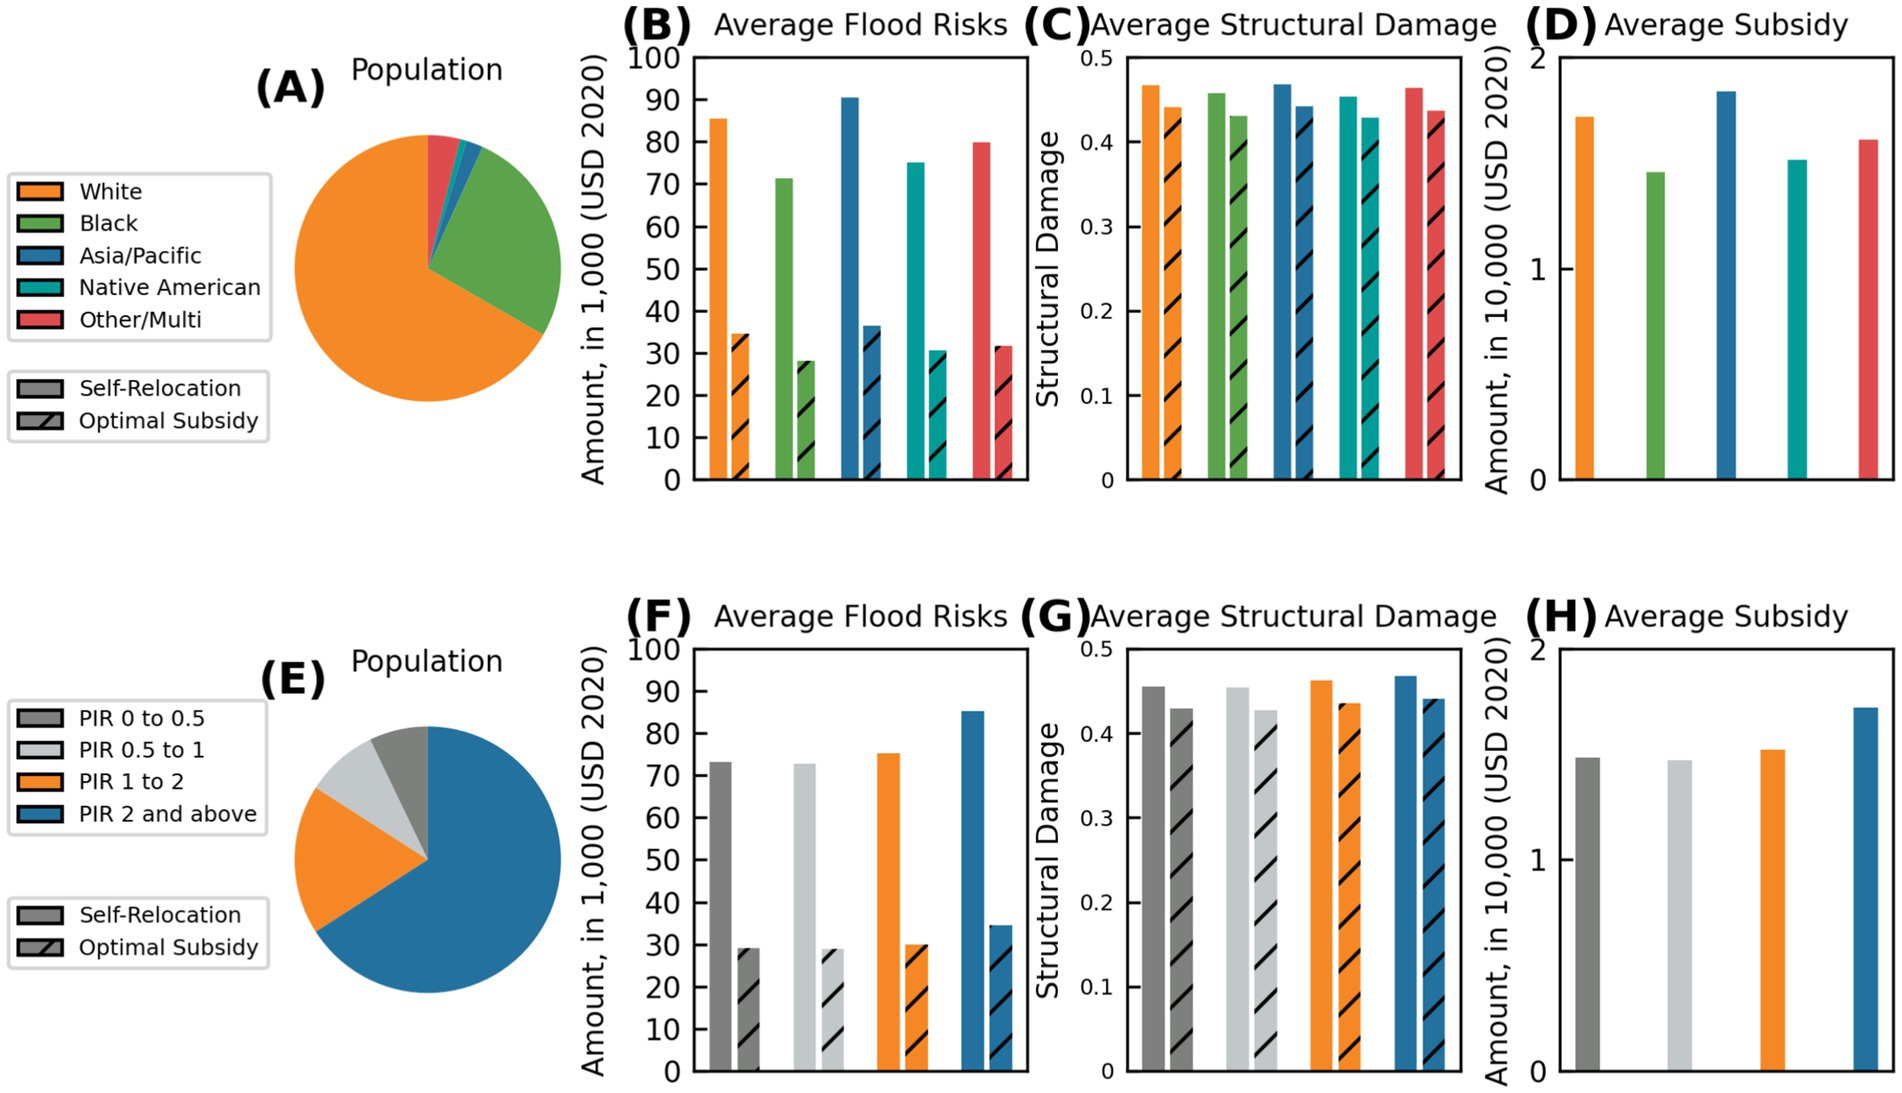
Figure 5. Population composition, average flood risks, average structural damage, and average subsidy allocation under optimal-subsidy-relocation in the Lower scenario. Panels (A,E) display the racial composition (A) and poverty-income ratio (PIR) composition (E) of the study area. Panels (B,F) present the average flood risks across racial and income groups, while panels (C,G) illustrate the average expected annual structural damage (EASD), a standardized measure of flood severity expressing structural damage as a percentage of replacement cost, rather than the monetary value of flood damage. Panels (D,H) show the average subsidy allocation under the optimal-subsidy-relocation. The solid portions of the bars indicate self-relocation outcomes, while the striped portions represent outcomes under the optimal-subsidy-relocation.
3.4 Subsidy allocation pattern
Funding agencies allocate resources to local administrative entities, typically at the county level (known as parishes in Louisiana), to facilitate implementation. This process necessitates fair distribution of subsidies among parishes. Figure 6 presents the subsidy allocation patterns across parishes, examining average flood loss, subsidy per household, and subsidy per relocation under both Lower and Higher scenarios. The results indicate a positive correlation between the average flood loss by homeowners in a parish and the average subsidy allocated to that parish, with Lafayette Parish and St. Martin Parish emerging as outliers. St. Martin Parish has 947 homeowners, and Lafayette Parish has 983, which is relatively small compared to other parishes that have thousands of homeowners (note that the CLARA model’s domain only includes parts of these parishes, so these numbers are not reflective of the total population in the parish; Supplementary material contains a table which details the number of single-family homes in each parish within the model domain). While it is reasonable to consider them as outliers, it also prompts further investigation into the factors contributing to their distinct subsidy allocation patterns.
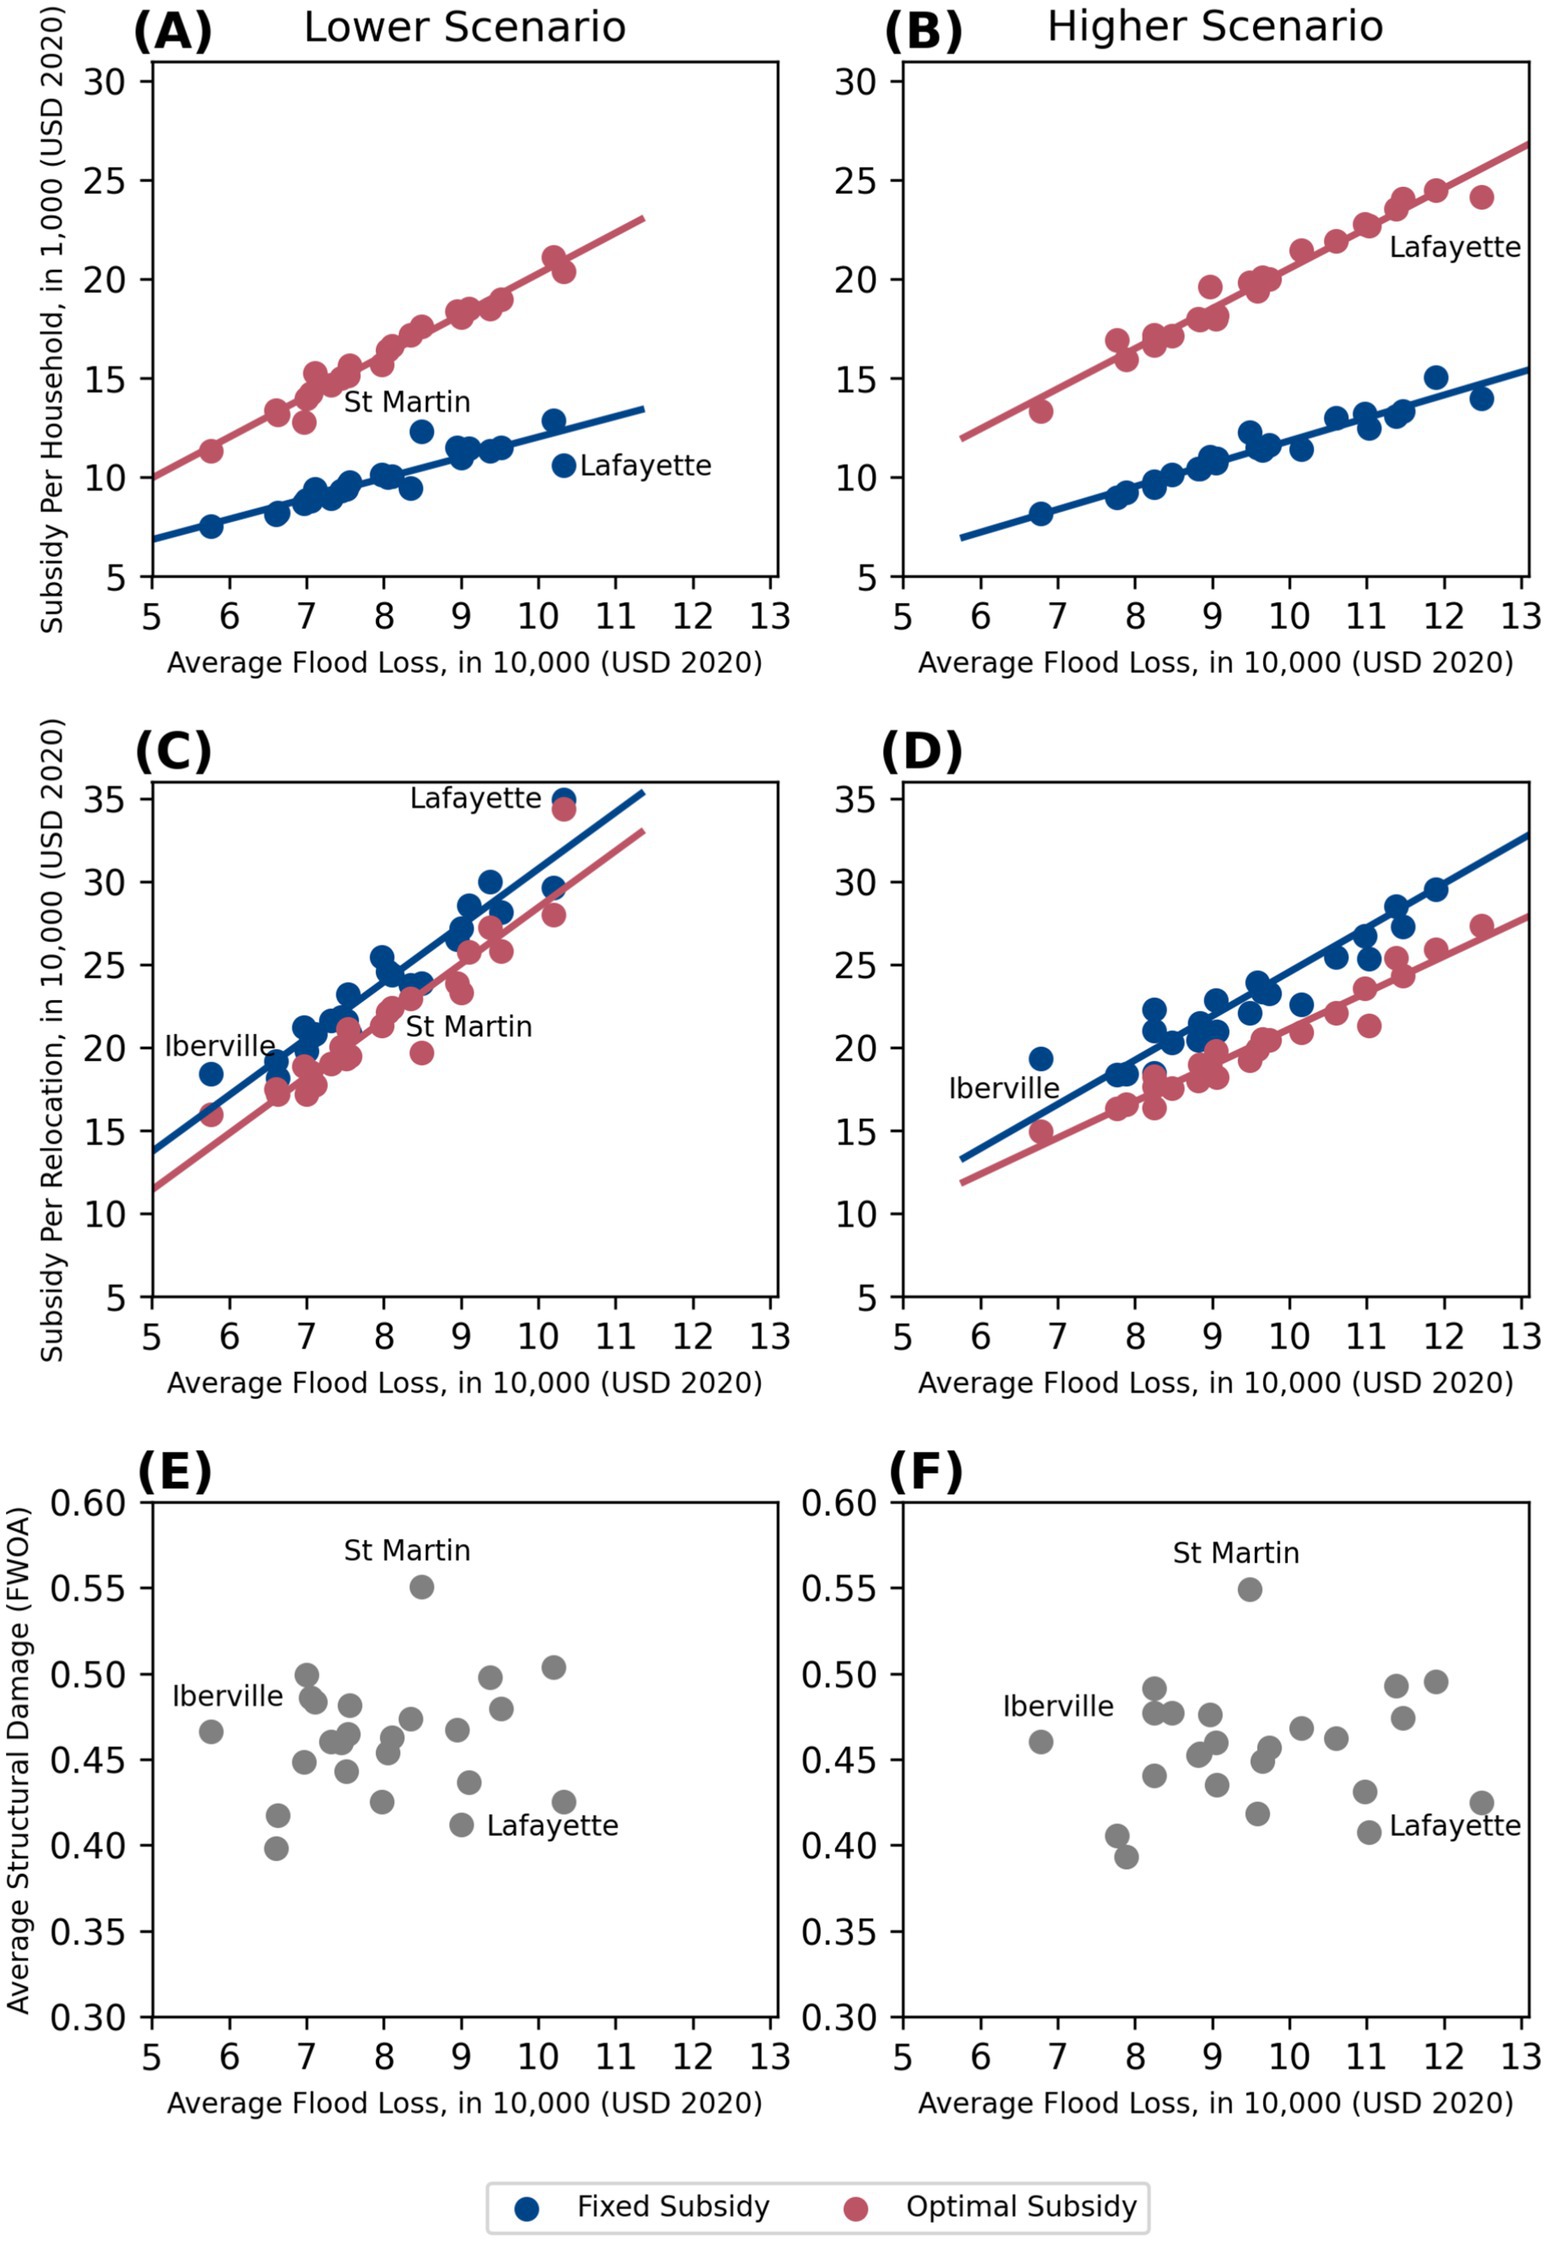
Figure 6. Parish-level subsidy allocation patterns under fixed-subsidy-relocation and optimal-subsidy relocation. Panels (A,B) illustrate the relationship between average flood loss per household and the average subsidy per household under Lower (A) and Higher (B) scenarios, highlighting discrepancies in allocation patterns for certain parishes. Panels (C,D) present the average subsidy per relocation, showing variation across parishes. Panels (E,F) depict average structural damage in the future without action (FWOA), offering insights into how flood risk severity influences subsidy distribution. Lafayette, St. Martin, and Iberville Perishes are labeled in each panel as notable cases for further analysis.
The subsidy per household in Lafayette Parish is lower than expected under both Lower and Higher scenarios, whereas in St. Martin Parish, it is higher than expected under the Lower scenario. This discrepancy can be partially explained by the average structural damage, as shown in the bottom two panes of Figure 6. St. Martin Parish exhibits the highest average structural damage, indicating that a massive portion of homeowners there face severe flood risks, leading to a great number of subsidized relocations. In contrast, fewer subsidized relocations occur in Lafayette Parish, likely due to the low average structural damage or because wealthier homeowners choose to self-relocate to avoid substantial flood losses. When examining the average subsidy per subsidized relocation, as shown in the middle two panes in Figure 6, we observe that homeowners in Lafayette Parish receive a higher subsidy per relocation due to the high structure values, averaging $901,395. In contrast, the subsidy per relocation in St. Martin Parish is lower than expected due to the lower structure values (averaging $595,700) and the large number of subsidized relocations resulting from high structural damage. Additionally, it is noteworthy that homeowners in Iberville Parish receive a higher subsidy per relocation despite experiencing the least flood loss. The low flood loss is attributed to the relatively low structural values, averaging $481,891, while the higher subsidy per relocation is due to the high structural damage faced by these homeowners.
Interestingly, although each parish experiences greater flood losses under the Higher scenario, the subsidy required per relocation is lower than under the Lower scenario. This suggests that homeowners are more inclined to relocate independently and require less government incentive when they perceive higher future flood risks, highlighting the importance of increasing homeowners’ awareness of future risks. Our findings indicate that the current subsidy allocation method, which is based on projected monetary flood risks, generally distributes subsidies among parishes according to their flood risks. However, it is inevitable that wealthier parishes receive more subsidies, while the most flood-affected parishes receive comparatively less support. Incorporating non-monetary, equity-centric metrics into the allocation process could potentially address this disparity, as suggested by Geldner et al. (2023).
4 Discussion and concluding remarks
As climate change intensifies, reducing flood risks in the coastal and riverine communities has become a critical priority. Relying solely on structural solutions such as levees, sea walls, or dams is often either impractical or economically unattractive. While nonstructural measures such as home elevations and floodproofing can help mitigate flood risks, they may still leave considerable and undesirable residual risks. Relocating residents from high-risk areas offers a more long-term solution to elimination of flood risk. However, existing post-disaster buyout programs face well-documented challenges. To address the limitations of current post-disaster buyout practices, pre-disaster relocations supported by government subsidies (Bier et al., 2020; Zhou, 2022) have been developed and theoretically demonstrate superior cost-effectiveness in reducing future flood risks. Leveraging comprehensive datasets from Louisiana’s Coastal Master Plan, this paper evaluates the effectiveness of pre-disaster subsidized relocations under both lower and higher environmental scenarios using game-theoretic optimization with high-resolution structural-level flood risk and relocation cost estimates. Our findings indicate that both fixed-subsidy-relocation and optimal-subsidy-relocation effectively incentivize homeowners to advance their relocation timelines, yielding benefit–cost ratios of at least 2.5. The more severe the anticipated future environment conditions, the more advantageous these earlier relocations become. The results further demonstrate that optimal-subsidy-relocation leads to more frequent and earlier relocations while preventing excessive subsidy offers, resulting in broader coverage and higher cost efficiency.
Pre-disaster relocations address some of the major inefficiencies in post-disaster buyout programs, such as reducing hardships associated with both disasters and relocations and allowing sufficient time for lengthy implementation processes (Curran-Groome et al., 2021). However, several limitations remain. Recipients of pre-disaster buyout offers still face significant challenges, including patchwork implementation across jurisdictions (Zavar and Hagelman III, 2016) and the possibility that homeowners move to other flood-prone areas due to affordability constraints or a lack of available housing in lower-risk regions (Hotard and Ross, 2025; McGhee et al., 2020). Moreover, many individuals rely on local job markets and social networks (Greer et al., 2022, 2019), and psychological factors such as home/community attachment (Cooper et al., 2022) are not well considered in the current framework. Despite these limitations, this study remains a valuable contribution because its goal is not to prescribe specific policy recommendations but to evaluate the potential feasibility and overall performance of pre-disaster relocation as a risk-reduction strategy.
Several interesting research directions can thus emerge from this work. The decision-making process employed in this study is primarily based on economic comparisons. However, we recognize that relocation decisions are also influenced by non-monetary factors, such as attachment to one’s home, proximity to work, and the demographic characteristics of homeowners. Incorporating bounded rationality and alternative decision heuristics into the modeling framework could make the model more realistic by accounting for these factors. In our time of exploring this body of work, we have not come across studies that address any differences in rationality that the participants might display. While there are some promising starting points to talk about biases toward environmental risk, this work adds a step in the direction of modeling these biases and including them in decision frameworks to inform policymakers. Additionally, homeowners and the government may have differing perceptions of future flood risks, which could significantly impact relocation outcomes. Some pieces which we are already working to tackle in future work are the community impacts and neighborhood peer effects on buyout decisions. Coupled with ideas of bounded rationality and Bayesian learning in games, future work could address a major limitation of the study, making it closer to a policy-informing analysis. Investigating how these divergent perceptions influence the effectiveness of relocation subsidies presents an intriguing area for further research. Beyond the perspective of risk reduction, the government also faces a complex tradeoff between mitigating flood risks through resident relocations and the potential loss of tax revenue, which offers yet another avenue for future exploration. This opens an opportunity to explore hierarchical funding from the federal government versus local government in managed retreat policies. Another version of this opportunity could talk about increasing visibility of community grievances by inviting community leaders as stakeholders to the discussion around policymaking.
Our findings reveal that the distribution of subsidies and flood risk reduction benefits does not undermine the existing status of equity. However, the assessment of equity is influenced by the assumption of demographic homogeneity within census block groups. If demographic data were available at the structure level, the impact of relocation outcomes on different racial and income groups might vary slightly. Nevertheless, census blocks are the smallest geographic unit for which we have demographic data, and the presence of population migration dynamics further complicates the accurate and timely capture of structure-level demographic information. Aggregating data at the census block level, therefore, provides a balanced approach. For these reasons, we believe that our equity analysis remains robust and credible.
Our analysis confirms that pre-disaster relocations allocate resources to parishes basically in proportion to their flood risks, aligning with principles of procedural equity. However, it is important to recognize that fair resource distribution based on flood risk reduction alone may inadvertently reinforce pre-existing structural inequities, as communities historically subject to underinvestment and disproportionate flood exposure may continue to bear a greater burden of relocation (Stanley et al., 2023). This phenomenon has been widely observed in buyout programs, where funding mechanisms – though objectively risk-based – can still result in justice and equity challenges in implementation (De Vries and Fraser, 2012; Loughran and Elliott, 2019; Siders, 2019). A similar pattern emerges in our findings, where some parishes with high values of structural risk receive less subsidy support due to the underlying allocation framework. This underscores the reality that equity cannot always be achieved solely through equal distribution measures. To better account for these concerns, alternative equity-focused risk metrics, such as those proposed by Geldner et al. (2023), could be integrated into future analyses. These alternative metrics would help to ensure that policy feasibility is not achieved at the cost of social equity, providing a more comprehensive approach to just flood risk mitigation.
Global sensitivity analyses provided no insightful patterns or conclusions. However, the numerous local (i.e., one at a time) sensitivity studies, help us infer that the numbers of relocations in fixed subsidy mode and optimal subsidy mode are sensitive to both government and homeowners’ discount rates. We also conducted exploratory analyses to identify the factors driving variations in relocation behaviors. Specifically, we examined whether certain structural characteristics, such as square footage, elevation, and foundation height, as well as flood risk-related factors, including 100-year flood depths and the probability of flooding, consistently lead to specific types of relocations. The details of these exploratory analyses are provided in Supplementary material.
Data availability statement
Publicly available datasets were analyzed in this study. This data can be found at: https://mpdap.coastal.la.gov/.
Author contributions
FL: Conceptualization, Investigation, Methodology, Visualization, Writing – original draft, Writing – review & editing. PJ: Conceptualization, Investigation, Methodology, Visualization, Writing – original draft, Writing – review & editing. DJ: Conceptualization, Data curation, Funding acquisition, Investigation, Methodology, Project administration, Resources, Supervision, Writing – review & editing.
Funding
The author(s) declare that financial support was received for the research and/or publication of this article. This research was supported by funding from the National Science Foundation (NSF) under Award Numbers 2017544 and 2238060.
Acknowledgments
The authors would like to express their sincere gratitude to Vicki Bier and Yuqun Zhou for their prior work and feedback which greatly informed this research. The authors would also like to extend their thanks to Nathan Geldner for support in obtaining demographic data.
Conflict of interest
The authors declare that the research was conducted in the absence of any commercial or financial relationships that could be construed as a potential conflict of interest.
Generative AI statement
The authors declare that no Gen AI was used in the creation of this manuscript.
Publisher’s note
All claims expressed in this article are solely those of the authors and do not necessarily represent those of their affiliated organizations, or those of the publisher, the editors and the reviewers. Any product that may be evaluated in this article, or claim that may be made by its manufacturer, is not guaranteed or endorsed by the publisher.
Supplementary material
The Supplementary material for this article can be found online at: https://www.frontiersin.org/articles/10.3389/fclim.2025.1514456/full#supplementary-material
Footnotes
1. ^This analysis is restricted to single-family residences due to its prevalence and the fact that single-family residences are the primary recipients of buyout subsidies. We use the generic term “homeowner” for the potential seller of the property, ignoring the complexities of decision-making for owner-occupants versus non-occupant landlords.
References
Abdul-Samad, H.. (2018). What’s the average return on investment in the US real estate market? Learn real estate investing | Mashvisor real estate blog. Available online at: https://www.mashvisor.com/blog/average-return-on-investment-us-real-estate-market/ (Accessed September 22, 2024).
Atoba, K. O., Brody, S. D., Highfield, W. E., Shepard, C. C., and Verdone, L. N. (2021). Strategic property buyouts to enhance flood resilience: a multi-criteria spatial approach for incorporating ecological values into the selection process. Environ. Hazards 20, 229–247. doi: 10.1080/17477891.2020.1771251
Bier, V. M., Zhou, Y., and Du, H. (2020). Game-theoretic modeling of pre-disaster relocation. Eng. Econ. 65, 89–113. doi: 10.1080/0013791X.2019.1677837
Binder, S. B., Baker, C. K., and Barile, J. P. (2015). Rebuild or relocate? Resilience and Postdisaster decision-making after hurricane Sandy. Am J Comm Psychol 56, 180–196. doi: 10.1007/s10464-015-9727-x
Binder, S. B., Greer, A., and Zavar, E. (2020). Home buyouts: a tool for mitigation or recovery? Dis Prevent Manage 29, 497–510. doi: 10.1108/DPM-09-2019-0298
Brody, S. D., and Highfield, W. E. (2013). Open space protection and flood mitigation: a national study. Land Use Policy 32, 89–95. doi: 10.1016/j.landusepol.2012.10.017
Bukvic, A., and Owen, G. (2017). Attitudes towards relocation following hurricane Sandy: should we stay or should we go? Disasters 41, 101–123. doi: 10.1111/disa.12186
Coastal Protection and Restoration Authority (2023). Louisiana’s comprehensive master plan for a sustainable coast (no. 4th edition). Baton Rouge, Louisiana: Coastal Protection and Restoration Authority.
Cooper, C., Helgeson, C., Troy, C. L. C., and Tuana, N. (2022) What do people care about when managing flood risks? A values-informed mental model approach. SocArXiv. doi: 10.31235/osf.io/wkgjp
CPRA (2023). Louisiana’s 2023 coastal master plan data viewer. Available online at: https://mpdv.coastal.la.gov/?_gl=1*6uias3*_ga*NTY0NzU4Nzc4LjE3Mjg3NjQ3NzE.*_ga_QXZEQ3TW20*MTcyODc2NDc3MC4xLjEuMTcyODc2NDc3NS41NS4wLjA.#map=7.18/28.959/-91.51&view=flood-depth&year=20&aep=1.0 (Accessed October 12, 2024).
Curran-Groome, W., Haygood, H., Hino, M., BenDor, T. K., and Salvesen, D. (2021). Assessing the full costs of floodplain buyouts. Clim. Chang. 168:3. doi: 10.1007/s10584-021-03178-x
De Vries, D. H. (2017). Temporal vulnerability and the post-disaster ‘window of opportunity to woo:’ a case study of an African-American floodplain neighborhood after hurricane Floyd in North Carolina. Hum. Ecol. 45, 437–448. doi: 10.1007/s10745-017-9915-4
De Vries, D. H., and Fraser, J. C. (2012). Citizenship rights and voluntary decision making in post-disaster U.S. floodplain buyout mitigation programs. Int J Mass Emerg Dis 30, 1–33. doi: 10.1177/028072701203000101
Federal Emergency Management Agency (2021). Hazus hurricane model technical manual. Washington, D.C: Federal Emergency Management Agency.
Fischbach, J. R., Johnson, D. R., Wilson, M. T., Geldner, N. B., and Stelzner, C. (2021). Coastal master plan: Attachment E2: Model improvement report, risk assessment (no. version 2). Baton Rouge, Louisiana: Coastal Protection and Restoration Authority.
Fixr.com. (2022). Cost to demolish house | residential demolition cost. Available online at: https://www.fixr.com/costs/house-demolition (Accessed October 7, 2024).
Geldner, N., Johnson, D., Doss-Gollin, J., and Keller, K. (2023). Efficient flood risk mitigation and intersectional equity implications: A case study in New Orleans. ResearchSquare preprint. doi: 10.21203/rs.3.rs-3098000/v1
Green, T. F., and Olshansky, R. B. (2012). Rebuilding housing in New Orleans: the road home program after the hurricane Katrina disaster. Hous. Policy Debate 22, 75–99. doi: 10.1080/10511482.2011.624530
Greer, A., and Brokopp Binder, S. (2017). A historical assessment of home buyout policy: are we learning or just failing? Hous. Policy Debate 27, 372–392. doi: 10.1080/10511482.2016.1245209
Greer, A., Brokopp Binder, S., and Zavar, E. (2022). From hazard mitigation to climate adaptation: a review of home buyout program literature. Hous. Policy Debate 32, 152–170. doi: 10.1080/10511482.2021.1931930
Greer, A., Trainor, J., and McNeil, S. (2019). Voluntary household relocation decision making in the wake of disaster: re-interpreting the empirical record. Int. J. Mass Emerg. Disasters 37, 197–226. doi: 10.1177/028072701903700206
Hinkel, J., Lincke, D., Vafeidis, A. T., Perrette, M., Nicholls, R. J., Tol, R. S. J., et al. (2014). Coastal flood damage and adaptation costs under 21st century sea-level rise. Proc. Natl. Acad. Sci. USA 111, 3292–3297. doi: 10.1073/pnas.1222469111
Hotard, A. E., and Ross, A. D. (2025). Home buyout without relocation: an examination of dissonant hazard mitigation perceptions among Gulf Coast residents. Risk Hazards Crisis Public Policy 16:e12284. doi: 10.1002/rhc3.12284
Johnson, D. R., Fischbach, J. R., Geldner, N. B., Wilson, M. T., Story, C., and Wang, J. (2023). Coastal master plan: attachment C11: 2023 risk model (no. version 2). Baton Rouge, Louisiana: Coastal Protection and Restoration Authority.
Kick, E. L., Fraser, J. C., Fulkerson, G. M., McKinney, L. A., and De Vries, D. H. (2011). Repetitive flood victims and acceptance of FEMA mitigation offers: an analysis with community–system policy implications. Disasters 35, 510–539. doi: 10.1111/j.1467-7717.2011.01226.x
Loughran, K., and Elliott, J. R. (2019). Residential buyouts as environmental mobility: examining where homeowners move to illuminate social inequities in climate adaptation. Popul. Environ. 41, 52–70. doi: 10.1007/s11111-019-00324-7
Ludy, J., and Kondolf, G. M. (2012). Flood risk perception in lands “protected” by 100-year levees. Nat. Hazards 61, 829–842. doi: 10.1007/s11069-011-0072-6
McGhee, D. J., Binder, S. B., and Albright, E. A. (2020). First, do no harm: evaluating the vulnerability reduction of post-disaster home buyout programs. Nat. Hazards Rev. 21:05019002. doi: 10.1061/(ASCE)NH.1527-6996.0000337
Mobley, W., Atoba, K. O., and Highfield, W. E. (2020). Uncertainty in flood mitigation practices: assessing the economic benefits of property acquisition and elevation in flood-prone communities. Sustain. For. 12:2098. doi: 10.3390/su12052098
National Academies of Sciences, Engineering, and Medicine (2024) Community-driven relocation: Recommendations for the US Gulf Coast region and beyond. Washington, DC: The National Academies Press.
Nelson, K. S., and Camp, J. (2020). Quantifying the benefits of home buyouts for mitigating flood damages. Anthropocene 31:100246. doi: 10.1016/j.ancene.2020.100246
Nofal, O. M., and Van De Lindt, J. W. (2021). High-resolution flood risk approach to quantify the impact of policy change on flood losses at community-level. Int. J. Disaster Risk Reduct. 62:102429. doi: 10.1016/j.ijdrr.2021.102429
Reidmiller, D. R., Avery, C. W., Easterling, D. R., Kunkel, K. E., Lewis, K. L. M., Maycock, T. K., et al. (2018). Impacts, risks, and adaptation in the United States: The fourth national climate assessment, volume II. Washington, D.C.: National Oceanographic and Atmospheric Administration: U.S. Global Change Research Program.
Shan, X., Wang, J., Wen, J., Hu, H., Wang, L., Yin, J., et al. (2022). Using multidisciplinary analysis to develop adaptation options against extreme coastal floods. Int. J. Disaster Risk Sci. 13, 577–591. doi: 10.1007/s13753-022-00421-6
Siders, A. R. (2019). Social justice implications of US managed retreat buyout programs. Clim. Chang. 152, 239–257. doi: 10.1007/s10584-018-2272-5
Siders, A. R., and Gerber-Chavez, L. (2021). Floodplain buyouts: Challenges, practices, and lessons learned. Newark, DE: University of Delaware Disaster Research Center.
Stanley, M., Hotard, A., Pilgreen, D., and Meyer, M. (2023). Critical review of national flood policy outcomes. J. Homeland Secur. Emerg. Manage. 20, 239–269. doi: 10.1515/jhsem-2021-0059
US Army Corps of Engineers (2020). Economic guidance memorandum, 20–01, federal interest rates for Corps of Engineers projects for fiscal year 2020. Washington, DC: US Army Corps of Engineers, Rock Island District.
US Army Corps of Engineers. (2024). Flood risk management. Available online at: https://www.mvr.usace.army.mil/Business-With-Us/Outreach-Customer-Service/Flood-Risk-Management/ (Accessed September 21, 2024).
Van Heerden, I. L. (2007). The failure of the New Orleans levee system following hurricane Katrina and the pathway forward. Public Adm. Rev. 67, 24–35. doi: 10.1111/j.1540-6210.2007.00810.x
Wang, D., Davidson, R. A., Nozick, L. K., Trainor, J. E., and Kruse, J. L. (2020). Computational framework to support government policy-making for hurricane risk management. Nat. Hazards Rev. 21:04019012. doi: 10.1061/(ASCE)NH.1527-6996.0000348
Weber, A., and Moore, R. (2019). Going under: Long wait times for post-flood buyouts leave homeowners underwater. New York, NY: Natural Resources Defense Council.
White, G., Kates, R., and Burton, I. (2001). Knowing better and losing even more: the use of knowledge in hazards management. Glob. Environ. Chang. B, Environ. Hazards. 3, 81–92. doi: 10.1016/S1464-2867(01)00021-3
Zarekarizi, M., Srikrishnan, V., and Keller, K. (2020). Neglecting uncertainties biases house-elevation decisions to manage riverine flood risks. Nat. Commun. 11:5361. doi: 10.1038/s41467-020-19188-9
Zavar, E., and Hagelman, R. R. (2016). Land use change on U.S. floodplain buyout sites, 1990-2000. Disaster Prev Manag 25, 360–374. doi: 10.1108/DPM-01-2016-0021
Keywords: pre-disaster relocation, buyouts, coastal flooding, risk management, game theory
Citation: Li F, Jha P and Johnson DR (2025) Evaluating pre-disaster subsidized relocations in coastal Louisiana via a game-theoretic approach. Front. Clim. 7:1514456. doi: 10.3389/fclim.2025.1514456
Edited by:
Charles Krishna Huyck, ImageCat, United StatesReviewed by:
Dimiter Velev, University of National and World Economy, BulgariaAbbey Hotard, University of South Alabama, United States
Copyright © 2025 Li, Jha and Johnson. This is an open-access article distributed under the terms of the Creative Commons Attribution License (CC BY). The use, distribution or reproduction in other forums is permitted, provided the original author(s) and the copyright owner(s) are credited and that the original publication in this journal is cited, in accordance with accepted academic practice. No use, distribution or reproduction is permitted which does not comply with these terms.
*Correspondence: David R. Johnson, ZGF2aWRqb2huc29uQHB1cmR1ZS5lZHU=
†ORCID: Pragathi Jha, https://orcid.org/0009-0003-4444-974X
David R. Johnson, https://orcid.org/0000-0002-2364-340X