 Herbert O. Misiani1*
 Hussen S. Endris1
 Franklin J. Opijah2Jully O. Ouma1
 Betty N. Barasa3
 Mari R. Tye4,5
 Douglas G. MacMartin6
- 1Climate Diagnostic and Prediction Unit, IGAD Climate Prediction and Applications Centre, Nairobi, Kenya
- 2Meteorology Unit, Department of Earth and Climate Sciences, University of Nairobi, Nairobi, Kenya
- 3Logistics Unit World Food Program, Juba, South Sudan
- 4Climate and Global Dynamics Laboratory, NSF National Center for Atmospheric Research, Boulder, CO, United States
- 5Whiting School of Engineering, Johns Hopkins University, Baltimore, MD, United States
- 6Department of Mechanical and Aerospace Engineering, Cornell University, Ithaca, NY, United States
Eastern Africa is vulnerable to extreme climate events, including droughts and floods, which are expected to become more frequent and intense in the future. This paper evaluates the potential of solar radiation management (SRM) with stratospheric aerosol injection (SAI) to influence the projected climate, including extreme events, over the region. The study utilized climate simulation outputs from the Community Earth System Model version 2 with the Whole Atmosphere Community Climate Model (CESM2-WACCM6) to assess future climate changes under two scenarios: one without Solar Aerosol Injection (SAI) following the SSP2-4.5 emissions pathway, and another with SAI, based on the first set of simulations from the Assessing Responses and Impacts of Solar Climate Intervention on the Earth System with Stratospheric Aerosol Injection (ARISE-SAI) project. The analysis of model performance was conducted for the 1981–2010 period, while future changes were assessed over two climatological periods: the near-term (2035–2054) and the mid-term (2050–2069). Changes in extreme temperatures and rainfall events were evaluated using four extreme indices: two for temperature (WSDI and DTR) and two for rainfall (CDD and CWD). Additionally, the Standardized Precipitation-Evapotranspiration Index (SPEI) was used to assess changes in the frequency of extreme wet and dry events. In the historical period, there is good agreement between the observed and simulated data in representing the spatial distribution of temperature and rainfall over the region, despite the slight overestimation and underestimation by the model in some areas. The model effectively captures the seasonal cycles of rainfall and temperature over the cities of interest. Analysis of future projections indicates that temperatures are projected to rise consistently in the future under the SSP2-4.5 scenario. However, SAI produces a steady trend in the four cities, suggesting SAI’s potential to counteract warming in Eastern Africa. Rainfall is projected to increase in the equatorial region compared to the reference period, while other areas remain stable. ARISE-SAI shows higher increases in rainfall during the MAM season but lower increases during the JJAS and OND seasons compared to SSP2-4.5. Overall, the study’s findings suggest that SAI technology could have a clear effect in reducing temperatures in Eastern Africa, both in the near- and mid-term futures. However, its impact on rainfall varies by region and season, indicating that further simulations with a wider range of scenarios and analyses are required to assess the robustness of these results. The results of this study should be interpreted cautiously since they are specific to the approach of SAI applied, the modelling experiments employed, and the scenarios considered.
1 Introduction
The fluctuating climate presents a growing concern across socio-economic and political fronts in Eastern Africa. While natural variability remains a significant driver of these fluctuations (Schreck III and Semazzi, 2004), there is mounting evidence that some observed changes, particularly in temperature and rainfall extremes, stem from anthropogenic influences (Palmer et al., 2023; Onyutha, 2020). Understanding these climate shifts relies heavily on high-quality observed climate records, although studies utilizing a combination of observed datasets and satellite rainfall estimates have revealed non-uniform changes, varying by location and season (Gebrechorkos et al., 2019). Additionally, it has been shown that many regions in Eastern Africa have already experienced notable increases in both maximum and minimum temperatures, with increases of 1.9 and 1.2°C, respectively (Gebrechorkos et al., 2019).
While it is important to monitor and understand trends in observed climate patterns, understanding the sustained impact of global warming on climate and its long-term repercussions is equally vital for effective long-term planning. Achieving this is currently possible using long-term climate projections simulations under carefully defined assumptions of the future (Moss et al., 2010; O'Neill et al., 2016). Many studies have delved into the impacts of varying degrees of global warming on climate. For instance, utilizing the Coordinate Regional Downscaling Experiment (CORDEX) Africa simulations, Nikulin et al. (2018) demonstrated pronounced regional warming surpassing global averages across much of Africa, with the most substantial increases occurring over subtropical areas and the least in many coastal regions. Their findings suggested an overall projection of increased precipitation accompanying the warming trend in parts of the central/eastern Sahel and Eastern Africa on annual timescales, despite a lack of model agreement.
Most studies suggest that continued global warming, particularly under a “business-as-usual” scenario, will result in higher temperatures and reduced precipitation in several regions, including Southern, West, and Eastern Africa (Maúre et al., 2018; Klutse et al., 2018; Haile et al., 2020). The projected intensified warming is expected to further affect intra-seasonal rainfall patterns (Osima et al., 2018; Gudoshava et al., 2020), potentially causing significant impacts on vital sectors like agriculture and food security in these areas.
Given the likelihood of exceeding the 2.0°C global warming target set by the international community, there’s growing recognition that traditional adaptation and mitigation strategies may not suffice to address the impacts of global warming (Ming et al., 2014; Iyer et al., 2015). A possible additional approach gaining attention involves the deployment of technology to offset increases in temperature by reducing incoming solar radiation, also referred to as solar geoengineering or Solar Radiation Management (SRM) (Mercer et al., 2011; Shepherd, 2009). Some SRM approaches, like the deployment of stratospheric aerosols, offer uniform distribution of effects on a large scale but entail potential uncertainties and risks such as changes to stratospheric ozone (Shepherd, 2009) and changes in atmospheric and stratospheric circulation (Bednarz et al., 2023; Tilmes et al., 2008; Visioni et al., 2020; Weisenstein et al., 2022). Nonetheless, a comprehensive understanding of the social and environmental impacts of these methods is crucial before considering large-scale deployment, to avoid unintended consequences.
For SRM, comprehensive assessment of its climate impacts, while minimizing atmospheric interference, relies on the utilization of Global Climate Models (GCMs). Ongoing research initiatives, such as the Geoengineering Large Ensemble (GLENS) and Assessing Responses and Impacts of Solar Climate Intervention on the Earth System (ARISE) projects employing the Community Earth System Model (CESM), and the Geoengineering Model Intercomparison Project (GeoMIP) simulations, are pivotal in this regard (Tilmes et al., 2018; Kravitz et al., 2021). Previous studies underscore the significance of the injection location for the Stratospheric Aerosol Injection (SAI) in mitigating greenhouse gas impacts. Optimal SAI injection across multiple locations (for example at 30°S, 15°S, 15°N, and 30°N) has shown promising results for enhanced cooling relative to aerosol injection at a single location at the equatorial regions, which tends to excessively cool the tropics compared to higher latitudes (MacMartin et al., 2017; Patel et al., 2023).
The impacts of SAI exhibit significant regional variability, yet research consistently indicates its potential to mitigate critical climate hazards, particularly those related to temperature, across most regions (Pinto et al., 2020; Patel et al., 2023). However, the effects on precipitation patterns are less uniform, showing notable regional and seasonal inconsistencies (Pinto et al., 2020; Patel et al., 2023). For instance, SAI is projected to reduce the maximum 5-day precipitation (Rx5day) in tropical regions, with a potential of exacerbating drought conditions in areas already prone to drought (Ji et al., 2018; Alamou et al., 2022; Obahoundje et al., 2023). Additionally, SAI is expected to influence the West African Summer Monsoon, with significant implications for precipitation in the southern Sahel and Western Africa (Da-Allada et al., 2020).
While SAI may effectively counteract some effects of climate change, such as rising temperatures and increased atmospheric evaporative demand, it could also introduce unintended consequences, including precipitation overcompensation (Simpson et al., 2019; Abiodun et al., 2021). These complexities highlight the need for continued research into the regional climate responses to SAI and its broader socio-economic impacts, particularly on critical sectors like agriculture across diverse geographical regions. Understanding these cascading effects is essential for developing informed strategies to address climate change while minimizing potential risks associated with geoengineering approaches like SAI.
This study investigates the potential influence of SAI on extreme precipitation and temperature across Eastern Africa, a region highly susceptible to climate change yet inadequately equipped to manage its effects. By examining the potential influence of SAI on extreme events with significant societal and environmental consequences, this research offers fresh insights into the broader implications of SAI in Eastern Africa, addressing gaps in previous studies that have primarily concentrated on its atmospheric implications.
2 Study area, data, and methodology
This section outlines the study area, followed by a detailed description of the datasets utilized and the analytical methods applied to achieve the study’s objectives.
2.1 Study area
Eastern Africa comprises the Greater Horn of Africa (GHA) region located between longitudes 22°E and 55°E and latitudes 12°S and 25°N, bordering the Indian Ocean on the east and characterized by complex topography consisting of elevated orography, the Great Rift Valley, large water bodies, and plains (Figure 1), which exert appreciable influence upon the mesoclimate (Mukabana and Pielke, 1996). Highland regions tend to be cooler and wetter than the low-lying plains. The highest annual total rainfall of more than 1800 mm is received over the western parts of Ethiopia and the Lake Victoria Basin cross-border areas. Conversely, parts of eastern and northern Kenya, eastern and southeastern Ethiopia, most of Somalia, Djibouti and Sudan receive rainfall below 800 mm per year; these areas are classified as arid and semi-arid.
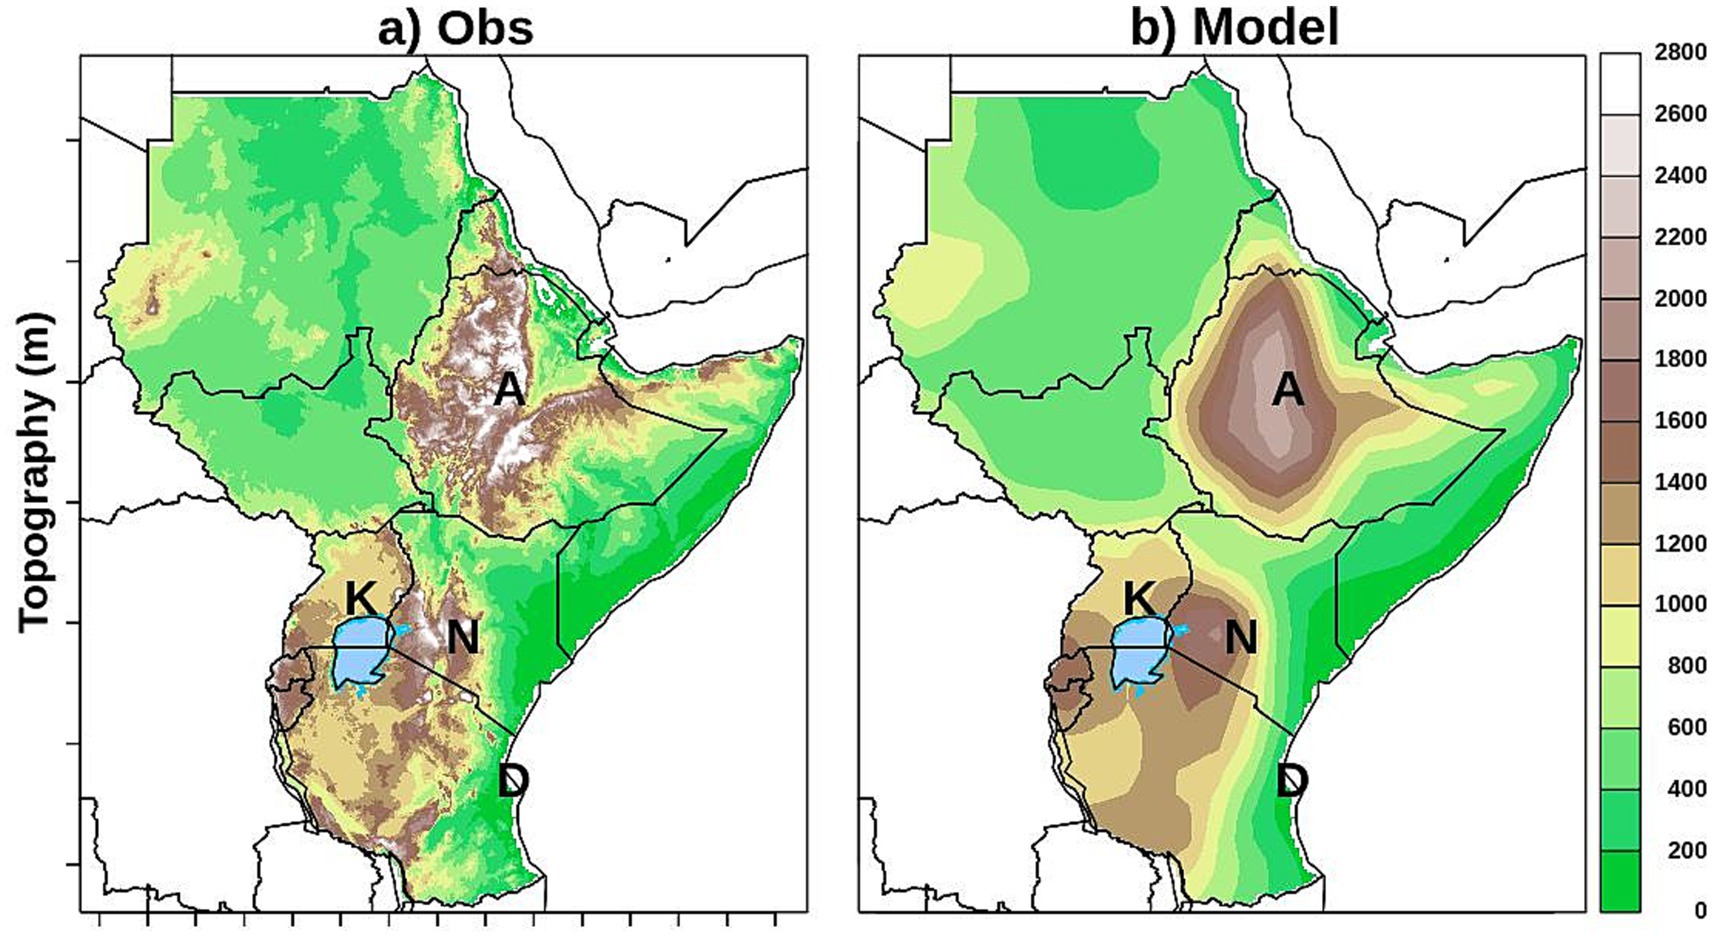
Figure 1. The observed (obs) and model topography of the study region (in meters above Mean Sea Level), highlighting the locations of the cities Addis Ababa (A), Dar es Salaam (D), Kampala (K), and Nairobi (N) for observations (a) and model (b).
The comparison of the observed and modelled topography highlights key differences. The observed topography (Figure 1, left) captures finer details, including localized elevation variations and small-scale features, which are smoothed out in the model representation (Figure 1, right) due to its coarser resolution. As a result, the model may underestimate sharp elevation gradients and finer topographic features, potentially impacting climate and hydrological simulations in the region. These differences underscore the importance of considering resolution effects when interpreting model outputs and their implications for regional climate analysis.
The equatorial region receives most of its rainfall during the warm ‘long rains’ season from March to May (MAM) and the ‘short rains’ season from October to December (OND) (Okoola, 1989). In contrast, the June to September (JJAS) season is predominantly wet in the northern sector and parts of the western equatorial area, while remaining dry in most other regions of the GHA. The December to February (DJF) season is generally hot and dry, except for the southern parts of Tanzania. Figures 2a–d illustrates the percentage contribution of the MAM, JJAS, OND, and DJF seasonal totals, respectively, to the annual rainfall over the study area.
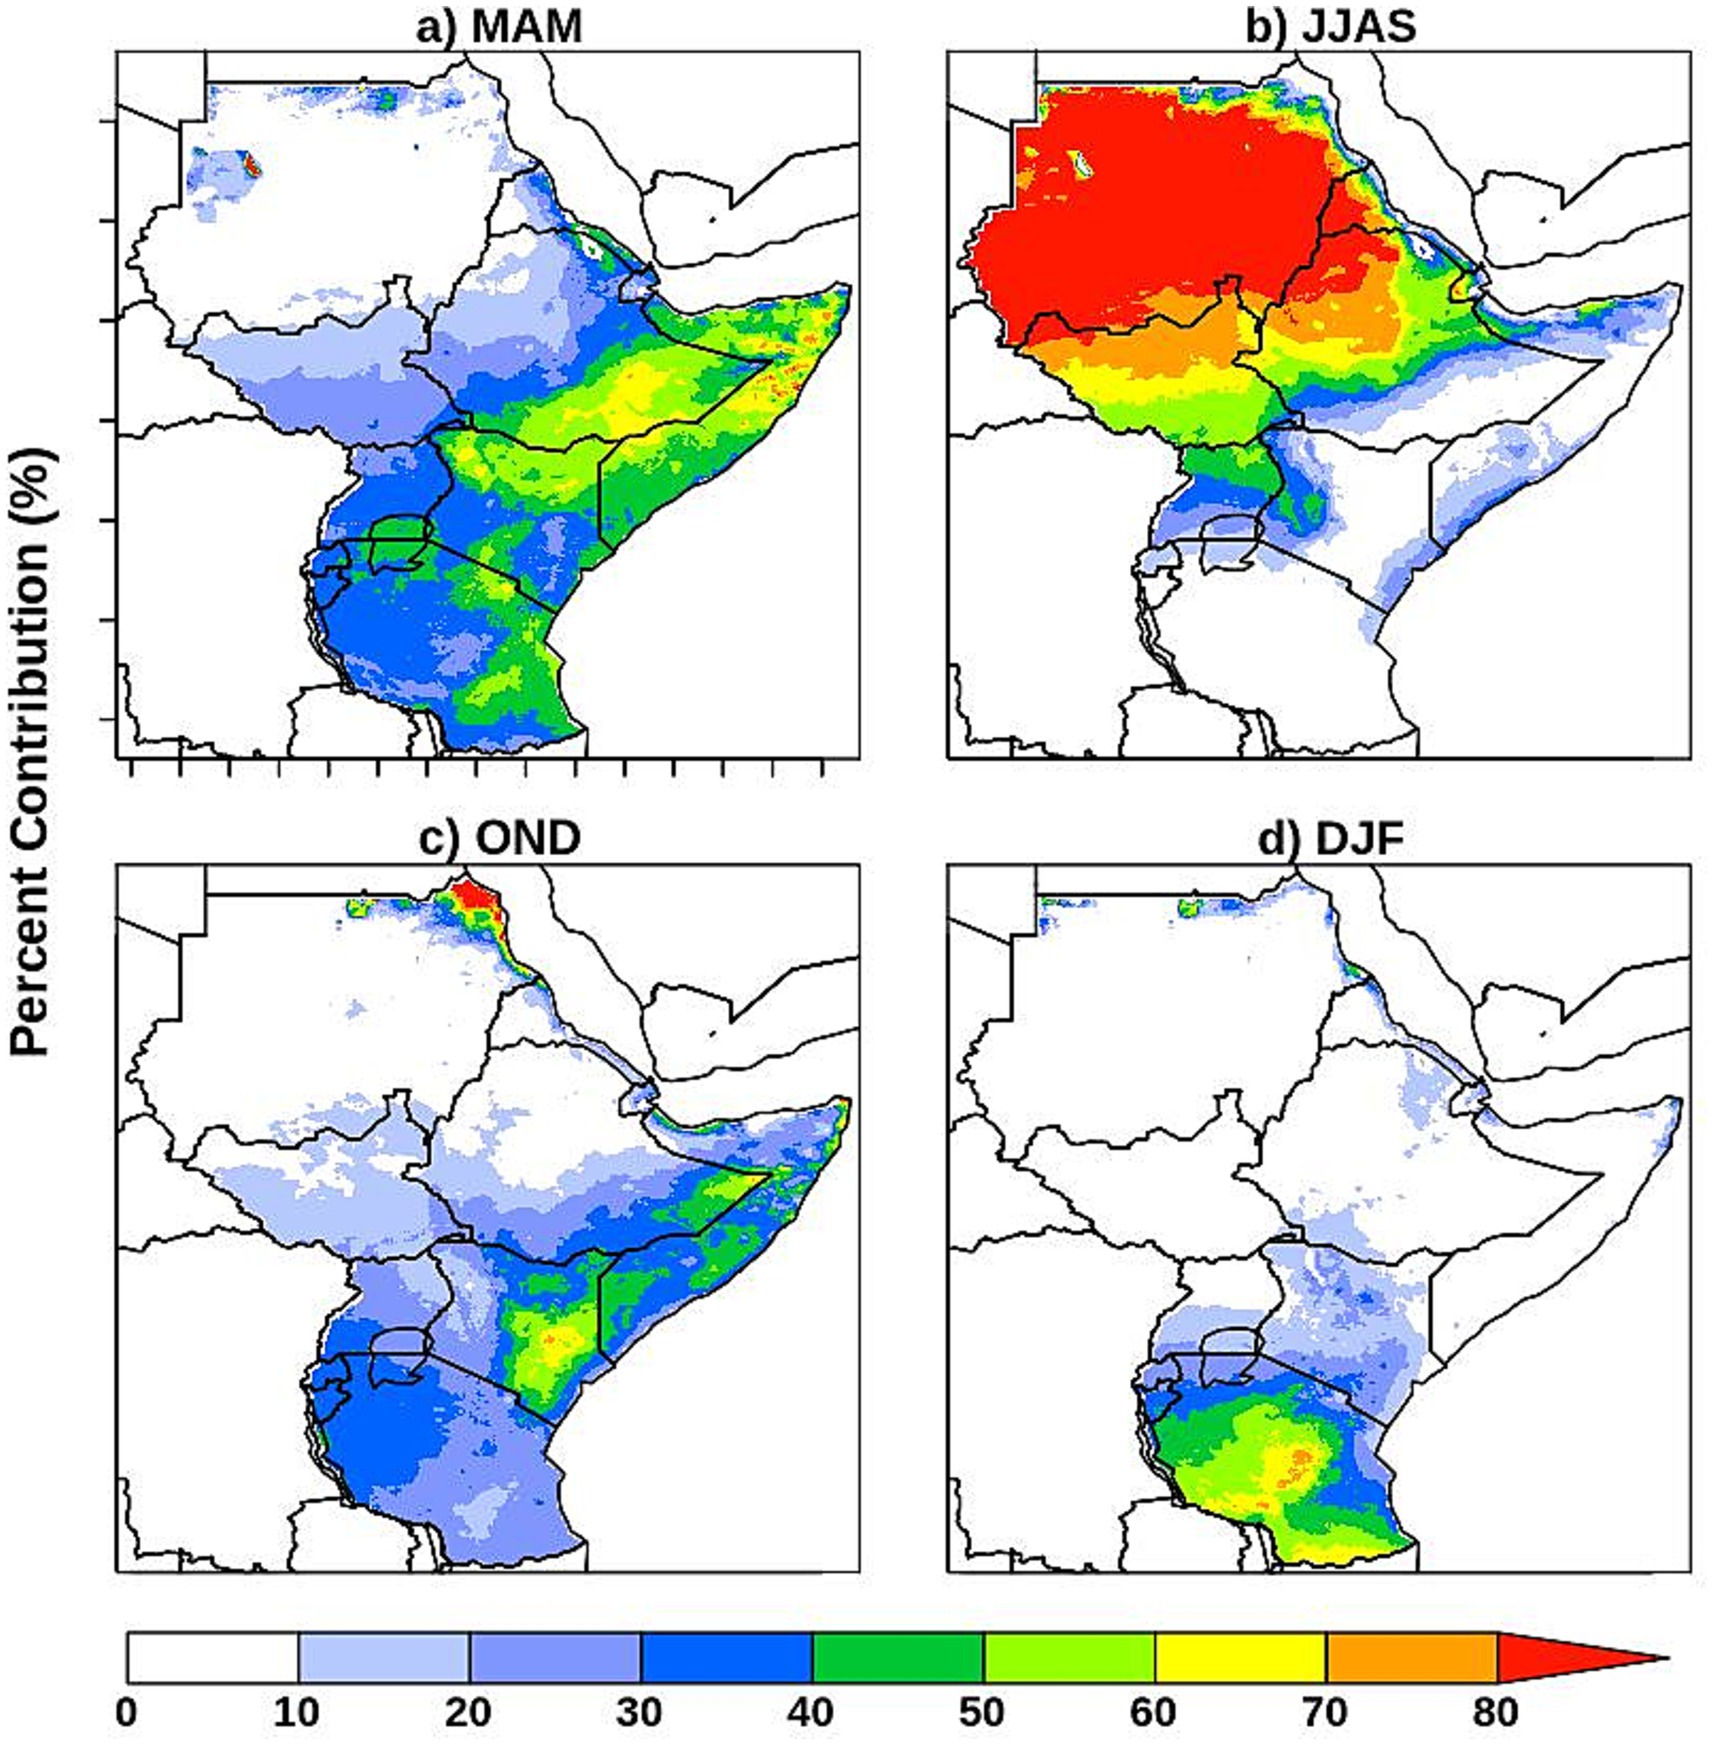
Figure 2. The percentage contribution of each season—(a) March-May (MAM), (b) June-September (JJAS), (c) October-December (OND), and (d) December-February (DJF)—to the total annual rainfall across the study area.
The weather and climate over the region are driven by the Inter-Tropical Convergence Zone (ITCZ), the orientation of easterly waves (Okoola, 1989), extra-tropical weather systems, intra-seasonal and inter-seasonal waves, jet streams (Kinuthia and Asnani, 1982), large scale monsoons, the continental low level trough, trade winds, tropical cyclones and storms, and teleconnections with global-scale climatic anomalies, including those associated with El Niño-Southern Oscillation (ENSO) (Ogallo, 1988; Indeje et al., 2000), global sea surface temperatures (SSTs), stratospheric quasi-biennial oscillations (QBO) (Indeje and Semazzi, 2000; Ogallo et al., 1994), solar and lunar forcing (Ogallo, 1988), and the interaction between the large-scale flows and mesoscale circulations (Mukabana and Pielke, 1996). While the study examined the broader Eastern Africa region, particular attention was given to four key cities—Addis Ababa (A), Dar es Salaam (D), Kampala (K), and Nairobi (A) (Figure 1)—due to their economic significance and the potential impacts of extreme weather events on these urban centers.
2.2 Data
2.2.1 Observed data
To evaluate the model performance in reproducing the observed rainfall and temperature characteristics over the study region, the Climate Hazards Group InfraRed Precipitation with Station (CHIRPS) version v2.0 (Funk et al., 2015) that combines the 0.05-degree resolution satellite imagery with in-situ station data was utilized as the reference data. The dataset spans from 1981 to the present and offers a comprehensive historical record of precipitation. The Climatic Research Unit (CRU) gridded observational dataset, produced from integrating over 4,000 weather stations located across the globe, was used as the reference for temperature. The CRU dataset is available at a resolution of 0.5° from 1901 to present (Harris et al., 2014). The model simulations for rainfall and temperature were regridded to align with the CHIRPS and CRU grids, respectively, to facilitate comparison.
2.2.2 Model data
The historical simulations used in this study were from the Community Earth System Model version 2 with the Whole Atmosphere Community Climate Model (CESM2-WACCM6), which is a cutting-edge climate model that simulates the Earth’s atmosphere (Gettelman et al., 2019). CESM2-WACCM6 predicts components in the atmosphere, land, ocean, sea-ice, land-ice, river, and waves at a horizontal resolution of 0.95° × 1.25° and 70 vertical levels. The historical model simulations used were based on the second realization (r2i1p1f1) of the CESM2 (WACCM6) (Gettelman et al., 2019).
The reference simulation uses the moderate Shared Socioeconomic Pathway (SSP) scenario of SSP2-4.5 (O'Neill et al., 2016), which marks a continuation of the Representative Concentration Pathway 4.5 (RCP4.5) scenario and is roughly consistent with current policy scenarios compared to the higher emission scenarios like the SSP5-8.5. A 5-member reference ensemble was carried out under the CMIP6 project for the years 2015–2,100 and an additional 5-member ensemble for the years 2015–2069 focusing on additional small temperature perturbations for each ensemble member at the first model timestep (Gettelman et al., 2019).
SRM climate intervention used the Assessing Responses and Impacts of Solar Climate Intervention on the Earth system (ARISE) simulations with Sulphur dioxide injections (Richter et al., 2022). ARISE-SAI is a 10-member ensemble of stratospheric aerosol injection (SAI) simulations that commence in 2035 with a target of maintaining global surface temperatures at 1.5°C above pre-industrial levels in combination with SSP2-4.5 emissions. The first five ARISE-SAI-1.5 simulations were initialized in 2035 with different land, ocean, sea-ice, and atmospheric conditions, and subsequent ensemble members initialized from the same initial conditions with a small temperature perturbation to the atmospheric initial condition to create an ensemble spread (Richter et al., 2022). SO₂ is injected at four locations (15°N, 15°S, 30°N, and 30°S) at a fixed longitude of 180° (Fasullo and Richter, 2023). However, the majority of the SO₂ is injected at 15°S, while the amounts at 15°N and 30°S are each one-third of that injected at 15°S. The injection at 30°N is the lowest among the four locations and gradually decreases to nearly zero by 2069 (Richter et al., 2022). The higher SO₂ allocation at 15°S compared to 15°N helps maintain the inter-hemispheric temperature gradient in the ARISE-SAI simulations (Henry et al., 2023).
2.3 Methods
A wide spectrum of statistical methods are used to evaluate the current and future characteristics of climate events, including extremes, over Eastern Africa and its four major megacities (labelled in Figure 1). All climate model data for both rainfall and temperature were interpolated to a common grid, like the observed CHIRPS dataset, using a bilinear interpolation technique. The analysis for the different cities was conducted by averaging several grid cells around each city.
The analysis focuses on the main rainfall seasons in the region, which include the March–April–May (MAM) season, the June–July–August–September (JJAS) season, and the October–November–December (OND) season, as well as the annual timescale. These periods correspond to the major seasonal rainfall patterns observed in the region, capturing both the long and short rainy seasons, which are critical for understanding precipitation variability and its impact on agriculture and water resources.
2.3.1 Temperature and rainfall extremes definition
Temperature and rainfall extremes were analysed using four annual extreme indices and the Standardised Precipitation-Evapotranspiration Index (SPEI) across both modelling setups. Two indices were employed for temperature extremes: the Warm Spell Duration Index (WSDI) and the Daily Temperature Range (DTR). WSDI measures consecutive days when the daily maximum temperature exceeds the local and seasonal 90th percentile, calculated using a 5-day moving window for both reference and future periods. DTR represents the mean difference between daily maximum and minimum temperatures.
An increase in DTR occurs when minimum temperatures decrease or maximum temperatures increase, or both occur simultaneously, suggesting an increase in cold nights, warm days, or both. Conversely, an increase in WSDI indicates a rise in daytime temperatures, which could contribute to a higher frequency or intensity of heat stress, with significant implications for human health and ecosystems.
For rainfall extremes, two indices were analyzed: Consecutive Dry Days (CDD) and Consecutive Wet Days (CWD). CDD represents the maximum number of consecutive days with less than 1 mm of precipitation, while CWD indicates the maximum number of consecutive days with more than 1 mm of precipitation. An increase in CDD suggests prolonged dry spells, whereas an increase in CWD indicates extended wet periods, both of which have significant implications for agricultural activities and food security. These indices were computed for each ensemble member, and ensemble means were then derived for both SAI and non-SAI simulations.
Additionally, the Standardized Precipitation Evapotranspiration Index (SPEI), which is an improvement on the multiscalar Standardised Precipitation Index (SPI), was used to assess the extremely wet and dry conditions (McKee et al., 1993; Vicente-Serrano et al., 2010). SPEI incorporates evapotranspiration into the SPI on multiple timescales, making it more suitable for climate change studies involving large temperature changes (Vicente-Serrano et al., 2010). SPEI is the difference between precipitation and potential evapotranspiration (PET) which is calculated using the simplified Thornthwaite approach. It ignores system characteristics and variables such as wind speed, surface humidity, and solar radiation. Rainfall can be classified as extremely wet, severely wet, moderately wet, normal, severe drought, and moderate drought, extreme drought (McKee et al., 1993; Danandeh Mehr et al., 2020; Lee et al., 2024; Table 1). This study assessed the projected changes in all drought and flood events falling in the severe and extreme categories based. The Standardized Precipitation Evapotranspiration Index (SPEI) is particularly valuable as it integrates additional datasets and relies solely on climatological information. However, its sensitivity to PET calculations, choice of SPEI probability distribution and the need for long baseline periods to accurately capture natural variability present certain challenges (Seiler et al., 2002; Schneider et al., 2013; Lee et al., 2024).
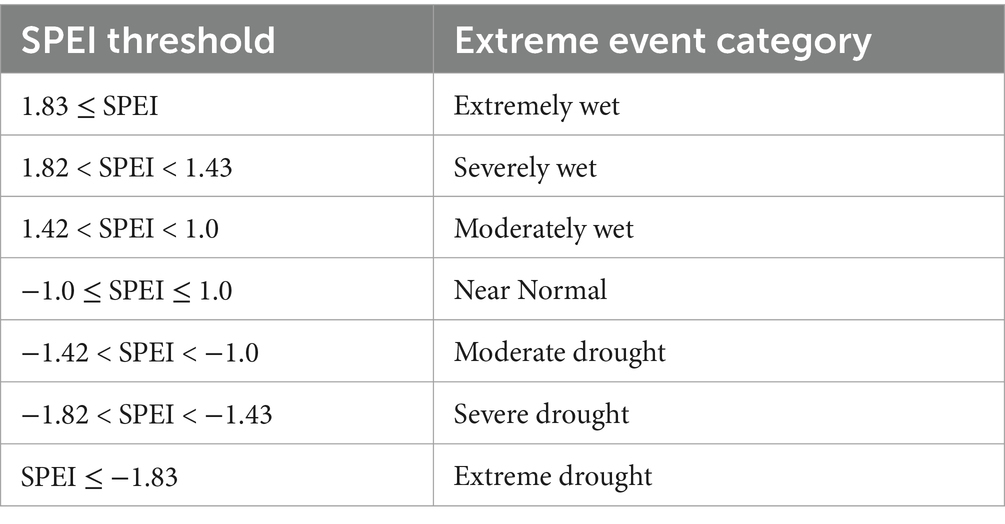
Table 1. Extreme event categories based on SPEI thresholds (Danandeh Mehr et al., 2020; Lee et al., 2024).
2.3.2 Box plot analysis
The box (or whisker) plot method (Williamson et al., 1989; Bruffaerts et al., 2014) was used to graphically assess the distribution of ensemble members around the ensemble mean value for the baseline period (2015–2034) in each modeling setup for the near- and mid-term periods. This technique displays the first, second (median), and third quartiles, along with the minimum and maximum values of the dataset. The mean for each ensemble member was extracted for the cities of Addis Ababa, Dar es Salaam, Kampala, and Nairobi. To handle outliers and anomalies, the resistant non-parametric exploratory data analysis technique (O'Connor and Reimann, 1993) was applied, ensuring unbiased selection of outlier values and class borders.
3 Results
3.1 Assessment of model performance in simulating observed rainfall and temperature patterns
In this section, we assess the performance of CESM2 (WACCM6) in simulating the observed climatology of rainfall and temperature characteristics over Eastern Africa. The assessment of rainfall and temperature for the baseline period is important because the accuracy and reliability of the future simulations of the rainfall and temperature pattern depend on how well the models capture the observed patterns.
3.1.1 Seasonal climatology and model Bias
The seasonal rainfall climatology and model biases over Eastern Africa is depicted in Figure 3, showing both the simulated and observed (CHIRPS) values for the period of 1981–2010, as well as their differences. Looking at the two different sets of plots side by side, we see that there is a fair amount of concordance in the places that receive the most rainfall. Even though the model slightly overestimates the rainfall intensity in some areas, the spatial distribution is generally satisfactory.
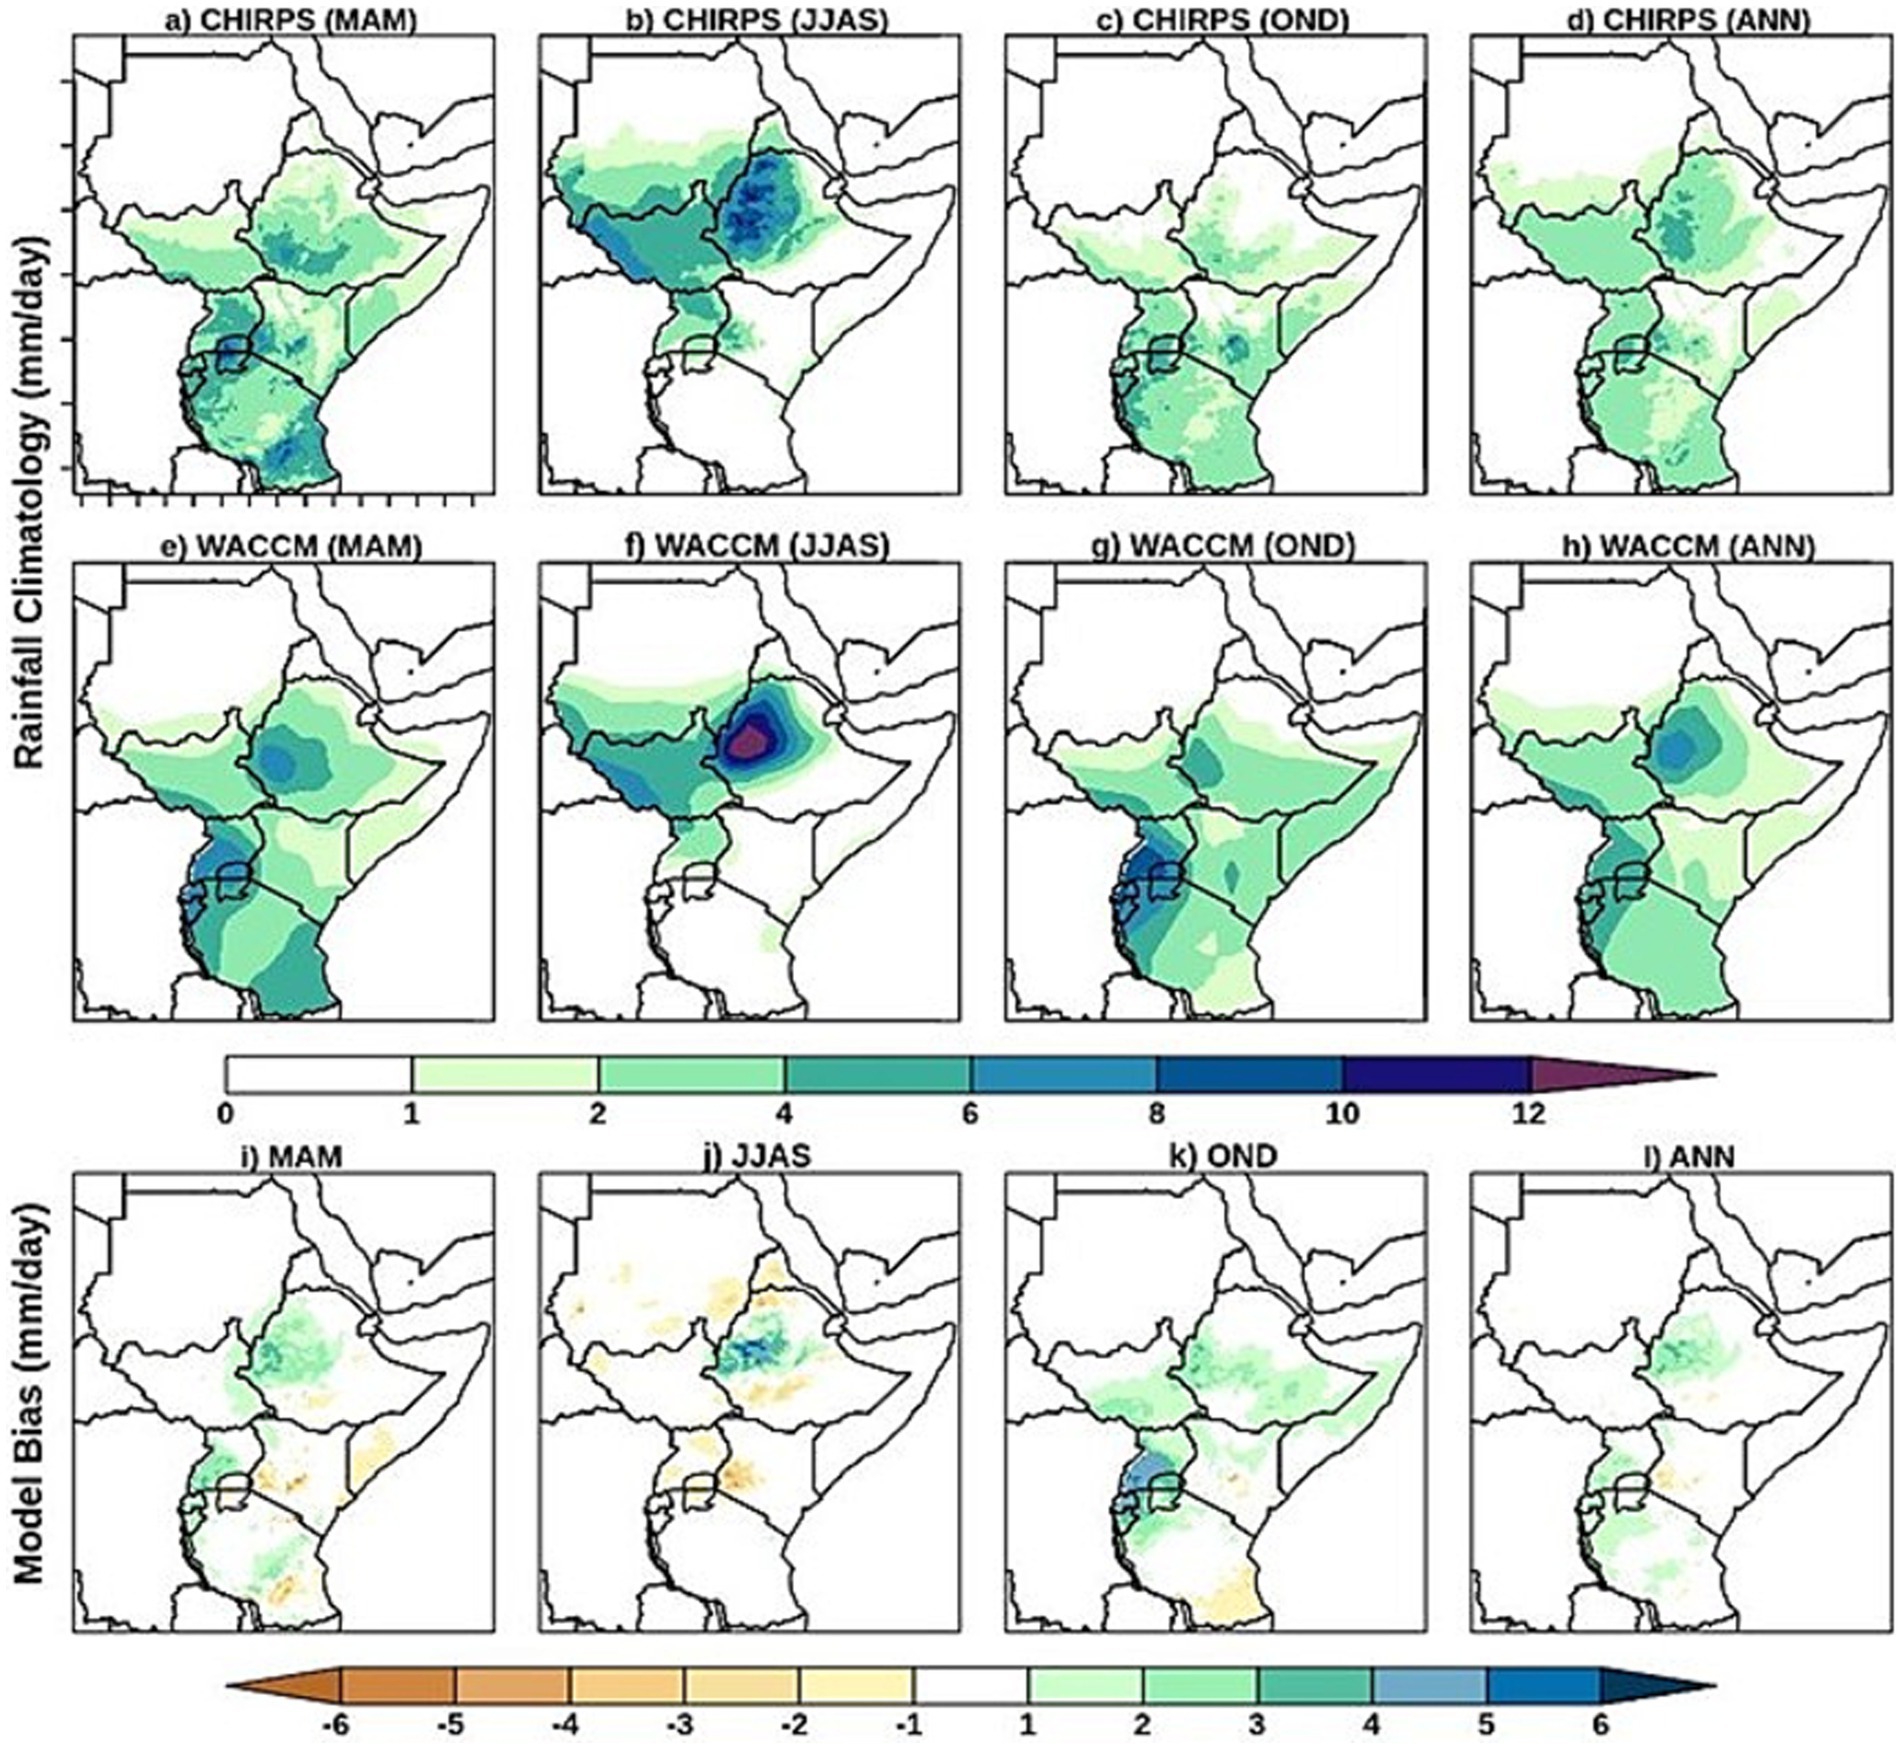
Figure 3. Observed (CHIRPS, top row: a-d) and simulated (middle row: e-h) seasonal rainfall climatology over Eastern Africa for the period 1981–2010 (in mm/day), with model-observation differences shown in the bottom row (panels i-l). The model demonstrates a strong alignment with the observed spatial distribution of high rainfall areas, though there is a slight tendency toward overestimation.
Figure 4 shows the observed (CRU) and simulated seasonal temperature for Eastern Africa for the years 1981–2010, as well as their differences. The spatial distribution of temperature across the study domain displays what the authors regard as a respectable level of consistency. The spatial distribution of temperature, in a broad sense, captures the influence of the topography of the study domain on temperature.
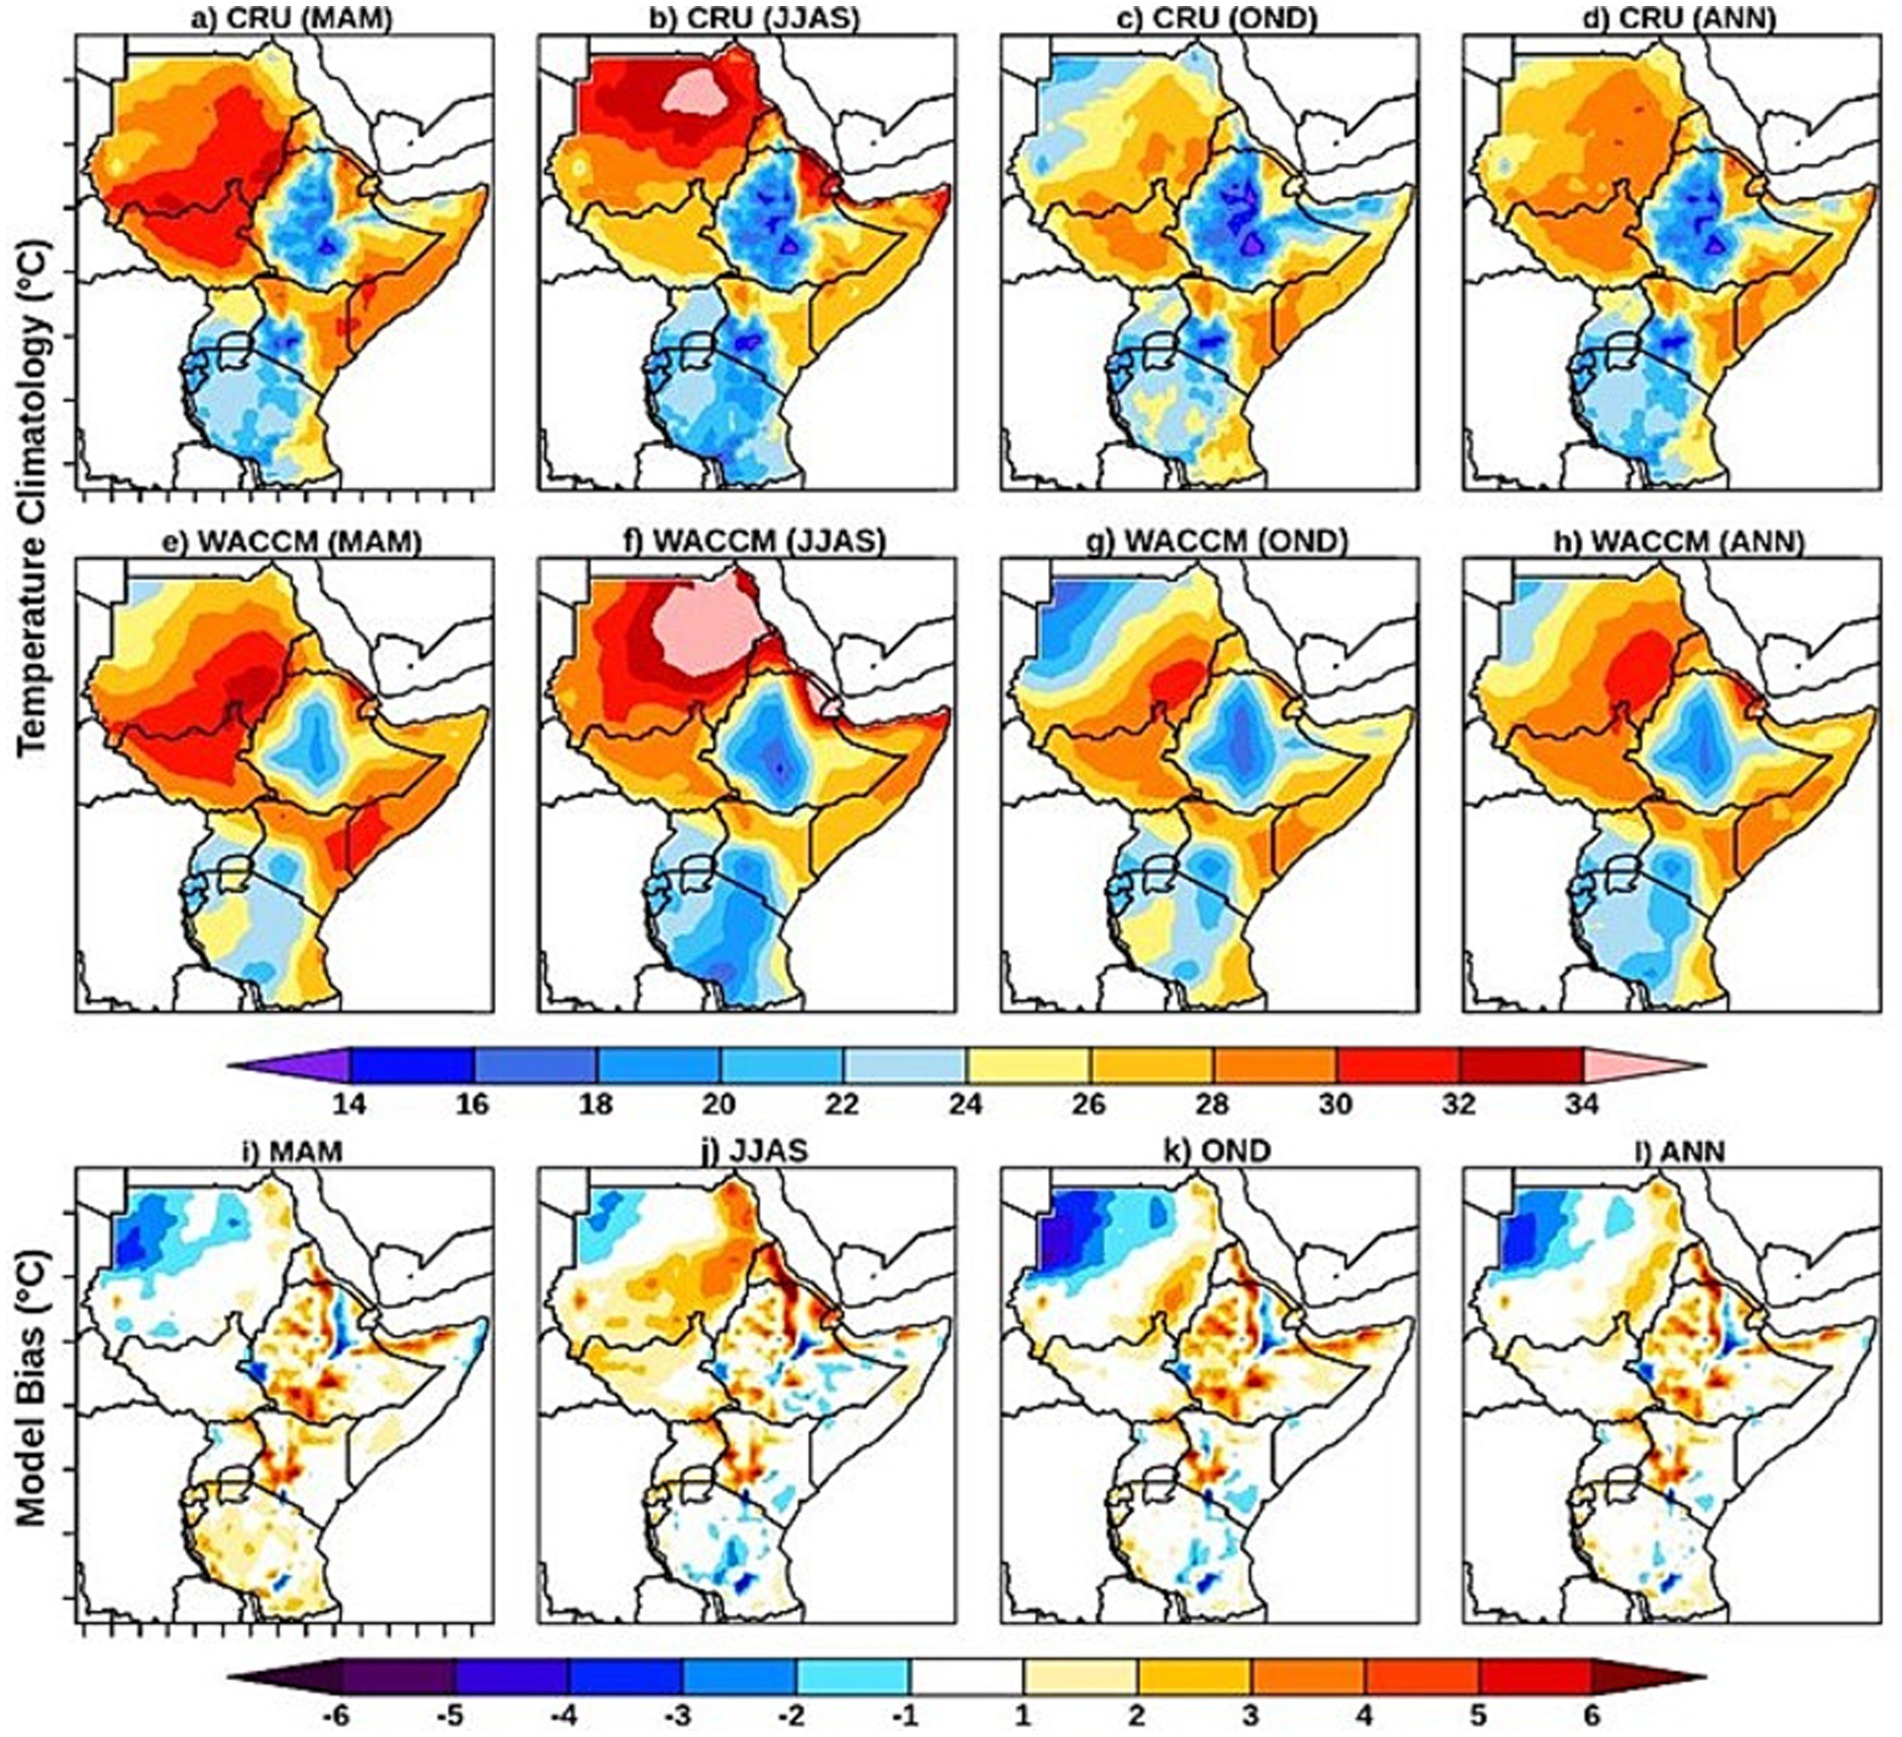
Figure 4. Observed (CRU, top panel: a-d) and simulated (middle panel: e-h) seasonal temperature climatology over Eastern Africa for the period 1981–2010 (in °C), along with the differences between the model and observations (bottom panel: i-l). The spatial distribution of temperature across the study domain shows good agreement between the model and observed data.
3.1.2 Rainfall and temperature seasonality at City level
In this section, we present a grid cell-to-grid cell comparison between the CESM2 (WACCM6) model simulations and the CHIRPS data, specifically extracted for the four major Eastern Africa cities: Addis Ababa, Dar es Salaam, Kampala, and Nairobi. Figure 5 shows the long-term average annual rainfall cycle (mm/day) over Eastern African cities for the historical (1981–2010) and future (2035–2069) periods. The annual cycle is well captured for Addis Ababa, though the model slightly overestimates the observed rainfall values. For Nairobi, the model generally reproduces the observed bi-modal rainfall pattern. However, for Kampala, the model overestimates rainfall during both the MAM and OND seasons. In contrast, the model and observations for Dar es Salaam show good agreement. Future projections under SSP2-4.5 and ARISE-SAI indicate no substantial shifts in rainfall seasonality across the cities, apart from an increase in rainfall amounts during the Oct–Dec season.
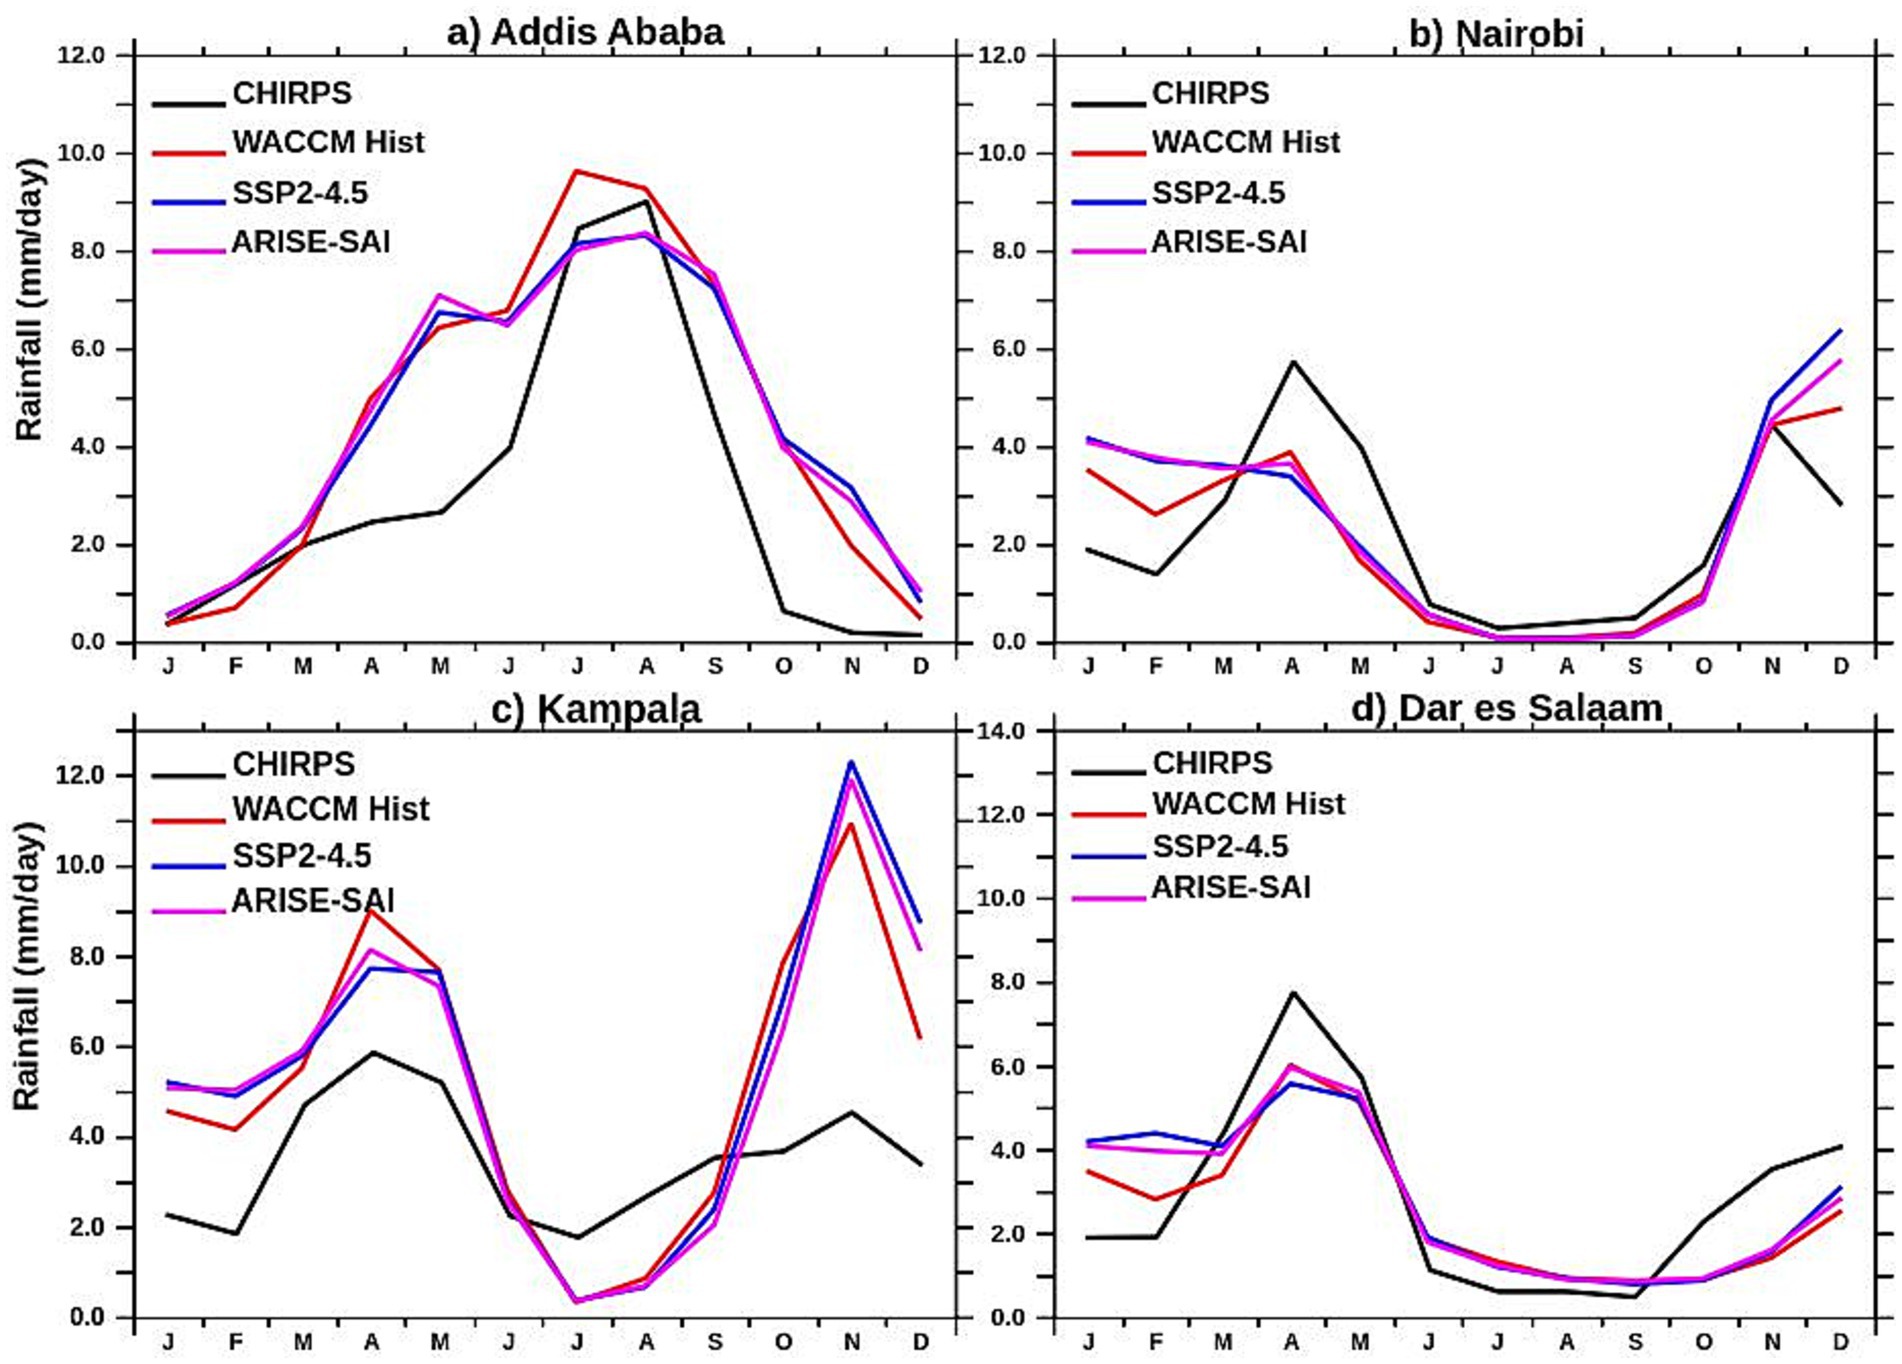
Figure 5. Monthly mean rainfall (mm/day) over the Eastern Africa cities (Addis Ababa, Nairobi, Kampala, and Dar es Salaam: panels a-d, respectively) for historical (1981 -2010) and future (2035 -2069) periods. Observations (CHIRPS) are shown in black, historical simulations (WACCM6) in red, SSP2-4.5 projections in blue, and ARISE-SAI projections in pink.
Figure 6 shows the performance of the WACCM6 model in simulating the mean annual temperature cycle over four Eastern Africa cities for the period 1981–2010, compared to CRU data, along with future projections under SSP2-4.5 and ARISE-SAI scenarios. The model accurately captures the annual cycle for Nairobi, Kampala, and Dar es Salaam, though it overestimates the observed temperature values for Nairobi and Dar es Salaam. Over Addis Ababa, the model also overestimates the observed temperature cycle. When comparing the historical average temperature cycle with future projections under SSP2-4.5 and ARISE-SAI, no significant changes in the temperature seasonality are observed across the cities. However, future temperatures are projected to be consistently higher than in the historical period for all months, with the temperature increase being more pronounced under SSP2-4.5 compared to ARISE-SAI.
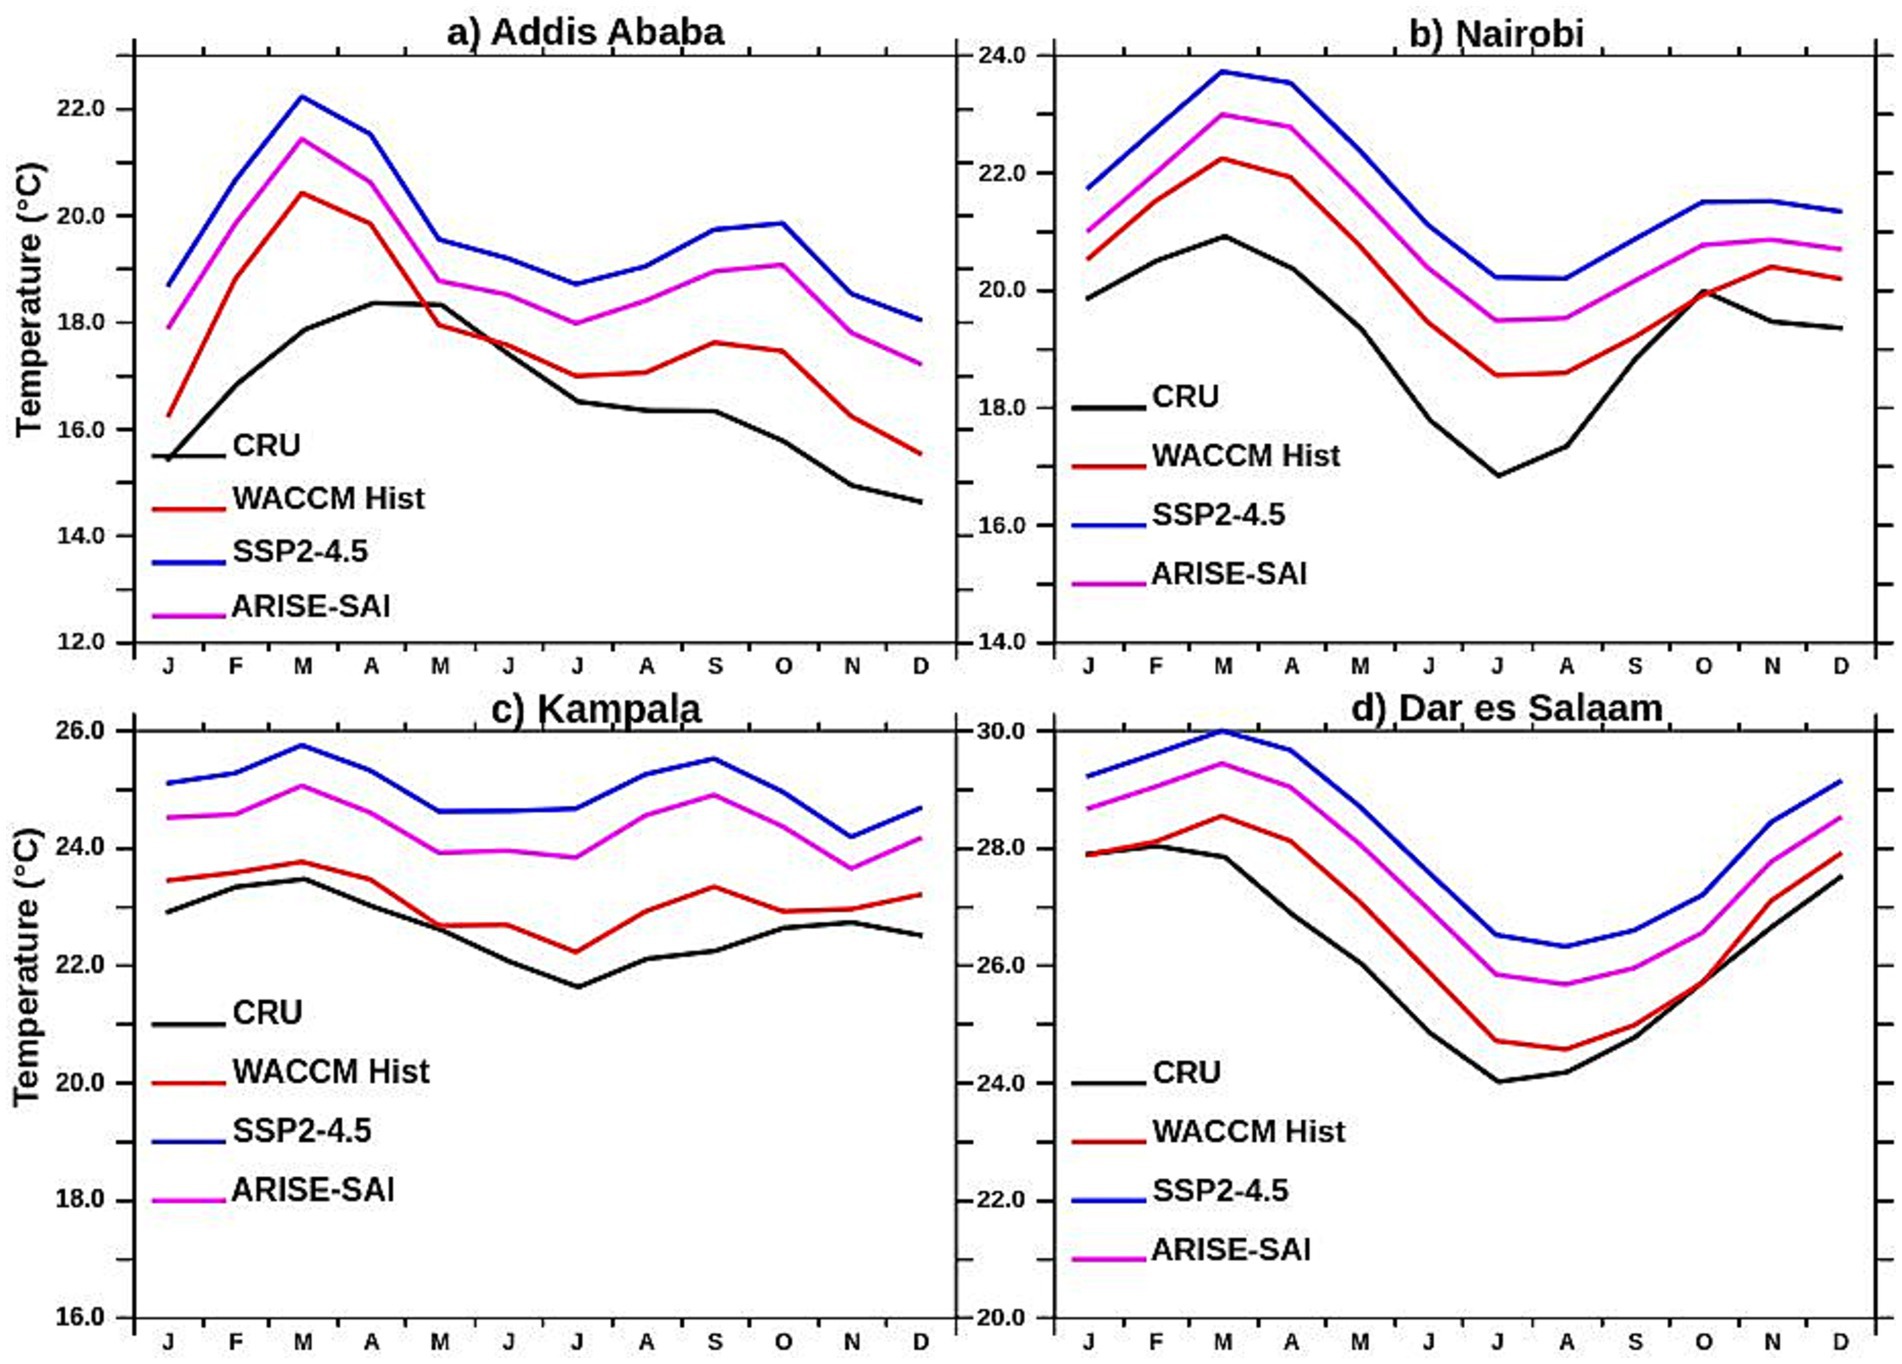
Figure 6. Monthly mean temperature (°C) over Eastern African cities (Addis Ababa, Nairobi, Kampala, and Dar es Salaam: panels a-d, respectively) for historical (1981–2010) and future (2035–2069) periods. Observations (CRU) are shown in black, historical simulations (WACCM6) in red, SSP2-4.5 projections in blue, and ARISE-SAI projections in pink.
3.2 Projected trends in rainfall and temperature
Figure 7 represents the time series of annual mean air temperature anomalies over the four major cities over Eastern Africa (Addis Ababa, Nairobi, Kampala and Dar es Salaam) for the period from 2015 to 2069 with reference to 2015–2034 for SSP2-4.5 and ARISE-SAI simulations. The model spaghetti shows a projected increase in temperature following the SSP2-4.5 scenario of about 1.5°C by 2069 across Eastern Africa. The greatest increase is over Addis Ababa (1.7°C), followed by Kampala (1.5°C), Nairobi (1.4°C) and Dares Salaam (1.25°C). In contrast, the ARISE-SAI simulations project no increase in mean annual temperature.
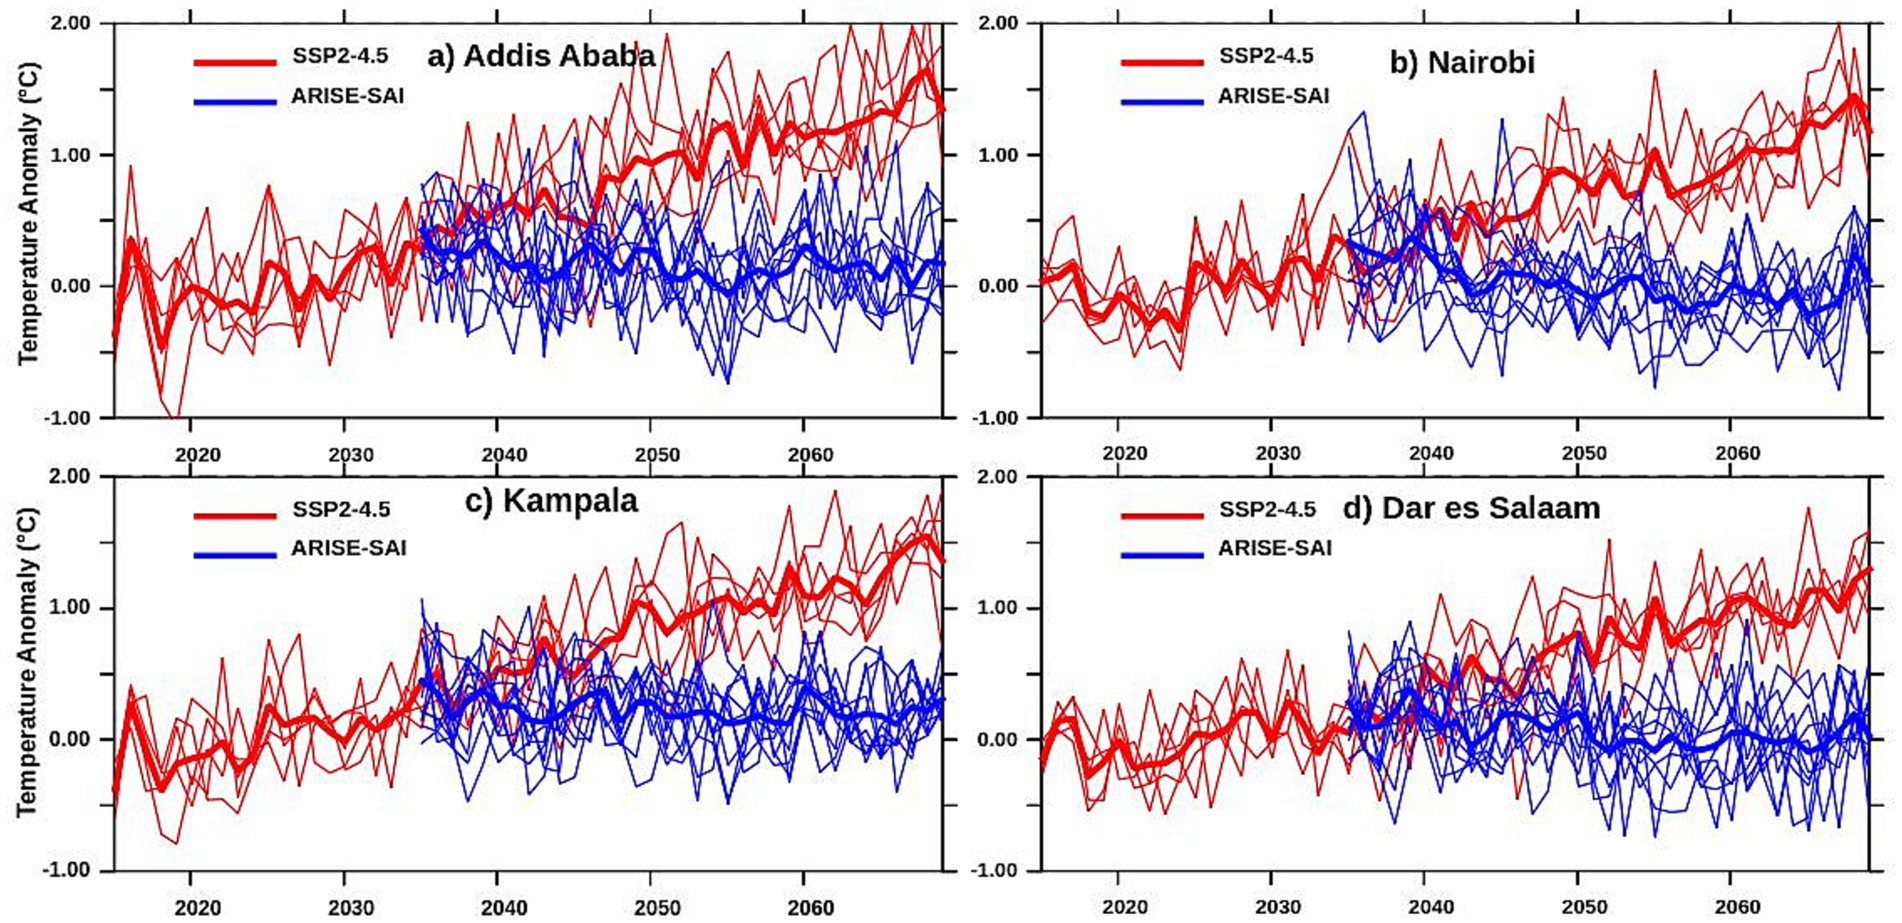
Figure 7. Projected annual mean temperature anomalies for Eastern Africa’s four major cities—Addis Ababa, Nairobi, Kampala, and Dar es Salaam: panels (a-d), respectively–from 2015 to 2069. Faint lines indicate individual ensemble members, while solid lines show the ensemble mean for the CESM2-WACCM6 model (red, 2015–2069) and the ARISE-SAI model (blue, 2035–2069).
The time series of year-to-year changes in rainfall (expressed as a percentage of the mean value for the baseline period) for the four major cities—Addis Ababa, Kampala, Nairobi, and Dar es Salaam—over the period 2015–2069 under SSP2-4.5 and ARISE-SAI (not presented) scenarios indicate that rainfall generally exhibits no consistent trend, with fluctuations occurring without a clear signal. Rainfall variability is projected to be highest in Nairobi, followed by Dar es Salaam. Additionally, a slight positive trend in rainfall changes is observed in Nairobi after 2050.
3.3 Projected changes in temperature and rainfall
3.3.1 Projected changes in temperature
Figure 8 depicts the projected changes in seasonal and annual mean temperature over Eastern Africa for the mid-term (2050–2069) with reference to the 2015–2034 baseline periods for the SSP2-4.5 and ARISE-SAI simulations. For the SSP2-4.5 simulations, the results show increased temperature projections for all seasons, ranging between 0.5°C and 2.0°C. These changes are statistically significant at the 95% confidence level. Overall, the largest projected increase is in the areas outside the equatorial parts of the region. During the MAM season, there is a projected increase in the mean seasonal temperature of about 1°C in the northern parts of South Sudan and the southern parts of Sudan, as well as the central parts of Ethiopia, northern Somalia and southern Tanzania. During the JJAS season, most of the region is projected to have an increase in temperature of 1.5°C, except for the northern portions of Sudan, which could experience a projected increase of up to 2°C. During the OND season, the equatorial portions are projected to experience increased temperature of 1.0°C, while the northern and southern portions of the GHA region are projected to experience an increase of up to 1.5°C. Considering the annual average, most parts of the northern and southern GHA are projected to experience an increase in temperature of up to 1.5°C.
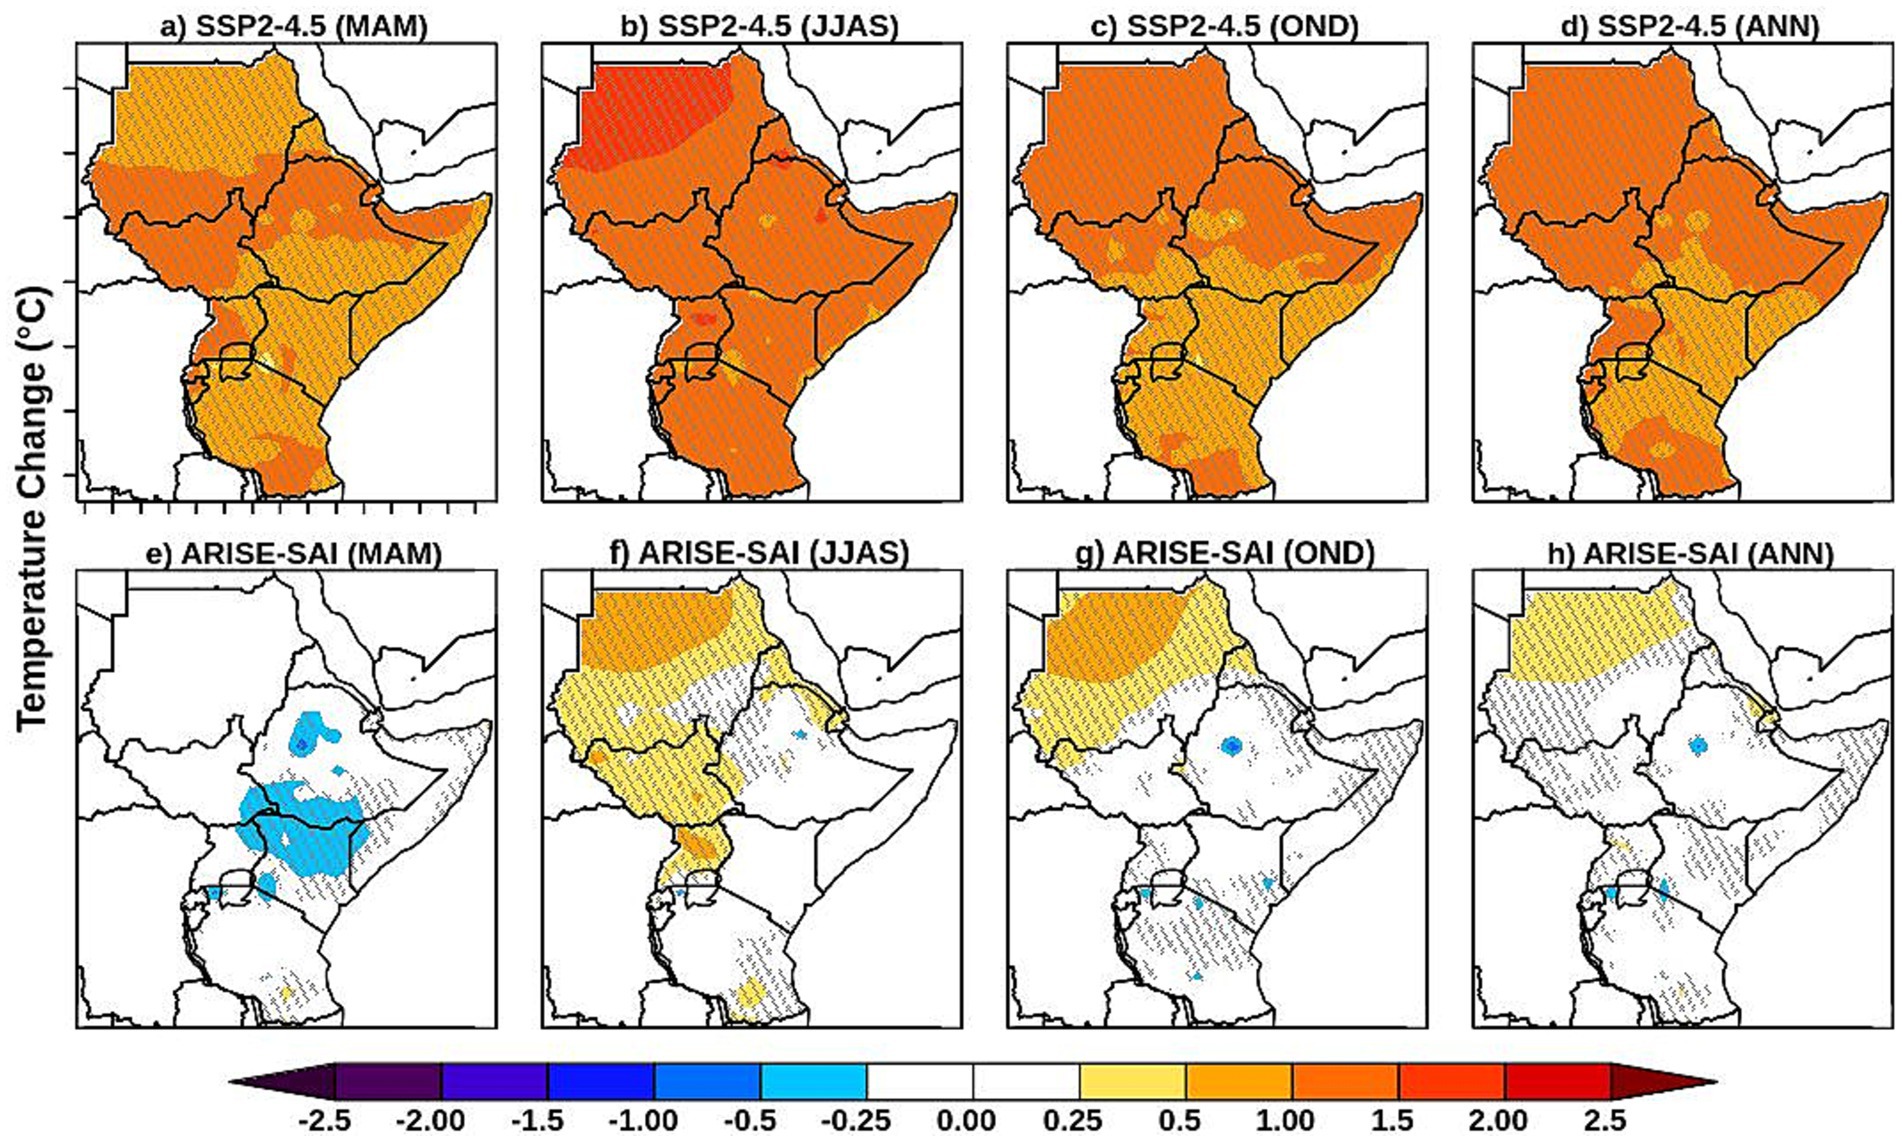
Figure 8. Projected temperature changes over Eastern Africa (future minus current) for the mid-term period (2050–2069), relative to the baseline period (2015–2034). The top row presents results for the SSP2-4.5 scenario, and the bottom row shows the geo-engineered simulations. Columns represent March–May (MAM), June–September (JJAS), October–December (OND), and annual averages. Hatched areas indicate regions with statistically significant changes at the 95% confidence level.
The ARISE-SAI simulations show a projected decrease in temperature (statistically significant at 95% confidence level) during the MAM season of between 0.25°C and 1°C in parts of northern Kenya, southern portions of South Sudan, and the highland portions of Ethiopia; the rest of the region is projected to experience no change in temperature during the season. There is a projected increase in temperature of up to 0.5°C in most parts of Uganda, South Sudan, and central Sudan during the JJAS season; northern parts of Sudan are projected to experience an increase of up to 1°C. During the OND season, most parts of Sudan are projected to experience an increase in temperature of up to 0.5°C in the southern portions and up to 1.0°C in the northern parts. Annually, only the northern part of Sudan is projected to experience an increase in temperature of up to 0.5°C.
The results for the near-term future period (2035–2054) differ significantly in magnitude from those of the mid-term future. While the ARISE-SAI simulations do not fully offset the effects of climate change, they suggest that seasonal mean temperatures over the Greater Horn of Africa (GHA) may be effectively mitigated within this modelling scenario.
During the near term, ARISE-SAI projections indicate no temperature change in the MAM season compared to the baseline period. However, during JJAS, temperatures are projected to increase by up to 0.5°C over parts of northern Sudan and most of South Sudan. In OND, a similar temperature rise of approximately 0.5°C is expected over Sudan. On an annual timescale, temperature increases of up to 0.5°C are also projected over northern Sudan and southern Tanzania.
3.3.2 Projected changes in rainfall
The projected changes in seasonal and annual mean rainfall over Eastern Africa for the mid-term (2050–2069) with reference to the 2015–2034 period for the normal SSP2-4.5 simulations and the geo-engineered simulations are shown in Figure 9.
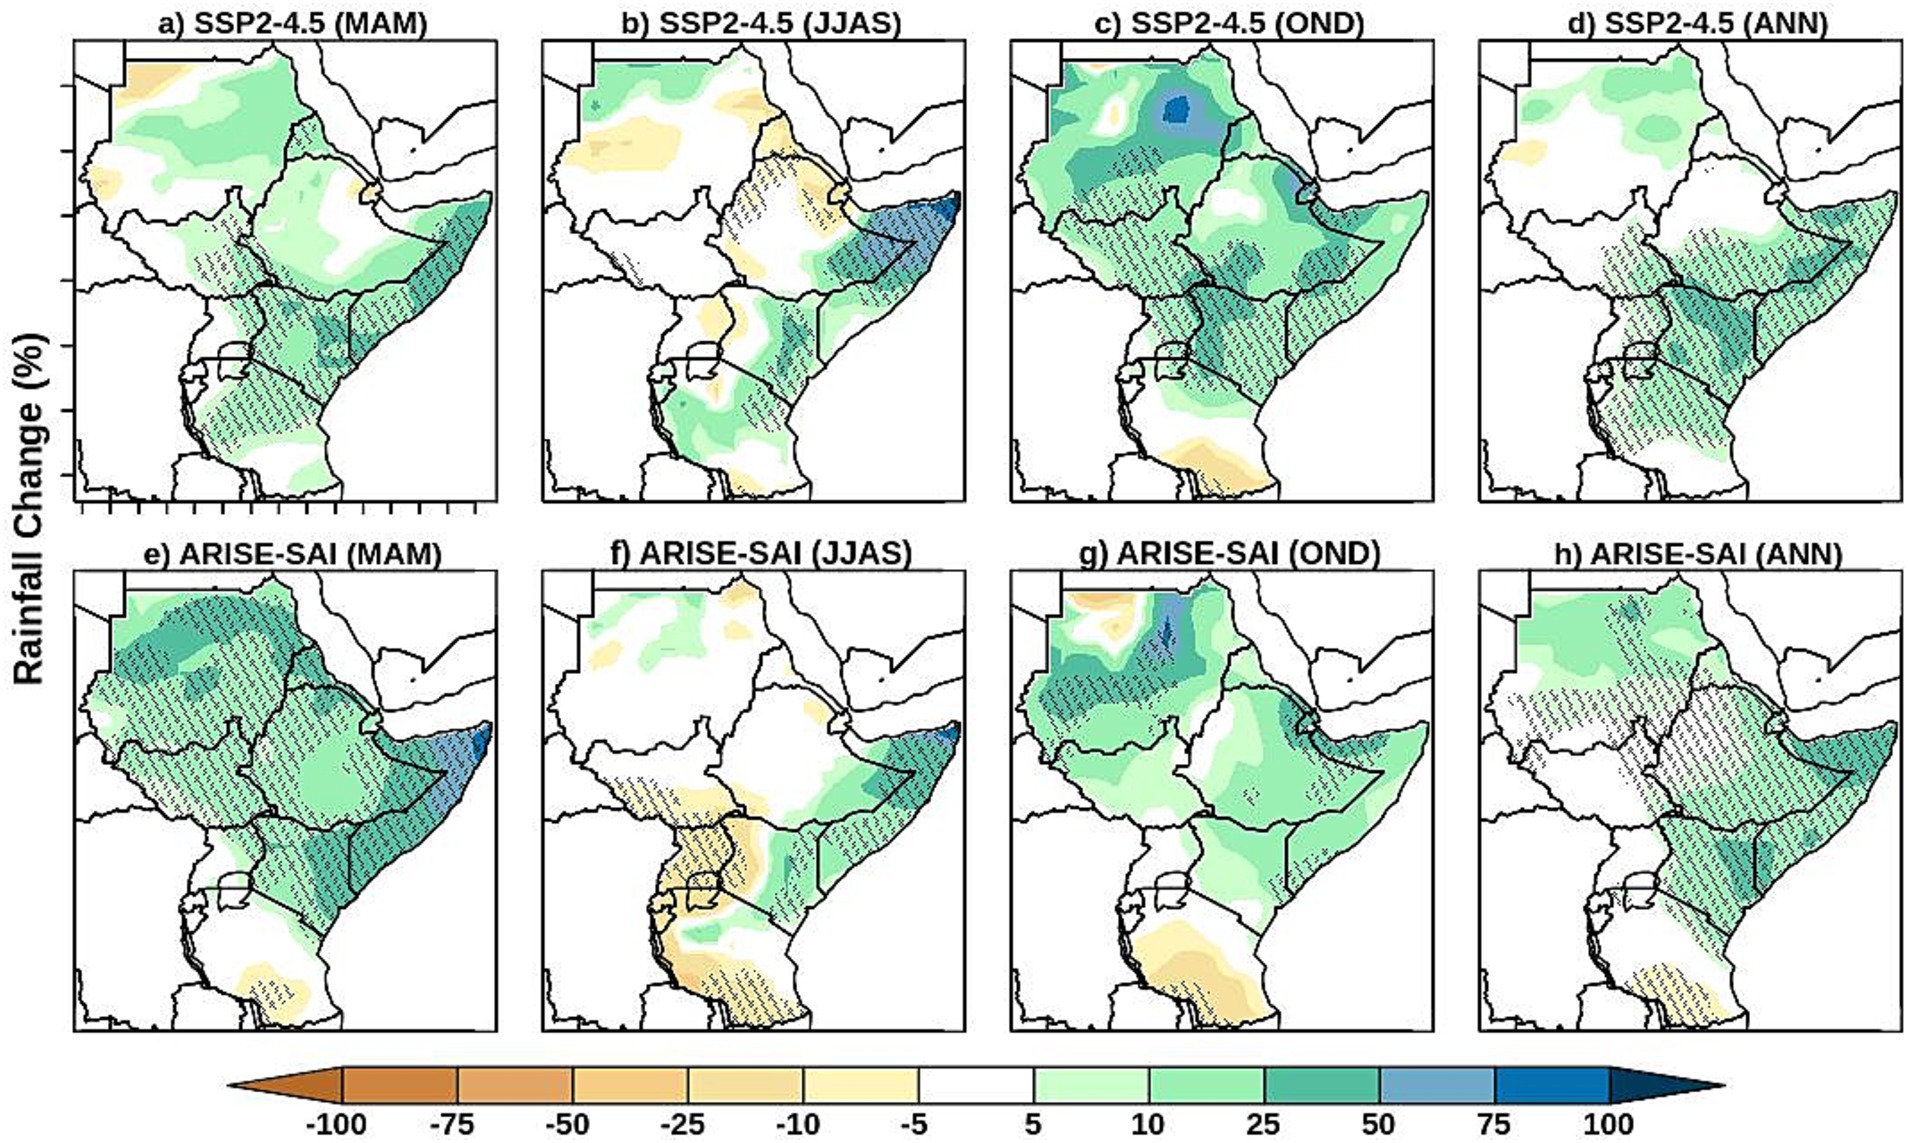
Figure 9. Projected rainfall changes over Eastern Africa (future minus current) for the mid-term future period [2050–2069], relative to the baseline period (2015–2034). The top row (panels a-d) shows projections under the SSP2-4.5 scenario, while the bottom row (panels e-h) shows results from the geo-engineered simulations. Columns represent March-May (MAM), June-September (JJAS), October-December (OND), and annual averages. Hatched areas indicate regions where changes are statistically significant at the 95% confidence level.
SSP2-4.5 simulations show increased rainfall over most of the region during the MAM season, with the highest values of up to 50% over the Horn of Africa. MAM is the main rainfall season for the equatorial eastern Africa, and the increase in rainfall over the equatorial parts of the region is statistically significant at the 95% confidence level. During the JJAS season, which is the main rainfall season in the northern sector, there is a projection of significant increase in rainfall over the Horn of Africa covering mainly southern Ethiopia, Somalia and eastern Kenya of up to 50%. However, rainfall is projected to decrease over the central and eastern parts of Sudan, northern parts of Ethiopia, most of Eritrea, Djibouti, as well as the border region of Kenya and Uganda. During the OND season, the second rainfall season for equatorial Eastern Africa, most parts of the region are projected to experience increased rainfall except in the southern parts of Tanzania which is projected to experience a decrease in rainfall by up to 10%. The increase in rainfall over the equatorial parts of the region is statistically significant at 95% confidence level. Overall, on an annual timescale, the equatorial region is projected to experience a statistically significant increase in rainfall at the 95% confidence level.
The ARISE-SAI simulations show a substantial increase in rainfall during the March–April–May (MAM) season across much of the region. Not only is the rainfall more widespread compared to the SSP2-4.5 scenario, but it is also heavier and statistically significant in most areas, except for Tanzania, where rainfall remains constant or decreases slightly. Given the critical importance of the MAM season for agriculture in the region, the impacts of increased rainfall on food security will depend on the spatial distribution and intra-seasonal characteristics of the rainfall. While increased rainfall could enhance crop yields, it could also be detrimental if it disrupts the planting cycles or triggers flooding.
During the JJAS season, the rainfall is projected to decrease over the western and southern Tanzania by up to 50%, except for the eastern part of Kenya, and the entire Somalia, with increased rainfall of up to 50% projected. During the OND season, the rainfall is projected to decrease over most of Tanzania, especially over the southern part where a decrease of up to 50% is projected. There is a projected increase in rainfall of up to 25% over Kenya and Somalia, but the rainfall over Uganda, northern Tanzania and most of South Sudan remains unchanged. The rainfall over Sudan is projected to increase by as much as 75% in the northern parts of the country. Annually, significant increases in rainfall are projected across most parts of the region, with the most substantial rise—approximately 50%—projected over the Horn of Africa. Conversely, southern Tanzania is expected to experience a decrease in rainfall during the same period. These changes vary in both magnitude and spatial extent compared to the near-term future period. In general, regions projected to experience a decrease or increase in rainfall during the near term under both scenarios are expected to see an intensification in both magnitude and spatial coverage in the mid-term future period.
3.4 Projected temperature and rainfall extremes
3.4.1 Temperature extremes
The spatial patterns of the projected changes in the annual mean Daily Temperature Range (DTR) and Warm Spell Duration Index (WSDI) for the near-term period (2035–2054) and the mid-term period (2050–2069) relative to the baseline period (2015–2034) under the SSP245 and ARISE-SAI modelling scenarios (not provided) suggest that the projected near-term and mid-term changes in both DTR and WSDI across the region are not significant under both scenarios and may be attributed to random noise in the data. There is however a reduction in WSDI across the region under the ARISE-SAI scenario, which is consistent with the findings of Ji et al. (2018) of projected decrease in WSDI over the tropics.
3.4.2 Rainfall extremes
Figure 10 presents the spatial patterns of the mean consecutive dry days (CDD) and consecutive wet days (CWD) for the baseline period (2015–2034) and the projected changes in the mid-term (2050–2069) under two scenarios: with SRM intervention (ΔARISE[SAI]) and without intervention (ΔSSP2_4.5). The mid-term projections are compared relative to the baseline period.
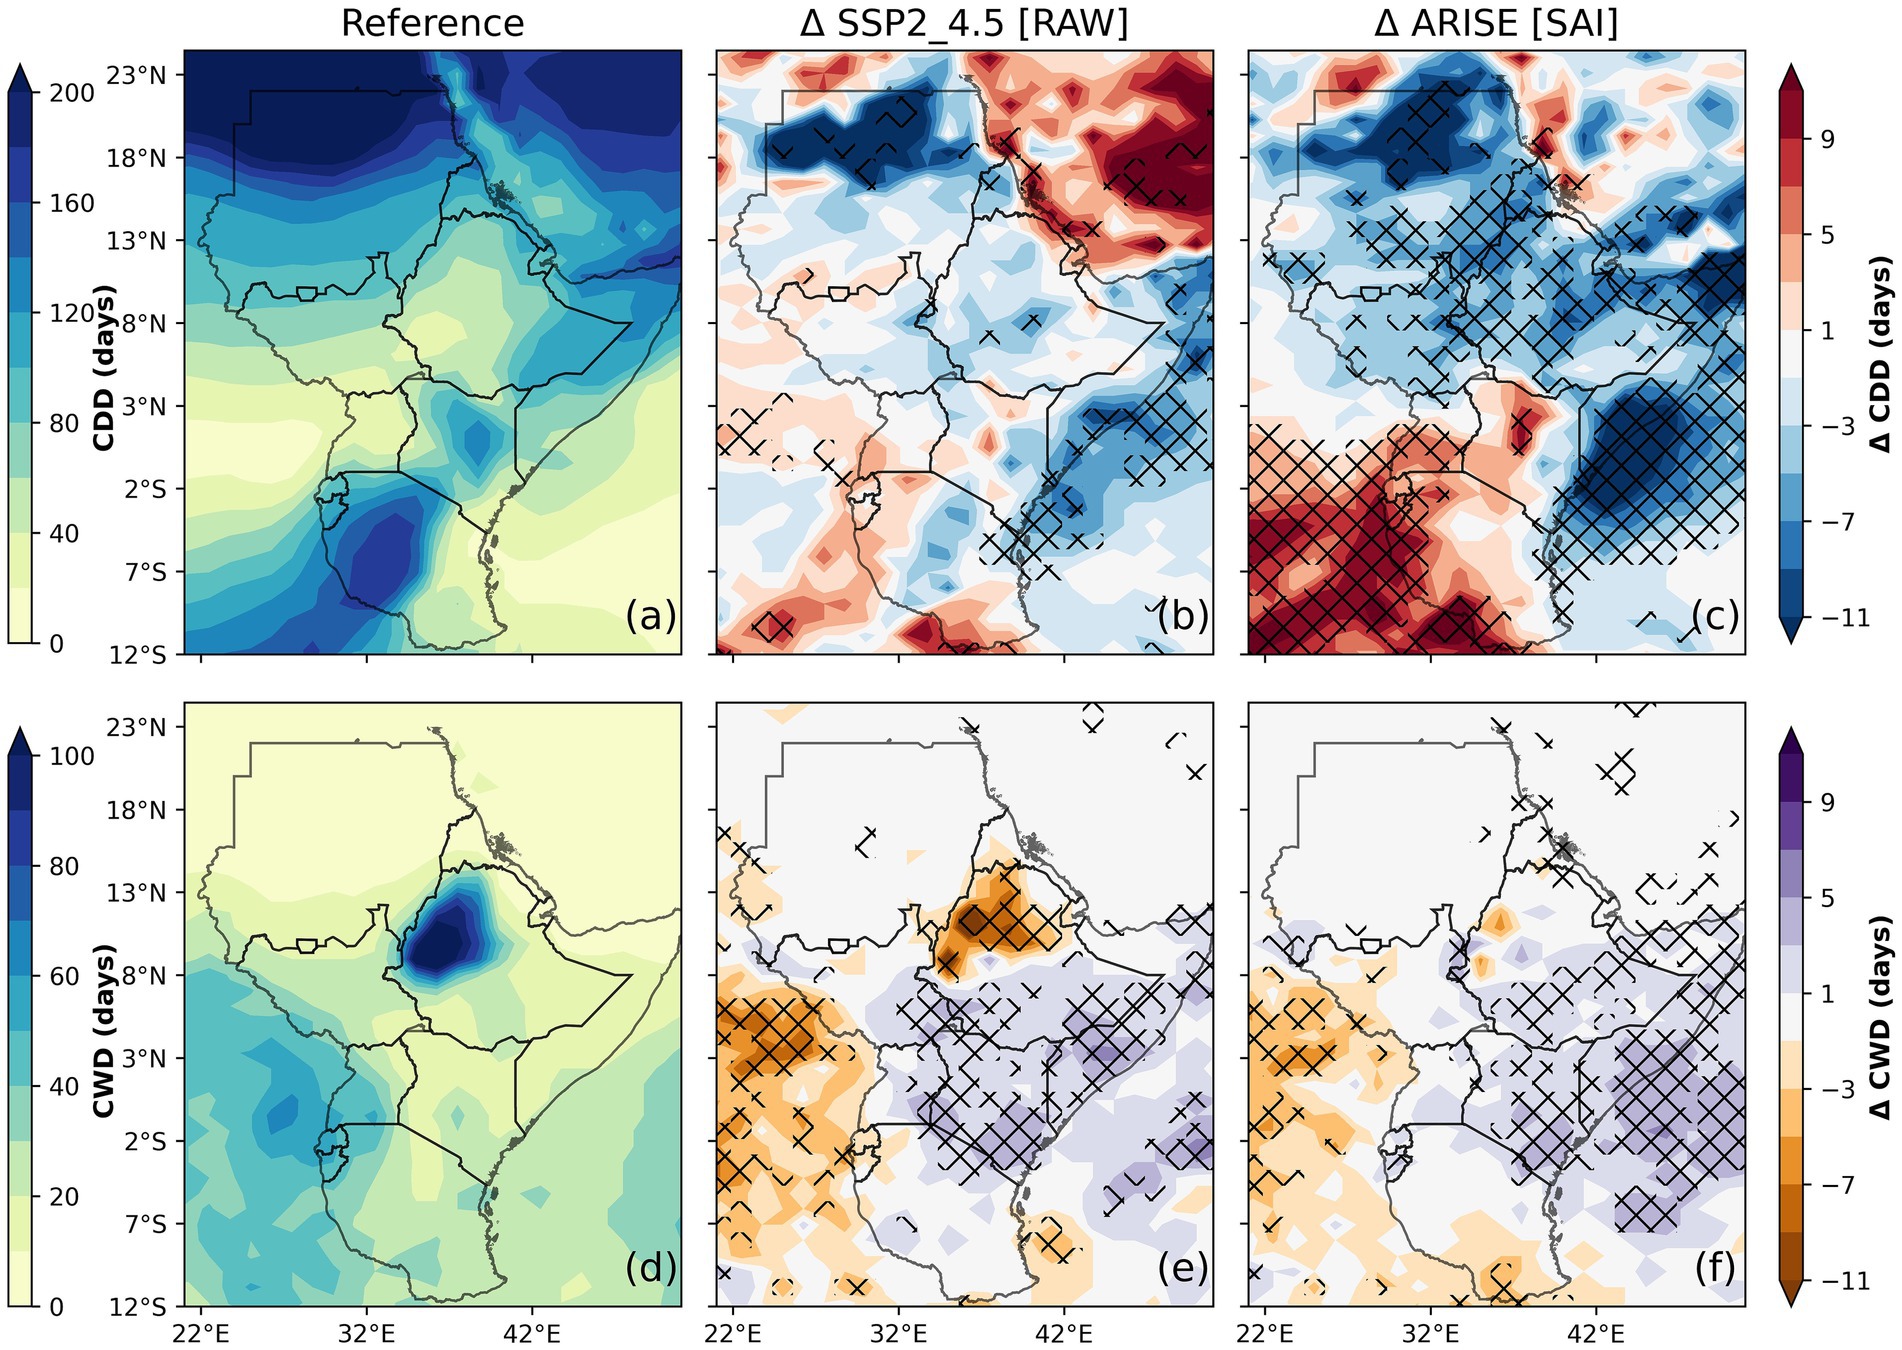
Figure 10. Rainfall extremes depicting the climatology for Consecutive Dry Days (CDD) and Consecutive Wet Days (CWD) as simulated by the raw model (first column: panels a,d). Projected future changes in CDD and CWD are shown for both raw model simulations (second column: panels b,e) and simulations with solar radiation management (SRM) intervention (third column: panels c,f) for the mid-term period (2050–2069). Results are presented as ensemble means. Hatched areas indicate regions where changes are statistically significant at the 95% confidence level.
The spatial patterns during the baseline period (Figure 10a) indicate that the highest values of CDD are projected for much of Sudan, Djibouti, eastern Ethiopia, most of Somalia, eastern Kenya, and western Tanzania. These areas largely overlap with the region’s arid and semi-arid lands. Conversely, low CDD values are simulated for western Ethiopia, southern South Sudan, much of Uganda, western and coastal Kenya, and eastern Tanzania. Under the SSP245 scenario (Figure 10b), projected changes in CDD suggest a possibility of a significant reduction of CDD by over 3 days in central Ethiopia, coastal parts of Tanzania, Kenya, and Somalia, as well as Eritrea and northern parts of Sudan. Under the SAI scenario (Figure 10c), most of the northern and coastal parts of the region are projected to experience a significant reduction in CDD of more than 3-days. Conversely, a significant increase of between 3 and 11 days in CDD is projected for much of the southwestern parts of the region as well as a few areas in northern Kenya.
The mean spatial patterns of the baseline period for consecutive wet days (CWD), Figure 10d shows that the Ethiopian highlands are simulated to receive the highest number of CWD in the region, followed by western Uganda, Rwanda, Burundi, and northwestern Tanzania. Under the SSP245 scenario, projected changes in CWD indicate a significant decrease of up to 10 days over northwestern Ethiopia, as well as some localized areas in western Sudan and South Sudan. In contrast, areas around the Turkana Low-Level Jet stream exit region, in southeastern South Sudan, much of southern Ethiopia, most of Kenya and Somalia, and northern Tanzania near the Mt. Kilimanjaro region are projected to experience notable increases in CWD, ranging between 1 and 5 days (Figure 10e). However, the most striking impact of SAI is projected in northwestern Ethiopia, with significant decrease in CWD under SSP245 scenario, is not evident. Additionally, much of eastern Kenya and the Horn of Africa region are projected to experience significant increases in CWD (Figure 10f). Generally, the projected changes in both CDD and CWD during the near-term period are likely to intensify in magnitude and expand over a larger spatial extent by the mid-term period under both scenarios.
3.5 Ensemble spread in rainfall and temperature extremes
The spatial plots of rainfall and temperature extremes were based on ensemble means, which do not capture the detailed variations within each ensemble member. To evaluate the spread among ensemble members, boxplots were utilised. The results of this assessment are shown in Figure 11 illustrating the projected changes of the mid-term period relative to the baseline period as simulated by the SSP245 and ARISE-SAI. A similar analysis was conducted for the near-term period; however, the results are not shown, as no significant signals were observed.
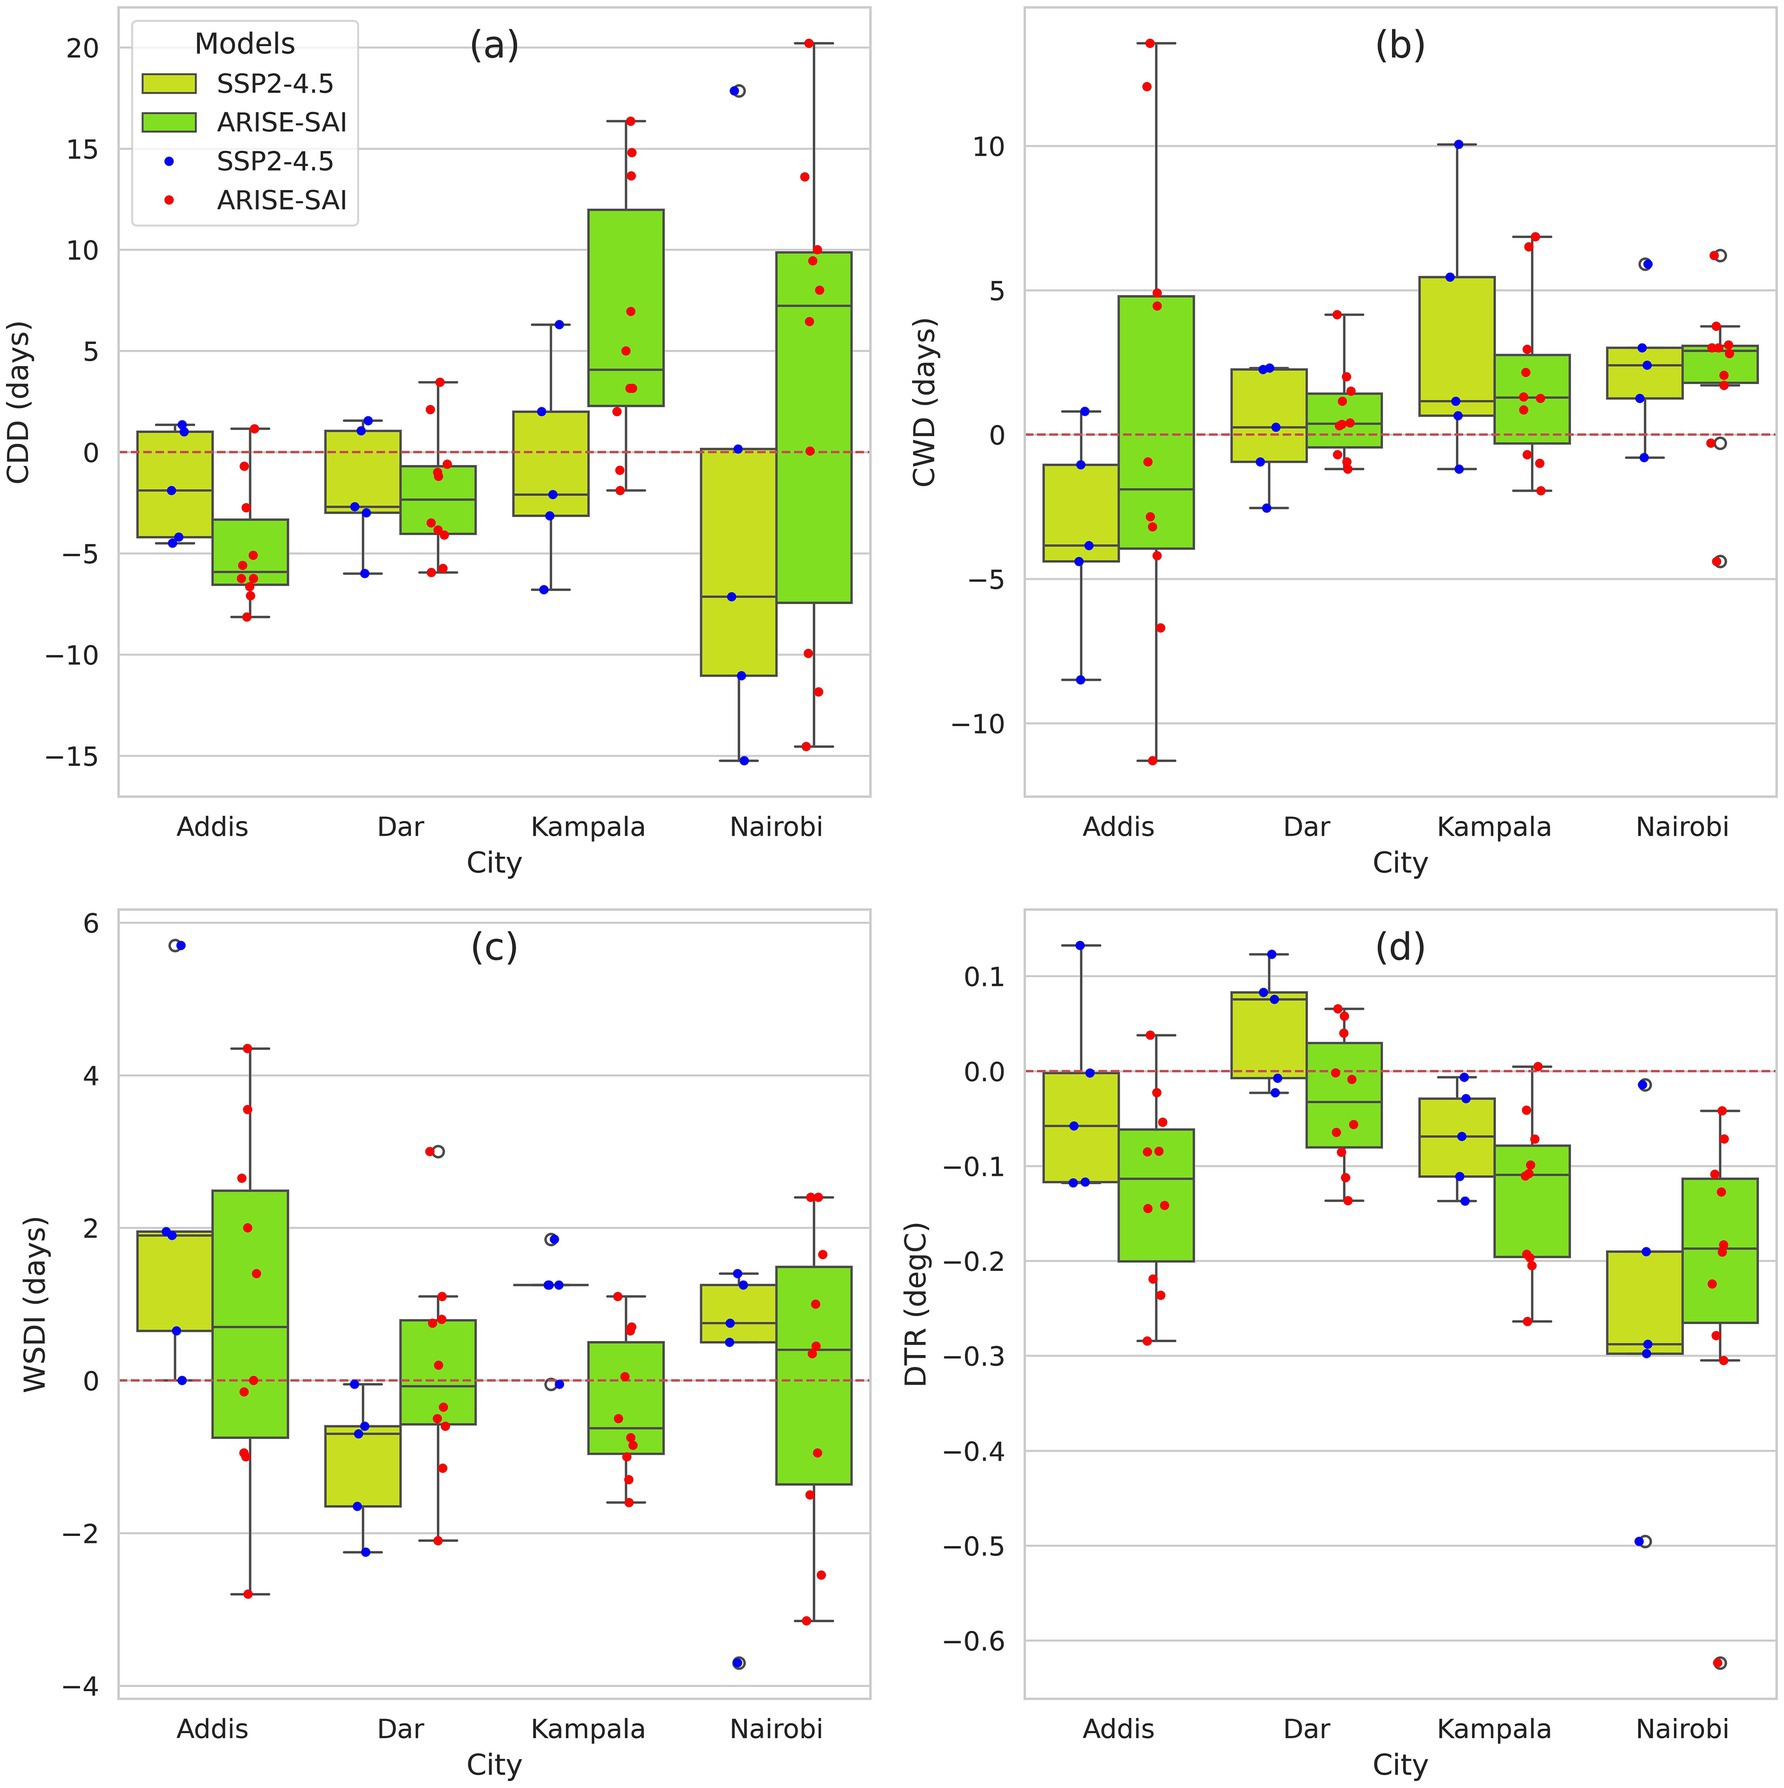
Figure 11. Box plots showing the range of projected changes in extreme climate events for the mid-term future period (2050–2069), relative to the baseline period (2015–2034) across four Eastern African cities: Addis Ababa, Dar es Salaam (Dar), Kampala, and Nairobi. Panels illustrate changes in (a) Consecutive Dry Days (CDD), (b) Consecutive Wet Days (CWD), (c) Warm Spell Duration Index (WSDI), and (d) Daily Temperature Range (DTR). Projections from SSP2-4.5 simulations are represented in sage green boxes, while ARISE-SAI simulations are represented in green boxes.
In the mid-term future period, most ensemble members project a decrease in CDD under both SSP245 and ARISE-SAI scenarios for Addis Ababa and Dar es Salaam, as shown in Figure 11a. The spread among ensemble members is widest for Nairobi when simulating CDD under both scenarios. Conversely, the spread for CWD is widest in Addis Ababa compared to the other three Eastern Africa cities (Figure 11b), a trend consistent with near-term simulations.
For temperature extremes, most ensemble members under the SSP245 scenario consistently project an increase in the WSDI for Addis Ababa and Nairobi, but a decrease for Dar es Salaam and Kampala, as illustrated in Figure 11c. Under the ARISE-SAI scenario, the spread among ensemble members is particularly wide for Addis Ababa and Nairobi. Except for Nairobi, most ensemble members simulate higher DTR under the SSP245 scenario compared to ARISE-SAI, as depicted in Figure 11d. Across all cities, all ensemble members under the ARISE-SAI scenario projects a decrease in DTR.
3.6 Projected changes in the frequency of severe and extreme rainfall events
The Standardized Precipitation-Evapotranspiration Index (SPEI) was calculated for each of the ensemble members under both the SSP2-4.5 and ARISE-SAI scenarios, focusing on the major cities in Eastern Africa: Addis Ababa, Dar es Salaam, Kampala, and Nairobi. Figure 12 illustrates the results of the projected changes in the near-term future period, while Figure 13 shows the corresponding outcomes for the mid-term future period.
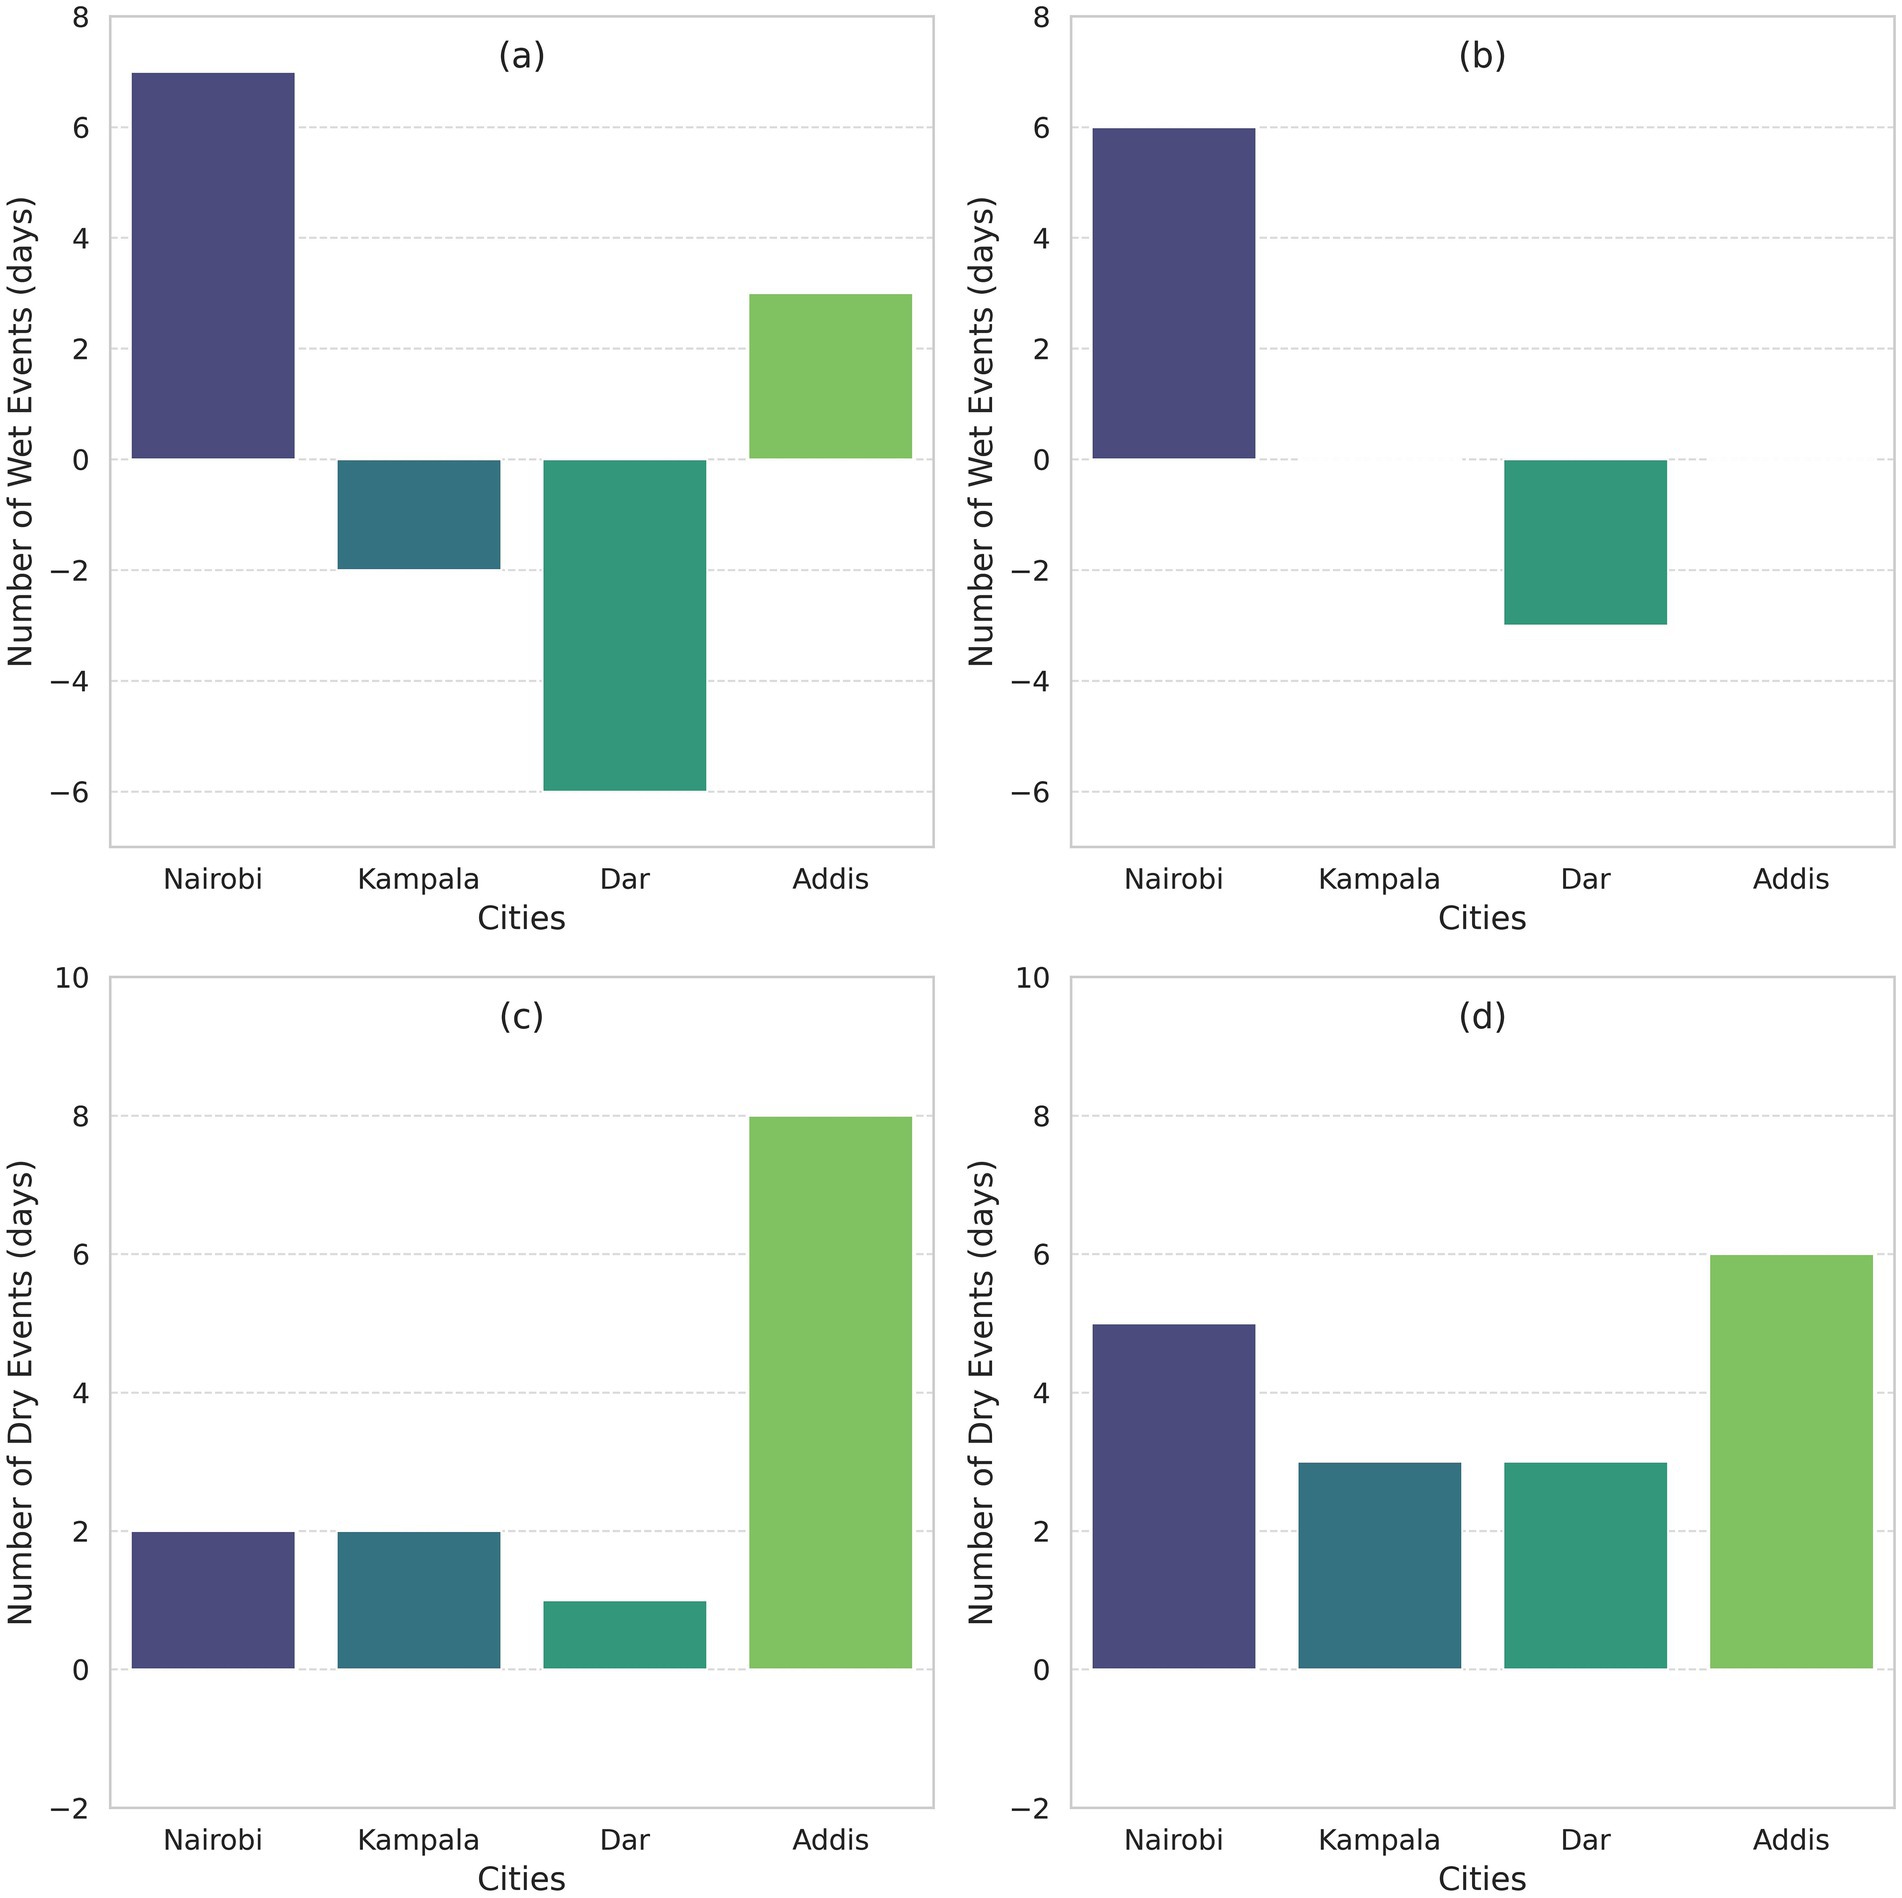
Figure 12. Projected changes in wet and dry events based on the SPEI categories for severe and extreme under the SSP2-4.5 and ARISE-SAI simulations for the near-term future period (2035–2054), relative to the baseline period (2015–2034) across four Eastern African cities: Addis Ababa, Dar es Salaam (Dar), Kampala, and Nairobi. Panels illustrate changes in frequency of wet events for SSP2-4.5 and ARISE-SAI scenarios (a,b respectively) and dry events for SSP2-4.5 and ARISE-SAI scenarios (c,d respectively).
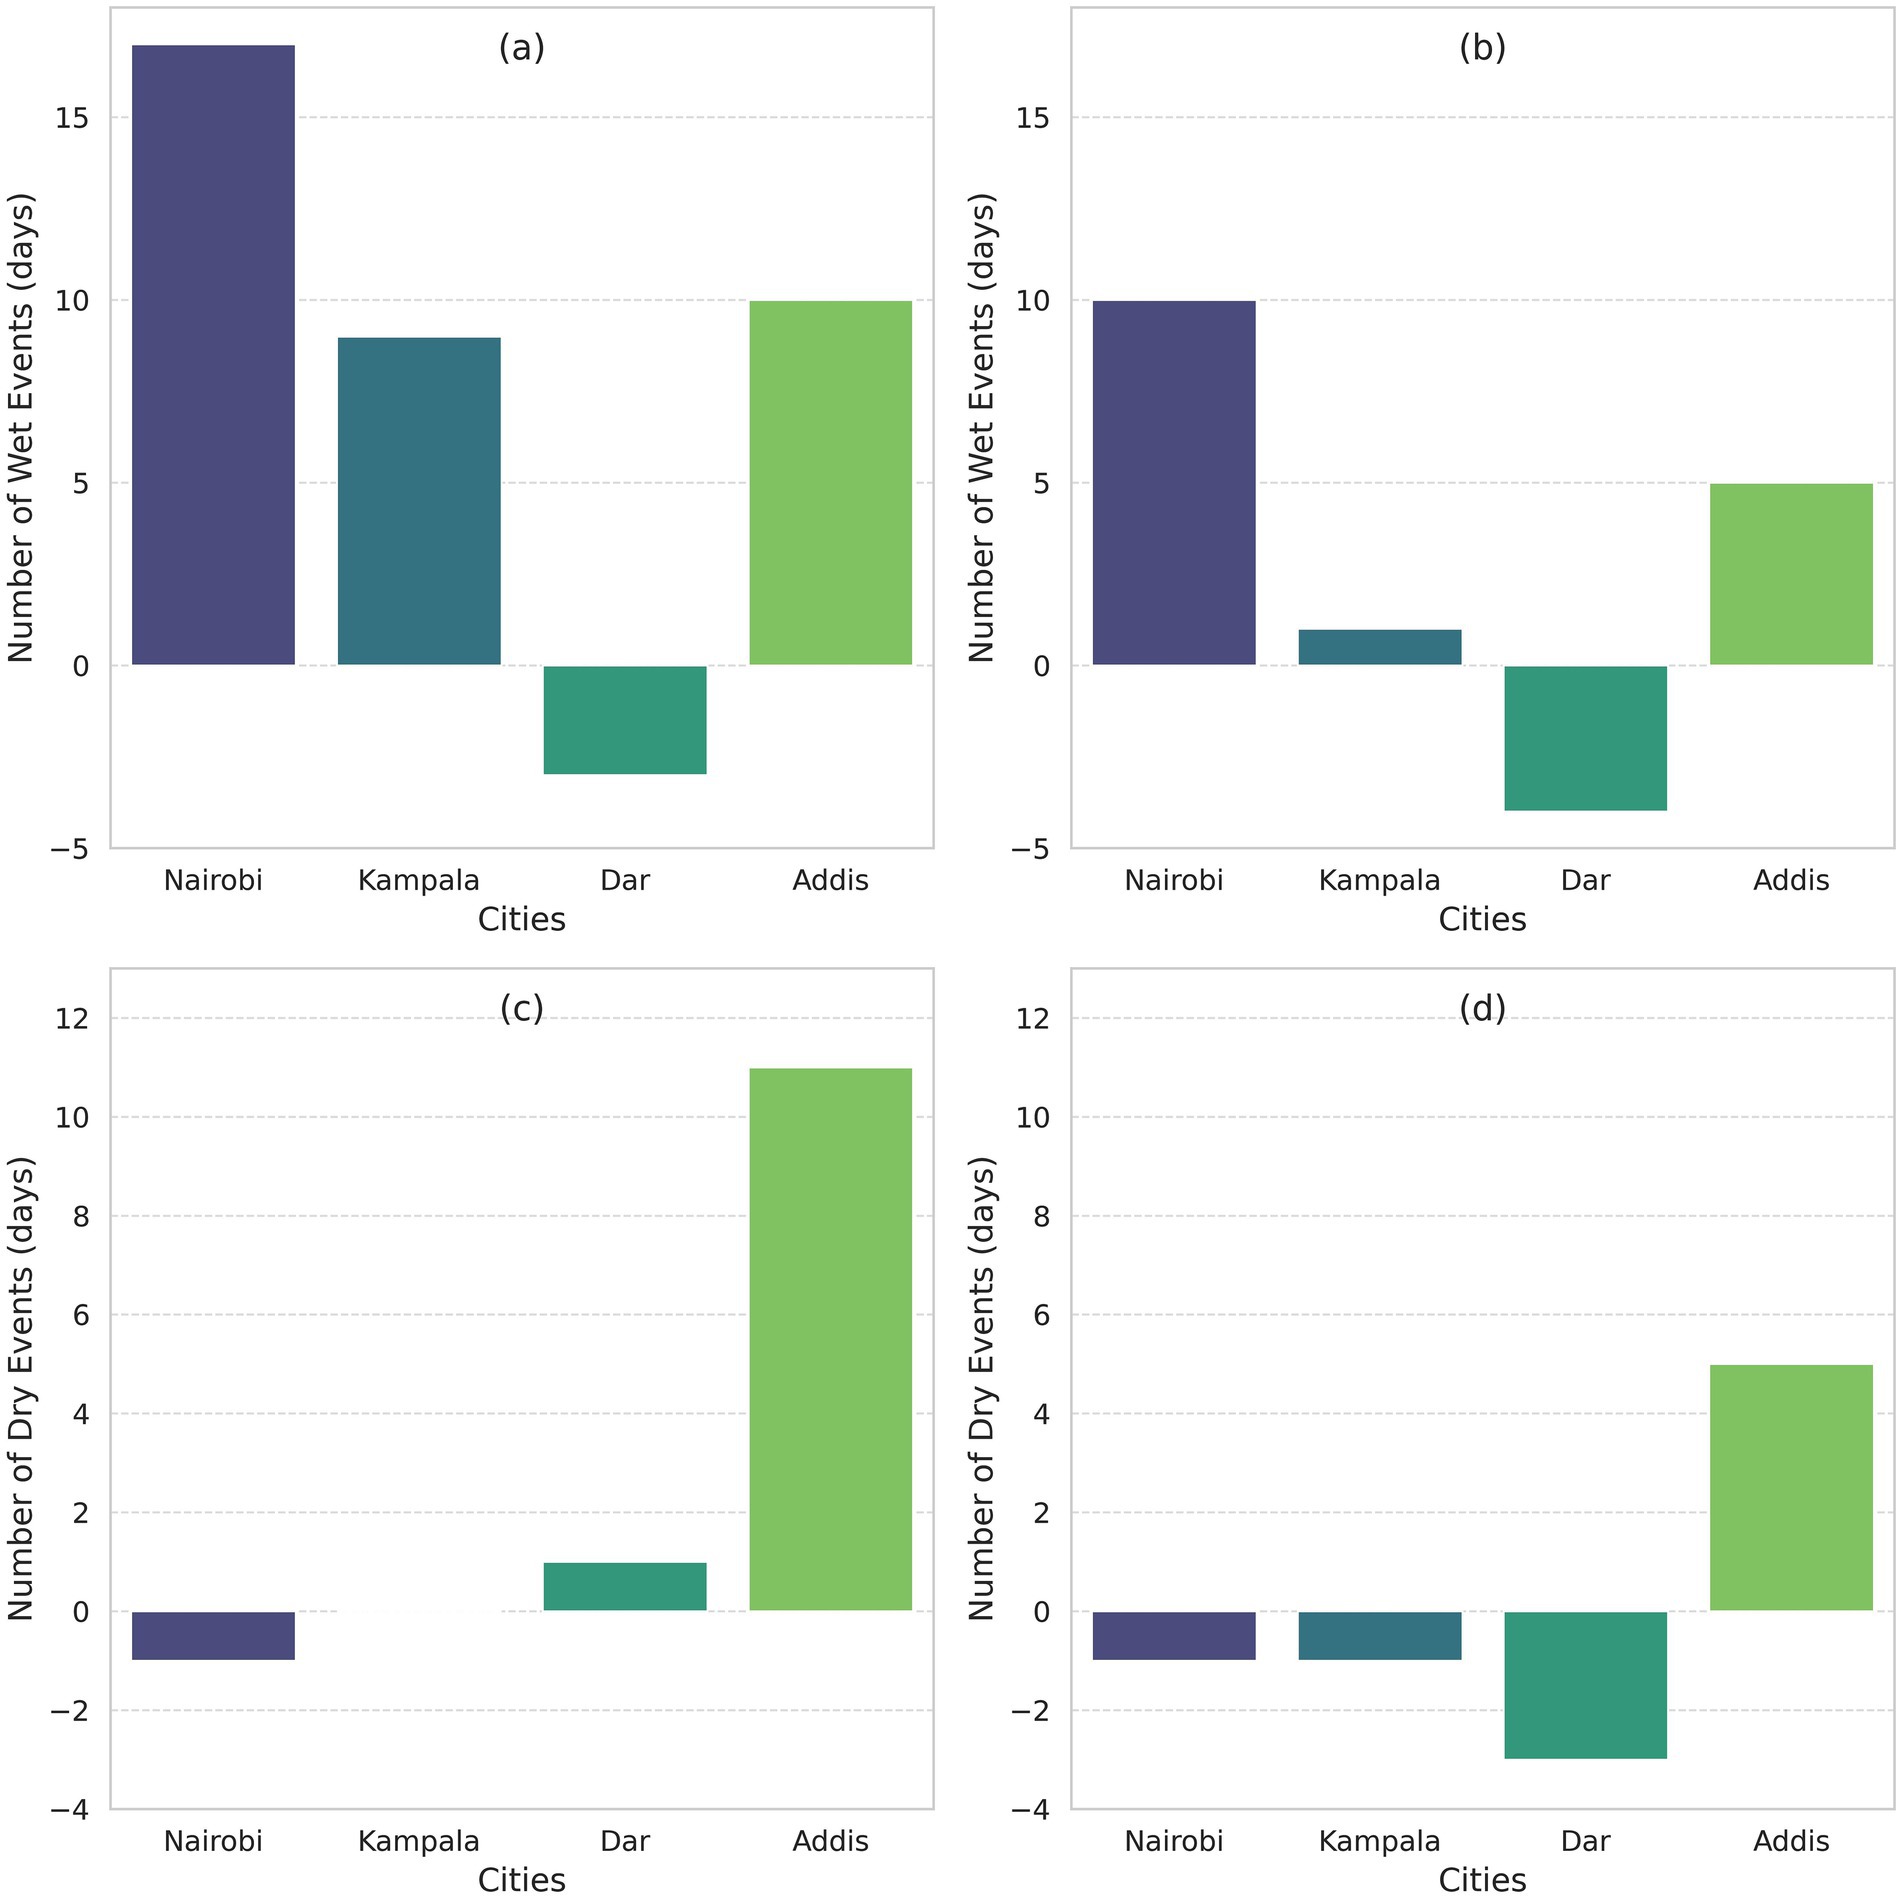
Figure 13. Projected changes in wet and dry events based on the SPEI categories for severe and extreme under the SSP2-4.5 and ARISE-SAI simulations for the mid-term future period (2035–2054), relative to the baseline period (2015–2034) across four Eastern African cities: Addis Ababa, Dar es Salaam (Dar), Kampala, and Nairobi. Panels illustrate changes in frequency of wet events for SSP2-4.5 and ARISE-SAI scenarios (a,b respectively) and dry events for SSP2-4.5 and ARISE-SAI scenarios (c,d respectively).
The results for the near-term future period project an increase in severe and extreme wet events in Nairobi and Addis Ababa, while a decrease is projected in Kampala and Dar es Salaam under the SSP2-4.5 scenario (Figure 12a). Conversely, the ARISE-SAI scenario has no impact on the projected frequency of extreme wet events in Nairobi. In contrast, for cities such as Kampala and Addis Ababa, the frequency of extreme wet events is projected to remain comparable to the baseline period under ARISE-SAI. For Dar es Salaam, the projected decrease in wet event frequency under ARISE-SAI will be half of that projected under SSP2-4.5 (Figure 12b). Meanwhile, severe and extreme dry events are projected to increase under both scenarios, with Addis Ababa expected to experience more frequent dry events under SSP2-4.5 (Figure 12c). However, under the ARISE-SAI scenario, all cities are projected to experience an increase in dry events, except Addis Ababa, which is projected to experience a reduction in the frequency of dry events (Figure 12d).
For the mid-term future period, most cities are projected to experience an increase in the frequency of severe to extreme wet events under the SSP2-4.5 scenario, except for Dar es Salaam (Figure 13a). Under the ARISE-SAI scenario, a similar pattern is projected across all cities, though with a reduced magnitude, except for Dar es Salaam, where the projected decrease in wet events is more (Figure 13b). For severe to extreme dry events, SSP2-4.5 projections indicate an increase in two of the four cities—Dar es Salaam and Addis Ababa—while Nairobi is expected to experience a decrease, and Kampala is projected to experience a frequency comparable to the baseline period (Figure 13c). In contrast, under the ARISE-SAI scenario, a decrease in severe to extreme dry events is projected across all cities except Addis Ababa, where the increase is expected to be nearly half of that projected under SSP2-4.5 (Figure 13d).
Overall, the findings suggest that SRM may have a moderating effect on the frequency of severe and extreme wet and dry events. However, the impact is not uniform across all cities, as SRM could increase these events in some areas while reducing them in others. The reduction (increase) in wet (dry) events in certain cities may be linked to decreased evapotranspiration caused by SRM-induced cooling, as observed by Abiodun et al. (2021). These results are consistent with Coughlan de Perez et al. (2022), who found that geoengineering could intensify drought conditions in parts of East Africa. Abiodun et al. (2021) also noted that the level of SAI needed to counteract temperature changes may overcompensate for precipitation effects, particularly in tropical regions.
4 Conclusion
This study investigates the potential effects of Solar Radiation Management (SRM) using Stratospheric Aerosol Injections (SAI) on the climate of Eastern Africa focusing on four urban centers (Addis Ababa, Dar es Salaam, Kampala, and Nairobi). We analyzed climate simulations from the Community Earth System Model with the Whole Atmosphere Community Climate Model [CESM2(WACCM6)] with and without SAI under the SSP2-4.5 emissions scenario using the Assessing Responses and Impacts of Solar climate intervention on the Earth system with stratospheric aerosol injection (ARISE-SAI) simulations to assess the projected changes.
The CESM2 (WACCM6) model was evaluated for its ability to represent observed climatic conditions over the region during the period 1980–2010, prior to its use for future projections. The results demonstrate a good agreement between the model and observed data in capturing the spatial distribution of rainfall and temperature, with topography playing a significant role. The seasonal cycles of both rainfall and temperature are well represented for the four cities analyzed. While the model performs reasonably well overall, it tends to overestimate rainfall for Addis Ababa and Kampala, as well as temperature values for Nairobi, Dar es Salaam, and Addis Ababa. Despite these biases, CESM2 (WACCM6) effectively captures the spatial distribution of extreme precipitation indices (CDD, CWD, SPEI) and extreme temperature indices (DTR, WSDI) considered in this study.
As expected, the results indicate that SAI could help stabilize surface temperatures near historical averages. Projected changes in annual mean temperatures for Eastern Africa in the mid-term (2050–2069), relative to the 2015–2034 baseline, show that SSP2-4.5 simulations project temperature increases of up to 1.5°C, while ARISE-SAI simulations project no significant changes in most parts of the region. In addition, ARISE-SAI projects a general spatial decrease in both the Daily Temperature Range (DTR) and the Warm Spell Duration Index (WSDI) throughout the simulation period (2035–2069) relative to SSP2-4.5 alone. However, ARISE-SAI simulations show a larger spread in the changes in WSDI, and an inconsistent direction of change across the four major cities.
Projected changes in precipitation do not show a conclusive finding under the ARISE-SAI scenario with respect to the SSP2-4.5 scenario alone. On an annual timescale, both SSP2-4.5 and ARISE-SAI simulations project a significant increase in rainfall over the equatorial parts of the region in the mid-term (2050–2069), relative to the 2015–2034 baseline. ARISE-SAI projects greater variability in the number of CDD and CWD across model members. Furthermore, ARISE-SAI projects considerable increases in CDD north of 3°N, and a significant increase in CWD over northwestern Ethiopia, relative to SSP2-4.5 with considerable implications for agriculture. Although no uniformity was observed across all cities, SRM intervention was found to generally have an impact on modulating the frequency of severe to extreme wet and dry events which can be attributed to decreased evapotranspiration Abiodun et al. (2021).
The study suggests that SRM with SAI technology could have a significant impact on temperature, rainfall, and extreme weather events in the Greater Horn of Africa (GHA) region, both in the near- and mid-term futures. While the analysis was based on a single set of simulations (ARISE-SAI), the findings indicate that SAI could mitigate temperature increases, but its effects on the precipitation patterns remain uncertain. These outcomes should be interpreted with caution when informing policy decisions, and further research incorporating a wider range of scenarios is crucial since the results are specific to the approach of SRM applied, the modelling experiments employed, and the scenarios considered.
Data availability statement
Publicly available datasets were analyzed in this study. This data can be found here: https://doi.org/10.26024/0cs0-ev98, https://data.chc.ucsb.edu/products/CHIRPS-2.0/, and https://data.ceda.ac.uk/badc/cru/data.
Author contributions
HM: Conceptualization, Data curation, Formal analysis, Methodology, Visualization, Writing – original draft, Writing – review & editing. HE: Conceptualization, Data curation, Formal analysis, Investigation, Methodology, Visualization, Writing – original draft, Writing – review & editing. FO: Conceptualization, Funding acquisition, Project administration, Resources, Supervision, Writing – original draft, Writing – review & editing. JO: Conceptualization, Formal analysis, Investigation, Methodology, Visualization, Writing – original draft. BB: Conceptualization, Writing – review & editing. MT: Writing – review & editing. DM: Writing – review & editing.
Funding
The author(s) declare that financial support was received for the research and/or publication of this article. This work was supported by the Degrees Modelling Fund (formerly the DECIMALS Fund) through The World Academy of Sciences (TWAS) (Contract Number: 4500445436).
Acknowledgments
The climate material is based upon work supported by the National Science Foundation National Center for Atmospheric Research (NSF NCAR), which is a major facility sponsored by the National Science Foundation under Cooperative Agreement no. 1852977 and by SilverLining through its Safe Climate Research Initiative. The Community Earth System Model (CESM) project is supported primarily by the National Science Foundation. Computing and data storage resources, including the Cheyenne supercomputer (doi: 10.5065/D6RX99HX), were provided by the Computational and Information Systems Laboratory (CISL) at NSF NCAR.
Conflict of interest
The authors declare that the research was conducted in the absence of any commercial or financial relationships that could be construed as a potential conflict of interest.
Generative AI statement
The author(s) declare that Gen AI was used in the creation of this manuscript. Generative AI was used in correcting grammar and increasing overall readability and not the content of the manuscript.
Publisher’s note
All claims expressed in this article are solely those of the authors and do not necessarily represent those of their affiliated organizations, or those of the publisher, the editors and the reviewers. Any product that may be evaluated in this article, or claim that may be made by its manufacturer, is not guaranteed or endorsed by the publisher.
Reference
Abiodun, B. J., Odoulami, R. C., Sawadogo, W., Oloniyo, O. A., Abatan, A. A., New, M., et al. (2021). Potential impacts of stratospheric aerosol injection on drought risk managements over major river basins in Africa. Clim. Chang. 169, 1–19. doi: 10.1007/s10584-021-03268-w
Alamou, A. E., Obada, E., Biao, E. I., Zandagba, E. B. J., Da-Allada, C. Y., Bonou, F. K., et al. (2022). Impact of stratospheric aerosol geoengineering on meteorological droughts in West Africa. Atmosfera 13:234. doi: 10.3390/atmos13020234
Bednarz, E. M., Butler, A. H., Visioni, D., Zhang, Y., Kravitz, B., and MacMartin, D. G. (2023). Injection strategy–a driver of atmospheric circulation and ozone response to stratospheric aerosol geoengineering. Atmos. Chem. Phys. 23, 13665–13684. doi: 10.5194/acp-23-13665-2023
Bruffaerts, C., Verardi, V., and Vermandele, C. (2014). A generalized boxplot for skewed and heavy-tailed distributions. Stat. Probab. Lett. 95, 110–117. doi: 10.1016/j.spl.2014.08.016
Coughlan de Perez, E., Fuentes, I., Jack, C., Kruczkiewicz, A., Pinto, I., and Stephens, E. (2022). Different types of drought under climate change or geoengineering: systematic review of societal implications. Front. Clim. 4:959519. doi: 10.3389/fclim.2022.959519
Da-Allada, C. Y., Baloïtcha, E., Alamou, E. A., Awo, F. M., Bonou, F., Pomalegni, Y., et al. (2020). Changes in west African summer monsoon precipitation under stratospheric aerosol geoengineering. Earth's Future 8:e2020EF001595. doi: 10.1029/2020EF001595
Danandeh Mehr, A., Sorman, A. U., Kahya, E., and Hesami Afshar, M. (2020). Climate change impacts on meteorological drought using SPI and SPEI: case study of Ankara, Turkey. Hydrol. Sci. J. 65, 254–268. doi: 10.1080/02626667.2019.1691218
Fasullo, J. T., and Richter, J. H. (2023). Dependence of strategic solar climate intervention on background scenario and model physics. Atmos. Chem. Phys. 23, 163–182. doi: 10.5194/acp-23-163-2023
Funk, C., Peterson, P., Landsfeld, M., Pedreros, D., Verdin, J., Shukla, S., et al. (2015). The climate hazards infrared precipitation with stations—a new environmental record for monitoring extremes. Sci. Data 2:150066. doi: 10.1038/sdata.2015.66
Gebrechorkos, S. H., Hülsmann, S., and Bernhofer, C. (2019). Long-term trends in rainfall and temperature using high-resolution climate datasets in East Africa. Sci. Rep. 9:11376. doi: 10.1038/s41598-019-47933-8
Gettelman, A., Mills, M. J., Kinnison, D. E., Garcia, R. R., Smith, A. K., Marsh, D. R., et al. (2019). The whole atmosphere community climate model version 6 (WACCM6). J. Geophys. Res. Atmos. 124, 12380–12403. doi: 10.1029/2019JD030943
Gudoshava, M., Misiani, H. O., Segele, Z. T., Jain, S., Ouma, J. O., Otieno, G., et al. (2020). Projected effects of 1.5 C and 2 C global warming levels on the intra-seasonal rainfall characteristics over the greater horn of Africa. Environ. Res. Lett. 15:034037. doi: 10.1088/1748-9326/ab6b33
Haile, G. G., Tang, Q., Hosseini-Moghari, S. M., Liu, X., Gebremicael, T. G., Leng, G., et al. (2020). Projected impacts of climate change on drought patterns over East Africa. Earth's Future 8:e2020EF001502. doi: 10.1029/2020EF001502
Harris, I., Jones, P. D., Osborn, T. J., and Lister, D. H. (2014). Updated high-resolution grids of monthly climatic observations - the CRU TS3.10 dataset. Int. J. Climatol. 34, 623–642. doi: 10.1002/joc.3711
Henry, M., Haywood, J., Jones, A., Dalvi, M., Wells, A., Visioni, D., et al. (2023). Comparison of UKESM1 and CESM2 simulations using the same multi-target stratospheric aerosol injection strategy. Atmos. Chem. Phys. 23, 13369–13385. doi: 10.5194/acp-23-13369-2023
Indeje, M., and Semazzi, F. H. M. (2000). Relationships between QBO in the lower equatorial stratospheric zonal winds and east African seasonal rainfall. J. Meteorol. Atmos. Phys. 73, 227–244. doi: 10.1007/s007030050075
Indeje, M., Semazzi, F. H. M., and Ogallo, L. J. (2000). ENSO signals in east African rainfall and their prediction potentials. Int. J. Climatol. 20, 19–46. doi: 10.1002/(SICI)1097-0088(200001)20:1<19::AID-JOC449>3.0.CO;2-0
Iyer, G. C., Edmonds, J. A., Fawcett, A. A., Hultman, N. E., Alsalam, J., Asrar, G. R., et al. (2015). The contribution of Paris to limit global warming to 2 C. Environ. Res. Lett. 10:125002. doi: 10.1088/1748-9326/10/12/125002
Ji, D., Fang, S., Curry, C. L., Kashimura, H., Watanabe, S., Cole, J. N., et al. (2018). Extreme temperature and precipitation response to solar dimming and stratospheric aerosol geoengineering. Atmos. Chem. Phys. 18, 10133–10156. doi: 10.5194/acp-18-10133-2018
Kinuthia, J. H., and Asnani, G. C. (1982). A newly found jet in North Kenya (Turkana Channel). Mon. Weather Rev. 110, 1722–1728. doi: 10.1175/1520-0493(1982)110<1722:ANFJIN>2.0.CO;2
Klutse, N. A. B., Ajayi, V. O., Gbobaniyi, E. O., Egbebiyi, T. S., Kouadio, K., Nkrumah, F., et al. (2018). Potential impact of 1.5 °c and 2 °c global warming on consecutive dry and wet days over West Africa. Environ. Res. Lett. 13:055013. doi: 10.1088/1748-9326/aab37b
Kravitz, B., MacMartin, D. G., Visioni, D., Boucher, O., Cole, J. N., Haywood, J., et al. (2021). Comparing different generations of idealized solar geoengineering simulations in the geoengineering model Intercomparison project (GeoMIP). Atmos. Chem. Phys. 21, 4231–4247. doi: 10.5194/acp-21-4231-2021
Lee, S., Moriasi, D. N., Mehr, A. D., and Mirchi, A. (2024). Sensitivity of standardized precipitation and evapotranspiration index (SPEI) to the choice of SPEI probability distribution and evapotranspiration method. J. Hydrol. Region. Stud. 53:101761. doi: 10.1016/j.ejrh.2024.101761
MacMartin, D. G., Kravitz, B., Tilmes, S., Richter, J. H., Mills, M. J., Lamarque, J.-F., et al. (2017). The climate response to stratospheric aerosol geoengineering can be tailored using multiple injection locations. J. Geophys. Res. 122, 12574–12590. doi: 10.1002/2017JD026868
Maúre, G., Ndebele-Murisa, M., Nikulin, G., Lennard, C., Meque, A., Muthige, M., et al. (2018). The southern African climate under 1.5 °C and 2 °C of global warming as simulated by CORDEX regional climate models. Environ. Res. Lett. 13:065002. doi: 10.1088/1748-9326/aab190
McKee, Thomas B., Doesken, Nolan J., and Kleist, John. (1993). “The relationship of drought frequency and duration to time scales.” in Proceedings of the 8th Conference on Applied Climatology. Vol. 17. No. 22. Available online at: https://climate.colostate.edu/pdfs/relationshipofdroughtfrequency.pdf (Accessed March 23, 2025).
Mercer, A. M., Keith, D. W., and Sharp, J. D. (2011). Public understanding of solar radiation management. Environ. Res. Lett. 6:044006. doi: 10.1088/1748-9326/6/4/044006
Ming, T., Liu, W., and Caillol, S. (2014). Fighting global warming by climate engineering: is the earth radiation management and the solar radiation management any option for fighting climate change? Renew. Sust. Energ. Rev. 31, 792–834. doi: 10.1016/j.rser.2013.12.032
Moss, R., Edmonds, J., Hibbard, K., Manning, M. R., Rose, S. K., Van Vuuren, D., et al. (2010). The next generation of scenarios for climate change research and assessment. Nature 463, 747–756. doi: 10.1038/nature08823
Mukabana, J. R., and Pielke, R. A. (1996). Investigating the influence of synoptic-scale monsoonal winds and mesoscale circulations and diurnal weather patterns over Kenya using a mesoscale numerical model. Mon. Weather Rev. 124, 224–244. doi: 10.1175/1520-0493(1996)124<0224:ITIOSS>2.0.CO;2
Nikulin, G., Lennard, C., Dosio, A., Kjellström, E., Chen, Y., Hänsler, A., et al. (2018). The effects of 1.5 and 2 degrees of global warming on Africa in the CORDEX ensemble. Environ. Res. Lett. 13:065003. doi: 10.1088/1748-9326/aab1b1
Obahoundje, S., Nguessan-Bi, V. H., Diedhiou, A., Kravitz, B., and Moore, J. C. (2023). Implication of stratospheric aerosol geoengineering on compound precipitation and temperature extremes in Africa. Sci. Total Environ. 863:160806. doi: 10.1016/j.scitotenv.2022.160806
O'Connor, P. J., and Reimann, C. (1993). Multielement regional geochemical reconnaissance as an aid to target selection in Irish Caledonian terrains. J. Geochem. Explor. 47, 63–87. doi: 10.1016/0375-6742(93)90059-U
Ogallo, L. J. (1988). Relationship between seasonal rainfall in East Africa and southern oscillation. Int. J. Climatol. 8, 31–43. doi: 10.1002/joc.3370080104
Ogallo, L. J., Okoola, R. E., and Wanjohi, D. N. (1994). Characteristics of quasi-biennial oscillation over Kenya and their predictability potential for the seasonal rainfall. Mausam 45, 57–62. doi: 10.54302/mausam.v45i1.1878
Okoola, R. E. (1989). Westwards moving disturbances in the Southwest Indian Ocean. Meteorl. Atmos. Phys. 41, 35–44. doi: 10.1007/BF01032588
O'Neill, B. C., Tebaldi, C., van Vuuren, D. P., Eyring, V., Friedlingstein, P., Hurtt, G., et al. (2016). The scenario model intercomparison project (scenario MIP) for CMIP6. Geosci. Model Dev. 9, 3461–3482. doi: 10.5194/gmd-9-3461-2016
Onyutha, C. (2020). Analyses of rainfall extremes in East Africa based on observations from rain gauges and climate change simulations by CORDEX RCMs. Clim. Dyn. 54.11, 4841–4864. doi: 10.1007/s00382-020-05264-9
Osima, S., Indasi, V. S., Zaroug, M., Endris, H. S., Gudoshava, M., Misiani, H. O., et al. (2018). Projected climate over the greater horn of Africa under 1.5 C and 2 C global warming. Environ. Res. Lett. 13:065004. doi: 10.1088/1748-9326/aaba1b
Palmer, P. I., Wainwright, C. M., Dong, B., Maidment, R. I., Wheeler, K. G., Gedney, N., et al. (2023). Drivers and impacts of eastern African rainfall variability. Nat. Rev. Earth Environ. 4, 254–270. doi: 10.1038/s43017-023-00397-x
Patel, T. D., Odoulami, R. C., Pinto, I., Egbebiyi, T. S., Lennard, C., Abiodun, B. J., et al. (2023). Potential impact of stratospheric aerosol geoengineering on projected temperature and precipitation extremes in South Africa. Environ. Res. Clim. 2:035004. doi: 10.1088/2752-5295/acdaec
Pinto, I., Jack, C., Lennard, C., Tilmes, S., and Odoulami, R. C. (2020). Africa’s climate response to solar radiation management with stratospheric aerosol. Geophys. Res. Lett. 47:e2019GL086047. doi: 10.1029/2019GL086047
Richter, J. H., Visioni, D., MacMartin, D. G., Bailey, D. A., Rosenbloom, N., Dobbins, B., et al. (2022). Assessing responses and impacts of solar climate intervention on the earth system with stratospheric aerosol injection (ARISE-SAI): protocol and initial results from the first simulations. Geosci. Model Dev. 15, 8221–8243. doi: 10.5194/gmd-15-8221-2022
Schneider, D. P., Deser, C., Fasullo, J., and Trenberth, K. E. (2013). Climate data guide spurs discovery and understanding. Eos. Trans. AGU 94, 121–122. doi: 10.1002/2013EO130001
Schreck, C. J. III, and Semazzi, F. H. (2004). Variability of the recent climate of eastern Africa. Int. J. Climatol. 24, 681–701. doi: 10.1002/joc.1019
Seiler, R. A., Hayes, M., and Bressan, L. (2002). Using the standardized precipitation index for flood risk monitoring. Int. J. Climatol. 22, 1365–1376. doi: 10.1002/joc.799
Shepherd, J. G. (2009). Geoengineering the climate: science, governance and uncertainty. Royal Society. Available online at: http://eprints.soton.ac.uk/id/eprint/156647 (Accessed March 23, 2025).
Simpson, I. R., Tilmes, S., Richter, J. H., Kravitz, B., MacMartin, D. G., Mills, M. J., et al. (2019). The regional hydroclimate response to stratospheric sulfate geoengineering and the role of stratospheric heating. J. Geophys. Res. Atmos. 124, 12587–12616. doi: 10.1029/2019JD031093
Tilmes, S., Müller, R., and Salawitch, R. (2008). The sensitivity of polar ozone depletion to proposed geoengineering schemes. Science 320, 1201–1204. doi: 10.1126/science.1153966
Tilmes, S., Richter, J. H., Kravitz, B., MacMartin, D. G., Mills, M. J., Simpson, I. R., et al. (2018). CESM1 (WACCM) stratospheric aerosol geoengineering large ensemble project. Bull. Am. Meteorol. Soc. 99, 2361–2371. doi: 10.1175/BAMS-D-17-0267.1
Vicente-Serrano, S. M., Beguería, S., and López-Moreno, J. I. (2010). A multiscalar drought index sensitive to global warming: the standardized precipitation evapotranspiration index. J. Clim. 23, 1696–1718. doi: 10.1175/2009JCLI2909.1
Visioni, D., MacMartin, D. G., Kravitz, B., Richter, J. H., Tilmes, S., and Mills, M. J. (2020). Seasonally modulated stratospheric aerosol geoengineering alters the climate outcomes. Geophys. Res. Lett. 47:e2020GL088337. doi: 10.1029/2020GL088337
Weisenstein, D. K., Visioni, D., Franke, H., Niemeier, U., Vattioni, S., Chiodo, G., et al. (2022). An interactive stratospheric aerosol model intercomparison of solar geoengineering by stratospheric injection of SO 2 or accumulation-mode sulfuric acid aerosols. Atmos. Chem. Phys. 22, 2955–2973. doi: 10.5194/acp-22-2955-2022
Keywords: stratospheric aerosol injection, geoengineering, climate, eastern Africa, extremes
Citation: Misiani HO, Endris HS, Opijah FJ, Ouma JO, Barasa BN, Tye MR and MacMartin DG (2025) Simulated response of the climate of eastern Africa to stratospheric aerosol intervention. Front. Clim. 7:1522235. doi: 10.3389/fclim.2025.1522235
Edited by:
Timofei Sukhodolov, Physikalisch-Meteorologisches Observatorium Davos, SwitzerlandReviewed by:
Romaric C. Odoulami, University of Cape Town, South AfricaHaruki Hirasawa, University of Washington, United States
Copyright © 2025 Misiani, Endris, Opijah, Ouma, Barasa, Tye and MacMartin. This is an open-access article distributed under the terms of the Creative Commons Attribution License (CC BY). The use, distribution or reproduction in other forums is permitted, provided the original author(s) and the copyright owner(s) are credited and that the original publication in this journal is cited, in accordance with accepted academic practice. No use, distribution or reproduction is permitted which does not comply with these terms.
*Correspondence: Herbert O. Misiani, bWlzaWFuaWhhYmF0QGdtYWlsLmNvbQ==