 Tesfaye Akafu
 Diriba Korecha2
- 1College of Agriculture and Veterinary Medicine, Jimma University, Jimma, Oromia, Ethiopia
- 2Climate Hazard Center, University of California Santa Barbara, Santa Barbara, CA, United States
Coffee farming supports the livelihoods of over 15 million people in Ethiopia. However, approximately 90% of Ethiopian coffee producers are smallholders, making them among the most vulnerable to global change because of their limited resources and high dependence on family labor. This study examined the vulnerability of coffee-based farmers to climate change and variability across five districts in the West Wolega Zone of Western Ethiopia. The study combined primary and secondary data. A cross-sectional research design was used to collect primary data from 642 household heads, using 35 vulnerability indicators. Secondary data was obtained from the Ethiopian Meteorological Institute (EMI). The Livelihood Vulnerability Index (LVI) and Livelihood Vulnerability Index-Intergovernmental Panel on Climate Change (LVI-IPCC) framework were used for data analysis. The LVI indicated that coffee producers in Gimbi district (0.387) were more vulnerable to climate change and variability, followed by those in Homa (0.379), Ganji (0.377), Nolekaba (0.370), and Haru district (0.365). The LVI-IPCC analysis showed that coffee farming communities in the Haru districts (0.097) were the most vulnerable to climate change, followed by the Nolekaba (0.089), Homa (0.082), Ganji (0.081), and Gimbi districts (0.077). Spatial disparity in vulnerability is explained by the heterogeneity of socioeconomic and biophysical factors. Food, water, and climate variability contributed to the high vulnerability of farming households in all districts. Overall, farmers in all districts face the highest exposure and sensitivity, combined with a limited adaptive capacity. The findings of this study are crucial for stakeholders and policymakers as they provide essential insights for designing and implementing strategies to reduce vulnerability and improve the adaptability of coffee farming households.
1 Introduction
Climate change is becoming a major threat to human and natural systems, with severe, long-term, cross-sectoral, and in some cases irreversible adverse impacts worldwide (IPCC, 2022). In response to the increasing impacts of climate change, the concept of adaptation has gained significant attention and emphasis in the academic literature and policy discussions (UNFCCC, 2010). However, vulnerability assessment has become a prerequisite for identifying at-risk areas and populations, and will guide the development of appropriate adaptation strategies. Therefore, vulnerability assessments and subsequent adaptation policies have become top priorities in climate schools of thought (IPCC, 2014).
Climate change disproportionately affects regions (Arnell et al., 2019), sectors (Rawat et al., 2024) and societies (Thomas et al., 2018). Africa, despite low greenhouse gas (GHG) emissions accounting for changes the world’s climate (Khan et al., 2014), faces extensive losses and damage from human-attributable climate change impacts (IPCC, 2022). This is particularly true because key sectors that drive their economic activities and livelihoods, such as agriculture, water resources, biodiversity, coastal areas, forestry, and energy, are highly vulnerable to climate change impacts (Abidoye and Odusola, 2015). By 2030, it is projected that over 118 million people in Africa will be vulnerable to climatic disasters such as drought, floods, storms, and heatwaves (WMO, 2020). Sub-Saharan African (SSA) populations are three times more vulnerable to the adverse consequences of climate change than global populations (Amegah et al., 2016). The IPCC (2022) predicts worsening climate impacts, expecting 921 million people in SSA to face water stress by 2050. These changes are also anticipated to reduce income per capita growth in SSA countries by 1.8% (Maino and Emrullahu, 2022). Ethiopia is vastly vulnerable to climate-related disasters in sub-Saharan (Conway and Schipper, 2011) and faces ongoing challenges.
Vulnerability is a theoretical concept that represents the non-observable and non-measurable state of a system which has emerged from several schools of thought (Hinkel, 2011). In climate change science, vulnerability encompasses both biophysical and social factors. Biophysical vulnerability is related to the physical impact of natural hazards, which is influenced by geography. Social vulnerability arises from societal structures shaped by various processes (Cannon et al., 2015). There are multiple definitions of vulnerability in the literature (Birkman, 2013; Birkmann and Fernando, 2007; Cannon et al., 2015; Cutter, 1996; O’Brien et al., 2004). These definitions typically link vulnerability to exposure, sensitivity, and adaptive capacity to climate-related risk (IPCC, 2014). Exposure refers to the susceptibility of the human environment nexus to climatic hazards (e.g., extreme temperature, drought, floods; Birkman, 2013); sensitivity measures the likelihood of a system experiencing specific climate hazards or conditions (Binita et al., 2015); and adaptive capacity represents the system’s ability to respond to climate stress, mitigate potential harm, take advantage of opportunities, and cope with the effects (Birkman, 2013).
In Ethiopia, 85% of the population resides in rural areas and relies mainly on agriculture for livelihood and economic activity (Gebreegziabher et al., 2016). Ethiopia aims to achieve a lower-middle-income status by 2025 with the goal of eliminating hunger and poverty (UNDP, 2022). As agriculture is the pillar of the country, it is crucial to achieve these governmental targets. However, the World Food Program (WFP, 2020) reported that moderate drought reduced agricultural income growth by 15% and increased the prevalence of poverty by 13.5%, damaging farmers livelihoods. The heavy dependence on rain-fed farming makes farmers vulnerable to variability in rainfall, including the timing, amount, intensity, and associated droughts and floods (Berihun et al., 2023; Mamo et al., 2019). Vulnerability is worsened by the countrys’ topographic diversity, geographical location, and non-climatic stressors, such as war, conflict, a rapidly growing population, and the limited use of agricultural inputs (Fazzini et al., 2015; OCHA, 2022). Projected warming trends across the country are expected to exacerbate the likelihood of water scarcity (World Bank, 2020), making agriculture, water, and human health the most vulnerable (Serdeczny et al., 2016). This could harm the livelihoods of the poor, especially the rural Ethiopian farmers. Therefore, evaluating the vulnerability of farmers is crucial for reducing anticipated climate-related risks through informed adaptation policies. This provides valuable information for decision making regarding resource allocation and priority settings (Birkman, 2013).
Several empirical frameworks have been developed to assess the vulnerability to climate change. These frameworks incorporate a variety of methodologies and indicators that allow researchers to analyze vulnerability from diverse perspectives (Ahsan and Warner, 2014; Cutter et al., 2003; Edmonds et al., 2020; Gerlitz et al., 2017; Varadan and Kumar, 2015). However, Hahn et al. (2009) made a significant contribution to the field by introducing a two-step approach designed to comprehensively assess vulnerability to climate change. This approach includes both the Livelihood Vulnerability Index (LVI) and the Livelihood Vulnerability Index-Intergovernmental Panel on Climate Change (LVI-IPCC) framework. This methodology has since been accepted and widely applied in many regions of the world (Alam, 2017; Nabanita et al., 2019; Poudel et al., 2020; Zhang et al., 2018), helping researchers and practitioners to effectively understand the vulnerabilities of communities to climate change. The advantage of the LVI and LVI-IPCC methods over others is that they combine primary and secondary data sources. They also allow for a flexible choice of indicators, take a multidimensional approach, focus on specific areas, and organize indicators by district (Hahn et al., 2009).
Previous research in Ethiopia has examined climate vulnerability. For example, Deressa et al. (2008) and Gebrehiwot and Van Der Veen (2013) showed that climate vulnerability is closely linked to poverty. However, their large-scale study has overlooked local vulnerability assessments. Other studies have highlighted uneven vulnerability based on agroecology. For example, Amare and Simane (2017), Maru et al. (2021), and Zeleke et al. (2023) reported that households residing in lowland agroecology are more vulnerable than those settled in highland and midland agroecology, while Tesso et al. (2012) show that farmers living in highland areas are much more vulnerable than those living in lowland areas. Abeje et al. (2019) indicated that midland areas are more at risk from climate change than lowland and highland areas, while Simane et al. (2016) found that lowland and highland zones face more vulnerability than midland systems. Inconsistent results from previous studies confirm that the degree of climate vulnerability cannot be comprehensive in agroecological system-specific climate vulnerability assessments. Furthermore, some studies in Ethiopia (Bedeke et al., 2020; Dechassa et al., 2017) have focused on smallholder farmers who rely on cereal crops and neglect cash crops. In a broader context, vulnerability studies have not yet addressed coffee producers or areas where coffee is cultivated.
In Ethiopia, coffee farming supports the livelihoods of over 15 million farmers, with smallholder farmers accounting for 90% of coffee producers (Moat et al., 2017). However, coffee plants are highly susceptible to fluctuations in weather patterns (DaMatta et al., 2019). Several studies have been conducted on the impact of climate change on coffee production in Ethiopian coffee-growing areas (Chemura et al., 2021; Davis et al., 2012; Moat et al., 2017). Some empirical studies have focused on exploring the adaptation measures taken by coffee farmers in response to climate change (Bro et al., 2019; Diro et al., 2022; Eshetu et al., 2020). Due to their reliance on coffee as their primary source of income, these farmers appear to be vulnerable to climate-related changes in coffee-growing conditions. However, the vulnerability of coffee farmers to climate-related risks is largely unrecognized in Ethiopia, particularly in the western region. Against this backdrop, the present study examined the vulnerability of coffee farmers in five districts of the West Wolega Zone, Western Ethiopia.
2 Methods and materials
2.1 Study area description
The study was conducted in five selected districts: Ganji, Gimbi, Haru, Homa, and Nolekaba, located in the West Wolega Zone, Western Ethiopia (Figure 1). Rain-fed agriculture is a major contributor to the local economy, with coffee being an important cash crop in these districts, covering over 1,026.02 square kilometers of land. Despite this, farmers and stakeholders in the coffee sector have noticed a gradual decline in overall coffee yield. Peak yields, previously a yearly occurrence, have now become sporadic, manifesting only once every second or third year. This shift can largely be attributed to the impacts of climate change, such as the delayed onset of rains, particularly from early February to March, and increased temperatures during the growing season (Moat et al., 2017). The alternative livelihood source of the study area is a mixed crop-livestock production system. Major cereal crops grown in the study area include maize, teff, and sorghum. The primary livestock raised are cattle, sheep, poultry, beehives, goats, and donkeys. Detailed information about the study districts, including altitudes, rainfall, temperature, agroecology, land use patterns, and population statistics, was obtained from each district administration office and various authors (Balemi et al., 2022; CSA, 2013; Tola and Shetty, 2023), as summarized in Table 1.
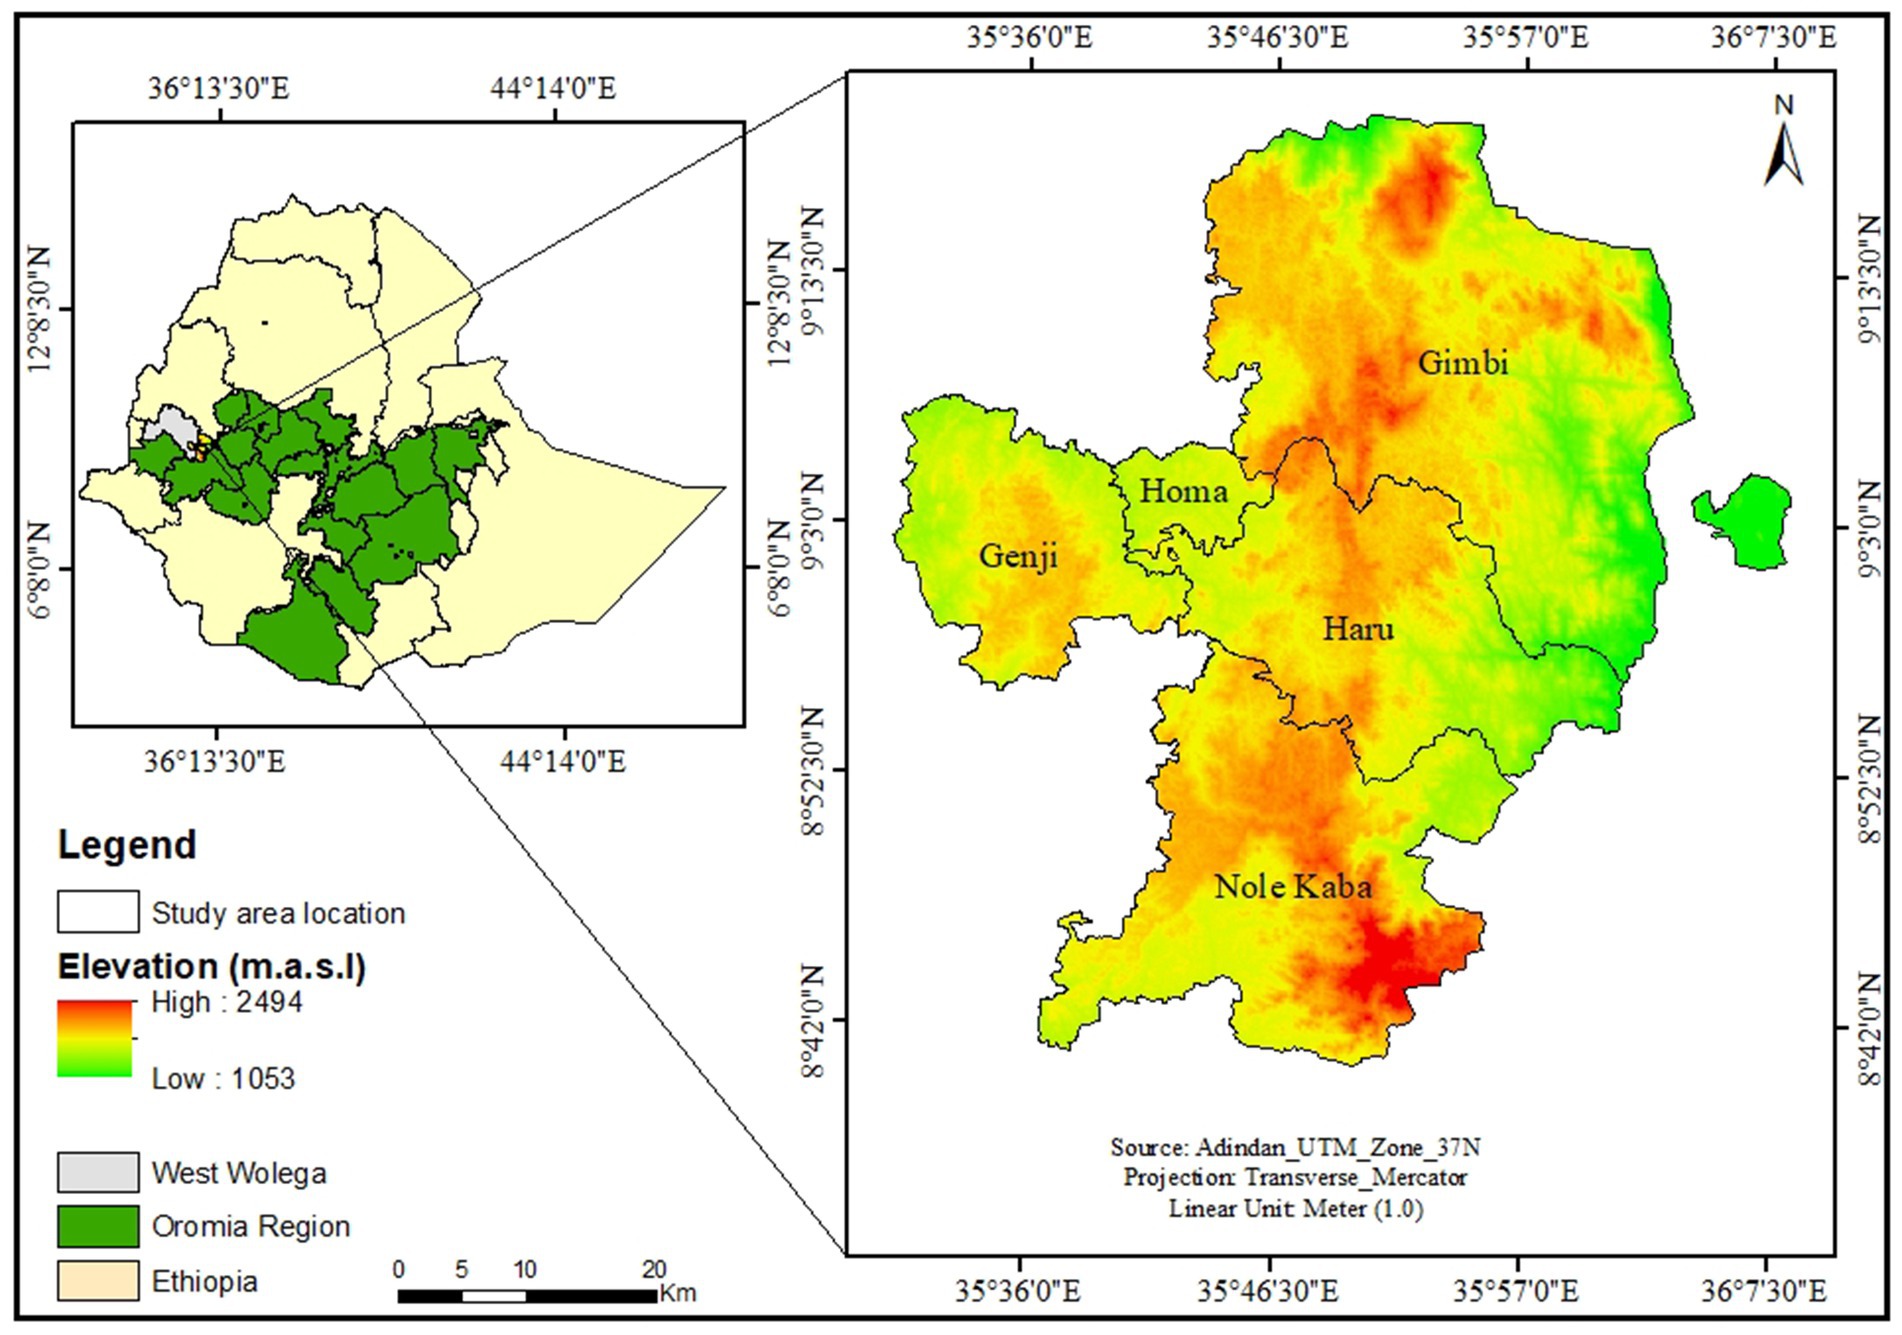
Figure 1. Study area map.
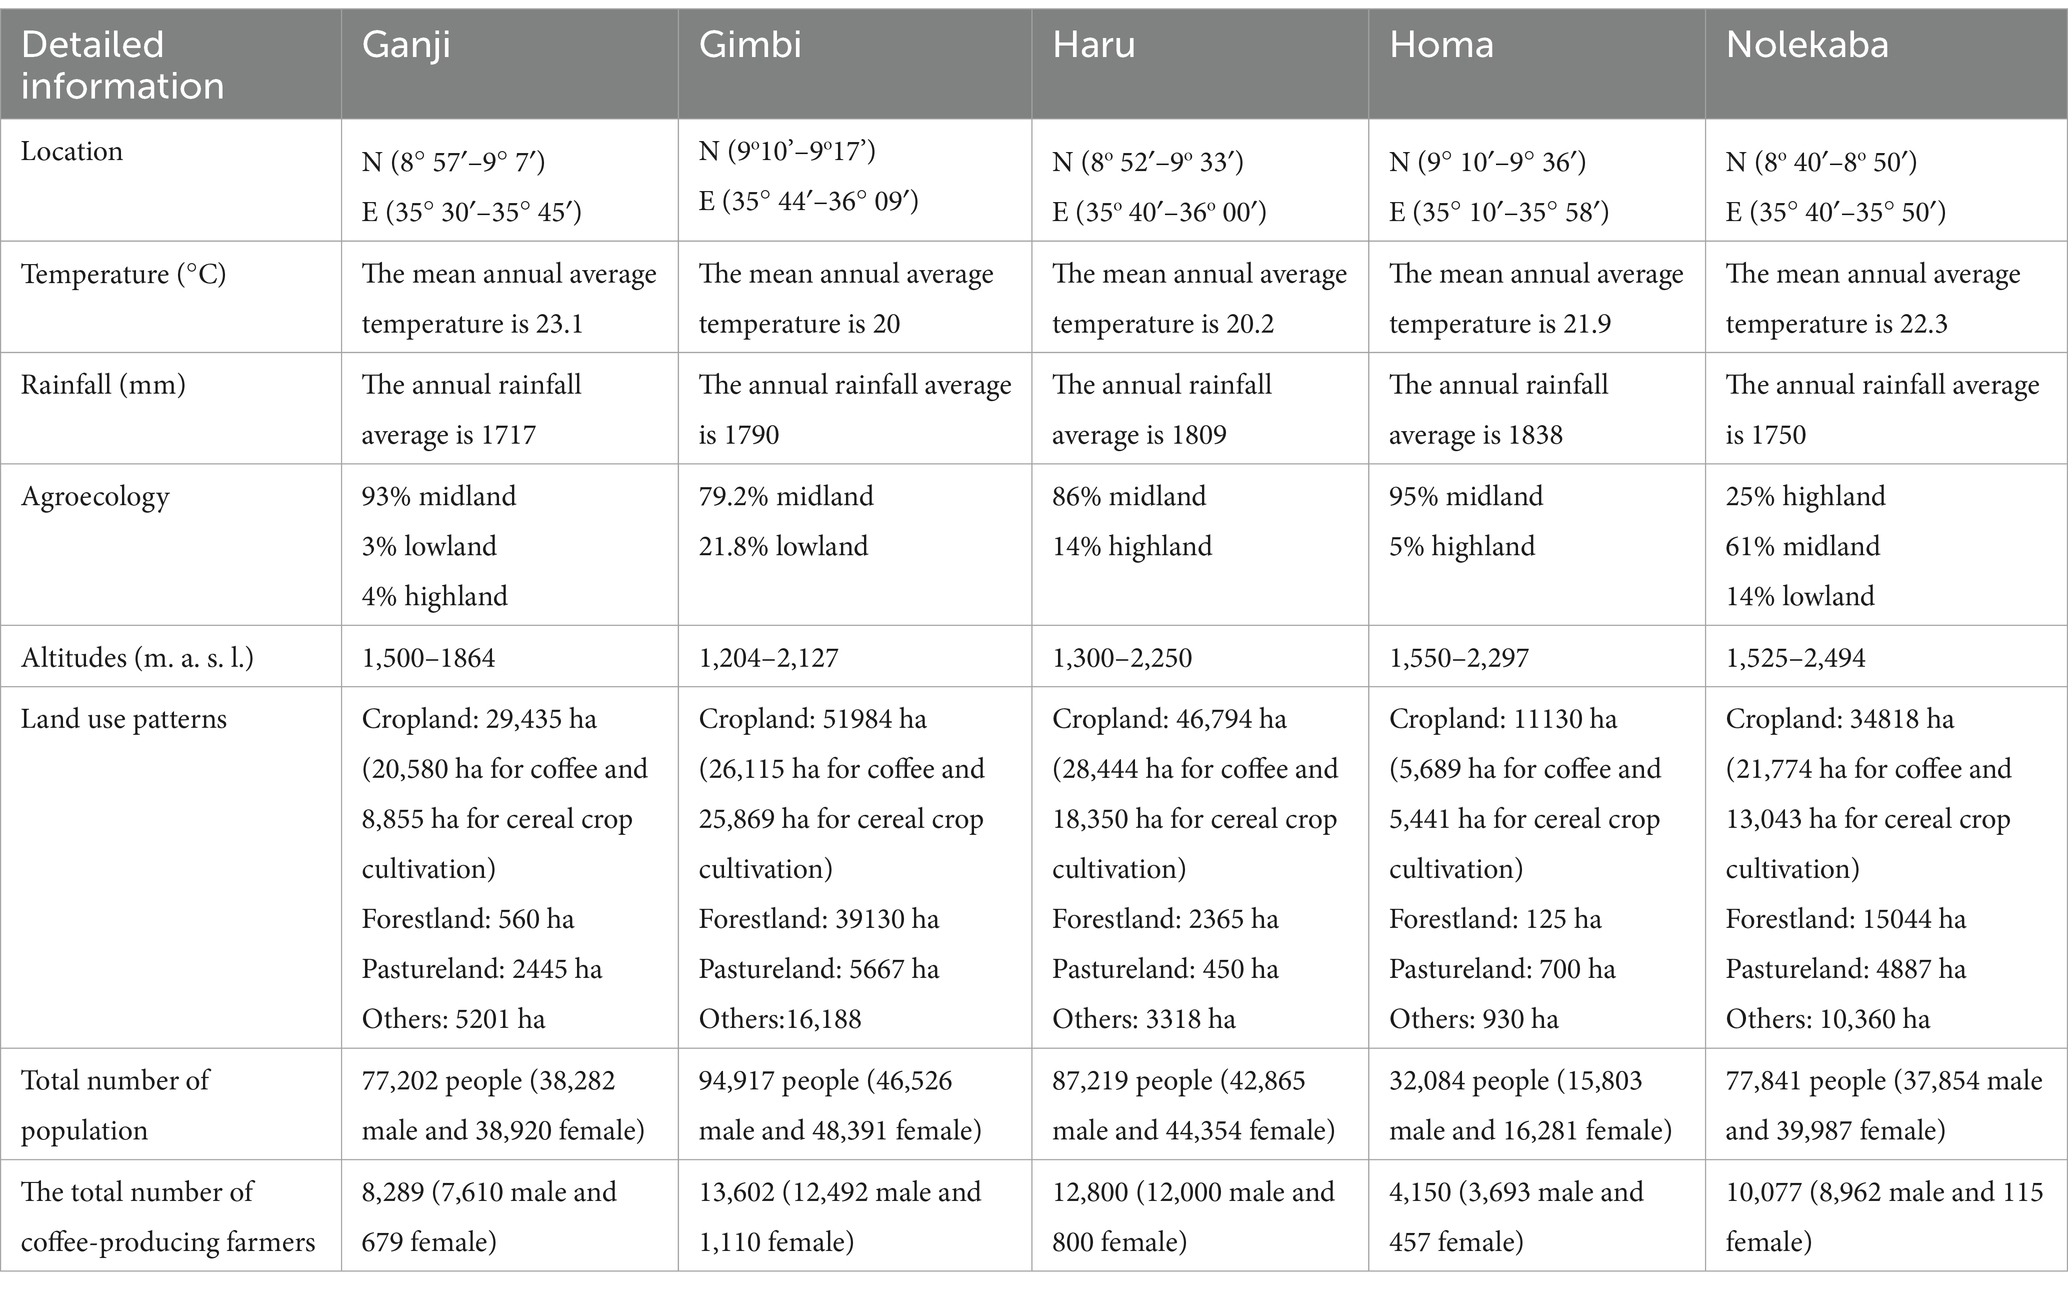
Table 1. Summary of study area descriptions.
2.2 Sampling method and sample size determination
A multistage sampling technique was employed to select participants for the study. The West Wolega zone was purposively selected in the first stage due to its potential for coffee production. In the second step, Ganji, Gimbi, Haru, Homa, and Nolekaba were purposively selected for their high coffee production levels and limited infrastructure. In the third stage, villages involved in coffee production were then stratified based on their production potential. Lastly, three villages fully engaged in coffee production were randomly selected from each district. The sample size of 642 households (Ganji = 129; Gimbi = 135; Haru = 128; Homa = 125; Nolekaba = 125) was calculated using the Kothari (2004) formula for population, as shown in Equation 1.
Where ‘n’ represents the desired sample size, ‘N’ denotes the size of the household heads unit, ‘Z’ stands for the standard variant (1.96 at a 95% confidence level), ‘e’ signifies the precision error (0.08), ‘p’ indicates the population standard deviation (0.5), and ‘q’ reflects the estimated proportion of attributes not present (1-p).
2.3 Data sources and data collection methods
The study used both primary and secondary data. Primary data was collected through a survey of 642 households encompassing eight major components represented by several indicators linked to exposure, sensitivity, and adaptive capacity. The initial questionnaire was developed based on a literature review and pre-tested by interviewing 10 randomly selected coffee farmers in each study area. All ambiguities and limitations identified in the initial questionnaire were resolved in the final version (Table 2) before data collection. Both open and closed-ended questions were used to collect household-level data through face-to-face interviews from September 1 to October 30, 2023. Additionally, monthly precipitation and temperature datasets from 2012 to 2022 were obtained from the Ethiopian Meteorology Institute (EMI).
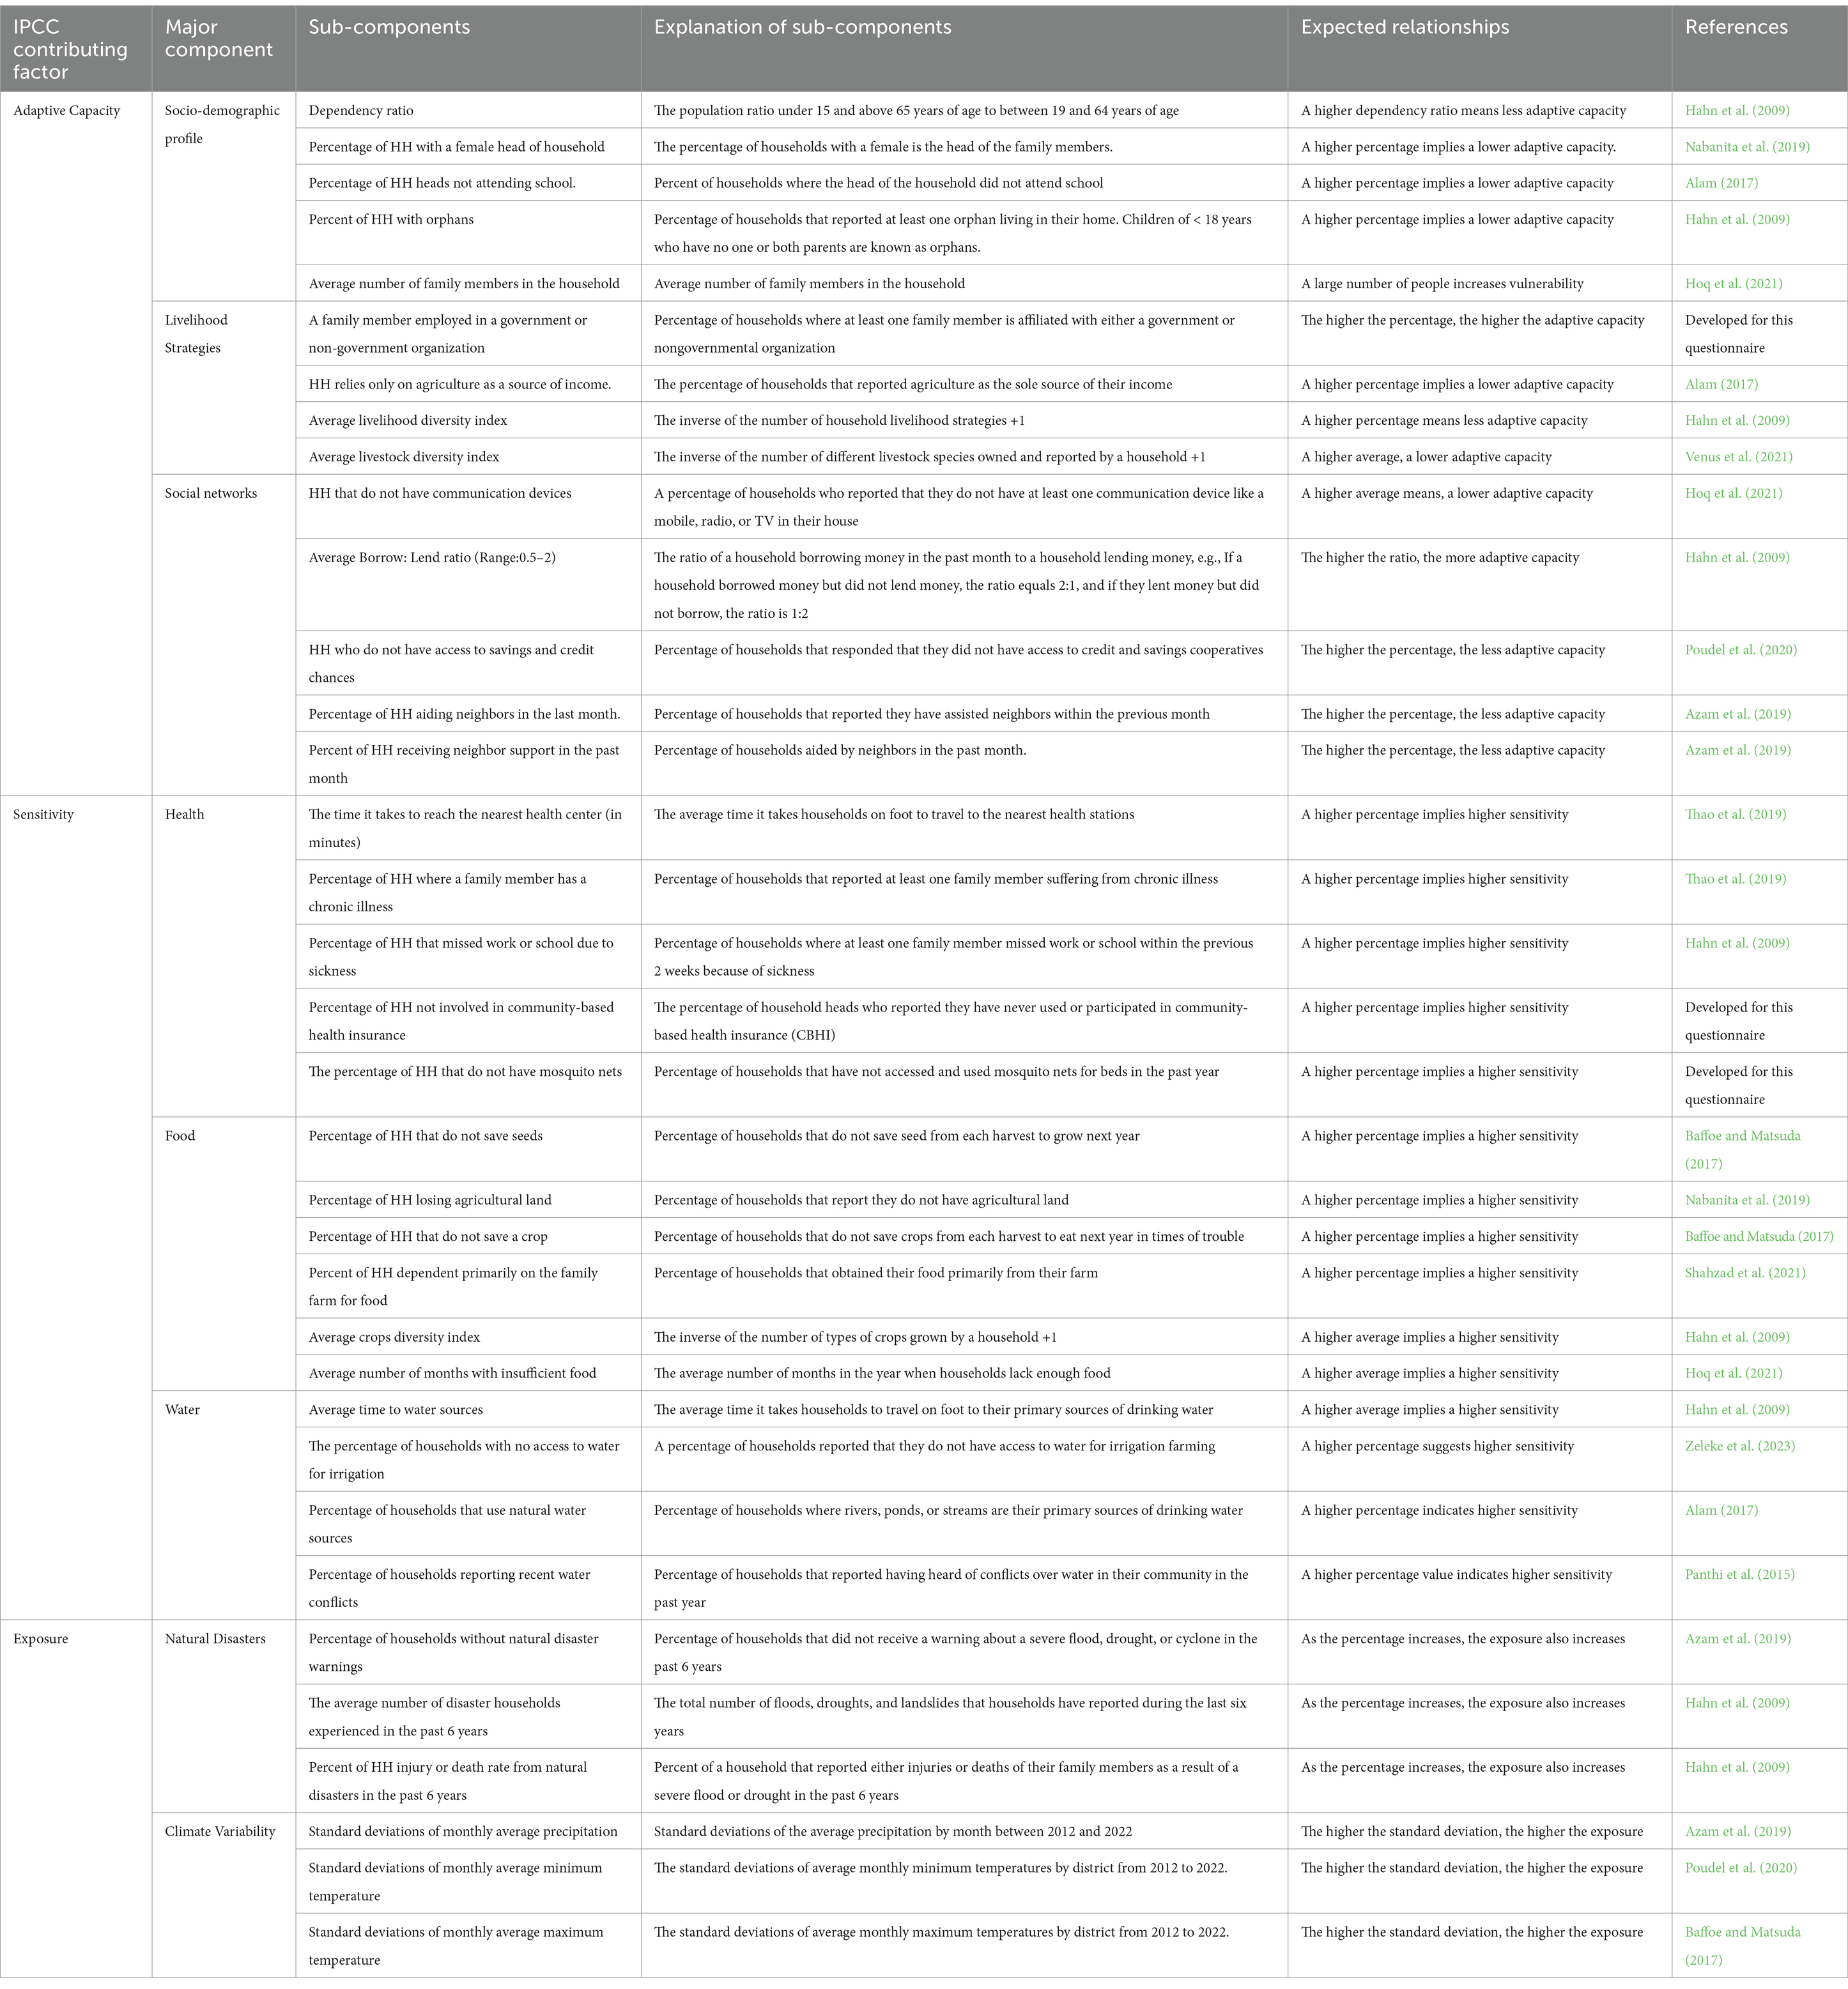
Table 2. IPCC contributing factor, major components, sub-components, and their hypothesized effect on vulnerability.
2.4 Data analysis
2.4.1 Calculating LVI: composite index approach
The Livelihood vulnerability Index (LVI) for this study consisted of eight major components aligned with 35 indicators. Each indicator was measured using different units, so we first standardized them into common units using a formula from Hahn et al. (2009) as shown in Equation 2:
Where Sd represents the observed values, and Smin and Smax are the minimum and maximum values from survey data, respectively.
After standardization, each major component was calculated by averaging the number of sub-components using Equation 3:
Where Md represents a major component; Sdi represents its indicators, and n is the number of indicators in each major component. Then, the district-level LVI was obtained by averaging all major components in each district using Equation 4.
This can be also expressed as Equation 5
Where LVId is the Livelihood Vulnerability Index for district d. The weight of Wmi was determined based on the quantity of indicators in major components. The LVI was scaled to range from 0 (least vulnerable) to 0.5 (most vulnerable).
2.4.2 Calculating the LVI-IPCC: IPCC-framework approach
The LVI-IPCC framework is the second vulnerability assessment to integrate eight components into exposure, sensitivity, and adaptive capacity (Hahn et al., 2009). Exposure combines natural disasters and climatic variability; sensitivity involves health, food, and water security; and adaptive capacity entails socio-demographic profiles, social networks, and livelihood strategies. All three elements were calculated using Equation 6.
Where CFd represents IPCC-defined factors, Mdi denotes the district’s major component indexed by i, Wmi signifies the weight of each major component, and n is the total major components in a contributing factor. After calculating the three contributing factors, the LVI-IPCC can be determined by using Equation 7.
Where LVI-IPCCd is the LVI for district d expressed using the IPCC vulnerability framework, e is the exposure value for district d, a is the adaptive capacity value for district d, and s is the sensitivity value for district d. According to Hahn et al. (2009), the LVI-IPCC was scaled from −1 (least vulnerable) to +1 (most vulnerable).
3 Results
3.1 Socio-demographic and economic characteristics of households
The study involved selecting a total of 642 household heads across the five districts. Among them, 91% were male, while the remaining 8% were female. The socio-demographic characteristics of the study participants, such as age, educational level, farming practices, marital status, family size, farming experience, and economic characteristics, are summarized in Table 3.
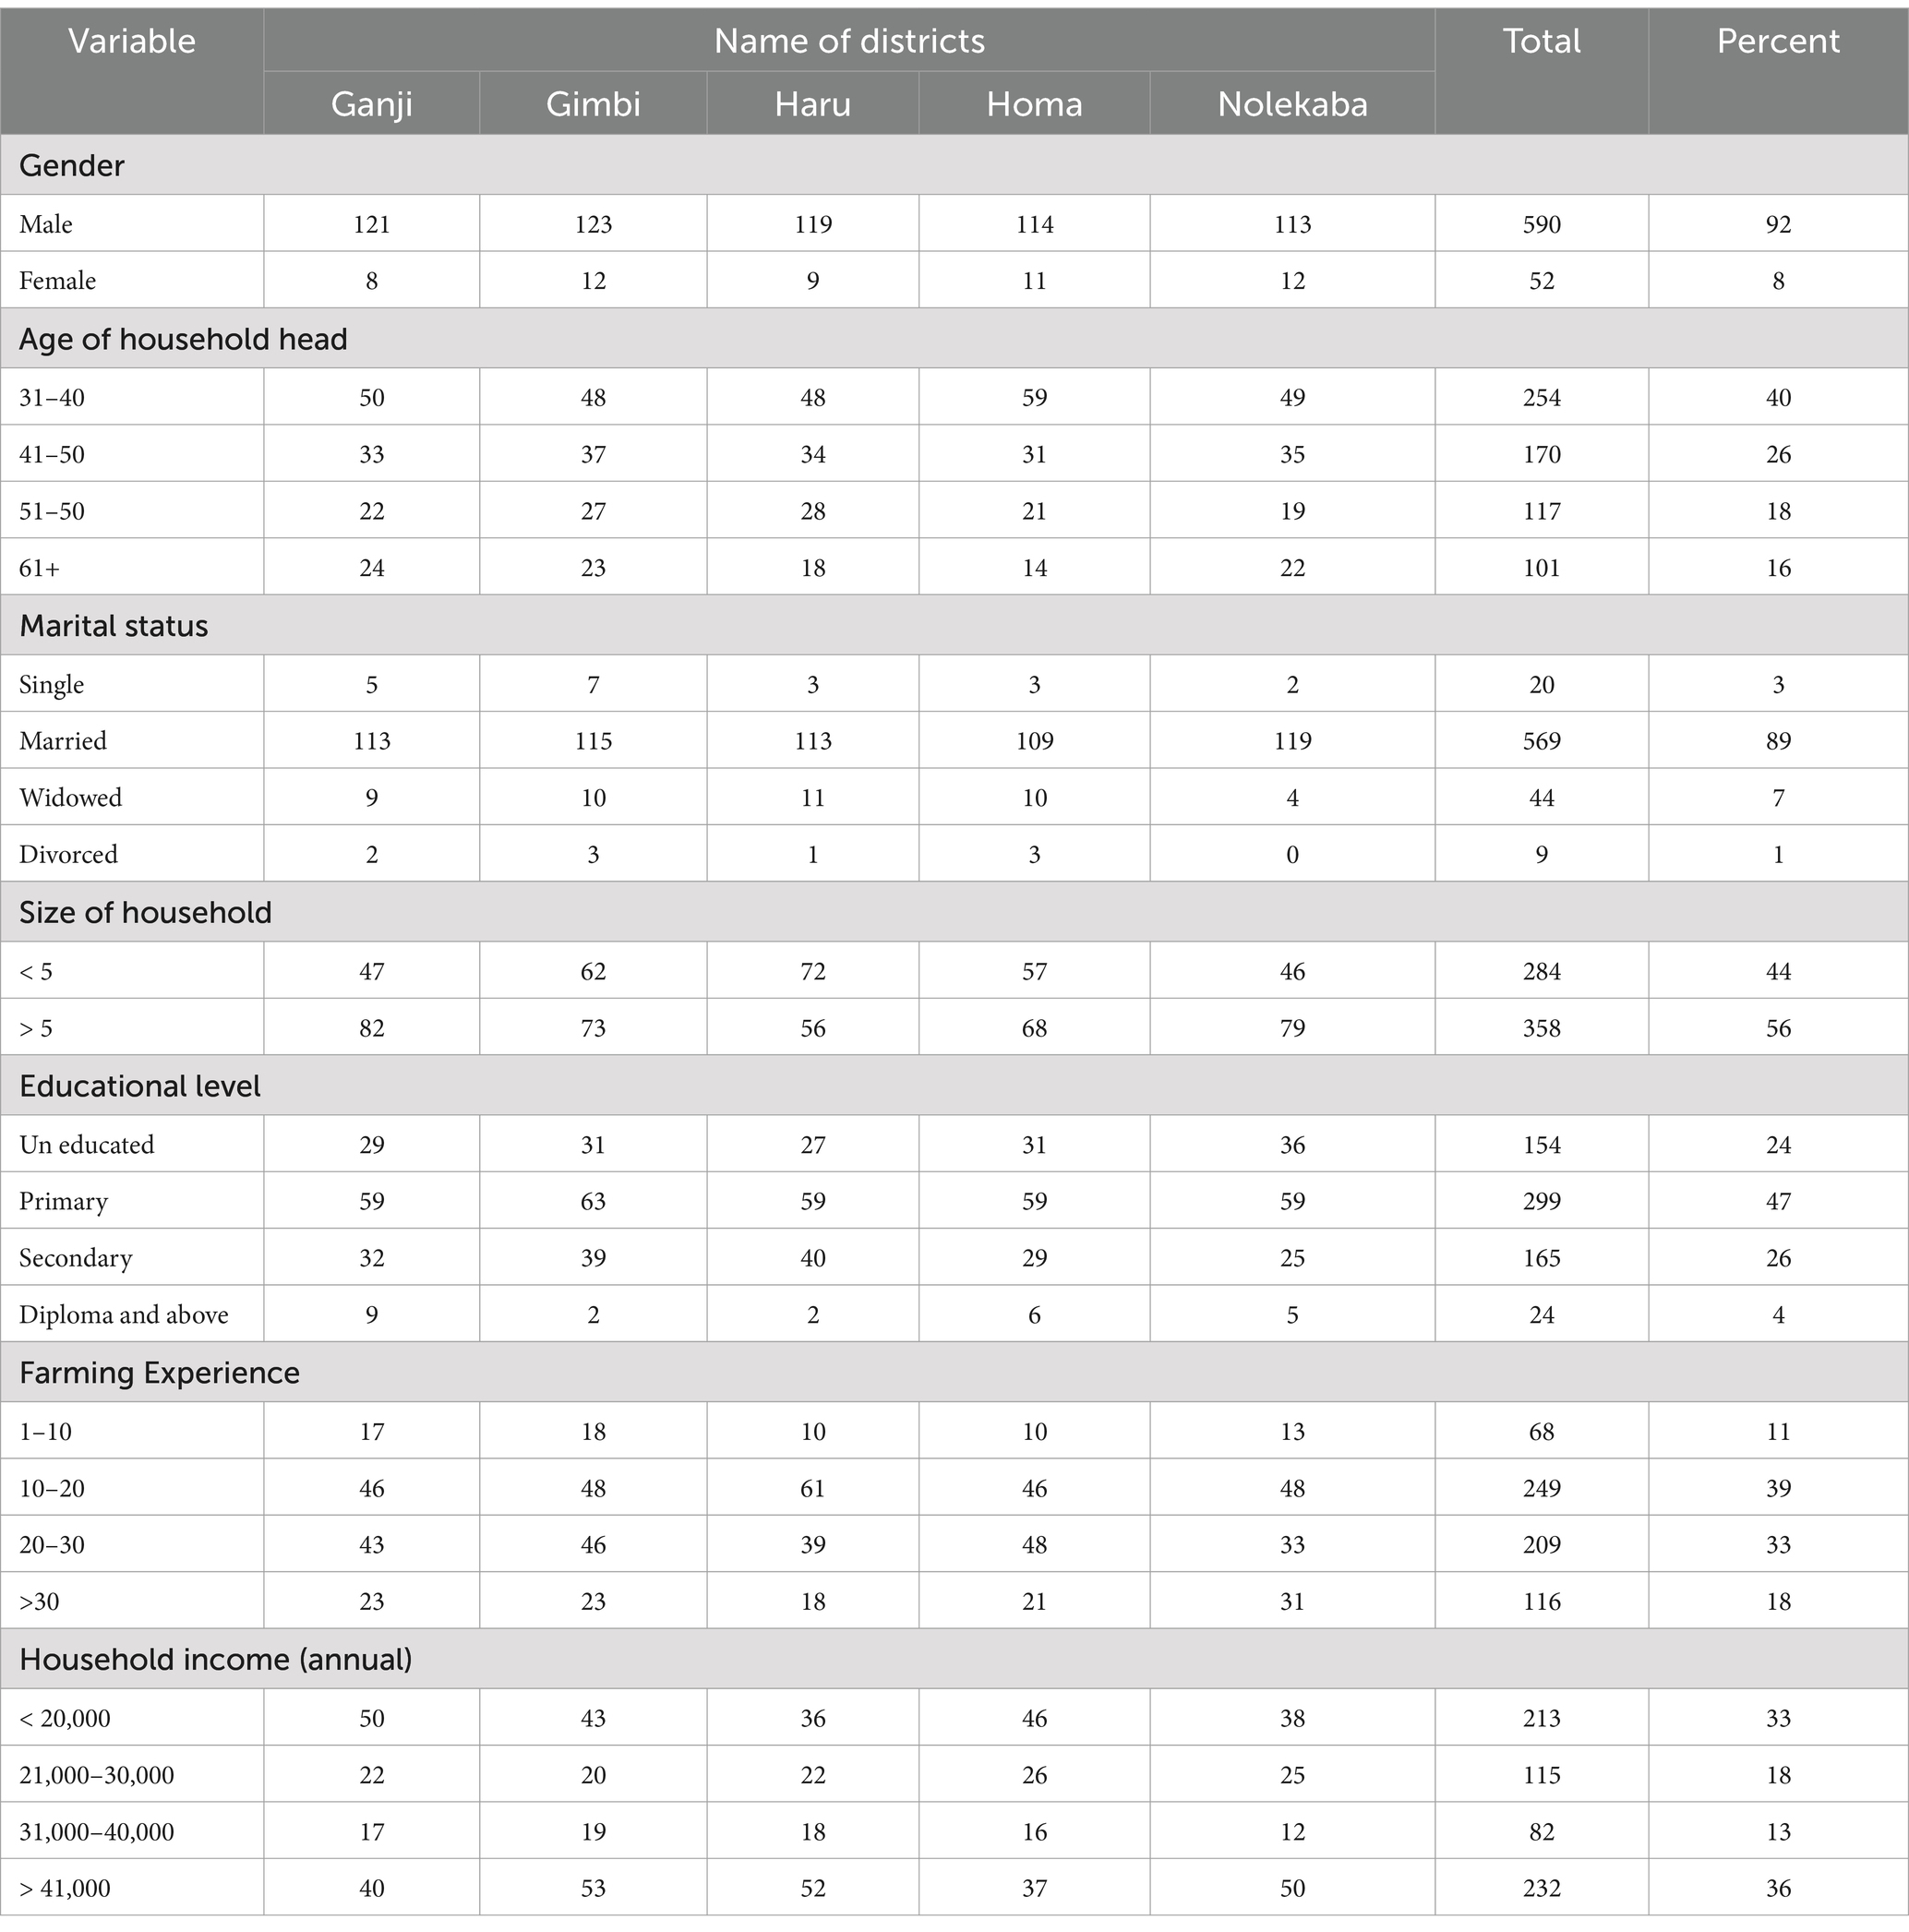
Table 3. Socio-demographic and economic characteristics of the study participants.
3.2 Livelihood vulnerability index
Vulnerability scores varied among major components (0.202 to 0.602), as shown in Figure 2. Based on the socio-demographic profile, Ganji was more vulnerable (0.241), while Nolekaba was the least (0.199). The livelihood strategies vulnerability index obtained from the averaged subcomponents ranged from 0.283 in Gimbi to 0.207 in Haru. Nolekaba had a higher social network vulnerability score (0.356), with the lowest score in the Haru district (0.316). The vulnerability of health, food, and water was higher in Gimbi, Haru, and Ganji at 0.301, 0.580, and 0.576, respectively. Vulnerability to recent natural disasters was consistent across districts, relatively highest in Ganji and Gimbi (0.335) and lowest in Homa (0.331). In climate variability, Nolekaba had the highest index (0.600) and Gimbi the lowest (0.552). Overall, coffee farming communities across the five districts were vulnerable to climate change, with varying levels of vulnerability (Table 4). Notably, Gimbi district had the highest vulnerability (0.387), followed by Homa (0.379), Ganji (0.377), and Nolekaba (0.370), while Haru district displayed the lowest vulnerability index (0.365).
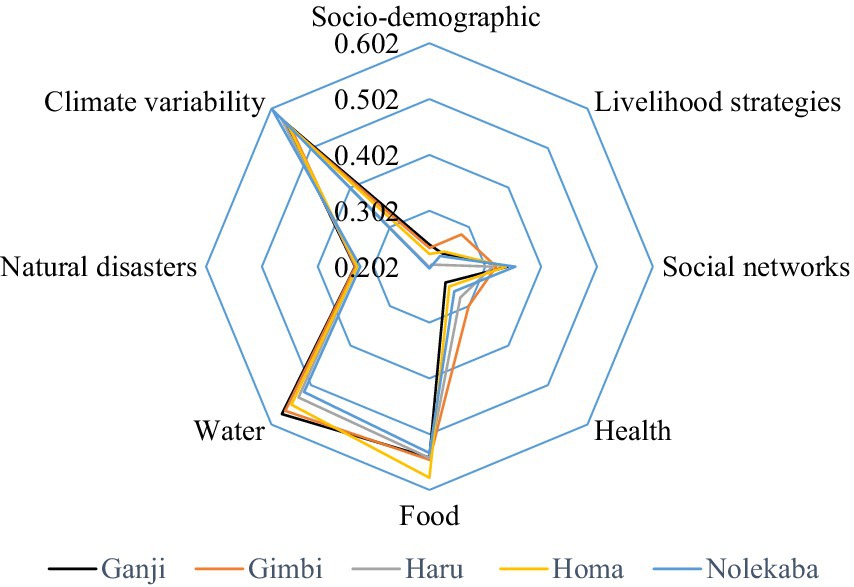
Figure 2. A spider diagram showing the major components of livelihood vulnerability for each district.
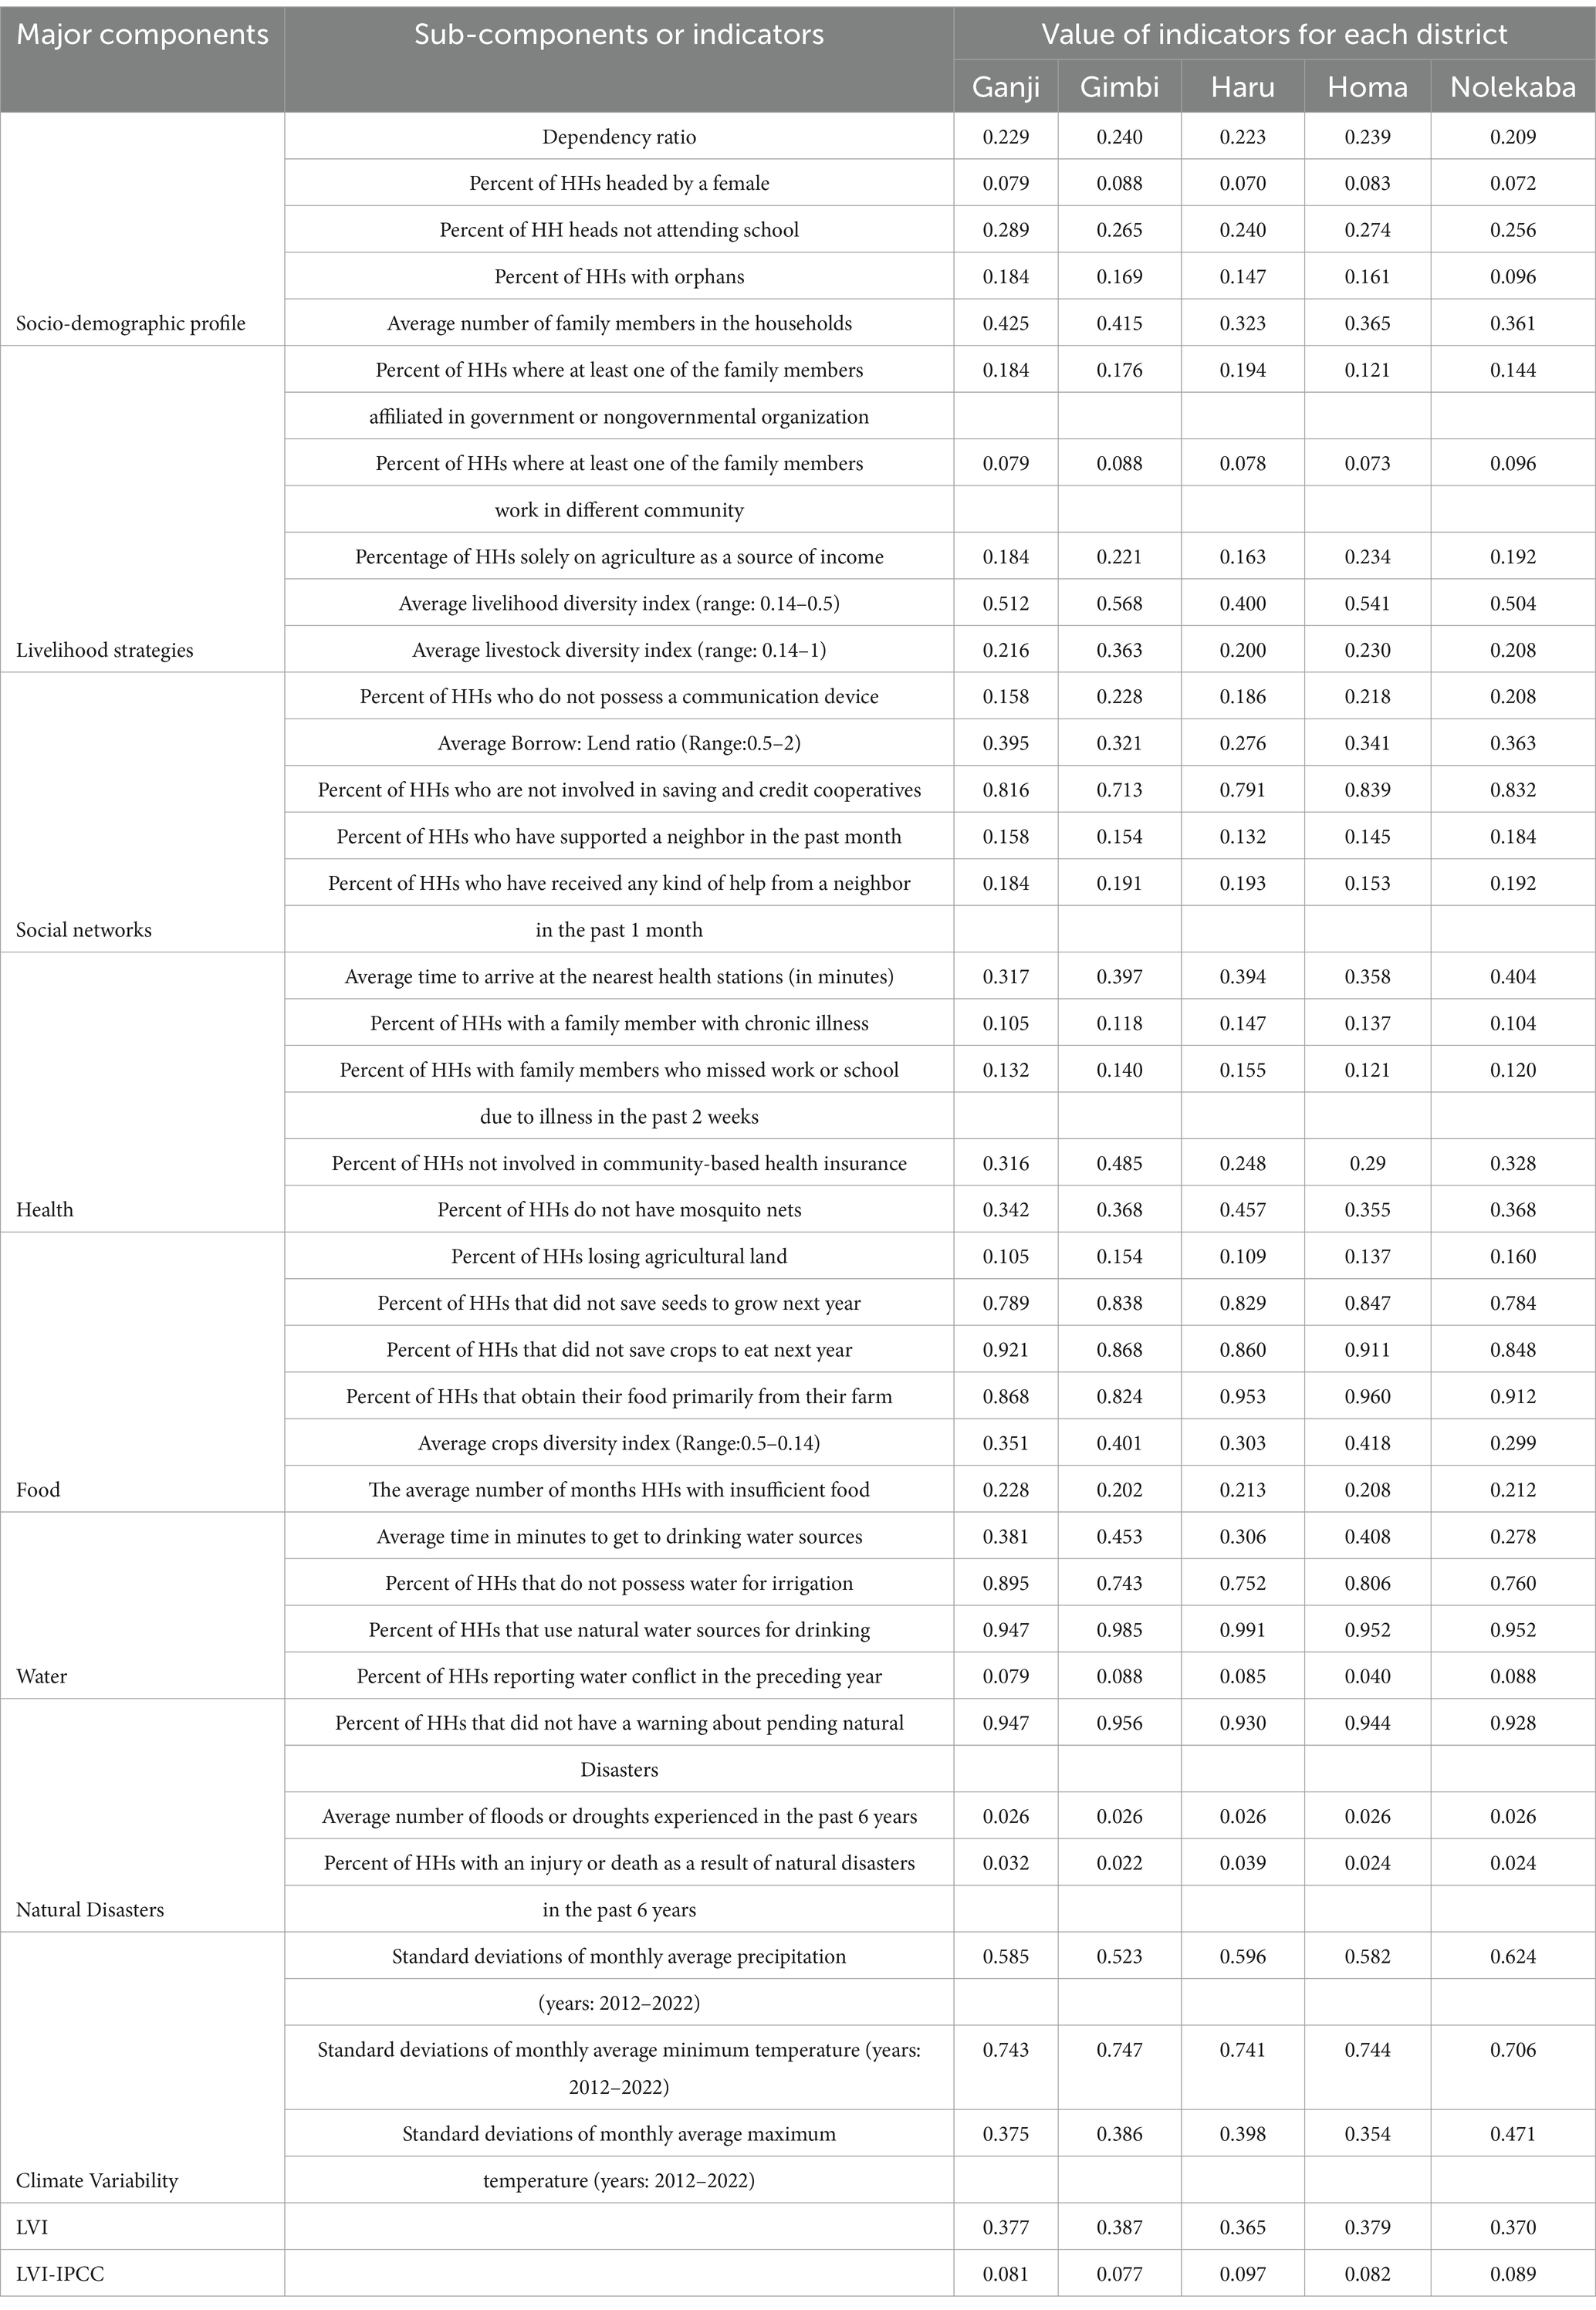
Table 4. Index value of sub-components, composite livelihood vulnerability index (LVI), and LVI-IPCC for each district.
3.3 LVI-IPCC analysis
Figure 3 displays the vulnerability results of IPCC factors per district. The vulnerability index scores for exposures, sensitivity, and adaptive capacity range from 0.2 to 0.5. The results show that Nolekaba households were more exposed to climate change (0.463) when climate variability was combined with natural disasters. However, based on the health status, food, and water security of the district, Gimbi (0.471) was found to be more sensitive to climate change. In terms of socio-demographic characteristics, livelihood strategies, and social networks, Haru (0.241) shows the lowest capacity to adapt to the impacts of climate change. The overall LVI-IPCC results in Table 4 indicate that coffee-farming communities in Haru are the most vulnerable to climate change (0.097), followed by Nolekaba (0.089), Homa (0.082), and Ganji (0.081). Gimbi shows the least vulnerability at 0.077.
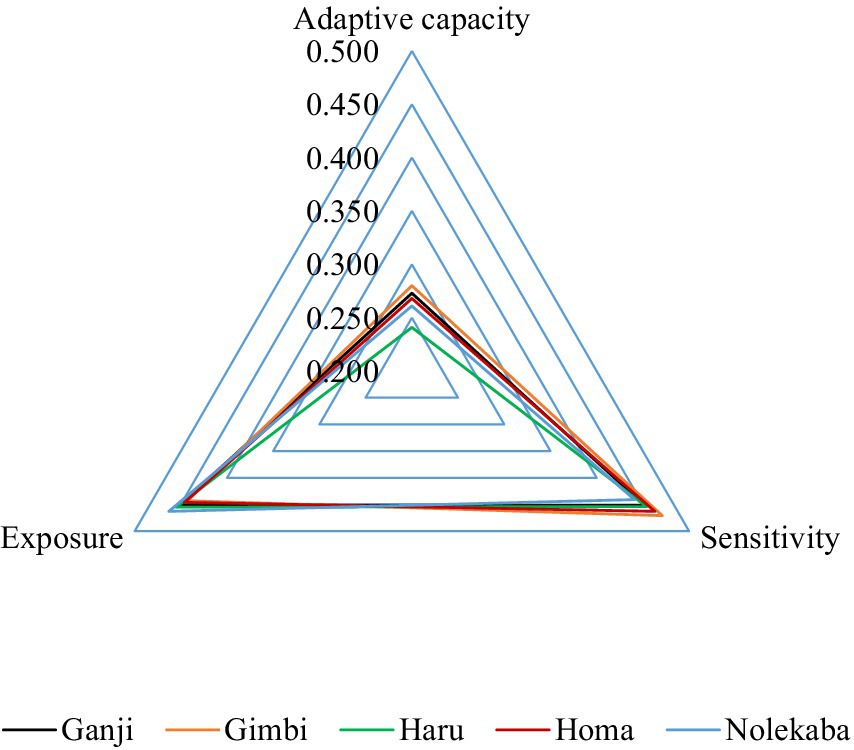
Figure 3. Vulnerability radar triangle of the IPCC contributing factors for each district.
4 Discussion
4.1 LVI
4.1.1 Sociodemographic profile
The socio-demographic profile of households plays a crucial role in shaping their vulnerability to climate change and influencing their capacity to adapt and respond to environmental challenges. The socio-demographic profile contributes the least to LVI in all districts except Ganji. This could be due to the higher average number of family members and percentage of household heads not attending school in the district. According to Zhang et al. (2018), households with a larger agricultural workforce invest more in agriculture and animal-raising. Consequently, their livelihoods are more vulnerable to the negative impacts of climate change as they are more likely to experience risks and losses under the same climatic conditions. Education has a proactive effect, as households with a high percentage of educated members are less likely to be vulnerable to climate change. A study by Striessnig et al. (2013) on disaster mortality assessment from 1980 to 2010 in 130 countries found that women with secondary education and above experienced significantly fewer deaths from climate-related extreme events. Education also enhances people’s receptiveness to agricultural innovations and new technologies, enabling them to adapt better to climate variability (Muttarak and Pothisiri, 2013). The dependency ratio, presence of orphans within households, and gender of household heads could all play varying roles in determining the vulnerability of households to climate change. Households with a high dependency ratio may struggle to allocate resources effectively because more individuals rely on a smaller working population for support. The gender of the household head can influence the decision-making processes, resource management, and access to support systems. Female-headed households may face unique challenges such as limited access to credit, land, and agricultural training, which can exacerbate their vulnerability to climate impacts (Dev and Iv, 2023). Due to their disadvantaged and often marginalized status, orphans are more vulnerable to the negative impacts of extreme weather events such as floods, droughts, and storms (Mkandawire, 2018).
4.1.2 Livelihood strategies
Livelihood strategies in the study area typically involve diversifying income sources through on-farm, off-farm, and non-farm activities. In this area, a higher percentage of farming households have diversified their on-farm activities by combining crop and livestock production, while some households engage in off-farm activities such as casual labor and local business, and others pursue non-farm income through wage employment and migrating household members to work in distant towns and abroad. However, low-income diversification through off-farm and non-farm activities was a significant factor contributing to households’ vulnerability in all study sites. This is evident from the index score of wage employment, number of family members working outside the community, and average livelihood diversity index. This finding corroborates the findings of Panthi et al. (2015). Haru and Nolekaba districts showed a lower vulnerability index, attributed to their increased engagement in livestock raising and non-farm activities. In contrast, Gimbi exhibited high vulnerability, primarily due to its heavy dependence on agriculture as a source of income Mohammed et al. (2021) in rural Ghana found that farming households using both on-farm and non-farm diversification strategies were significantly more resilient to climate change than those relying only on on-farm diversification strategies. Similarly, Anang et al. (2020) argued that diversifying both on-farm and non-farm activities can help reduce climate-related risks for farm households. Heltberg et al. (2009) highlight the importance of access to assets, employment, livestock restocking, microfinance, migration, remittances, and training in enhancing household resilience. This indicates that a multidimensional approach is required to build and strengthen resilience in farm households through livelihood diversification from off-farm and nonfarm activities.
4.1.3 Social networks
Strong social networks can facilitate the sharing of resources, information, and support during times of crisis, enabling households to cope better with the effects of climate change (Dapilah et al., 2019). In rural areas, people may use interpersonal communication, radio, and mobile phones to share weather information. The availability of formal financial and social facilities can also affect farmers’ ability to adapt to the negative effects of climate change (Abid et al., 2017). Limited access to financial institutions and a low borrowing-to-lending ratio greatly increased livelihood vulnerability across all districts. This result is consistent with those of Alam (2017) and Williams et al. (2018). According to Hahn et al. (2009), households that often borrow or receive assistance but lend or provide little support to others are considered more vulnerable than those with extra resources to help. According to Castells-quintana et al. (2018), access to formal credit and saving opportunities, provides financial independence, and emergency funds, and helps improve one’s credit score to cope with greater risk. However, Heltberg et al. (2009) found that many low-income individuals lack access to banks and formal financial institutions and instead rely on cash and informal borrowing methods, which are less secure and flexible. In Africa, only 20% of households have access to formal financial institutions (World Bank, 2012). Microfinance can help bridge this gap by reducing vulnerability through livelihood support and providing risk management instruments (Hammill et al., 2008). Overall, social networks contributed significantly to LVI and did not differ significantly across all districts. This uniformity may be attributed to the homogeneity of social interaction dynamics observed in all districts. A comparable observation was made by Pandey and Jha (2012).
4.1.4 Health
Smallholder farmers may be more sensitive to the effects of climate change if they experience health issues. Inadequate healthcare worsens farmers’ health and climate vulnerability (Talukder et al., 2021). The longest travel time to the nearest healthcare center and lack of mosquito nets were the main contributors to overall health vulnerability across the five districts. Close access to health care is essential when household members fall ill, as longer distances often limit access to medical professionals (Nabanita et al., 2019). This situation could lead family members to miss work and school, especially if they are is chronically ill (Kosanic et al., 2022). In comparison, Gimbi and Haru showed high vulnerability. Differences were observed in the high percentage of households not participating in community-based health insurance (CHI) in Gimbi and households not using mosquito nets in Haru. Access to CHI helps improve financial health security for farming households. It has been functioning in Ethiopia since 2011, with the aim of universal health coverage (Akafu et al., 2023). Lack of access to mosquito nets becomes worse during periods of high malaria prevalence (Adugna et al., 2022). Overall, the ongoing conflict between armed groups and the government hinders access to humanitarian aid and essential health care services in the area. According to a study by Marktanner et al. (2015), nine of the 10 most climate-vulnerable countries are in sub-Saharan Africa, all of which have a recent history of armed conflict. This correlation indicates that war and conflict exacerbate communities’ vulnerability to the negative effects of climate change. Thus, as these areas grapple with the dual challenges of climate change and conflict, the need for comprehensive strategies to address both issues has become increasingly urgent.
4.1.5 Food
Food security enhances farmers’ strategies coping with changes in climate patterns and other external stressors. However, the quantity and quality of the food produced depends on several factors (Myers et al., 2017). Nearly all food subcomponents play a substantial role in food insecurity. The high dependence of farming communities on coffee cultivation as their main source of income could intensify this issue. As climate change continues to threaten coffee production, the resulting economic strain can exacerbate food insecurity (Moat et al., 2017). This can also lead to a lack of diverse and nutritious food options as well as seasonal food insecurity (Leisner, 2020). Many farmers rely on the seeds provided by the government. This dependency can hinder their ability to cultivate food crops independently, making them reliant on external sources of both seeds and food. If these external systems fail or become unreliable, then food security can be severely compromised. Overall, the food component in all districts significantly increased farmers’ vulnerability, with Gimbi and Homa being more vulnerable than the rest three districts. This is because the crop diversification opportunities (aside from coffee farming) in the latter three districts were higher than those in the former two districts. In addition, high soil erosion severity, landscape issues, and lack of access to water for irrigation could also play a role at the Gimbi study site. In alignment with our findings, Alam (2017) and Hoq et al. (2021) showed that food components are key factors in the vulnerability of farming communities to climate change. Hence, it is crucial to prioritize the improvement of food security within farm households. Crop diversification and access to irrigation could play a significant role in ensuring adequate food supply and resilience of farm households in the face of climate change challenges (IPCC, 2022).
4.1.6 Water
Water preserves lives, promotes health, and helps communities to become more resilient to climate change. A safe and available source of clean water is essential for maintaining good public health (WHO, 2022). Similar to the food component, water contributes the highest vulnerability to the overall vulnerability index and is comparable across all districts. Most households in all the research locations relied on natural water sources. This dependency leads to significant vulnerability to the adverse impacts of climate change and variability in water scarcity, particularly during the dry period (Baffoe and Matsuda, 2017). Water problems are also attributed to the high dependence on rain-fed farming. Furthermore, water scarcity can lead to conflicts within and between communities over water use, thereby increasing the risks associated with climate change, particularly for irrigation purposes (Unfried et al., 2022). Limited access to drinking water services within a 30-min radius can affect the health of households and communities, increasing the risk of waterborne diseases (WHO, 2022). Water issues in the study area could worsen due to a projected significant decline in streamflow, particularly during the dry season (Serdeczny et al., 2016). To address the anticipated effects of climate change on water availability, the study area must seek alternative water sources such as ponds and wells, while also adopting new management strategies, such as rainwater harvesting, drip irrigation, and cultivating drought-resistant coffee and crops.
4.1.7 Natural disasters
Most disasters have hydrometeorological origins due to extreme temperatures, rainfall, and winds (IPCC, 2021). Access to climate-related information can assist farmers in identifying effective approaches for mitigating the long-term effects of these disasters. Additionally, community preparedness plans and local early warning systems can help farmers reduce the impact of natural disasters (Andersson et al., 2020). However, none of the study areas have a local disaster warning system for farmers. Thus, people had to rely on the national climate warning system. The absence of reliable local forecasting systems creates a risky situation for smallholder farmers, leaving them vulnerable to the unpredictable nature of climate-related disasters (Andersson et al., 2020). Therefore, an effective early warning system is essential for mitigating future hazards, particularly in vulnerable populations. Interestingly, the average number of floods and droughts experienced by farmers in the past 6 years was very low and comparable in across five study sites. Consequently, the percentage of injuries and deaths reported from recent natural hazards was very low at all study sites. This phenomenon is due to the weak correlation between ENSO and the wet season (JJAS), which is responsible for the occurrence of natural disasters in the western part of Ethiopia, where our study area is located (Degefu et al., 2017).
4.1.8 Climate variability
Variations in precipitation and temperature patterns have been linked with climate change (IPCC, 2021). This research indicates that climate variability, particularly mean minimum temperature, is the key factor driving vulnerability at all study locations. Climate variability has profound implications for the sustainability and productivity of coffee cultivation (Davis et al., 2012; Moat et al., 2017), ultimately affecting the economic stability and food security of farming communities. In addition, other crops produced by farmers are vulnerable. According to Ray et al. (2015), climate variability is responsible for about one-third of worldwide crop yield fluctuations. The implications of climate variability extend beyond agriculture. Orimoloye et al. (2019) highlighted that it creates favorable conditions for the proliferation of malaria-carrying mosquitoes and other disease vectors. Moreover, climate fluctuations can cause more frequent extreme weather events, leading to human displacement, death, and injuries (IPCC, 2021).
4.2 LVI-IPCC
4.2.1 Adaptive capacity
Adaptive capacity considers social networks, livelihood strategies, and sociodemographic factors. It was determined that social networks represent the least contributing factor that constrains the adaptive capacity of households across all research locations. In contrast, the sociodemographic characteristics of farming households contributed the most to enhance the adaptive capacity, except for Ganji. Overall, coffee producers in Haru district were identified as more vulnerable to the impacts of climate change, primarily because of their limited capacity to adapt. According to Fussel and Klein (2006), adaptive capacity relies on non-climatic factors, such as resources, infrastructure, technology, sociopolitical aspects, and education. Households in the study area vary in demographic features, assets, education levels, and livelihoods, which influence adaptive capacities. Social networks and institutions help farming societies by providing financial support, capacity building, weather forecasting, insurance, innovation, and investment (Dapilah et al., 2019). Economic diversification in rural areas generates additional income, enabling smallholder farmers to employ agricultural technology and diversify their livelihood strategies (Anang et al., 2020). Therefore, it is crucial to encourage livelihood diversification strategies to improve the adaptive capacities of farming communities. This can be achieved through off-farm employment opportunities and promoting sustainable agricultural practices (Mohammed et al., 2021).
4.2.2 Sensitivity
Sensitivity was the primary factor influencing livelihood vulnerability at all study sites except for Nolekaba. Notably, the Gimbi district showed a higher sensitivity than the other areas. Varied access to water, healthcare, and food among farming communities in the study area resulted in different sensitivities. However, diversifying income sources have become less common in all cases. This financial constraint can lead to food insecurity. Diversifying crops can mitigate risks from pests, market fluctuations, and climate challenges, while enhancing food security (Myers et al., 2017). Diversified income sources can significantly enhance food security by providing a more stable and reliable financial foundation (Anang et al., 2020). The health status of households in the study area is also at risk owing to inadequate health service coverage. Conflicts between armed groups is hinder access to essential healthcare services in this area. Limited access to essential health coverage makes households more vulnerable to climate-related health effects (Bedeke et al., 2020). Access to continuous water supply for irrigation and domestic purposes is also a major issue. Alternative water sources, such as small-scale irrigation and rainwater storage, may reduce crop vulnerability during the dry season and household sensitivity (Gerlitz et al., 2017). Overall, food and water were the main factors contributing to the increased sensitivity of farming households across all districts in the study sites. This finding aligns with several previous studies, including Shahzad et al. (2021) in Pakistan, Thao et al. (2019) in Vietnam, and Poudel et al. (2020) in India. Therefore, improving water and food security while maintaining good health status could reduce the sensitivity of farming households to climate-related disasters.
4.2.3 Exposure
Exposure is largely determined by the nature of climatic characteristics and the community. Climatic conditions include risk levels for precipitation, temperature, and wind. The nature of the community concerns its settlement location relative to hydrological disasters, such as floods and droughts (Ford and Smit, 2004). When examining the climatic conditions, substantial variation was observed across the study sites. The variability in climate is likely due to the diverse topographical features and land-use practices in the research area. The detected increased climate variability could have a significant impact on coffee crop production, which could exacerbate the exposure of farmers (DaMatta et al., 2019). In terms of settlement locations, all five districts were located within the midland and lowland belt agroecological conditions, resulting in a low number of natural disasters recorded over the past 6 years. When combining climatic characteristics with natural disasters, Nolekaba showed a higher exposure than the other districts, mainly because of its increased climate variability. The increased climate variability observed in Nolekaba can be attributed to its unique and diverse agroecological settings, with elevation being a particularly influential factor. A study by Ignacio et al. (2015) on the impact of the 2011 tropical storms in the Philippines found that physical characteristics, such as elevation and slope, play a more significant role in determining exposure to flooding than sociodemographic factors. This suggests that vulnerability to climate disasters is primarily influenced by people’s exposure to environmental conditions, rather than sociodemographic factors.
5 Limitations
While this study provides valuable insights into the vulnerability of coffee-based farmers to climate change and variability, it is important to recognize certain limitations. The primary limitation of the indicator-based approach lies in the inherent subjectivity involved in selecting indicators as well as the significant influence of the local environment on the formulation and design of these indicators. Second, the process of assigning appropriate weights to each vulnerability indicator presents another challenge, because the relative importance of these indicators can vary widely based on local conditions and specific circumstances. Third, as primary farmers reported for all household members, some livelihood activities may have been unknown to them during the survey, possibly leading to inaccurate estimations of households’ overall activities.
6 Conclusion
This study assessed the vulnerability of coffee farming communities to climate change and variability in the West Wolega Zone, Western Ethiopia, using the LVI and LVI-IPCC frameworks. The vulnerability indices differed across districts, but the high index scores for both analyses indicated a high vulnerability to climatic risks. Some districts showed high vulnerability to climate change; however, their overall level of vulnerability was positively reduced by their adaptive capacity. Food security, water availability, and climate variability were the three main causes of the high livelihood vulnerability to climate change and variability across all study sites. This situation was further exacerbated by the limited adaptive capacity of each district. This suggests that even under similar environmental conditions and agricultural practices, variations in factors such as socioeconomic status, resource access, and adaptive capacity may lead to differing levels of vulnerability to climate impacts among these households. Overall, this study presents four critical areas that need particular focus for all five communities: water availability, early warning systems, access to formal financial institutions, and implementation of diversified livelihood strategies for districts.
The findings of this study have several practical implications that can significantly influence policymaking and community resilience. It allows the development of targeted interventions and support systems, informs the allocation of resources and funding, fosters community engagement and awareness, enhances disaster preparedness and response strategies, and contributes to long-term sustainability goals.
Data availability statement
The raw data supporting the conclusions of this article will be made available by the authors, without undue reservation.
Ethics statement
Ethical review and approval was not required for the study on human participants in accordance with the local legislation and institutional requirements. Written informed consent from the [patients/ participants OR patients/participants legal guardian/next of kin] was not required to participate in this study in accordance with the national legislation and the institutional requirements.
Author contributions
TA: Conceptualization, Data curation, Formal analysis, Investigation, Methodology, Project administration, Resources, Software, Validation, Visualization, Writing – original draft, Writing – review & editing. DK: Writing – review & editing, Methodology, Supervision, Conceptualization, Formal analysis, Validation, Visualization. WG: Writing – review & editing, Methodology, Supervision, Conceptualization, Formal analysis, Validation, Visualization. AA: Writing – review & editing, Methodology, Supervision, Conceptualization, Formal analysis, Validation, Visualization.
Funding
The author(s) declare that no financial support was received for the research and/or publication of this article.
Acknowledgments
We are grateful to Jimma University College of Agriculture and Veterinary Medicine for providing supporting letters to acquire the necessary data and hosting a PhD student for this research.
Conflict of interest
The authors declare that the research was conducted in the absence of any commercial or financial relationships that could be construed as a potential conflict of interest.
Generative AI statement
The author(s) declare that no Gen AI was used in the creation of this manuscript.
Publisher’s note
All claims expressed in this article are solely those of the authors and do not necessarily represent those of their affiliated organizations, or those of the publisher, the editors and the reviewers. Any product that may be evaluated in this article, or claim that may be made by its manufacturer, is not guaranteed or endorsed by the publisher.
References
Abeje, M. T., Tsunekawa, A., Haregeweyn, N., Nigussie, Z., Adgo, E., Ayalew, Z., et al. (2019). Communities’ livelihood vulnerability to climate variability in Ethiopia. Sustain. For. 11, 1–22. doi: 10.3390/su11226302
Abid, M., Ngaruiya, G., Scheffran, J., and Zulfiqar, F. (2017). The role of social networks in agricultural adaptation to climate change: implications for sustainable agriculture in Pakistan. Climate 5, 1–21. doi: 10.3390/cli5040085
Abidoye, B. O., and Odusola, A. F. (2015). Climate change and economic growth in Africa: an econometric analysis. J. Afr. Econ. 24, 277–301. doi: 10.1093/jae/eju033
Adugna, F., Wale, M., and Nibret, E. (2022). Prevalence of malaria and its risk factors in Lake Tana and surrounding areas, northwest. Malar. J. 21, 1–13. doi: 10.1186/s12936-022-04310-7
Ahsan, M. N., and Warner, J. (2014). The socio-economic vulnerability index: a pragmatic approach for assessing climate change risks-a case study in the south-western coastal Bangladesh. Int. J. Disaster Risk Reduct. 8, 32–49. doi: 10.1016/j.ijdrr.2013.12.009
Akafu, W., Daba, T., Tesfaye, E., Teshome, F., and Akafu, T. (2023). Determinants of trust in healthcare facilities among community-based health insurance members in the manna district of Ethiopia. BMC Public Health 23:171. doi: 10.1186/s12889-023-15124-w
Alam, G. M. M. (2017). Livelihood cycle and vulnerability of rural households to climate change and hazards in Bangladesh. Environ. Manag. 59, 777–791. doi: 10.1007/s00267-017-0826-3
Amare, A., and Simane, B. (2017). Climate change induced vulnerability of smallholder farmers: agroecology-based analysis in the Muger sub-basin of the upper blue-Nile Basin of Ethiopia. Am. J. Clim. Chang. 6, 668–693. doi: 10.4236/ajcc.2017.64034
Amegah, A. K., Rezza, G., and Jaakkola, J. J. K. (2016). Temperature-related morbidity and mortality in sub-Saharan Africa: a systematic review of the empirical evidence. Environ. Int. 91, 133–149. doi: 10.1016/j.envint.2016.02.027
Anang, B. T., Nkrumah-ennin, K., and Nyaaba, J. A. (2020). Does off-farm work improve farm income? Empirical evidence from Tolon District in northern Ghana. Advan. Agricul. 2020, 1–8. doi: 10.1155/2020/1406594
Andersson, L., Wilk, J., Graham, L. P., Wikner, J., and Mokwatlo, S. (2020). Local early warning systems for drought – could they add value to nationally disseminated seasonal climate forecasts? Weather Clim. Extrem. 28, 1–12. doi: 10.1016/j.wace.2019.100241
Arnell, N. W., Lowe, J. A., Challinor, A. J., and Osborn, T. J. (2019). Global and regional impacts of climate change at different levels of global temperature increase. Clim. Chang. 155, 377–391. doi: 10.1007/s10584-019-02464-z
Azam, G., Huda, M. E., Amir, M., Bhuiyan, H., and Mohinuzzaman, M. (2019). Climate change and natural hazards vulnerability of char land (Bar land) communities of Bangladesh: application of the livelihood vulnerability index (LVI). Glob. Soc. Welf. doi: 10.1007/s40609-019-00148-1
Baffoe, G., and Matsuda, H. (2017). An empirical assessment of households livelihood vulnerability: the case of rural Ghana. Soc. Indic. Res. 140. doi: 10.1007/s11205-017-1796-9
Balemi, K., Asfaw, Z., and Demissew, S. (2022). Species composition, structure, regeneration and management status of Jorgo-Wato Forest in west Wollega, Ethiopia. J. For. Res. 33, 137–145. doi: 10.1007/s11676-021-01318-8
Bedeke, S. B., Vanhove, W., and Wordofa, M. G. (2020). Vulnerability to climate change among maize - dependent smallholders in three districts of Ethiopia. Environ. Dev. Sustain. 22, 693–718. doi: 10.1007/s10668-018-0215-y
Berihun, M. L., Tsunekawa, A., Haregeweyn, N., Tsubo, M., and Yasuda, H. (2023). Examining the past 120 years’ climate dynamics of Ethiopia. Theor. Appl. Climatol. 154, 534–566. doi: 10.1007/s00704-023-04572-4
Binita, K. C., Shepherd, J. M., and Johnson, C. (2015). Climate change vulnerability assessment in Georgia. Appl. Geogr. 62, 62–74. doi: 10.1016/j.apgeog.2015.04.007
Birkman, J. (2013). Measuring vulnerability to natural hazards: Towards disaster resilient societies. UN: United Nations University.
Birkmann, J., and Fernando, N. (2007). Measuring revealed and emergent vulnerabilities of coastal communities to tsunami in Sri Lanka. Disasters 32, 82–105. doi: 10.1111/j.1467-7717.2007.01028.x
Bro, A. S., Clay, D. C., Ortega, D. L., and Lopez, M. C. (2019). Determinants of adoption of sustainable production practices among smallholder coffee producers in Nicaragua. Environ. Dev. Sustain. 21, 895–915. doi: 10.1007/s10668-017-0066-y
Cannon, T., Twigg, J., and Rowell, J. (2015). Social vulnerability, sustainable livelihoods and disasters report to DFID conflict and humanitarian assistance department sustainable livelihoods support office. Central Avenue, Chatham, UK: University of Greenwhich. 1–63.
Castells-quintana, D., Lopez-uribe, P., and Mcdermott, T. K. J. (2018). Adaptation to climate change: a review through a development economics lens. World Dev. 104, 183–196. doi: 10.1016/j.worlddev.2017.11.016
Chemura, A., Mudereri, B. T., Yalew, A. W., and Gornott, C. (2021). Climate change and specialty coffee potential in Ethiopia. Sci. Rep. 11, 1–13. doi: 10.1038/s41598-021-87647-4
Conway, D., and Schipper, E. L. F. (2011). Adaptation to climate change in Africa: challenges and opportunities identified from Ethiopia. Glob. Environ. Chang. 21, 227–237. doi: 10.1016/j.gloenvcha.2010.07.013
CSA (2013). Population projection of Ethiopia for all regions at wereda level from 2014–2017. Addis Ababa: The Federal Demographic Republic of Ethiopia Central.
Cutter, S. L., Carolina, S., Boruff, B. J., Carolina, S., Shirley, W. L., and Carolina, S. (2003). Social vulnerability to environmental hazards. Soc. Sci Quart. 84, 242–243. doi: 10.1111/1540-6237.8402002
DaMatta, F. M., Rahn, E., Läderach, P., Ghini, R., and Ramalho, J. C. (2019). Why could the coffee crop endure climate change and global warming to a greater extent than previously estimated? Clim. Chang. 152, 167–178. doi: 10.1007/s10584-018-2346-4
Dapilah, F., Nielsen, J. Ø., and Friis, C. (2019). The role of social networks in building adaptive capacity and resilience to climate change: a case study from northern Ghana. Clim. Dev. 1, 1–15. doi: 10.1080/17565529.2019.1596063
Davis, A. P., Gole, T. W., Baena, S., and Moat, J. (2012). The impact of climate change on indigenous Arabica coffee (Coffea arabica): Predicting Future Trends and Identifying Priorities. Plos one 7, 10–14. doi: 10.1371/journal.pone.0047981
Dechassa, C., Simane, B., and Alamirew, B. (2017). Farmers’ livelihoods vulnerability to climate variability and change in Didesa basin southern part of Abay. Climate Change Manage. 267–284. doi: 10.1007/978-3-319-49520-0_17
Degefu, M. A., Rowell, D. P., and Bewket, W. (2017). Teleconnections between ethiopian rainfall variability and global SSTs: observations and methods for model evaluation. Meteorog. Atmos. Phys. 129, 173–186. doi: 10.1007/s00703-016-0466-9
Deressa, T., Hassan, R. M., and Ringler, C. (2008). “Measuring ethiopian farmers’ vulnerability to climate change across regional states”, International food policy research institute discussion paper 00806.
Dev, D. S., and Iv, J. A. M. (2023). Gender and adaptive capacity in climate change scholarship of developing countries: a systematic review of literature. Clim. Dev. 15, 829–840. doi: 10.1080/17565529.2023.2166781
Diro, S., Tesfaye, A., and Erko, B. (2022). Determinants of adoption of climate - smart agricultural technologies and practices in the coffee - based farming system of Ethiopia. Agric. Food Secur. 11:14. doi: 10.1186/s40066-022-00385-2
Edmonds, H. K., Lovell, J. E., and Lovell, C. A. K. K. (2020). A new composite climate change vulnerability index. Ecol. Indic. 117:106529. doi: 10.1016/j.ecolind.2020.106529
Eshetu, G., Johansson, T., Garedew, W., and Yisahak, T. (2020). Determinants of smallholder farmers’ adaptation options to climate change in a coffee-based farming system of Southwest Ethiopia. Clim. Dev. 1, 1–8. doi: 10.1080/17565529.2020.1772706
Fazzini, M., Bisci, C., and Billi, P. (2015). “The climate of Ethiopia,’’ in Landscapes and landforms of Ethiopia. World geomorphological landscapes. ed. P. Billi (Dordrecht: Springer).
Ford, J. D., and Smit, B. (2004). A framework for assessing the vulnerability of communities in the Canadian Arctic to risks associated with climate change. Arctic 57, 389–400. doi: 10.14430/arctic516
Fussel, H.-M., and Klein, R. J. T. T. (2006). Climate change vulnerability assessments: an evolution of conceptual thinking. Clim. Chang. 75, 301–329. doi: 10.1007/s10584-006-0329-3
Gebreegziabher, Z., Stage, J., Mekonnen, A., and Alemu, A. (2016). Climate change and the Ethiopian economy: a CGE analysis. Environ. Dev. Econ. 21, 205–225. doi: 10.1017/S1355770X15000170
Gebrehiwot, T., and Van Der Veen, A. (2013). Assessing the evidence of climate variability in the northern part of Ethiopia. J. Dev. Agric. Econ. 5, 104–119. doi: 10.5897/JDAE12.056
Gerlitz, J. Y., Macchi, M., Brooks, N., Pandey, R., Banerjee, S., and Jha, S. K. (2017). The multidimensional livelihood vulnerability index-an instrument to measure livelihood vulnerability to change in the Hindu Kush Himalayas. Clim. Dev. 9, 124–140. doi: 10.1080/17565529.2016.1145099
Hahn, M. B., Riederer, A. M., and Foster, S. O. (2009). The livelihood vulnerability index: a pragmatic approach to assessing risks from climate variability and change: a case study in Mozambique. Glob. Environ. Chang. 19, 74–88. doi: 10.1016/j.gloenvcha.2008.11.002
Hammill, A., Matthew, R., and McCarter, E. (2008). Microfinance and climate change adaptation. IDS Bull. 39, 113–122. doi: 10.1111/j.1759-5436.2008.tb00484.x
Heltberg, R., Siegel, P. B., and Jorgensen, S. L. (2009). Addressing human vulnerability to climate change: toward a “no-regrets” approach. Glob. Environ. Chang. 19, 89–99. doi: 10.1016/j.gloenvcha.2008.11.003
Hinkel, J. (2011). Indicators of vulnerability and adaptive capacity: towards a clarification of the science-policy interface. Glob. Environ. Chang. 21, 198–208. doi: 10.1016/j.gloenvcha.2010.08.002
Hoq, M. S., Raha, S. K., and Hossain, M. I. (2021). Livelihood vulnerability to flood hazard: understanding from the flood - prone Haor ecosystem of Bangladesh. Environ. Manag. 67, 532–552. doi: 10.1007/s00267-021-01441-6
Ignacio, J. A. F., Cruz, G. T., Nardi, F., and Henry, S. (2015). Assessing the effectiveness of a social vulnerability index in predicting heterogeneity in the impacts of natural hazards: case study of the tropical storm washi flood in the Philippines. Vienna Yearb. Popul. Res. 13, 91–130. doi: 10.1553/populationyearbook2015s091
IPCC (2014). “Climate change 2014: impacts, adaptation, and vulnerability.” Part A: global and sectoral aspects. contribution of working group II to the fifth assessment report of the intergovernmental panel on climate change, 1132PP.
IPCC (2021). Climate change 2021 the physical science basis: Working group i contribution to the sixth assessment report of the intergovernmental panel on climate change. Cambridge, United Kingdom and New York, NY, USA: Cambridge University.
IPCC. (2022). Climate Change 2022_ Impacts, Adaptation and Vulnerability_Working Group II contribution to the Sixth Assessment Report of the Intergovernamental Panel on Climate Change.
Khan, M. A., Zahir Khan, M., Zaman, K., and Naz, L. (2014). Global estimates of energy consumption and greenhouse gas emissions. Renew. Sust. Energ. Rev. 29, 336–344. doi: 10.1016/j.rser.2013.08.091
Kosanic, A., Petzold, J., Martı, B., and Razanajatovo, M. (2022). An inclusive future: disabled populations in the context of climate and environmental change. Curr. Opin. Environ. Sustain. 55, 1–11. doi: 10.1016/j.cosust.2022.101159
Kothari, C. R. (2004). Research methodology: Methods and techniques. 2nd revised edition, New Delhi: In New Age International Publishers.
Leisner, C. P. (2020). Review: climate change impacts on food security- focus on perennial cropping systems and nutritional value. Plant Sci. 293:110412. doi: 10.1016/j.plantsci.2020.110412
Maino, R., and Emrullahu, D. (2022). Climate change in sub-Saharan Africa fragile states: evidence from panel estimations. IMF Work. Pap. 2022, 1–28. doi: 10.5089/9798400204869.001
Mamo, S., Berhanu, B., and Melesse, A. M. (2019). “Historical flood events and hydrological extremes in Ethiopia” in Extreme hydrology and climate variability. 379–384.
Marktanner, M., Mienie, E., and Noiset, L. (2015). From armed conflict to disaster vulnerability. Disaster Prev Manag 24, 1–25. doi: 10.1108/DPM-04-2013-0077
Maru, H., Haileslassie, A., Zeleke, T., and Esayas, B. (2021). Analysis of smallholders’ livelihood vulnerability to drought across agroecology and farm typology in the upper awash sub-basin, Ethiopia. Sustain. For. 13, 1–28. doi: 10.3390/su13179764
Mkandawire, P. (2018). Geoforum vulnerability of HIV / AIDS orphans to fl oods in Malawi. Geoforum 90, 151–158. doi: 10.1016/j.geoforum.2017.10.001
Moat, J., Williams, E., Baena, S., Wilkinson, T., Gole, T. W., Challa, Z. K., et al. (2017). Resilience potential of the Ethiopian coffee sector under climate change. Nat. Plants 3, 1–14. doi: 10.1038/nplants.2017.81
Mohammed, K., Batung, E., and Kansanga, M. (2021). Livelihood diversification strategies and resilience to climate change in semi-arid northern Ghana. Clim. Chang. 164, 1–23. doi: 10.1007/s10584-021-03034-y
Muttarak, R., and Pothisiri, W. (2013). The role of education on disaster preparedness: case study of 2012 Indian Ocean earthquakes on Thailand’s Andaman coast. Ecol. Soc. 18, 1–16. doi: 10.5751/ES-06101-180451
Myers, S. S., Smith, M. R., Guth, S., Golden, C. D., Vaitla, B., Mueller, N. D., et al. (2017). Climate change and global food systems: potential impacts on food security and undernutrition. Annu. Rev. Public Health 38, 259–277. doi: 10.1146/annurev-publhealth-031816-044356
Nabanita, M., Giyasuddin, S., Aritra, B., Arindam, R. O. Y., and Hasan, M. M. (2019). Climate change and livelihood vulnerability of the local population on Sagar Island, India. Chin. Geogr. Sci. 29, 417–436. doi: 10.1007/s11769-019-1042-2
O’Brien, K., Leichenko, R., Kelkar, U., Venema, H., Aandahl, G., Tompkins, H., et al. (2004). Mapping vulnerability to multiple stressors: climate change and globalization in India. Glob. Environ. Chang. 14, 303–313. doi: 10.1016/j.gloenvcha.2004.01.001
Orimoloye, I. R., Mazinyo, S. P., Kalumba, A. M., Ekundayo, O. Y., and Nel, W. (2019). Implications of climate variability and change on urban and human health: a review. Cities 91, 213–223. doi: 10.1016/j.cities.2019.01.009
Pandey, R., and Jha, S. (2012). Climate vulnerability index - measure of climate change vulnerability to communities: a case of rural. Mitig. Adapt. Strateg. Glob. Chang. 17, 487–506. doi: 10.1007/s11027-011-9338-2
Panthi, J., Aryal, S., Dahal, P., and Bhandari, P. (2015). Livelihood vulnerability approach to assessing climate change impacts on mixed agro-livestock smallholders around the Gandaki River basin in Nepal. Reg. Environ. Chang. 16. doi: 10.1007/s10113-015-0833-y
Poudel, S., Funakawa, S., Shinjo, H., and Mishra, B. (2020). Understanding households’ livelihood vulnerability to climate change in the Lamjung district of Nepal. Environ. Dev. Sustain. 22. doi: 10.1007/s10668-019-00566-3
Rawat, A., Kumar, D., and Khati, B. S. (2024). A review on climate change impacts, models, and its consequences on different sectors: a systematic approach. J. Water Clim. Chang. 15, 104–126. doi: 10.2166/wcc.2023.536
Ray, D. K., Gerber, J. S., Macdonald, G. K., and West, P. C. (2015). Climate variation explains a third of global crop yield variability. Nat. Commun. 6:5989. doi: 10.1038/ncomms6989
Serdeczny, O., Adams, S., Coumou, D., Hare, B., Robinson, A., Schaeffer, M., et al. (2016). Climate change impacts in sub-Saharan Africa: from physical changes to their social repercussions. Reg. Environ. Chang. 17:1585–1600. doi: 10.1007/s10113-015-0910-2
Shahzad, L., Tahir, A., Sharif, F., Hayyat, M., and Reserve, J. (2021). Livelihood vulnerability index: a pragmatic assessment of climatic changes in flood affected community of Jhok Reserve Forest, Punjab, Pakistan. Environ. Earth Sci. 80, 1–16. doi: 10.1007/s12665-021-09562-1
Simane, B., Zaitchik, B. F., and Foltz, J. D. (2016). Agroecosystem specific climate vulnerability analysis: application of the livelihood vulnerability index to a tropical highland region. Mitig. Adapt. Strateg. Glob. Chang. 21, 39–65. doi: 10.1007/s11027-014-9568-1
Striessnig, E., Lutz, W., and Patt, A. G. (2013). Effects of educational attainment on climate risk vulnerability. Ecol. Soc. 18, 1–16. doi: 10.5751/ES-05252-180116
Talukder, B., Hipel, K. W., Chiotha, S., and Orbinski, J. (2021). Health impacts of climate change on smallholder farmers. One Health 13, 1–10. doi: 10.1016/j.onehlt.2021.100258
Tesso, G., Emana, B., and Ketema, M. (2012). Analysis of vulnerability and resilience to climate change induced shocks in north Shewa, Ethiopia. Agric. Sci. 3, 871–888. doi: 10.4236/as.2012.36106
Thao, N. T. T., Khoi, D. N., Xuan, T. T., Tychon, B., Thi, N., Thao, T., et al. (2019). Assessment of livelihood vulnerability to drought: a case study in Dak Nong Province, Vietnam. Int. J. Disaster Risk Sci. 10, 604–615. doi: 10.1007/s13753-019-00230-4
Thomas, K., Orlove, B., Warner, B. P., Hardy, R. D., Lazrus, H., Mendez, M., et al. (2018). Explaining differential vulnerability to climate change: a social science review. WIREs Clim. Change 10:e565, 1–18. doi: 10.1002/wcc.565
Tola, S. Y., and Shetty, A. (2023). Extreme hydroclimatic variability and impact of local and global climate system anomalies on extreme flow in the upper Awash River basin. Theor. Appl. Climatol. 153, 1117–1137. doi: 10.1007/s00704-023-04510-4
UNDP (2022) Ethiopia 2030: a country transformed? options for a next generation of reforms: Ethiopia working paper series
Unfried, K., Kis-Katos, K., and Poser, T. (2022). Water scarcity and social conflict. J. Environ. Econ. Manag. 113, 1–48. doi: 10.1016/j.jeem.2022.102633
Varadan, R. J., and Kumar, P. (2015). Mapping agricultural vulnerability of Tamil Nadu, India to climate change: a dynamic approach to take forward the vulnerability assessment methodology. Clim. Chang. 129, 159–181. doi: 10.1007/s10584-015-1327-0
Venus, T. E., Bilgram, S., Sauer, J., and Khatri, A. (2021). Livelihood vulnerability and climate change: a comparative analysis of smallholders in the indo - Gangetic plains. Environ. Dev. Sustain. 24, 1981–2009. doi: 10.1007/s10668-021-01516-8
WHO (2022). Guidelines for drinking-water quility: fourth edition incorporating the first and second addenda. Geneva: World Health Organization.
Williams, P. A., Crespo, O., and Abu, M. (2018). Assessing vulnerability of horticultural smallholders’ to climate variability in Ghana: applying the livelihood vulnerability approach. Environ. Dev. Sustain. 22, 2321–2342. doi: 10.1007/s10668-018-0292-y
World Bank (2012). Financial inclusion and innovation in Africa: an overview. J. Afr. Econ. 24, 1–10. doi: 10.1093/jae/eju031
Zeleke, G., Teshome, M., and Ayele, L. (2023). Farmers’ livelihood vulnerability to climate-related risks in the north wello. Environ. Sustain. Indic. 17, 1–14. doi: 10.1016/j.indic.2022.100220
Keywords: adaptive capacity, climate change vulnerability, exposure, farmers, sensitivity
Citation: Akafu T, Korecha D, Garedew W and Amare A (2025) An index-based approach to assess the vulnerability of coffee-based farmers to climate change and variability across districts in Western Ethiopia. Front. Clim. 7:1537045. doi: 10.3389/fclim.2025.1537045
Edited by:
Mohamed Ait-El-Mokhtar, University of Hassan II Casablanca, MoroccoReviewed by:
Hemen Mark Butu, Africa Finance Corporation, NigeriaManob Das, Bankura University, India
Copyright © 2025 Akafu, Korecha, Garedew and Amare. This is an open-access article distributed under the terms of the Creative Commons Attribution License (CC BY). The use, distribution or reproduction in other forums is permitted, provided the original author(s) and the copyright owner(s) are credited and that the original publication in this journal is cited, in accordance with accepted academic practice. No use, distribution or reproduction is permitted which does not comply with these terms.
*Correspondence: Tesfaye Akafu, dGVzZmF5ZWFrYWZ1NjVAZ21haWwuY29t