 Jonas Meier
 Andreas Hirner1
 Komlavi Akpoti
 Kwame Hackman
- 1German Remote Sensing Data Center (DFD), German Aerospace Center (DLR), Wessling, Germany
- 2International Water Management Institute (IWMI), Accra, Ghana
- 3West African Science Service Centre on Climate Change and Adapted Land Use (WASCAL), Ouagadougou, Burkina Faso
Over the last years, food security in West Africa has been strongly influenced by increasing weather variability, including rising temperatures, irregular precipitation patterns, and more frequent extreme events. These factors threaten traditional rain-fed agriculture, while population growth and urbanization are driving greater demand for rice—a crop increasingly replacing traditional staples. To reduce dependency on imports, West African countries are seeking to expand domestic rice production. Inland valleys and floodplains, due to their high water retention and fertile soils, offer significant but underutilized potential for rice cultivation. To assess the suitability and current extent of rice cropping, we selected Burkina Faso as a representative country in West Africa that exemplifies the challenges outlined above. Inland valleys were delineated using a digital elevation model (SRTM), and rice cropping areas in 2020 were mapped using a random forest classifier applied on Sentinel-1 and Sentinel-2 satellite time series. The classification was based on temporal-spectral metrics, including vegetation indices such as NDVI and backscatter statistics, and validated against reference samples to assess accuracy. Climatic suitability from 1999 to 2021 was evaluated using ERA5-Land reanalysis data, based on crop growth requirements of rice across different growth stages. Only 0.71% of Burkina Faso’s land is currently used for rice cropping, closely matching national FAO statistics (0.74%) and independent mapping efforts. However, approximately 10% of the national territory consists of inland valleys, which are biophysically suitable for rice cultivation. While the southwestern regions show relatively stable climatic suitability, the central and northern areas are more variable and vulnerable to drought, limiting their long-term potential without irrigation. The integration of climatic suitability and landform-based potential highlights considerable opportunities for expanding rice cultivation in Burkina Faso. This study provides a spatial decision-support framework for policymakers to guide sustainable intensification, reduce import dependency, and adapt agricultural systems to climate change.
1 Introduction
Ensuring food security in the face of climate change is one of the most pressing challenges of the 21st century. This challenge is particularly pronounced in West Africa, where climate variability, population growth, and limited agricultural productivity threaten the region’s ability to feed itself sustainably. The interplay between rapid demographic expansion and increasing pressure on natural resources is already straining food systems across the region. Food insecurity in West Africa is mainly driven by the growing population and a further increase from 400 million people today to 1.2 billion by 2,100 is expected (United Nations, 2023). Already today, agricultural production in West Africa is insufficient to meet food security needs, as a high share of the food is imported (United Nations, 2021). This makes West Africa vulnerable to external shocks like the COVID pandemic or regional conflicts and dependent on global food prices and results in high malnutrition values. In contrast to the developments from 2000 to 2015, where the prevalence of undernourishment declined from 16 to 11%, it has increased again to values at a level higher (18%) than 25 years ago (FAO, 2021).
The solution should be to strengthen the local agricultural systems and thus local food production. The existing traditional rainfed agricultural systems rely on the water from the rainy season which is more and more affected by changing precipitation patterns (Pardoe et al., 2016). The changes affect the onset, the duration, the constancy and intensity of the rainy season (Tano et al., 2023). On the one hand, the occurrence of the rainy season and thus the start of the growing season becomes more variable or is delayed, which results in a shorter vegetation period (Salack et al., 2016). On the other hand, the rainy seasons are more frequently interrupted by periods of droughts, which can have devastating effects on the conditions of the plants, depending on the growth stage (Sanogo et al., 2015). Further, an increase of extreme weather like heavy precipitation events leads to flash floods, soil erosion and threatens yields (Reed et al., 2022). All three, the late onset of the rainy season, the interruption by more frequent dry spells and the increase of heavy precipitation events leads to crop failure and yield losses. Especially countries characterized by a large rural population depending on traditional rainfed subsistence farming are tremendously affected by these consequences of climate change. In Burkina Faso, 75% of the population lives in rural areas and faces a multidimensional crisis consisting of conflicts and vulnerability to climate change impact described above, leading in malnourishment and displacement (FAO, 2023a). Despite these significant problems, agriculture is one of the most important economic sectors in Burkina Faso, employing 86% of the economically active population and generating about 20% of the GDP (Barry et al., 2019; World Bank, 2023). Conflicts can only be resolved politically, but climatic challenges must be addressed by adaptation of the current agricultural systems and cropping practices. Therefore, the need for sustainable intensification of agricultural land is clearly reflected in the Sustainable Development Goals (SDG) of the United Nations and plays a crucial role in achieving SDG 2 zero hunger.
The dominant cultivated crop types in Burkina Faso are sorghum, cow peas, millet, maize and groundnut (in this order descending, considering the years 2019–2021; FAO, 2023b). The cereals sorghum, millet and maize are mainly used for traditional food in the region. But dietary changed over the last years, starting in the cities and consumption of rice is increasing today also in rural areas (Yangouliba et al., 2020). In Burkina Faso rice consumption has doubled in the last 10 years (FAO, 2023b) and domestic production has failed to meet the initial demand, so consequently, the rice imports increased, and today accounting for the third highest value of consumer goods imports in Burkina Faso (Africa, 2023). Therefore, the Burkinabe government pushes the domestic rice production to reduce the dependency on rice imports and their global prices (Assolce, 2023). A successful cultivation of crops is always an interaction between crop requirement, climatic and soil conditions and management. Since rice is not part of the traditional rainfed agriculture, farmers have to adjust their field management and have to prepare the fields accordingly. Further, climatic conditions and soil parameters must suit to the crop requirements. Due to a geomorphological peculiarity Burkina Faso has a great potential for rice cultivation by using the inland valleys. Inland valleys are the upper parts of a river drainage system including the rainfed upland to the valley bottom and hydromorphic fringes, and are seasonally flooded (Akpoti et al., 2022; Rodenburg, 2013; Windmeijer and Andriesse, 1993). The soils in the inland valleys are characterized by a high water capacity and a high soil fertility compared to the surrounding uplands. Through erosion, discharge and drainage, soil is accumulated in the inland valleys and which are finer then the dominant sandy soil and are therefore characterized by a higher field capacity, a higher hydraulic conductivity coefficient (kf-value) and a higher cation exchange capacity. These properties make the soils predestined for the cultivation of field crops and agriculture. Although the inland valleys are highly suitable for agriculture they are not part of traditional farming because they must be reclaimed before they can be used for agriculture, often with mechanized equipment. However, their potential for agriculture is well known and reflected in the literature (Akpoti et al., 2022; Akpoti et al., 2020; Djagba et al., 2018; Dossou-Yovo et al., 2017; Ogban and Babalola, 2009; Rodenburg, 2013; Windmeijer and Andriesse, 1993). Rodenburg et al. (2014) concluded in their review study, that the choice of inland valley for rice cultivation is crucial, i.e., not only the physical and environmental aspects must be met for rice cultivation, but also stakeholder-involved land use planning and the development and selection of appropriate practices and technologies according to the principles of integrated management are required (Rodenburg et al., 2014).
Several recent studies have demonstrated the potential of using remote sensing and machine learning techniques to map wetlands (Aslam et al., 2024a,b). In contrast, this study focuses on the physical and environmental determinants of inland valley suitability for rice cultivation, with particular attention to temperature and water availability. To delineate inland valleys, we adopt the geomorphometric approach proposed by Akpoti et al. (2022) based on digital elevation models. Suitable conditions regarding soil parameters for rice cropping can be assumed in inland valleys. The suitability analysis regarding climate variables is conducted using precipitation and temperature from ERA5-Land data. Therefore, we parametrized the climatic requirements of an upland rice and applied it to the ERA5-Land data from 1999 to 2021 to assess the variability of the climate suitability over a 23-year period.
Several studies are analyzing crop suitability in Africa for current and future climate scenarios (Zabel et al., 2025) or are focusing on regional hot spots in West Africa (Akpoti et al., 2022; Akpoti et al., 2020; Chemura et al., 2024; El-Namaky et al., 2017; Gbode et al., 2025; Egbebiyi et al., 2019). National and regional studies are available in Ghana (Chemura et al., 2020; Salifu et al., 2022), Togo and Benin (Akpoti et al., 2020), Chad (Issiné et al., 2024), Senegal (Diallo et al., 2016; Gérardeaux et al., 2021), Nigeria (Abah and Petja, 2016; Ayoade, 2017; Ujoh et al., 2019) and Burkina Faso (Akpoti et al., 2021; Yangouliba et al., 2020), countries characterized by a semi-arid climate. Focus of the studies are to assess the suitability for current and future climate scenarios but do not consider the already used area for rice cropping. Focus of this study is to assess the gap between the currently used area and the potentially suitable area for rice cropping. Rice mapping is one of the best researched topics regarding crop type mapping with EO (Kuenzer and Knauer, 2013). Especially paddy rice is relatively easy to distinguish from other crops, as during the cultivation these fields are temporally flooded and then completely covered by water and are therefore relatively easy to distinguish from other crops (Jiang et al., 2021). Due to the water scarcity in West Africa and especially in Burkina Faso, farmers are forced to apply alternative farming techniques, inducing less water and the clear differences to other crop types in EO data dissolve. There are a few methods published to map rice are in West Africa mainly using a combination of SAR and multispectral data to overcome the prevailing cloud cover during the rainy season (Fiorillo et al., 2020). In this study we applied a random forest classifier with Sentinel-1 VV and VH metrics, Sentinel-2 derived vegetation indices and the inland valley extend as input feature. The model is trained with > 1,000 samples from Burkina Faso with rice and > 1,000 samples with non-rice points and is restricted area outside of protected zones and water bodies.
The integration of Earth observation (EO) and climate data has proven valuable across disciplines including agriculture (Akpoti et al., 2020; Zhang et al., 2022), biodiversity (García-Amorena et al., 2021; Vila-Viçosa et al., 2020) or hydrology (Rasheed et al., 2024). However, due to the diversity of research objectives, spatial scales, and regional contexts, there is no universally established state-of-the-art approach for integrating EO data with climate and ancillary datasets. This study presents an innovative framework that combines DEM-derived inland valleys, a fuzzy logic-based climatic suitability model, and EO-derived rice cropping maps to quantify the gap between potentially suitable and currently utilized rice cultivation areas. The approach is applied for the first time in Burkina Faso but is transferable to similar regions across West Africa. Specifically, the study aims to: (1) assess the long-term climatic suitability for rice cropping in Burkina Faso from 1999 to 2021; (2) identify inland valleys as areas with favorable soil conditions for rice cultivation; and (3) map the current extent of rice cultivation. By integrating these three components, the study provides a comprehensive evaluation of the potential for sustainable rice cropping expansion in the country. The results of this study can serve as a basis of future research considering socio-economic aspects and infrastructural conditions to improve the evaluation of rice cultivation potential.
2 Study area and data
2.1 Study area
Burkina Faso is a Sub-Saharan landlocked country located in Western Africa with a size of approx. 274,000 km2. The country is relatively flat with an elevation between 150 m and 700 m (Figure 1).
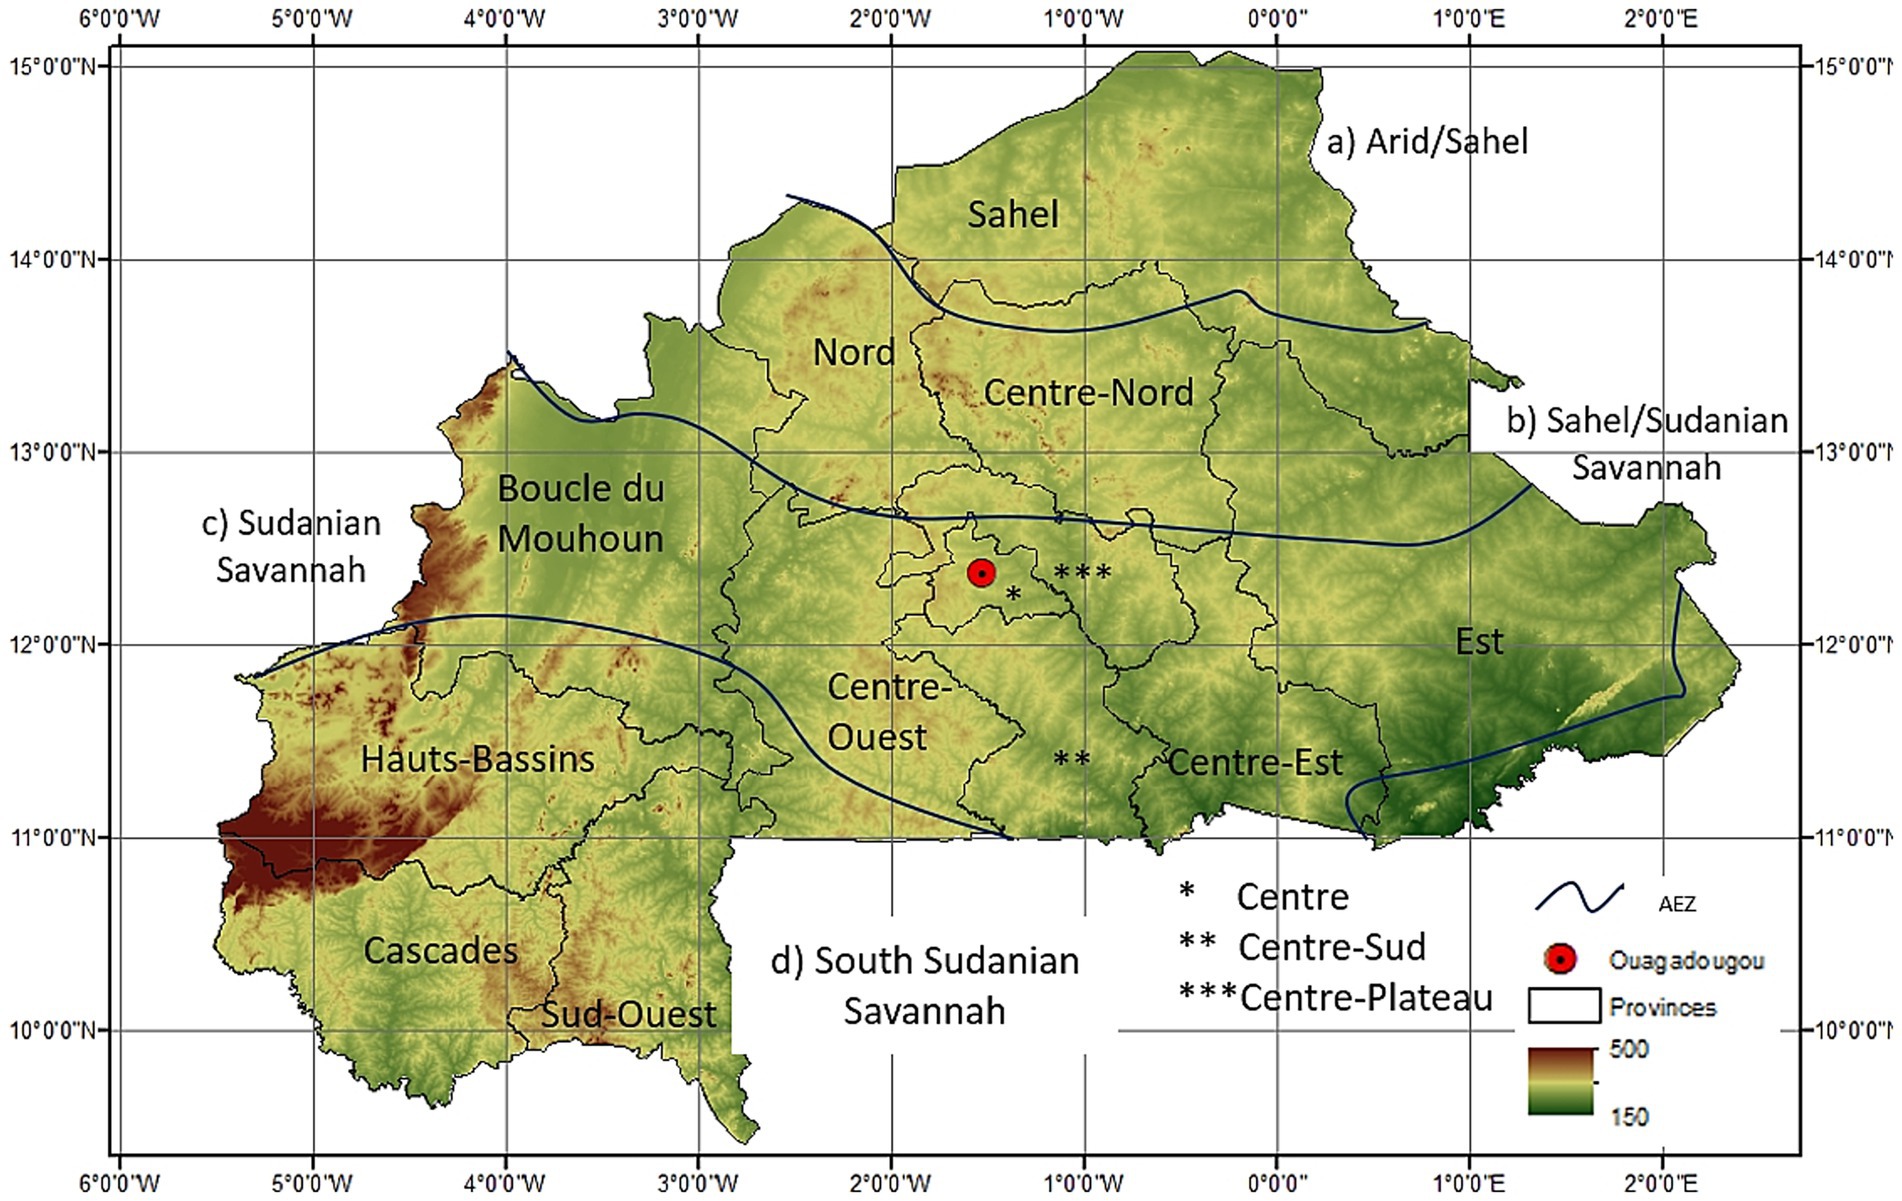
Figure 1. Digital elevation model of Burkina Faso including the different agro-ecological zones (AEZ) of Burkina Faso: (a) Arid/Sahel, (b) Sahel/Sudanian savanna, (c) Sudanian savanna, (d) South-Sudanian savanna (Ayantunde et al., 2023).
The climate in the country is characterized by a strong North–South gradient from a tropical savannah in the South to an arid steppe and desert in the North (Figure 2). In the North the annual mean temperatures are up to 29°C with high rates of evapotranspiration. Here, the annual precipitation sum can be less than 300 mm. The Southern part is more tropical, with annual mean temperatures of 27°C and an annual precipitation sum of up to 1,200 mm, which makes this region more suitable for agricultural practices. The climate is mainly influenced by the interaction between the moist and rainfall-delivering West African monsoon and the Harmattan in the North, which brings dry and hot air from the Sahel region.
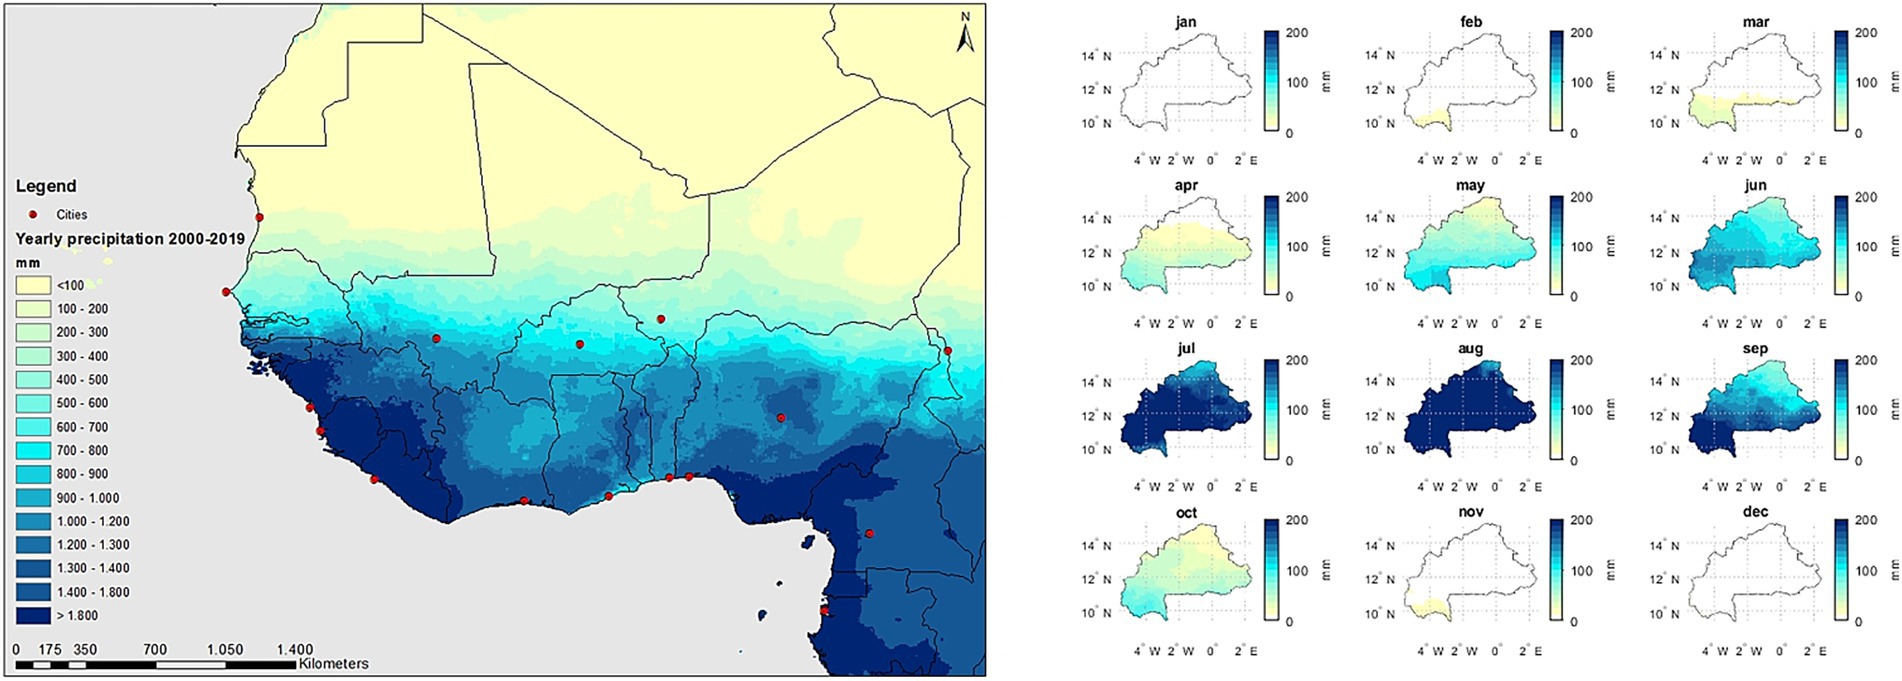
Figure 2. The location of Burkina Faso in West Africa and the annual and monthly precipitation sums in Burkina Faso averaged from 2000 to 2019 in West Africa. Data Source: GPM IMERG (Huffman et al., 2019).
The year is clearly separated in a dry and a rainy season, receiving 80–90% of the annual precipitation sum between April and September (Tomalka et al., 2021) (Figure 2). Since the traditional rainfed agriculture relies on the rainy season, a change in the precipitation pattern can affect rainfed agriculture tremendously.
Agriculture is the most important socio-economic sector in Burkina Faso. The major staple crops are sorghum, cow peas, maize and millet in terms of harvested area and sugar cane, bananas, tomatoes, onion and yam in terms of production. Only one third of the households show income diversification, which means that two thirds strictly rely on their harvested products. This scenario poses a great risk, especially on rural and vulnerable households, when their means of livelihoods are impacted by the effects of erratic rainfall, and the consequent dry spells, droughts and flood events (Carla et al., 2001).
2.2 Data
This study integrates Earth observation, climatic, and reference data to assess the suitability and current extent of rice cropping in Burkina Faso. An overview of the datasets used is provided in Table 1. In the following section we elaborate on each dataset and its role in the analysis. Sentinel-1 radar imagery (VV and VH polarization) from the year 2020 was used to capture the structural and phenological characteristics of rice fields, benefiting from its cloud-penetrating capability and consistent temporal coverage. Sentinel-2 data for the same period were used to compute vegetation indices such as NDVI, NDWI, and EVI. The 10 m spatial resolution is suitable for mapping smallholder agricultural fields common in the region. The SRTM elevation data at 30 m resolution were used to derive topographic variables including slope, flow accumulation, and topographic wetness index. As climatic data we used ERA5-Land from 1999 to 2021 to evaluate long-term climatic suitability for rice cropping. The dataset provides gridded estimates of key climate variables, including daily precipitation and temperature at a resolution of 0.25°. ERA5-Land was selected for this study due to its long temporal coverage (1999–2021), consistent reanalysis framework, and daily resolution of precipitation and temperature, which are necessary for deriving a long-term climatic suitability index.
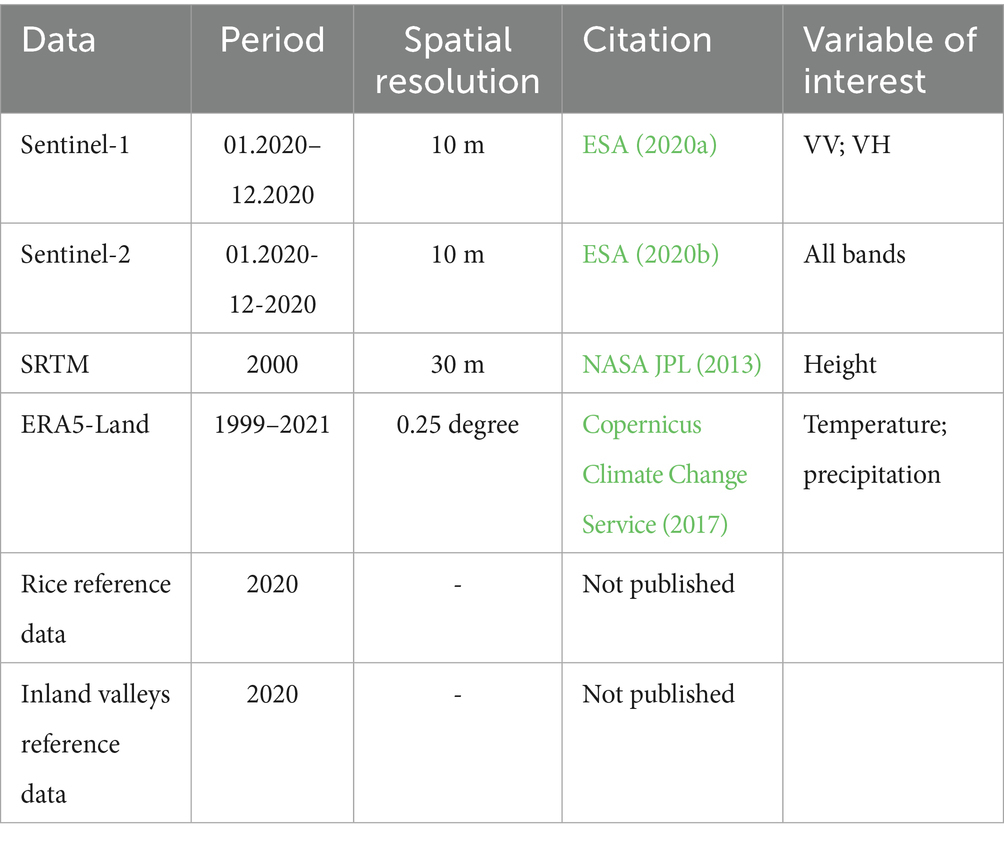
Table 1. Overview over the data used in this study.
Reference data on known rice cropping areas and inland valleys, collected in 2020 through field surveys (inland valleys), high resolution images from Google earth (rice) and expert consultations, were used to train and validate the classification and suitability models. These reference datasets are not publicly available but provide essential ground truth for model calibration and accuracy assessment.
3 Methods
The methods are described in the following sections in three sub chapters: the mapping of the inland valleys, the climatic suitability and the mapping of the currently used rice areas. Figure 3 shows the approach and how the different aspects of the study are combining the result. The environmental suitability index is derived by combining two components: soil suitability, based on the spatial distribution of inland valleys, and climatic suitability, assessed using a fuzzy logic approach. Potential rice areas are identified as locations meeting both suitability criteria. The gap assessment compares these potentially suitable areas with the currently cultivated rice areas to highlight underutilized regions with high suitability for expansion.
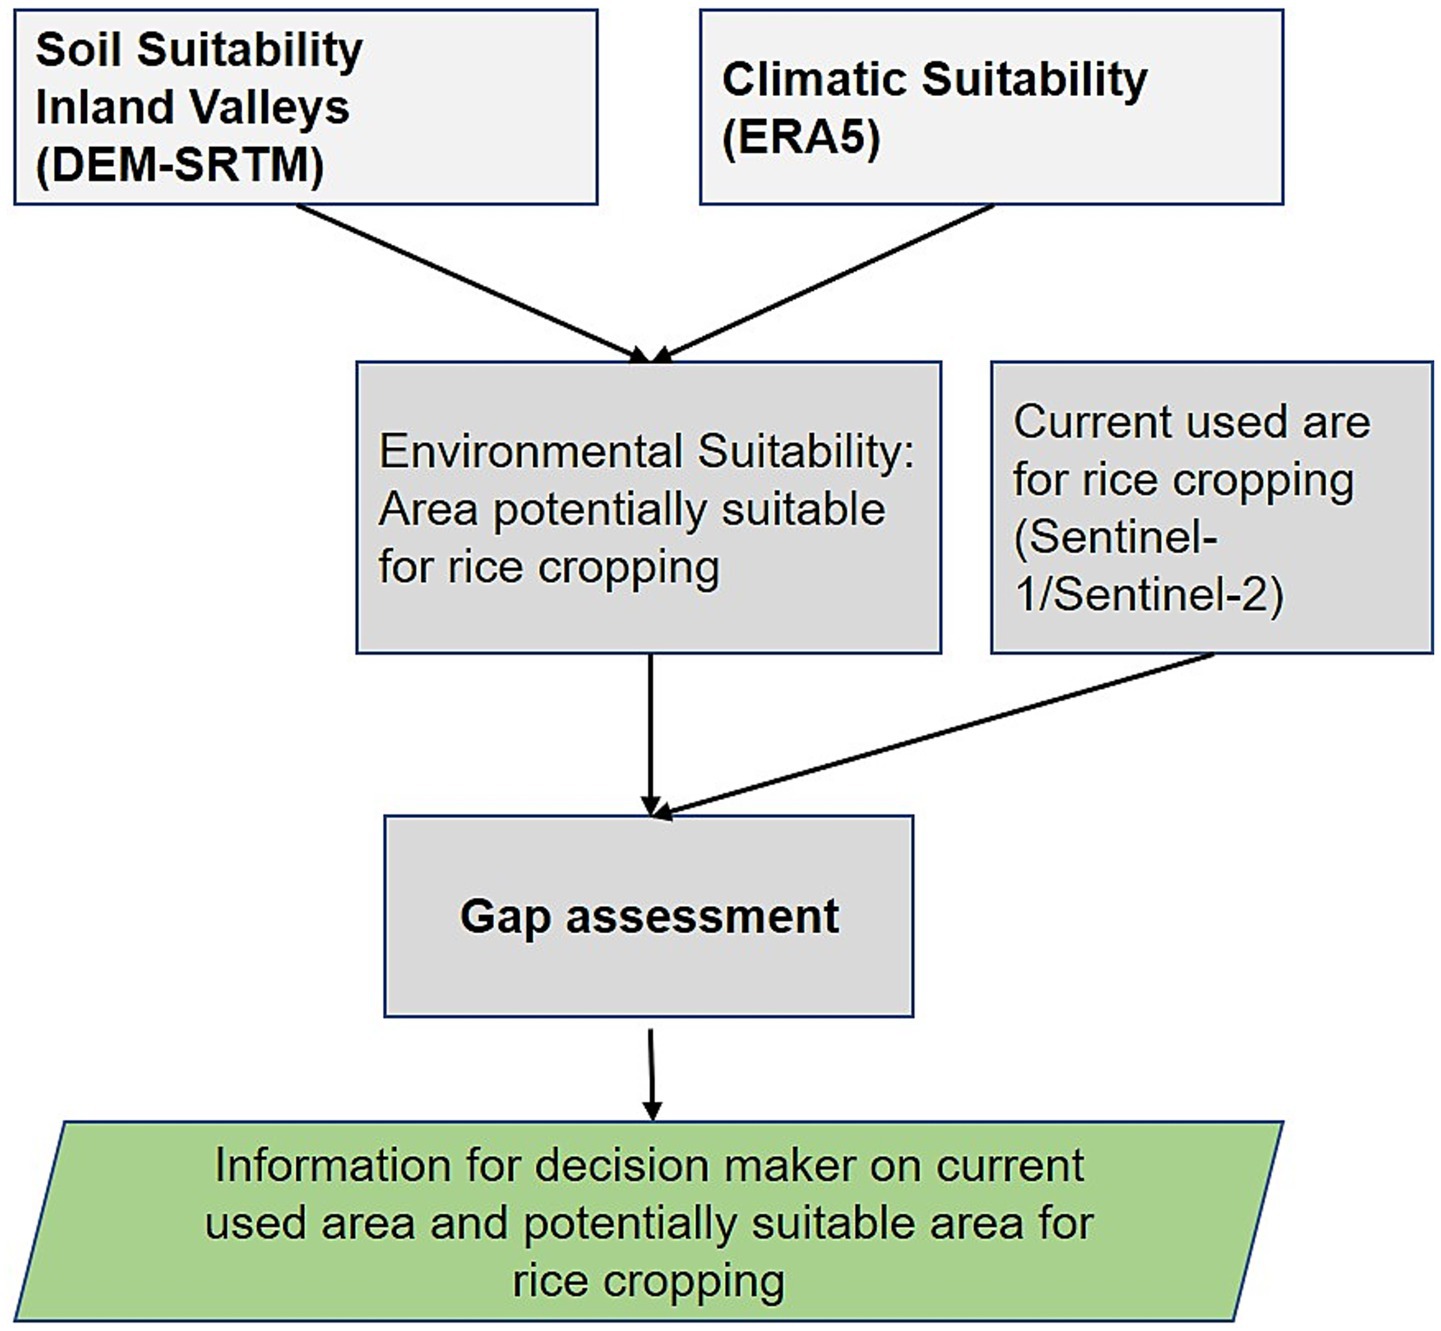
Figure 3. The interaction of the different data set developed in this study.
3.1 Mapping inland valleys
The basis of the derivation of the inland valleys is the digital elevation model (DEM) of NASA’s Shuttle Radar Topography Mission (SRTM) with a resolution of 30 m (NASA JPL, 2013). The DEM tiles were mosaicked and hydrologically corrected through iterative filling to ensure a continuous drainage network. We then computed standard terrain derivatives: flow direction, slope, and flow accumulation.
Two geomorphological indices were calculated to characterize potential inland valley areas:
(1) Topographic Wetness Index, TWI (Beven and Kirkby, 1979), defined as:
where a is the upslope contributing area and β the local slope. TWI identifies areas with a high potential for soil moisture accumulation, indicating hydrologically favorable conditions based on differences in landscape topography.
(2) Lowness Index, derived as the ratio of lower-elevation cells to the total number of cells within a moving window around each cell. This index captures local topographic depressions typical of valley bottoms.
Based on the work of Akpoti et al. (2022), developed in Benin and Togo, the TWI is selected as part of the identification process of the inland valleys. The TWI is commonly used to describe soil moisture patterns or hydrological conditions based on differences in landscape topography. As a second indicator, the lowness index is derived from the elevation percentile, or the ratio of the number of points of lower elevation to the total number of points within a specified neighboring area in a DEM. It is useful to determine local relief in a specified neighbor area, and it is generated using a moving window centered on each cell. Through the combination of both indices into a multiscale fuzzy index, it is possible to identify valley bottom flatness, in contrast to hillslopes, with the objective to define the morphometry of inland valleys in a comprehensive manner (Gallant and Dowling, 2003; Sørensen et al., 2006). Both indices were combined into a multiscale fuzzy membership model. A small-type fuzzy membership function was applied to the lowness index (lower values represent valley bottoms), and a linear fuzzy membership function was applied to the TWI (higher values indicate wetter conditions). The two layers were then combined using a fuzzy overlay with sum operator, producing a continuous index representing the likelihood of being an inland valley. To determine the final threshold for inland valley classification, we conducted a descriptive statistical analysis based on 1,907 ground-truth points of known inland valley locations. We extracted the fuzzy index values at these points, removed outliers, and calculated a 95% confidence interval for the mean across all regions. The lower bound of 0.878 of this confidence interval was then used as a classification threshold to delineate inland valleys across Burkina Faso.
3.2 Rice suitability
Inland valleys in Burkina Faso are characterized by favorable soil conditions, particularly high water retention capacity, making them generally well-suited for crop cultivation. Therefore, in this analysis, we assume soil to be non-limiting and focus exclusively on climatic suitability as the potential limiting factor for rice growth.
To evaluate climatic suitability, we applied a fuzzy-logic approach (Burrough, 1989), which allows for the gradual classification of environmental conditions along a continuous suitability scale. The suitability was calculated based on temperature and precipitation requirements for upland rice as defined by Sys et al. (1993), with methodological implementation adapted from Zabel et al. (2014).
We modeled the rice growing season as a 110-day period, which aligns with the typical length of a rainfed upland rice cycle. Instead of fixing a single sowing date, we applied a moving window approach across all 365 days of the year. For each possible 110-day period, we calculated the suitability using daily ERA5-Land climate data (Hersbach et al., 2017), aggregated to a 0.25° spatial resolution. This temporal flexibility allows the identification of the most suitable growing period per year, independent of predefined planting calendars.
The suitability values are derived from fuzzy membership functions that represent the crop suitability for rice in relation to the mean, minimum, and maximum temperature, as well as total precipitation in the different growing stages during the growing cycle. For both temperature and precipitation, the membership functions follow a Gaussian-shaped optimum curve: values too low or too high result in low suitability, while conditions near the optimum result in high suitability values. Both temperature and precipitation were translated into fuzzy membership functions, scaled from 0 (unsuitable) to 100 (optimal conditions). The lower value of the two (temperature vs. precipitation) was retained to represent the overall suitability, ensuring that the most limiting climatic factor governs the final score.
This process was repeated annually from 1999 to 2021, to identify one suitability value per year. These values capture interannual climatic variability and support the analysis of long-term trends and climate-related vulnerability in inland valley rice cropping across Burkina Faso.
3.3 Mapping of current rice cropping area using EO data
To assess the gap between the potential and the currently used rice area, we mapped the rice area in Burkina Faso nationwide using earth observation data from the year 2020. The area of land under rice cultivation in Burkina Faso is relatively stable, as it generally requires investment in infrastructure (e.g., land leveling, construction of dams and water management systems), which usually leads to relatively stable areas under cultivation over several years. Therefore, we applied a supervised classification using a random forest model on Sentinel-1 and Sentinel-2 data in 2020 and on the derived inland valleys from the SRTM. A schematic workflow is shown in Figure 4. Except the post processing the whole workflow was completed in Google Earth Engine (GEE). Sentinel-1 data, from a C-Band Synthetic Aperture Radar (SAR), were used due to their ability to capture vegetation structure and moisture content and to their irrespective of clouds. The data were preprocessed as Ground-Range-Detected (GDR), that means the data has been projected to the ground range using the sensor’s viewing geometry, including steps for thermal noise removal, radiometric calibration, and terrain correction. The preprocessing results in 1029 Sentinel-1 data sets considering the full archive available in for Burkina Faso during the year 2020. Both the single co-polarization in vertical transmit and receive (VV) and the dual-band cross-polarization in vertical transmit and horizontal receive (VH) were employed for feature extraction. For each polarization (VV and VH), we calculated several metrics including the 10th, 50th, and 90th percentiles per year, as well as the minimum, mean, and maximum values – based on the radar backscatter coefficient (in decibels, dB). These metrics aim to characterize the temporal and spatial variation of surface backscatter across the study area. Sentinel-2 is a multi-spectral instrument (MSI) and is available as level 2A (surface reflectance) data in the GEE. The Sentinel-2 data were used to derive vegetation indices and spectral features essential for vegetation analysis, well known from different vegetation mapping applications. To minimize noise caused by atmospheric effects, we applied cloud, cirrus, and cloud-shadow masking using the QA60 band from Sentinel-2, following established methods (Cardille et al., 2024). The preprocessing results in 4279 Sentinel-2 scenes. The resulting cloud-free Sentinel-2 data were used to calculate several vegetation indices and temporal metrics. We calculated the Normalized Difference Vegetation Index (NDVI), the Enhanced Vegetation Index (EVI), the Normalized Difference Water Index (NDWI), a spectral transformation (Tasseled Cap) and to capture the temporal variability of spectral features and vegetation indices we calculated several percentiles (10, 25, 50, 75, and 90th). These percentile-based metrics serve as robust descriptors of the seasonal dynamics of rice fields, providing a multi-dimensional view of the vegetation cycle. Additionally, the derived inland valley extent from the SRTM was incorporated into the model stack, since rice is mainly cropped in the suitable inland valleys.
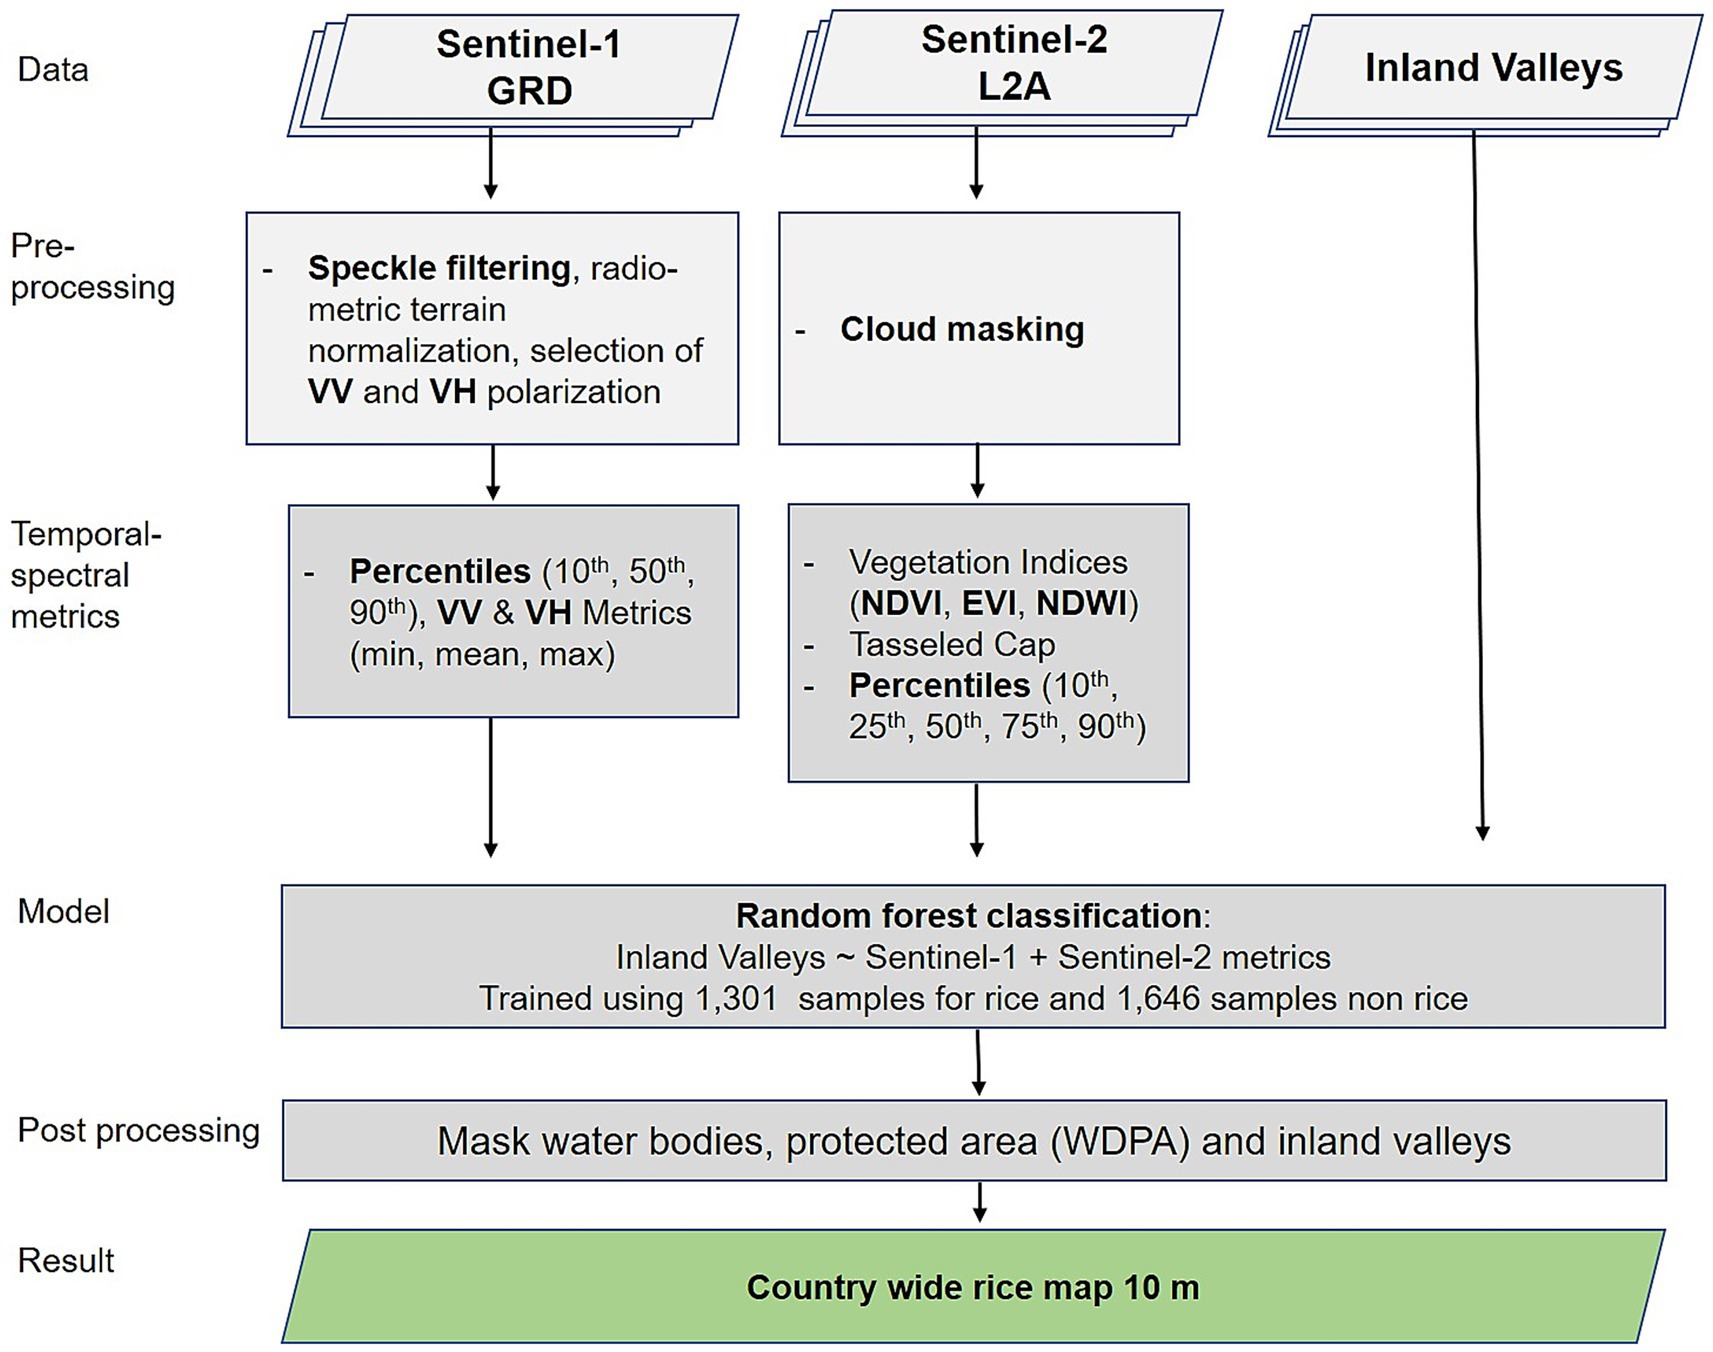
Figure 4. Workflow of the rice mapping using a random forest classifier on Sentinel-1, Sentinel-2 and the inland valleys derived from SRTM.
We performed a supervised classification to map rice and non-rice areas using a random forest model, a well-known machine-learning ensemble technique in the field of remote sensing (Belgiu and Drăguţ, 2016; Pal, 2005). We collected training data of rice and non-rice areas based on high resolution images from Google Earth supervised by local experts who are involved in rice cropping in inland valleys in Burkina Faso. In total 1,301 training areas of rice where collected, regularly distributed over the known rice cropping area of all of Burkina Faso. To provide a reliable differentiation between rice area and non-rice area also representative samples of non-rice areas were collected. A broad coverage of all other land uses needed to be considered, leading to a number of 1,646 reference areas for non-rice. A random forest classifier was trained using these samples—randomly split into 90% for training and 10% for validation. The accuracy assessment was thus performed across the entire study region, using spatially distributed samples from both rice and non-rice areas to evaluate the classifier’s generalizability and performance. We set up the model with 500 decision trees, to ensure an effective balance between accuracy and efficiency, each tree is trained on a different subset of training data, to reduce an overfitting of the model by ensuring that no single tree dominates the model (Belgiu and Drăguţ, 2016). At each split of the trees the algorithm randomly selects a subset of the spectral features to create partitions that best separates the classes rice vs. non-rice. The final prediction is the aggregated votes of all trees using a majority voting. After training, the classifier was applied to the composite images to generate a binary classification of rice and non-rice areas. To assess the performance of the classification model, we evaluated different standard accuracy metrics. Formulas can be found in Congalton and Green (2019). To exclude an agreement by chance between mapping result and validation data we calculated the Kappa coefficient, where 1 states an agreement beyond chance. To assess the proportion of all correctly classified samples independent of the class (rice/non-rice) we calculated the overall accuracy, where 1 means a perfect agreement of the validated samples. The producer’s accuracy (PA) of the class rice was calculated to assess the ability of the approach to correctly classify the validation areas of rice. Additionally, the user’s accuracy (UA) was calculated for the class rice, to estimate the probability that a given location of rice in the map is correctly classified.
To avoid miss classifications we excluded protected areas, where agricultural practices are not allowed (UNEP-WCMC, 2024). Furthermore, we masked permanent water bodies (Zanaga et al., 2021), since the seasonal development of vegetation in water bodies or wetlands can lead to a similar appearance like rice cultivation. The last post procession step is the masking via the inland valleys since rice cropping is only possible in inland valleys due to the described soil properties mentioned earlier.
4 Results
This section presents the results of the delineation of the inland valleys, the climatic suitability, and of the current used area for rice cropping.
The inland valley analysis delineates the potential area for rice cropping regarding soil properties, the climatic suitability shows the suitability from the perspective of precipitation and temperature conditions and its variability in the different years, classified in highly suitable (>75), suitable (50–75), marginally suitable (25–50) and not suitable (<25) area. The current situation of rice cropping is finally shown in the EO-based rice mapping. Table 2 summarizes the key findings of the study.
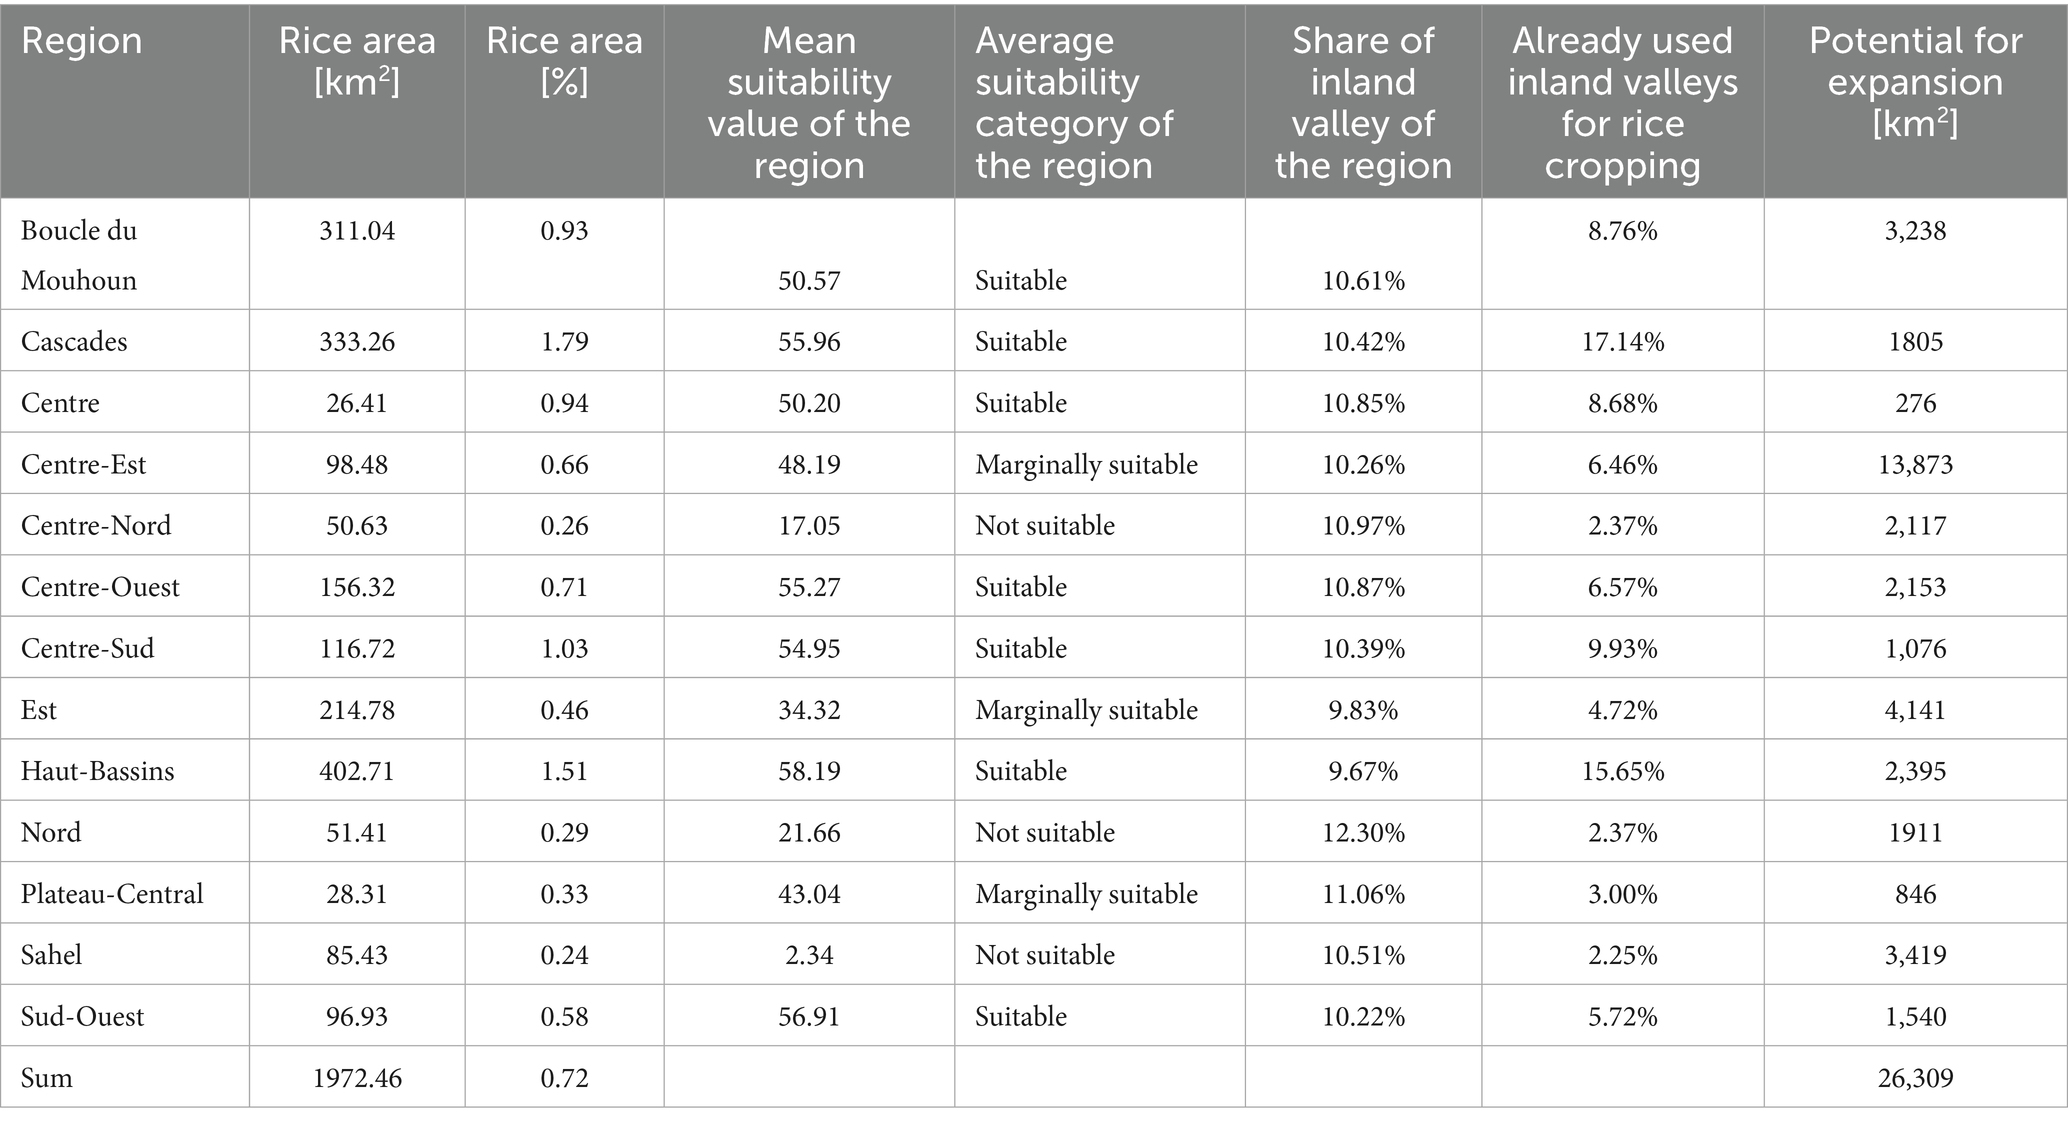
Table 2. Current used rice area in km2 and % of the country per region and the corresponding suitability value and inland valley.
4.1 Inland valleys
The inland valleys are very regularly distributed over the country and account for around 10% of the total area (27.425 km2; Figure 5).
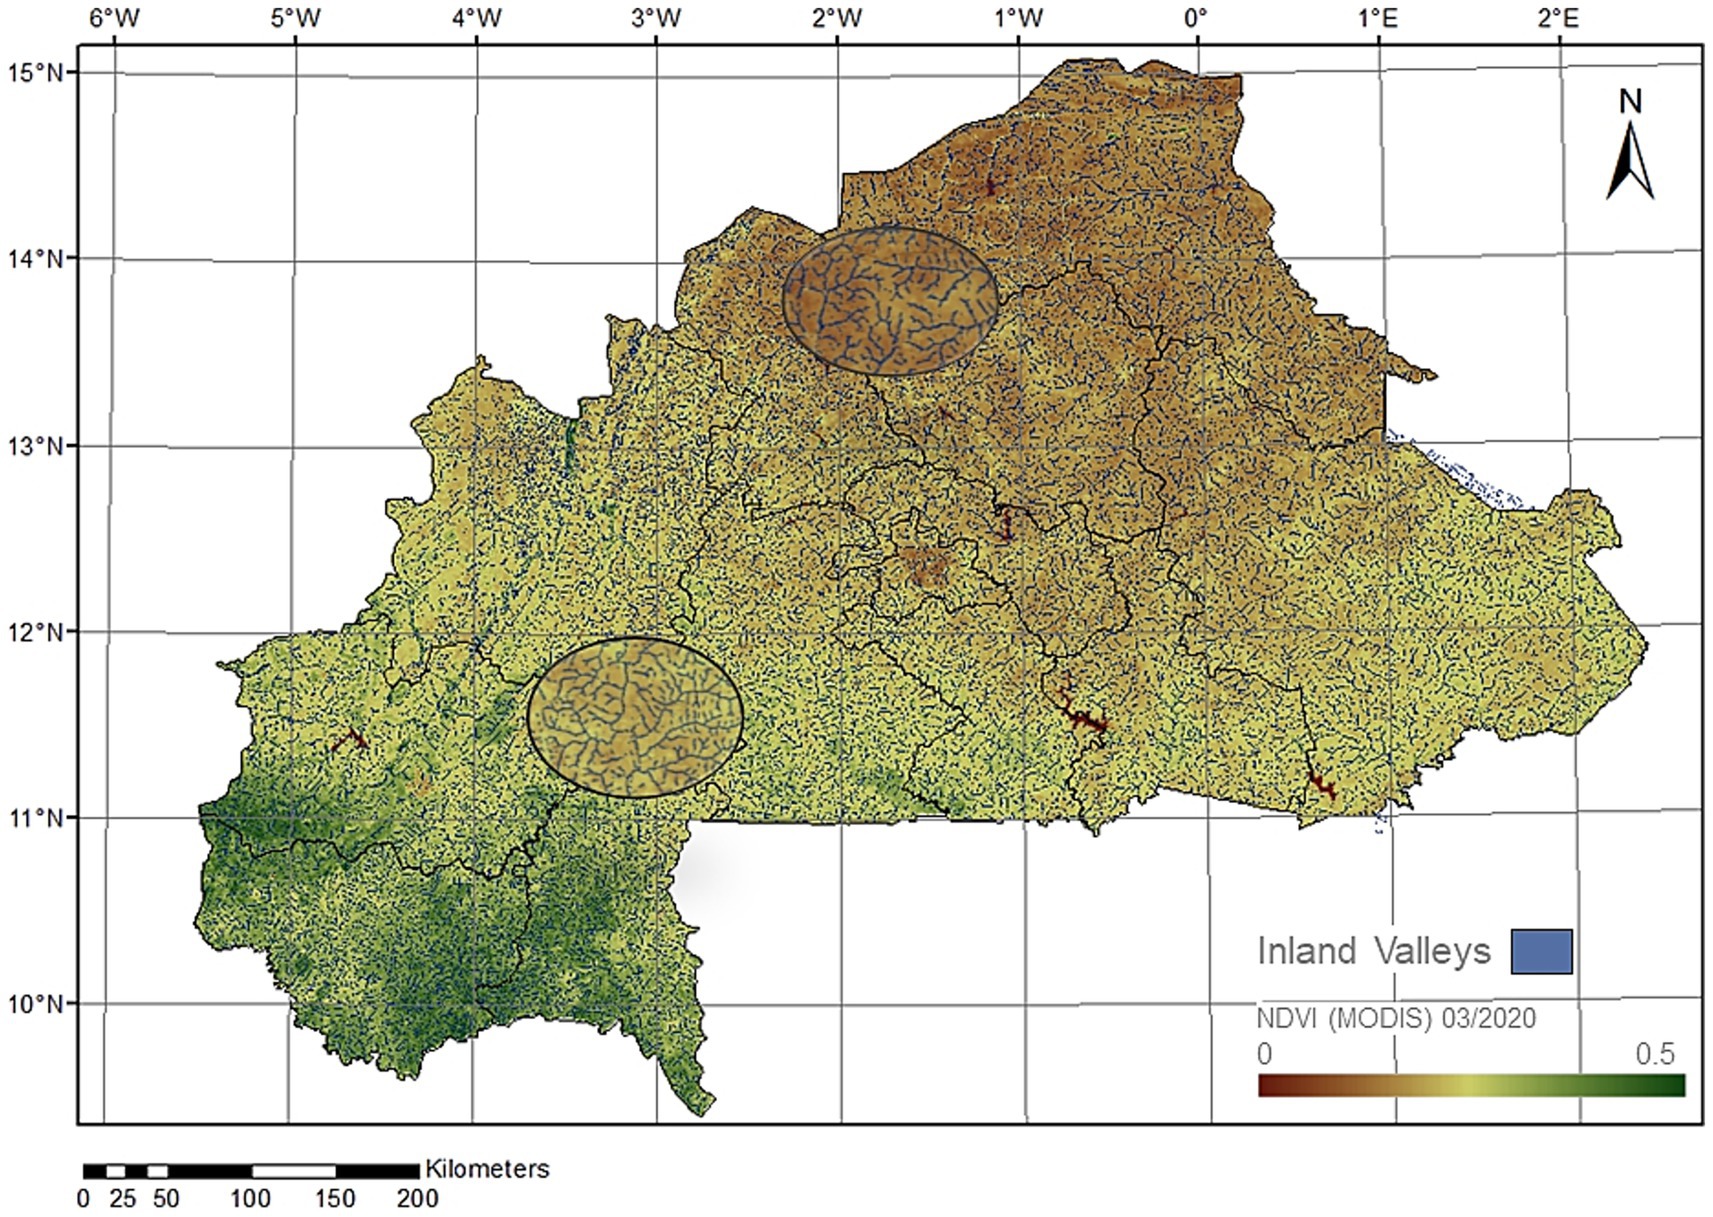
Figure 5. Distribution of the inland valleys in Burkina Faso. Inland valleys are regularly distributed over the whole country. The zooms show how the valleys meander.
The inland valleys follow old drainage axes with soils characterized by a high water capacity. The drainage axes are approx. 100–300 m wide and extend longitudinally into the landscape.
Table 2 column 5 shows the share of inland valley area compared to the total area per region which proves the regularity of the distribution of the inland valleys in Burkina Faso.
4.2 Climatic suitability
The mean climatic suitability from 1999 to 2021 for rice cropping in Burkina Faso shown in Figure 6a. The results show a strong gradient following the climatic zones as described in section 2.1. Due to the dry and arid climate in the Northwestern part of the country the suitability values for rice cropping are very low which makes these regions unsuitable for rice cropping even though inland valleys might exist.
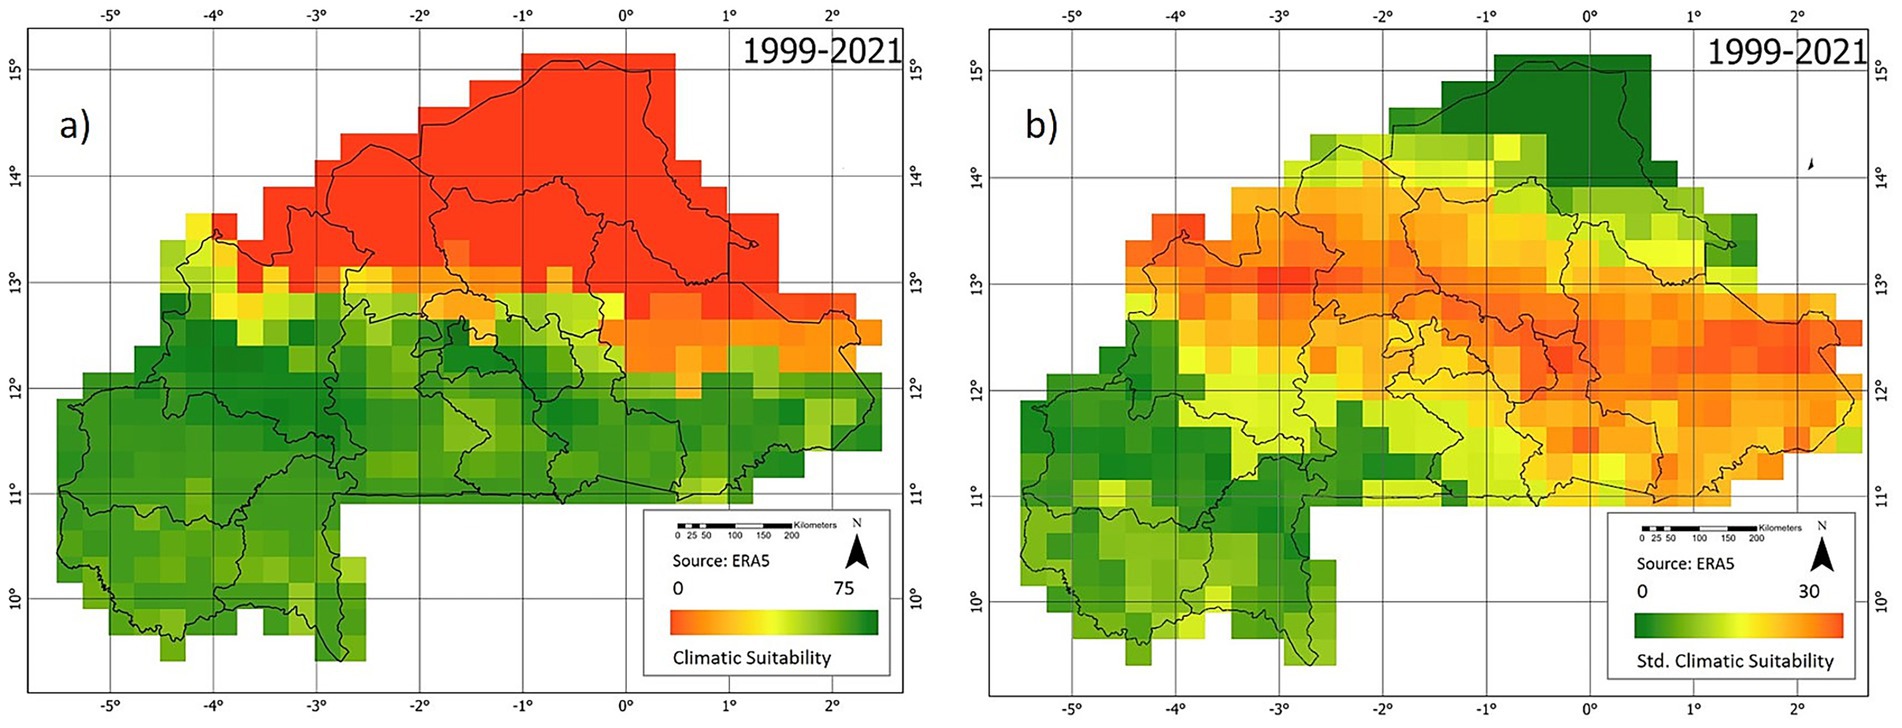
Figure 6. Long-term mean of the suitability values for rice cropping from 1999 to 2021 (a) and the corresponding standard deviation from 1999–2021 to the mean suitability values (b).
The regions located in the South and Southwestern part are more suitable for rice cropping but none of the areas are categorized as “highly suitable” with values >75. Most of the area in the Southwestern part is between “marginally suitable” and “suitable.” The pattern of the long-term mean is characterized by a zone around 13 °N where suitability values drop relatively strong toward the North to low values with a particularly strong gradient from high suitability values in the South to low (unsuitable) values in the North. This zone can be interpreted as a “suitability boarder” reaching from the Northwestern part to the Southeastern part. The standard deviation in Figure 6b shows that these areas are vulnerable areas since rice cropping might be possible for some years but is highly threatened by climatic events like, e.g., droughts. The effect of the varying “suitability boarder,” caused by the yearly precipitation and temperature patterns, is also clearly shown in the maps of yearly climatic suitability values (Figure 7a).
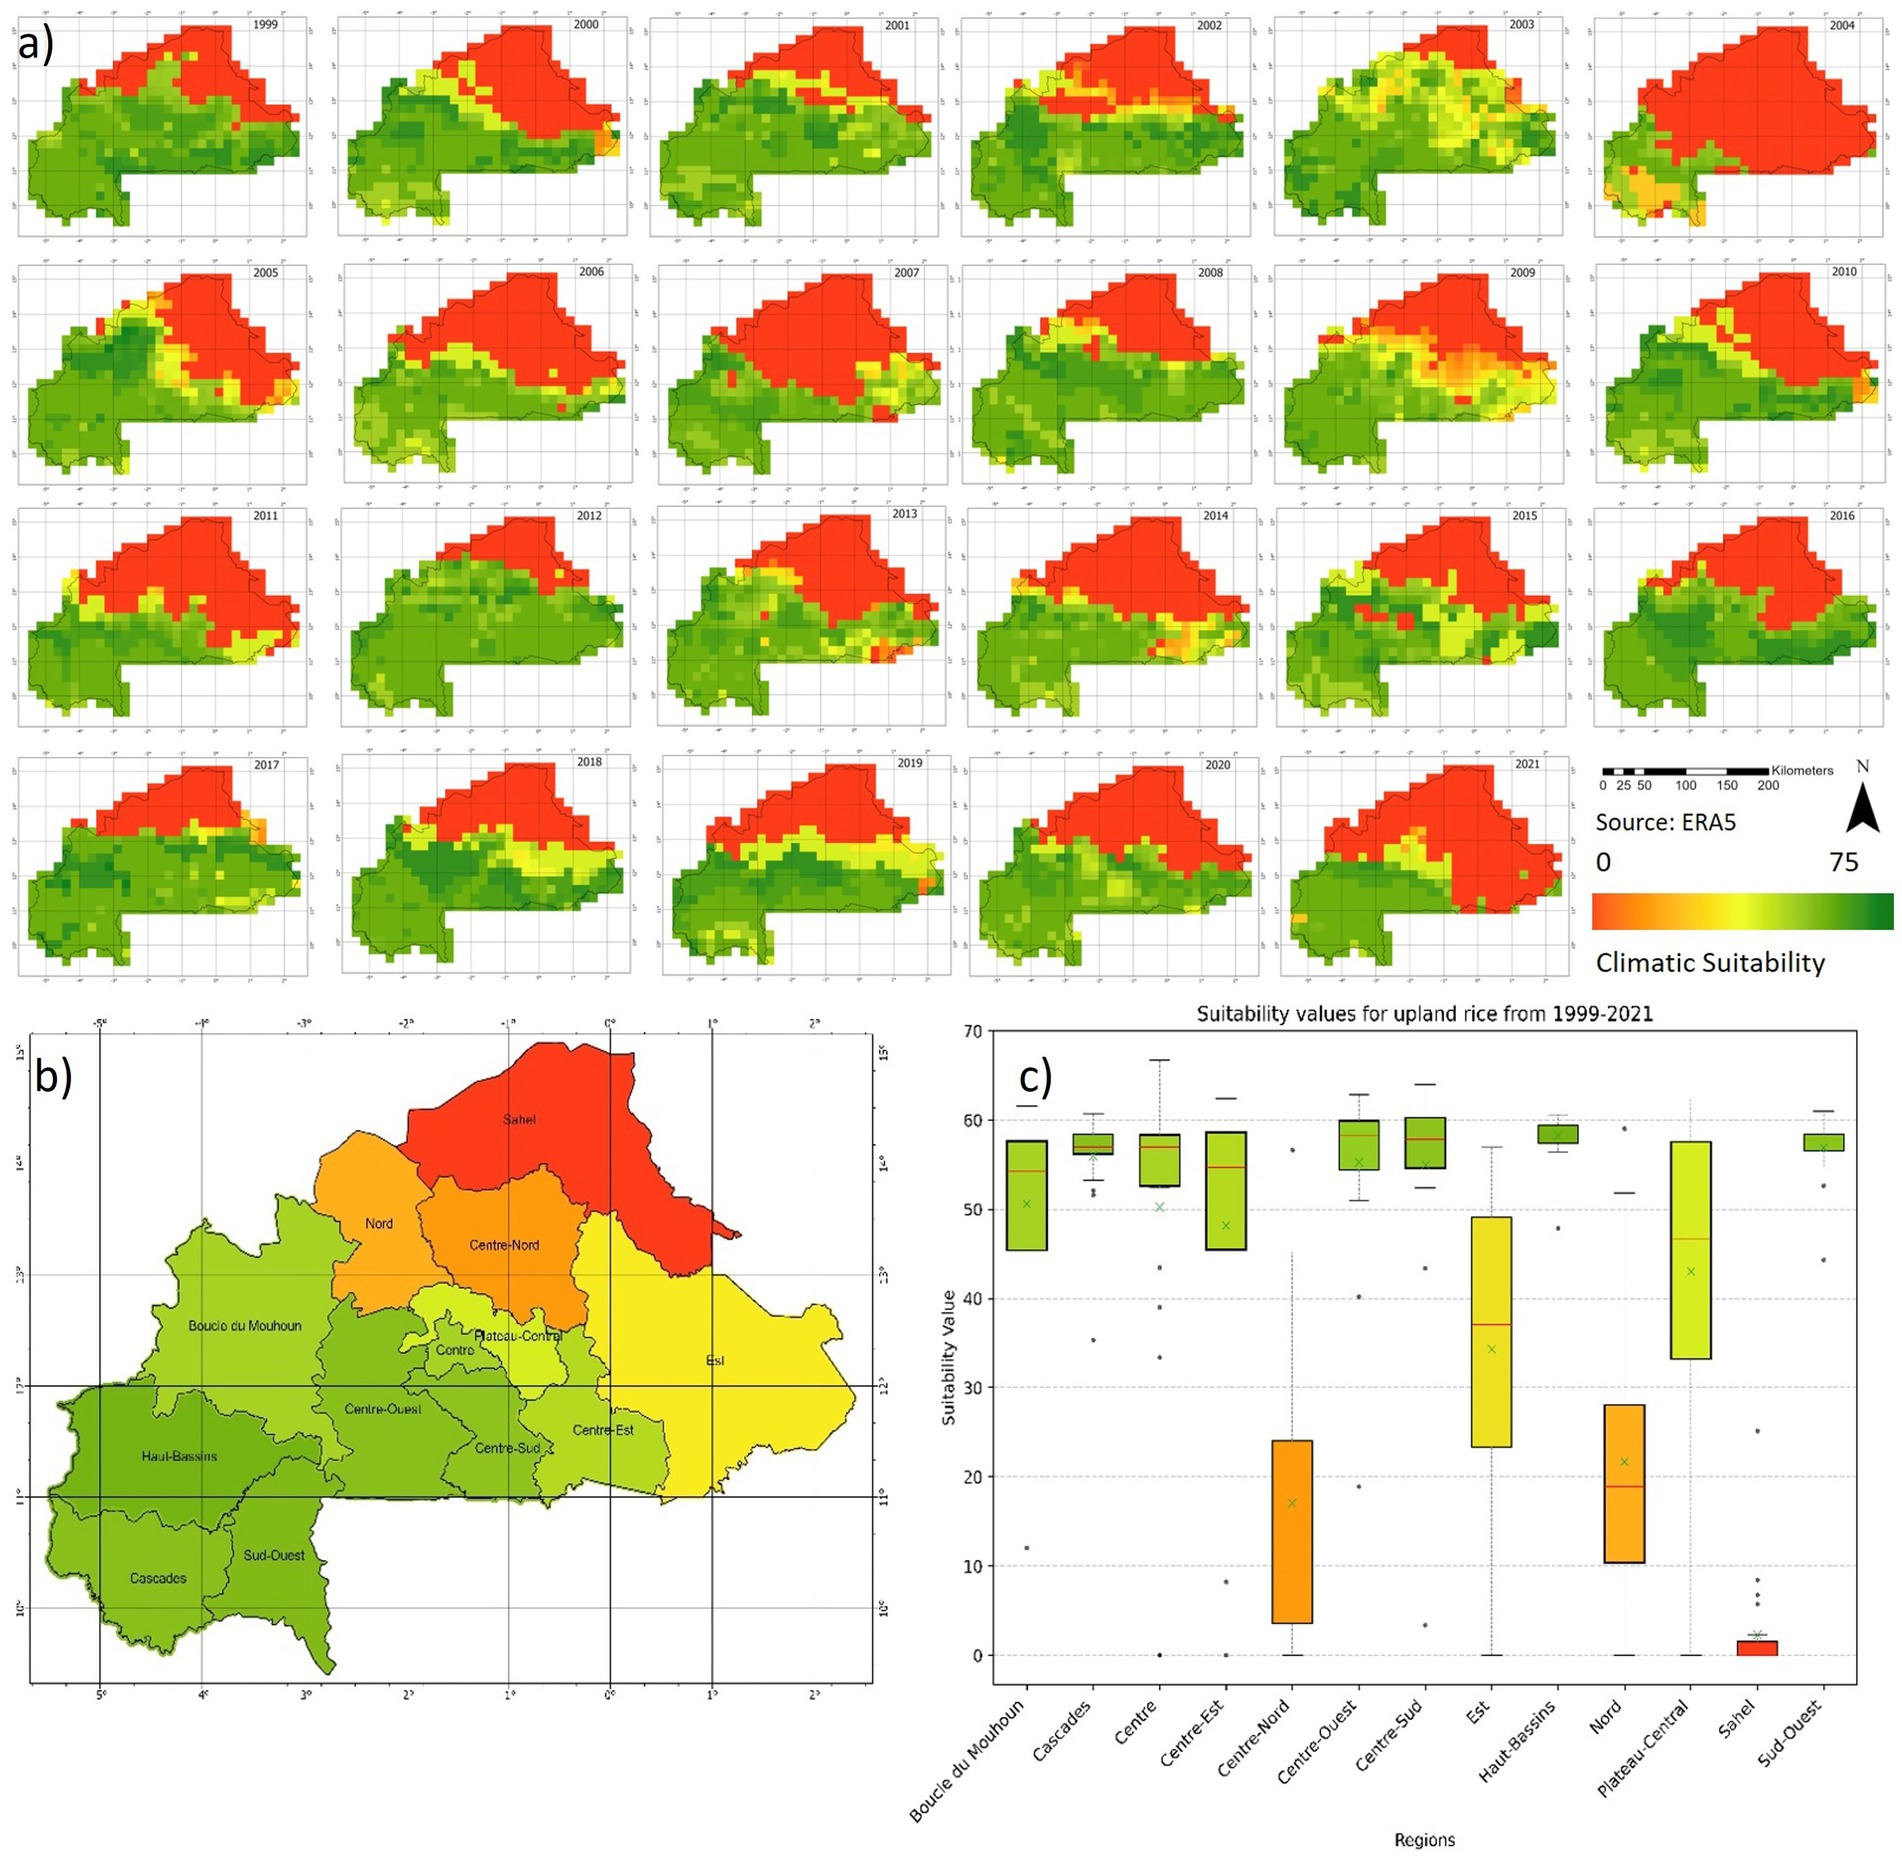
Figure 7. Annual suitability maps from 1999–2021 (a), the mean suitability values for the 13 different regions in Burkina Faso (b) and the yearly variability (c).
Two years of the time series represent two extremes. The year 2004 shows that in the Southwestern parts of the country the suitability decreases compared to the long-term mean and even in the regions where the suitability is >50 for most of the year, rice cropping would not be possible. The other extreme is the year 2012 where the “suitability boarder” reaches far North which means rice cultivation was relatively save in this year.
A regional analysis shows the variability of the suitability during the years from 1999 to 2021 (Figures 7b,c). The suitability stays relative constant in the Southwestern regions. The Northern regions Sahel, Centre-Nord and Nord are not suitable for rice cropping. The regions Est, Centre-Est, Plateau-Central, Boucle du Mouhoun, Centre-Ouest and Centre-Sud are showing a couple of years where rice cropping is threatened by climatic events and crop failures are possible. Only the Southwestern regions Cascades, Hautes-Bassins and Sud-Ouest have through the whole time period suitability values around 50 and are therefore suitable for rice cropping. Overall, Burkina Faso shows a marginally suitability, areas with values >75 (“highly suitable”) never occurred in the analyzed time period. Table 3 shows the yearly suitability values for each region between 1999 and 2021.
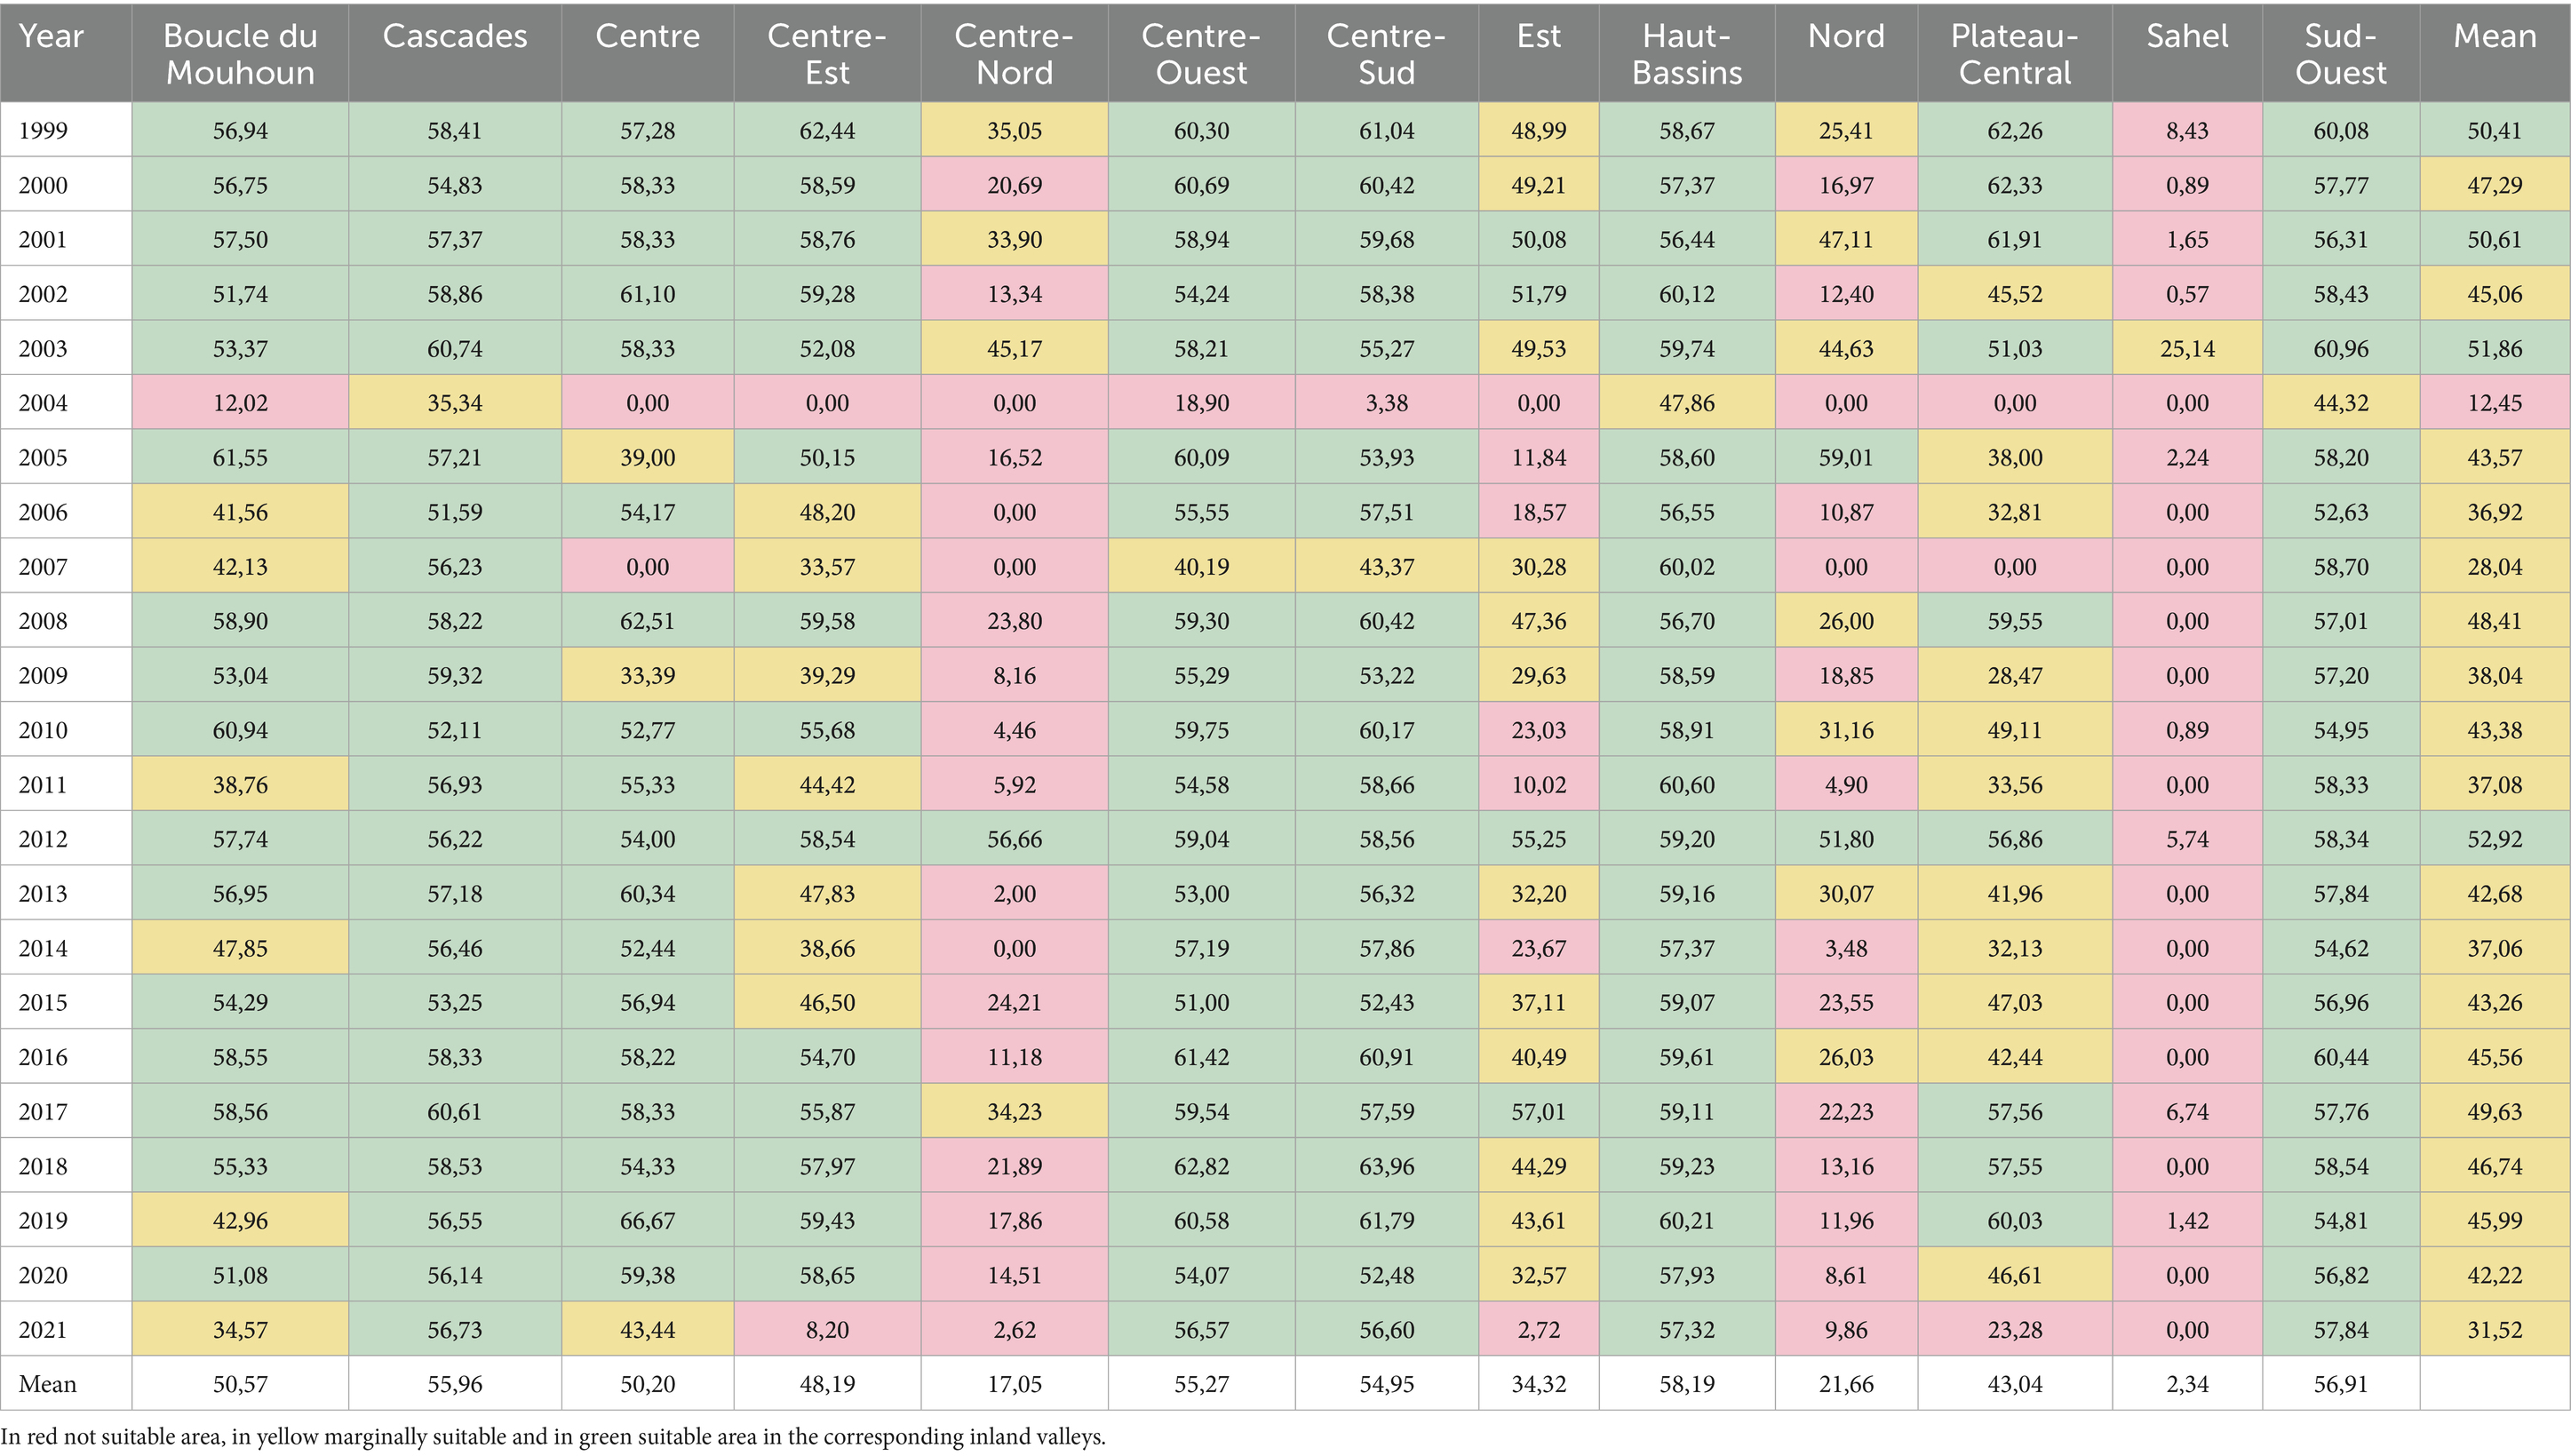
Table 3. Suitability values for each year and each region in Burkina Faso.
Despite of the year-to-year variability in the regions in the middle part of the country, there are no clear changes or trends in rice cropping suitability over analyzed time period. A trend analysis over the whole time period shows no significantly trends over the country (m = −0.05).
4.3 Rice mapping
The map of current rice cropping in Burkina Faso is shown in Figure 8. According to the presented results 1,972 km2 are used for rice cropping. Rice areas are mainly mapped in the Southwestern part where the suitability values are higher than in the rest of the country. This result goes along with the official numbers of the FAO with 2,017 km2 which means 0.74% of the country area is used for rice cropping while this study mapped 0.72% of the country as rice. Jiang et al. (2024) mapped in their African wide mapping 2,054 km2 of rice cultivation which shows a high agreement between the studies. The reference data was split into training (90%) and validation (10%). The accuracies show substantially high values (KP: 0.98, OA: 0.99, PA: 0.99, UA: 0.99). The confusion matrix in Table 4 shows that the performance of the model demonstrates a high accuracy without substantial errors of commission or omission for one of the classes.
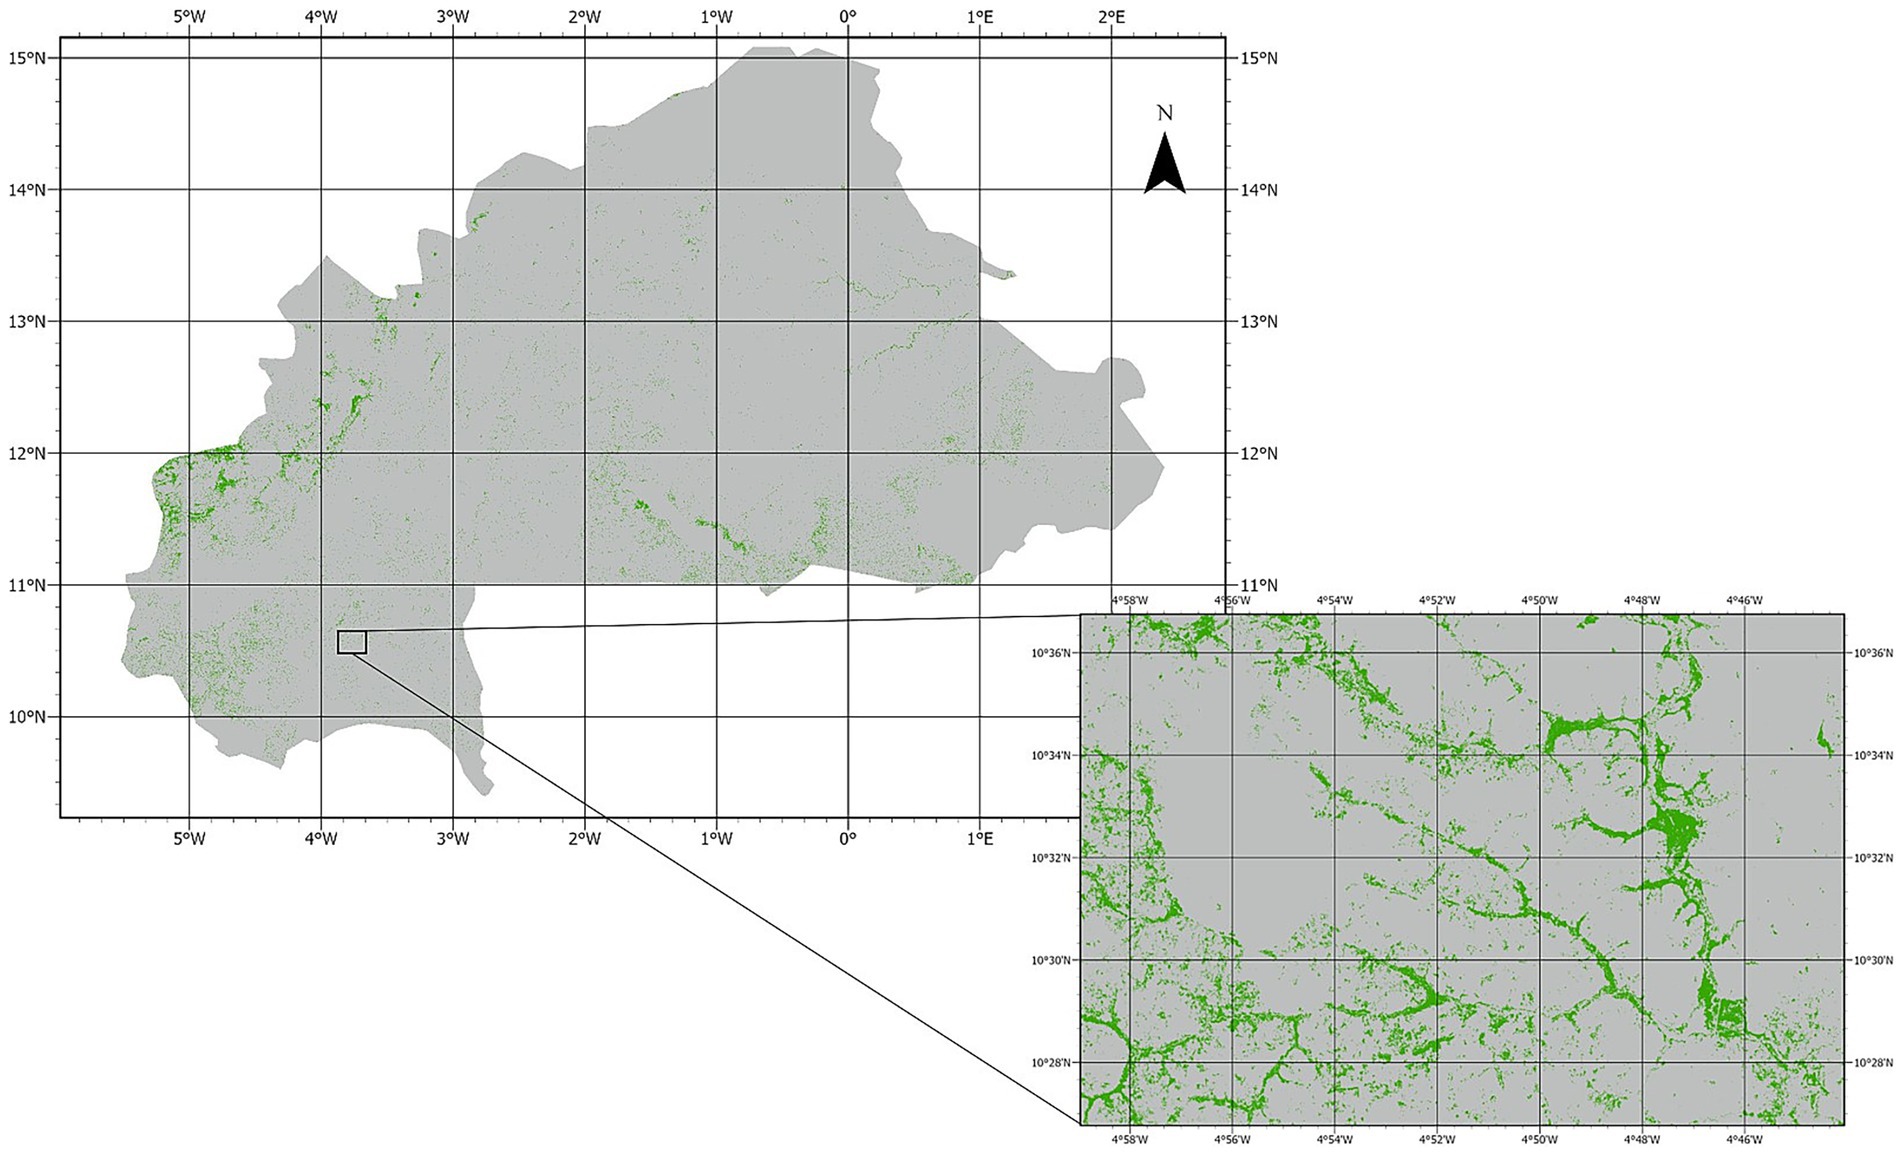
Figure 8. Countrywide rice mapping for the year 2020 with a zoom in the Southwestern region, where most rice area are detected.
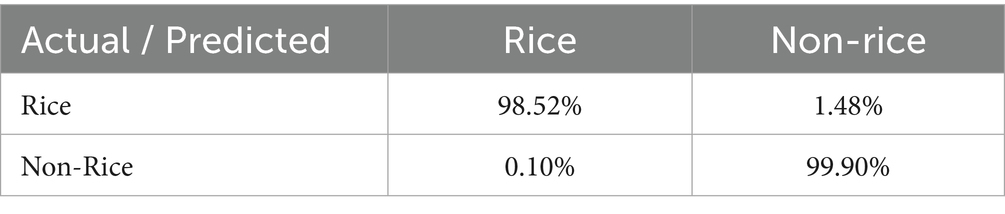
Table 4. Confusion matrix of the random forest classifier using 10% of the reference for validation.
The largest rice cropping areas with 402.71 km2 are found in Haut-Bassin in the Southwest of the country. Haut-Bassin shows also with 58.19 the highest suitability value in Burkina Faso. The second largest area is found in Cascades (333.26 km2) followed by Boucle du Mouhoum (311.04 km2). Both regions show with suitability value > 50 and a low variability good conditions for rice cropping. The region Est with 214.78 km2 is characterized by a low suitability value of 34.32 but the region extends in the Sahel zone as well as in the more humid South of the country and shows therefore a relatively high suitability range.
The next large areas are found in Centre-Ouest (156.32 km2), Centre-Sud (116.72 km2) and Sud-Ouest (96.93 km2). All three regions show a similar suitability of >50 with a relatively low variability in time and are therefore suitable for rice production. The lowest area are found in the arid regions in the North Sahel (85.43 km2), Nord (51.41 km2), Centre-Nord (50.63 km2) and Centre (26.41 km2).
4.4 Intersection of soil and climate suitability and the current used rice area
In a final analysis the developed products are evaluated regarding the gap between the current used and potentially suitable area for rice cropping. Table 2 shows the result of the analysis in this study regarding the already used area for rice cropping, the average suitability value, the coverage of inland valleys, the percentage area of the inland valleys which are already used for rice cropping and the expansion potential for rice cropping in inland valleys for each region. The results show that the total area of 28,744 km2 of potentially suitable inland valleys only 1,972 km2 (approximately 7%) are used for rice cropping depending on the climatic suitability. This information shows the gap between the current used area and the available area, which are potentially suitable for rice cropping. The final conclusion if an inland valley is suitable for rice cropping the climatic suitability has to considered. Figure 9 shows the percentage share of climatic suitability of the inland valleys for the extreme years of 2003 and 2004 and indicate the variability of the climate which should be considered in the planning of rice cropping. The valleys of each region are classified regarding their suitability value (“not suitable,” “marginally suitable,” “suitable,” highly suitable”). The 2 years represents two extremes: while in the year 2003 most of the inland valley are marginally suitable or suitable, the year 2004 shows in most regions no suitability for rice cropping in the inland valleys.
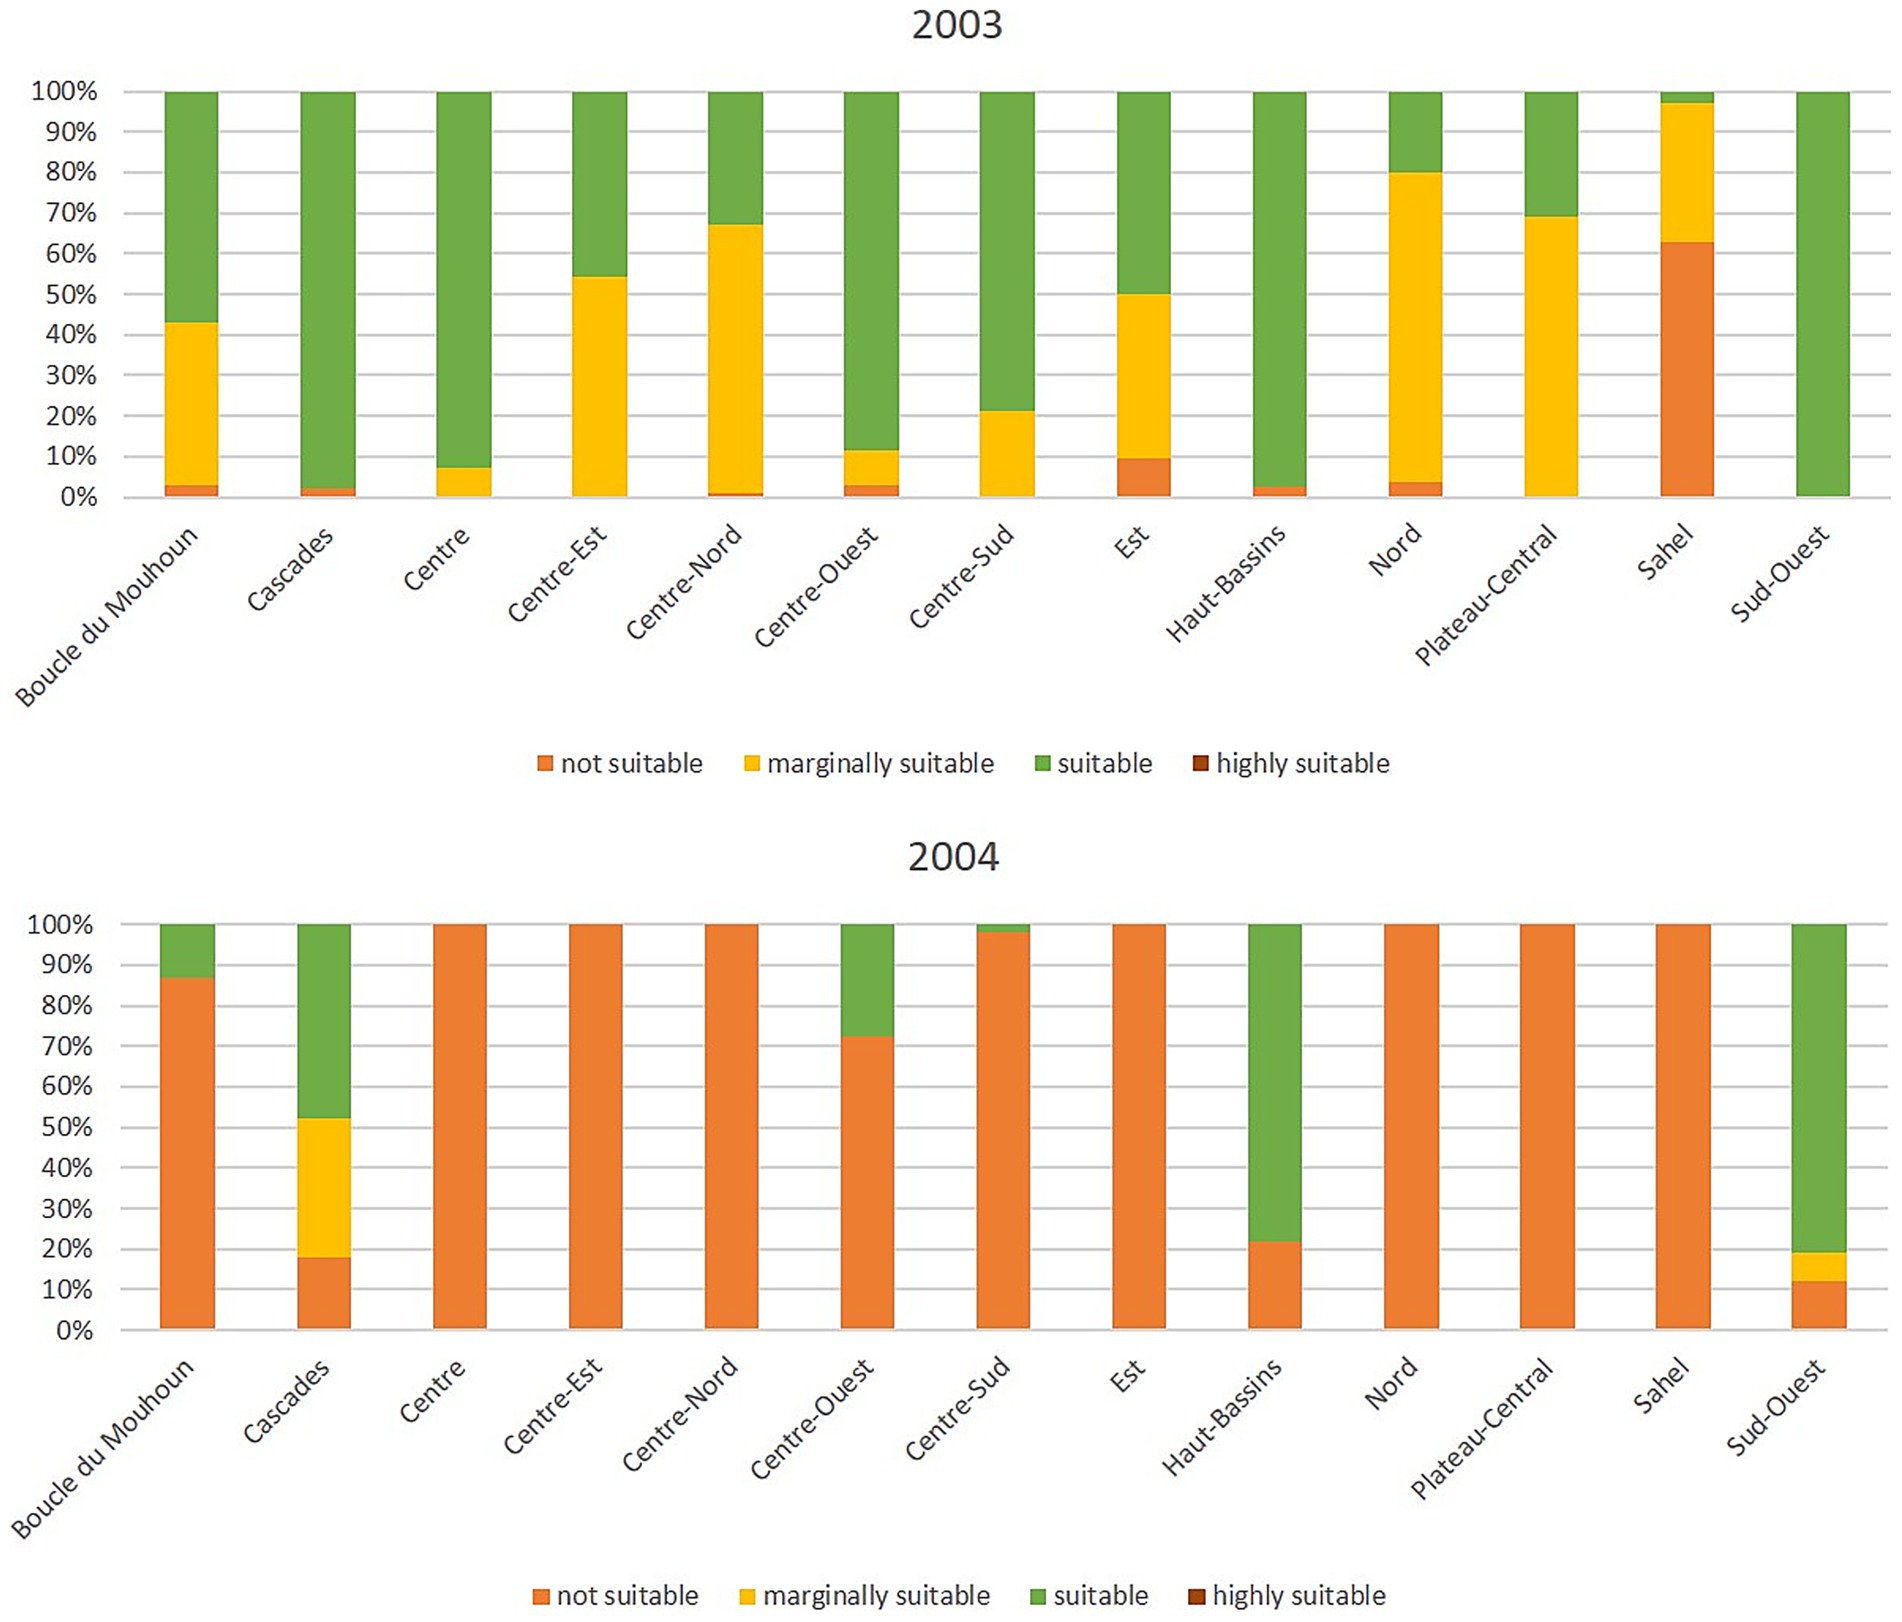
Figure 9. Suitability values for the year 2003 and 2004 in the inland valleys classified to the belonging suitability category.
5 Discussion
The study combines three aspects of rice cropping: the climatic suitability and soil properties in form of the inland valleys, which together indicate the environmental suitability of rice cropping, and the currently used area for rice cropping.
The analysis of the climatic suitability over the whole time period shows a weak negative trend. The climatic suitability seems to be more determined by the yearly variability depending on the climatic zone of the considered region. The standard deviation of the time period shows the area characterized by a high variability where rice cultivation might possible under a higher risk than in the area showing a low standard deviation in the South. The North shows low suitability values for all years and result therefore in a low standard deviation accordingly and are not suitable for rice cropping without any technical support like irrigation techniques. The high interannual variability shows the great importance of considering a yearly suitability to assess the vulnerability of the rice cropping systems. This confirms several previous studies which further emphasize the importance of considering climatic variability during the year and not rely on yearly precipitation values. The intra-seasonal distribution and variability of rainfall during the growing season are more critical for successful crop establishment and yield (Sultan et al., 2013; Traore et al., 2013; Traoré et al., 2011). This is clearly shown in the study since during the analyzed time period, some of the years deviated significantly from the long-term mean and appeared as more suitable or less suitable. The years 2003 and 2004 represents two extreme years in the time period: 2003 as a year with higher precipitation rates especially from May until September which results in high suitability values up to the dry North and 2004 as an example of a country wide very low suitability until to the South. This is also shown in the low yields in the year 2004 with 1.5 t/ha, the lowest production in the last 37 years, while the average yield in the analyzed time period are with 2.13 t/ha significantly higher than in the year 2004 (FAO, 2023b). This clearly shows the negative impact of the climate on the rice production in the year 2004 and is also reflected in the climatic suitability. The year 2004 is not known as a year for low annual precipitation values, but the monthly precipitation values show negative anomalies compared to the long-term mean. Negative anomalies during the vegetation period affect the suitability and lower the production. This clearly highlights the importance of assessing cropping potential based on precipitation variability during the growing season, rather than relying solely on annual precipitation totals. Precipitation and temperature are influencing the crop growth potential on the one side, on the other side soil properties are important as well. Through the specific nature of the inland valleys water is discharged in the valleys and can through manmade technical preparation distributed and stored. Soils have a higher water capacity, can store water and serve as a retention basin to bridge dry spells during the rainy season. This is not included in the climatic suitability and has to be considered in the interpretation of the suitability data. The mapped inland valleys in this study are distributed very regular what corresponds to the expectations and is found in similar studies in neighboring countries like Benin or Togo (Akpoti et al., 2022).
The results of the rice mapping confirm the expectation that rice cropping exists mainly in the Southwestern regions where the climatic conditions allow rice cropping. Due to the fact, that the inland valleys are distributed regularly over the country also in the dry North the potential purely soil-related suitability is in each region approx. 10%. The climatic conditions exclude the possibility of rice cropping in the Northern regions but nevertheless some smaller areas are detected by the mapping approach. This might contradict the climatic suitability but disregard the fact that through irrigation or preparation and cultivation of the soil rice cropping might be possible even though climatic limitation exists. Nevertheless, also misclassification of EO-data might affect the results. The inland valleys can work as drainage axis and precipitation water discharge through and in the inland valleys where seasonal wetlands might occur. Overall, the size of the area cropped with rice agree with the area reported by FAO and with an African wide study of Jiang et al. (2024). Despite the inherent challenges of validation in data-scarce regions like Burkina Faso due to limited high-quality reference data, the comparison with national statistics and recent studies supports the reliability of our results. The high accuracy metrics obtained in this study show that rice areas are extremely well distinguishable from other land use/cover in Burkina Faso. This can be explained by the clear differences between rice and non-rice areas regarding their spectral characteristics and seasonal development in terms of greenness, canopy structure and moisture. The presented results show that these specific characteristics of rice areas can be extremely well captured by the used multitemporal optical and radar satellite features and the random forest algorithm. Compared with the theoretical potential of 10% only 0.71% of the country area is already cropped with rice. That means there are high potential to increase the rice area but the climatic suitability must be considered. Especially the area characterized by a high variability in the center of the country are highly vulnerable against dry spells during the vegetation season or late onset of the rainy season and can lead to yield losses. The major innovation lies in the integration of EO data to assess the gap between the already used area for rice cropping and the potentially suitable area. With this information the expansions potential can be determined and spatially located. The presented study shows the potential of combining climate data and Earth Observation data to assess the potential of suitable rice cropping area. Nevertheless, the results of the study must also be discussed regarding their limitations. First, the spatial resolution of the analyzed data set differs largely. The ERA5-Land data with a spatial resolution of 0.25 degree are much coarser then the SRTM (30 m) or Sentinel-1 and Sentinel-2 data (10 m). However, due to the low topographic dynamic in Burkina Faso the relatively coarse climate data of ERA5-Land can be used without getting to imprecise but the coarse resolution and its known biases—especially in regions with sparse in-situ observations—can affect the precision of local-scale suitability assessments. The known biases of ERA5-Land are clearly reflected in different studies (Gbode et al., 2023; Steinkopf and Engelbrecht, 2022; Tan et al., 2023). These limitations need to be considered when interpreting the results. The choice of ERA5-Land was guided by its consistent and homogeneous long-term reanalysis record.
Second, the description of the crop requirement for the rice suitability is parametrized on upland rice. There may be other varieties that are better adapted to a dry climate and are characterized by high drought resistance. Third, the study is analyzing the past 23 years and is not describing future trends. Climate change certainly impacts the future rice suitability depending on the considered climate scenario, but we have refrained from depicting future climate scenarios in this study. The main reasons for this are the high uncertainty of climate data. Improved and downscaled data of climate models should be considered in future studies. Besides the limitations, the study can give a valuable information to increase rice production and to decrease yield losses due to smart decisions on the cropping location. The increase of rice production plays not only a central role in achieving food security it is also a political demand to decrease the dependency from rice import and therefore from the world market. Therefore, political decision makers like ministries or local authorities and involved stakeholders need to analyze the results carefully regarding the suitability of the individual inland valleys and other parameters must be considered, such as the depth of the valley or the location in the landscape. Further NGO’s and development agencies can use the identified high-potential but uncultivated inland valleys to design interventions such as farmer field schools, seed distribution and sustainable water management strategies. Farmer cooperatives and extension services can use the regional level data to advise members on where expansion of rice cropping or the transformation of agriculture land is most viable and resilient to climate variability.
While this study focused on biophysical and climatic factors to map the potential and current extent of rice cultivation in Burkina Faso, it did not incorporate socio-economic or infrastructural variables such as access to markets, roads, labor availability, land tenure, or irrigation infrastructure. These factors play a crucial role in determining whether an area, even if agriculture-climatically suitable, is actually used or viable for rice production. Their absence may lead to an overestimation of the truly exploitable rice area. For instance, limited road access or insecure land rights can significantly restrict agricultural expansion despite favorable biophysical conditions. Future research should aim to integrate these dimensions using spatial socio-economic datasets, participatory mapping, or scenario-based modeling to produce more realistic and policy-relevant suitability assessments. This would provide decision-makers with a more comprehensive understanding of both the physical potential and practical feasibility for sustainable rice intensification.
6 Conclusion
Overall, it can be concluded that the combination of EO data and climate data can estimate the gap between the already used and the potential rice cropping area. The study analyzed the climate suitability of the inland valleys, where the potential of rice cropping is high. The current used area for rice cropping as well as the unused suitable area are following the climatic constraints. Suitable area for rice cropping dominates in the Southwestern part while the Northern part of Burkina Faso is not suitable for rice cropping. At a higher resolution the data about the inland valley and the used rice cropping area can assist decision makers and stakeholders to identify suitable regions to increase rice production. Besides the natural conditions it also needs a certain socio-economic environment to implement rice cropping successfully. The transformation of a natural inland valley to an inland valley ready for cultivation needs soil preparation and excavation, for which farmers might need financial support. Regions where rice is already grown are also suited better, as a certain infrastructure, such as roads, access to markets and labor, already exists. Besides the infrastructure farmers must receive targeted training from extension officers to reach a successful transition. The next step should be to consider more varieties especially drought adapted rice varieties in the suitability. Therefore, more information about specific crop requirements and a better description of them are needed. The inland valleys should be further analyzed to assess their depth, ensuring that only those suitable for cultivation are considered. Additionally, an evaluation of currently cultivated inland valleys should be conducted to determine their crop types, facilitating a potential transition to rice cultivation where appropriate. Expanding rice cropping areas should be accompanied by the transformation of existing agricultural lands outside of inland valleys, particularly those with low productivity and high vulnerability to drought. This also preserves the principles of sustainable intensification of agriculture.
Data availability statement
The raw data supporting the conclusions of this article will be made available by the authors, without undue reservation.
Author contributions
JM: Conceptualization, Data curation, Formal analysis, Investigation, Methodology, Project administration, Resources, Software, Validation, Visualization, Writing – original draft, Writing – review & editing. AH: Conceptualization, Data curation, Formal analysis, Investigation, Methodology, Software, Writing – review & editing. KA: Conceptualization, Data curation, Formal analysis, Investigation, Methodology, Software, Writing – review & editing. KH: Conceptualization, Formal analysis, Methodology, Writing – review & editing. UG: Conceptualization, Formal analysis, Funding acquisition, Investigation, Methodology, Resources, Supervision, Writing – original draft, Writing – review & editing.
Funding
The author(s) declare that financial support was received for the research and/or publication of this article. This publication was supported by the BMFTR projects AgRAIN (FKZ 01LZ1904A), COINS (FKZ 01LL2204A) and the open access publication fund of the German Aerospace Center (DLR).
Acknowledgments
The authors would like to thank all involved institutions especially the Dreyer Foundation in Dano, Burkina Faso, for their valuable support in collecting reference data of rice fields.
Conflict of interest
The authors declare that the research was conducted in the absence of any commercial or financial relationships that could be construed as a potential conflict of interest.
Generative AI statement
The author(s) declare that no Gen AI was used in the creation of this manuscript.
Any alternative text (alt text) provided alongside figures in this article has been generated by Frontiers with the support of artificial intelligence and reasonable efforts have been made to ensure accuracy, including review by the authors wherever possible. If you identify any issues, please contact us.
Publisher’s note
All claims expressed in this article are solely those of the authors and do not necessarily represent those of their affiliated organizations, or those of the publisher, the editors and the reviewers. Any product that may be evaluated in this article, or claim that may be made by its manufacturer, is not guaranteed or endorsed by the publisher.
Supplementary material
The Supplementary material for this article can be found online at: https://www.frontiersin.org/articles/10.3389/fclim.2025.1548416/full#supplementary-material
References
Abah, R. C., and Petja, B. M. (2016). Crop suitability mapping for rice, cassava, and yam in north Central Nigeria. J. Agric. Sci. 9:96. doi: 10.5539/jas.v9n1p96
Africa, F. (2023). Burkina Faso forced to depend on imports as rice demand outstrips production. Available online at: https://www.millingmea.com/burkina-faso-forced-to-depend-on-imports-as-rice-demand-outstrips-production/ (Accessed September 16, 2025).
Akpoti, K., Dossou-Yovo, E. R., Zwart, S. J., and Kiepe, P. (2021). The potential for expansion of irrigated rice under alternate wetting and drying in Burkina Faso. Agric. Water Manag. 247. doi: 10.1016/j.agwat.2021.106758
Akpoti, K., Groen, T., Dossou-Yovo, E., Kabo-bah, A. T., and Zwart, S. J. (2022). Climate change-induced reduction in agricultural land suitability of West-Africa's inland valley landscapes. Agric. Syst. 200:103429. doi: 10.1016/j.agsy.2022.103429
Akpoti, K., Kabo-bah, A. T., Dossou-Yovo, E. R., Groen, T. A., and Zwart, S. J. (2020). Mapping suitability for rice production in inland valley landscapes in Benin and Togo using environmental niche modeling. Sci. Total Environ. 709:136165. doi: 10.1016/j.scitotenv.2019.136165
Aslam, R. W., Naz, I., Shu, H., Yan, J., Quddoos, A., Tariq, A., et al. (2024a). Multi-temporal image analysis of wetland dynamics using machine learning algorithms. J. Environ. Manag. 371:123123. doi: 10.1016/j.jenvman.2024.123123
Aslam, R. W., Shu, H., Javid, K., Pervaiz, S., Mustafa, F., Raza, D., et al. (2024b). Wetland identification through remote sensing: insights into wetness, greenness, turbidity, temperature, and changing landscapes. Big Data Res. 35:100416. doi: 10.1016/j.bdr.2023.100416
Assolce, S. (2023). Burkina Faso approves a $36 mln plan to boost agricultural production in the 2023/2024 season Ecofin Agency. Available online at: https://www.ecofinagency.com/public-management/0106-44588-burkina-faso-approves-a-36-mln-plan-to-boost-agricultural-production-in-the-2023/2024-season (Accessed September 16, 2025).
Ayantunde, A. A., Amole, T., and Duncan, A. J. (2023). Livestock feed markets across agro-ecological zones of Burkina Faso: feed provenance, price and quality. Front. Anim. Sci. 4. doi: 10.3389/fanim.2023.1122416
Ayoade, M. A. (2017). Suitability assessment and mapping of Oyo state, Nigeria, for rice cultivation using GIS. Theor. Appl. Climatol. 129, 1341–1354. doi: 10.1007/s00704-016-1852-4
Barry, A., Hurley, J., and Martin, L. (2019). Burkina Faso Country Strategic Opportunities Programme 2019–2024. Available online at: https://webapps.ifad.org/members/eb/126/docs/EB-2019-126-R-17.pdf (Accessed September 16, 2025).
Belgiu, M., and Drăguţ, L. (2016). Random forest in remote sensing: a review of applications and future directions. ISPRS J. Photogramm. Remote Sens. 114, 24–31. doi: 10.1016/j.isprsjprs.2016.01.011
Beven, K. J., and Kirkby, M. J. (1979). A physically based, variable contributing area model of basin hydrology / un modèle à base physique de zone d'appel variable de l'hydrologie du bassin versant. Hydrol. Sci. Bull. 24, 43–69.
Burrough, P. A. (1989). Fuzzy mathematical methods for soil survey and land evaluation. J. Soil Sci. 40, 477–492.
Cardille, J. A., Crowley, M. A., Saah, D., and Clinton, N. E. (2024). Cloud-based remote sensing with Google earth engine.
Carla, R., Keith, I., and Paul, K. (2001). The costs and risks of coping with drought: livelihood impacts and farmers1 responses in Burkina Faso. Clim. Res. 19, 119–132. doi: 10.3354/cr019119
Chemura, A., Gleixner, S., and Gornott, C. (2024). Dataset of the suitability of major food crops in Africa under climate change. Sci Data 11:294. doi: 10.1038/s41597-024-03118-1
Chemura, A., Schauberger, B., and Gornott, C. (2020). Impacts of climate change on agro-climatic suitability of major food crops in Ghana. PLoS One 15:e0229881. doi: 10.1371/journal.pone.0229881
Congalton, R. G., and Green, K. (2019). Assessing the accuracy of remotely sensed data: Principles and practices. Boca Raton: CRC Press.
Copernicus Climate Change Service. (2017). ERA5: fifth generation of ECMWF atmospheric reanalyses of the global climate. Copernicus Climate Change Service Climate Data Store (CDS). Available online at: https://cds.climate.copernicus.eu/cdsapp#!/home (Accessed 12 December, 2024).
Diallo, M. D., Wood, S. A., Diallo, A., Mahatma-Saleh, M., Ndiaye, O., Tine, A. K., et al. (2016). Soil suitability for the production of rice, groundnut, and cassava in the peri-urban Niayes zone, Senegal. Soil Tillage Res. 155, 412–420. doi: 10.1016/j.still.2015.09.009
Djagba, J. F., Sintondji, L. O., Kouyaté, A. M., Baggie, I., Agbahungba, G., Hamadoun, A., et al. (2018). Predictors determining the potential of inland valleys for rice production development in West Africa. Appl. Geogr. 96, 86–97. doi: 10.1016/j.apgeog.2018.05.003
Dossou-Yovo, E. R., Baggie, I., Djagba, J. F., and Zwart, S. J. (2017). Diversity of inland valleys and opportunities for agricultural development in Sierra Leone. PLoS One 12:e0180059. doi: 10.1371/journal.pone.0180059
Egbebiyi, T. S., Lennard, C., Crespo, O., Mukwenha, P., Lawal, S., and Quagraine, K. (2019). Assessing future Spatio-temporal changes in crop suitability and planting season over West Africa: using the concept of crop-climate departure. Climate 7, 1–30. doi: 10.3390/cli7090102
El-Namaky, R., Bare Coulibaly, M. M., Alhassan, M., Traore, K., Nwilene, F., Dieng, I., et al. (2017). Putting plant genetic diversity and variability at work for breeding: hybrid rice suitability in West Africa. Diversity 9, 1–12. doi: 10.3390/d9030027
ESA (2020a). Copernicus Sentinel-1 SAR GRD data, processed by ESA. Accessed via Google Earth Engine.
ESA (2020b). Copernicus Sentinel-2 MSI Level-2A data, processed by ESA. Accessed via Google Earth Engine.
FAO. (2023a). FAO emergencies and resilience, Burkina Faso. Available online at: https://www.fao.org/emergencies/where-we-work/BFA/ (Accessed September 16, 2025).
FAO (2023b). FAOSTAT - Crops and livestock products. Available online at: https://www.fao.org/faostat/en/#data/QCL (Accessed September 16, 2025).
FAO, E., AUC (2021). Africa – Regional Overview of Food Security and Nutrition 2021: Statistics and trends.
Fiorillo, E., Di Giuseppe, E., Fontanelli, G., and Maselli, F. (2020). Lowland rice mapping in Sédhiou region (Senegal) using sentinel 1 and sentinel 2 data and random forest. Remote Sens 12, 1–23. doi: 10.3390/rs12203403
Gallant, J. C., and Dowling, T. I. (2003). A multiresolution index of valley bottom flatness for mapping depositional areas. Water Resour. Res. 39, 1–14. doi: 10.1029/2002WR001426
García-Amorena, I., Moreno-Amat, E., Aulló-Maestro, M. E., Mateo-Sánchez, M. C., Merino-De-Miguel, S., Ribalaygua, J., et al. (2021). Combining remote sensing and species distribution modelling to assess Pinus hartwegii response to climate change and land use from Izta-Popo National Park, Mexico. Land 10, 1–20. doi: 10.3390/land10101037
Gbode, I. E., Ajayi, V. O., Coulibaly, A., Abel, D., Ziegler, K., Weber, T., et al. (2025). Analysis of crop suitability index for current and future climates using statistically downscaled CMIP6 outputs over Africa. Meteorol. Appl. 32:e70022. doi: 10.1002/met.70022
Gbode, I. E., Babalola, T. E., Diro, G. T., and Intsiful, J. D. (2023). Assessment of ERA5 and ERA-interim in reproducing mean and extreme climates over West Africa. Adv. Atmos. Sci. 40, 570–586. doi: 10.1007/s00376-022-2161-8
Gérardeaux, E., Falconnier, G., Gozé, E., Defrance, D., Kouakou, P.-M., Loison, R., et al. (2021). Adapting rainfed rice to climate change: a case study in Senegal. Agron. Sustain. Dev. 41, 1–16. doi: 10.1007/s13593-021-00710-2
Hersbach, H., Bell, B., Berrisford, P., and Hirahara, S. (2017). Complete ERA5 from 1940: Fifth generation of ECMWF atmospheric reanalyses of the global climate. Copernicus Climate Change Service (C3S) Data Store (CDS). doi: 10.24381/cds.143582cf
Huffman, G. J., Stocker, E. F., Bolvin, D. T., Nelkin, E. J., and Tan, J. (2019) GPM IMERG Final Precipitation L3 1 day 0.1 degree x 0.1 degree V06 Goddard Earth Sciences Data and Information Services Center (GES DISC). Greenbelt.
Issiné, A., Justin, K.-m. Y. K., and Gomoung, D. (2024). Physicochemical characteristics and soil suitability for semi-irrigated rice cultivation in the Tandjile Province of Chad. Int. J. Appl. Sci. Biotechnol. 12, 180–186. doi: 10.3126/ijasbt.v12i4.72907
Jiang, X., Fang, S., Huang, X., Liu, Y., and Guo, L. (2021). Rice mapping and growth monitoring based on time series GF-6 images and red-edge bands. Remote Sens 13, 1–25. doi: 10.3390/rs13040579
Jiang, J., Zhang, H., Ge, J., Zuo, L., Xu, L., Song, M., et al. (2024). 20 m Africa Rice distribution map of 2023. Earth Syst. Sci. Data Discuss. 2024, 1–34. doi: 10.5194/essd-2024-402
Kuenzer, C., and Knauer, K. (2013). Remote sensing of rice crop areas. Int. J. Remote Sens. 34, 2101–2139. doi: 10.1080/01431161.2012.738946
NASA JPL (2013) NASA Shuttle Radar Topography Mission Global 1 arc second [Data set]. NASA Land Processes Distributed Active Archive Center. doi: 10.5067/MEASURES/SRTM/SRTMGL1.003
Nations, U. (2021). Towards a new trade agenda for the right to food. Available online at: https://unctad.org/system/files/official-document/presspb2021d1_en.pdf (Accessed September 16, 2025).
Nations, U. (2023). Western Africa: Total Population. Available online at: https://population.un.org/wpp/Graphs/Probabilistic/POP/TOT/914 (Accessed December 12, 2024).
Ogban, P. I., and Babalola, O. (2009). Characteristics, classification and management of inland valley bottom soils for crop production in subhumid southwestern Nigeria. Agro-Sci. 8, 1–13. doi: 10.4314/as.v8i1.44107
Pal, M. (2005). Random forest classifier for remote sensing classification. Int. J. Remote Sens. 26, 217–222. doi: 10.1080/01431160412331269698
Pardoe, J., Kloos, J., and Assogba, N. P. (2016). “Seasonal variability: impacts, adaptations and the sustainability challenge” in Adaptation to climate change and variability in rural West Africa. eds. J. A. Yaro and J. Hesselberg (Springer, Cham: Springer International Publishing), 41–57.
Rasheed, Z., Aravamudan, A., Zhang, X., Anagnostopoulos, G. C., and Nikolopoulos, E. I. (2024). Combining global precipitation data and machine learning to predict flood peaks in ungauged areas with similar climate. Adv. Water Resour. 192:104781. doi: 10.1016/j.advwatres.2024.104781
Reed, C., Anderson, W., Kruczkiewicz, A., Nakamura, J., Gallo, D., Seager, R., et al. (2022). The impact of flooding on food security across Africa. Proc. Natl. Acad. Sci. USA 119:e2119399119. doi: 10.1073/pnas.2119399119
Rodenburg, J. (2013). “Inland valleys: Africa's future food baskets” in Realizing Africa's rice promise. eds. M. C. S. Wopereis, D. E. Johnson, N. Ahmadi, E. Tollens, and A. Jallo. Africa Rice Center Dar es Salaam. (Access September 16, 2025).
Rodenburg, J., Zwart, S. J., Kiepe, P., Narteh, L. T., Dogbe, W., and Wopereis, M. C. S. (2014). Sustainable rice production in African inland valleys: seizing regional potentials through local approaches. Agric. Syst. 123, 1–11. doi: 10.1016/j.agsy.2013.09.004
Salack, S., Klein, C., Giannini, A., Sarr, B., Worou, O. N., Belko, N., et al. (2016). Global warming induced hybrid rainy seasons in the Sahel. Environ. Res. Lett. 11, 2–11. doi: 10.1088/1748-9326/11/10/104008
Salifu, E., Agyei Agyare, W., and Abdul-ganiyu, S. (2022). Evaluation of land suitability for crop production in northern Ghana using GIS and AHP based techniques. Int. J. Environ. Geoinformatics 9, 46–56. doi: 10.30897/ijegeo.1022275
Sanogo, S., Fink, A. H., Omotosho, J. A., Ba, A., Redl, R., and Ermert, V. (2015). Spatio-temporal characteristics of the recent rainfall recovery in West Africa. Int. J. Climatol. 35, 4589–4605. doi: 10.1002/joc.4309
Sørensen, R., Zinko, U., and Seibert, J. (2006). On the calculation of the topographic wetness index: evaluation of different methods based on field observations. Hydrol. Earth Syst. Sci. 10, 101–112. doi: 10.5194/hess-10-101-2006
Steinkopf, J., and Engelbrecht, F. (2022). Verification of ERA5 and ERA-interim precipitation over Africa at intra-annual and interannual timescales. Atmos. Res. 280:106427. doi: 10.1016/j.atmosres.2022.106427
Sultan, B., Roudier, P., Quirion, P., Alhassane, A., Muller, B., Dingkuhn, M., et al. (2013). Assessing climate change impacts on sorghum and millet yields in the Sudanian and Sahelian savannas of West Africa. Environ. Res. Lett. 8, 1–9. doi: 10.1088/1748-9326/8/1/014040
Sys, C. O., van Ranst, E., Debaveye, J., and Beernaert, F. (1993). Land Evalutation: Part III Crop Requirements. Brussels: Agricultural Publications, General Administration for Development Cooperation.
Tan, M. L., Armanuos, A. M., Ahmadianfar, I., Demir, V., Heddam, S., Al-Areeq, A. M., et al. (2023). Evaluation of NASA POWER and ERA5-land for estimating tropical precipitation and temperature extremes. J. Hydrol. 624:129940. doi: 10.1016/j.jhydrol.2023.129940
Tano, A. R., Bouo, F.-X. D. B., Kouamé, J. K., Tchétché, Y., Zézé, S. D., and Ouattara, B. (2023). Rainfall variability and trends in West Africa. Atmospheric Climate Sci 13, 72–83. doi: 10.4236/acs.2023.131006
Tomalka, J., Lange, S., Röhring, F., and Gornott, C. (2021). Climate Risk Profile: Burkina Faso. Potsdam: Potsdam Institute for Climate Impact Research (PIK).
Traoré, S. B., Alhassane, A., Muller, B., Kouressy, M., Somé, L., Sultan, B., et al. (2011). Characterizing and modeling the diversity of cropping situations under climatic constraints in West Africa. Atmos. Sci. Lett. 12, 89–95. doi: 10.1002/asl.295
Traore, B., Corbeels, M., van Wijk, M. T., Rufino, M. C., and Giller, K. E. (2013). Effects of climate variability and climate change on crop production in southern Mali. Eur. J. Agron. 49, 115–125. doi: 10.1016/j.eja.2013.04.004
Ujoh, F., Tertsea, I., and Ogidi Paul, M. (2019). Suitability mapping for rice cultivation in Benue state, Nigeria using satellite data. Geo-spat. Inf. Sci. 22, 332–344. doi: 10.1080/10095020.2019.1637075
UNEP-WCMC (2024). Protected Area Profile for Burkina Faso from the World Database on Protected Areas. Available online at: www.protectedplanet.net (Accessed September 16, 2025).
Vila-Viçosa, C., Arenas-Castro, S., Marcos, B., Honrado, J., García, C., Vázquez, F. M., et al. (2020). Combining satellite remote sensing and climate data in species distribution models to improve the conservation of Iberian white oaks (Quercus L.). ISPRS Int. J. Geo Inf. 9, 1–25. doi: 10.3390/ijgi9120735
Windmeijer, P. N., and Andriesse, W. (1993). Inland valleys in West Africa: An Agro-ecological characterization of Rice-growing environments, vol. 52: International Institute for Land Reclamation and Improvement.
World Bank. (2023). Agriculture, forestry, and fishing, value added (% of GDP) - Burkina Faso. Available online at: https://data.worldbank.org/indicator/NV.AGR.TOTL.ZS?end=2022&locations=BF&start=1960&view=chart (Accessed September 16, 2025).
Yangouliba, G. I., Kwawuvi, D., and Almoradie, A. (2020). Suitable land assessment for rice crop in Burkina Faso using GIS, remote sensing and multi criteria analysis. J. Geogr. Inf. Syst. 12, 683–696. doi: 10.4236/jgis.2020.126039
Zabel, F., Knüttel, M., and Poschlod, B. (2025). CropSuite v1.0 – a comprehensive open-source crop suitability model considering climate variability for climate impact assessment. Geosci. Model Dev. 18, 1067–1087. doi: 10.5194/gmd-18-1067-2025
Zabel, F., Putzenlechner, B., and Mauser, W. (2014). Global agricultural land resources – a high resolution suitability evaluation and its perspectives until 2100 under climate change conditions. PLoS One 9:e107522. doi: 10.1371/journal.pone.0107522
Zanaga, D., Van De Kerchove, R., De Keersmaecker, W., Souverijns, N., and Arino, O. (2021). ESA WorldCover 10 m 2020 v100. doi: 10.5281/zenodo.5571936
Keywords: agriculture, drought, climate change adaptation, rice, rice mapping, agricultural suitability, remote sensing
Citation: Meier J, Hirner A, Akpoti K, Hackman K and Gessner U (2025) Identifying potential for rice expansion in Burkina Faso: integrating EO and climate data for suitability mapping. Front. Clim. 7:1548416. doi: 10.3389/fclim.2025.1548416
Edited by:
Axel Bronstert, University of Potsdam, GermanyReviewed by:
Jan Bliefernicht, University of Augsburg, GermanyAndreas H. Fink, Karlsruhe Institute of Technology (KIT), Germany
Copyright © 2025 Meier, Hirner, Akpoti, Hackman and Gessner. This is an open-access article distributed under the terms of the Creative Commons Attribution License (CC BY). The use, distribution or reproduction in other forums is permitted, provided the original author(s) and the copyright owner(s) are credited and that the original publication in this journal is cited, in accordance with accepted academic practice. No use, distribution or reproduction is permitted which does not comply with these terms.
*Correspondence: Jonas Meier, am9uYXMubWVpZXJAZGxyLmRl