 Amos T. Kabo-Bah1,2,3
 Nana Asirifi Cobbina1,2*
 Ebenezer K. Siabi1,4
 Sarah Elikplim Siabi1,2
 Wisdom Bruce Ahiada1,2
- 1Department of Civil and Environmental Engineering, University of Energy and Natural Resources, Sunyani, Ghana
- 2Regional Center for Energy and Environmental Sustainability, University of Energy and Natural Resources, Sunyani, Ghana
- 3International Relations Office, University of Energy and Natural Resources, Sunyani, Ghana
- 4Earth Observation Research and Innovation Center (EORIC), University of Energy and Natural Resources, Sunyani, Ghana
Introduction: Flooding in Ghana’s White Volta Basin poses significant environmental and socioeconomic challenges, driven by both natural and anthropogenic factors. This study assesses future flood vulnerabilities under climate change scenarios to inform disaster risk reduction and sustainable land-use planning.
Methods: Precipitation data from 15 Global Climate Models (GCMs) under Shared Socioeconomic Pathways (SSP1-2.6, SSP2-4.5, SSP3-7.0, and SSP5-8.5) were bias-corrected using CMhyd software, validated against observational data (1960–2015) and ERA5 reanalysis (1981–2020). Flood susceptibility maps were generated via the Analytical Hierarchy Process (AHP), integrating ten geospatial parameters (elevation, slope, drainage density, soil type, etc.). Model performance was evaluated using R² (90–100%), NSE (0.384–1), RMSE (789–10,967 mm), and PBIAS (−7.2% to 26%).
Results: Projections indicate a decline in precipitation across all SSPs, with the sharpest reduction under SSP5-8.5. Tamale is expected to receive the highest rainfall, while Garu experiences the lowest. Flood susceptibility mapping classified the basin into five risk zones: very high (12.09%), high (22.56%), moderate (24.38%), low (24.36%), and very low (16.64%). Future scenarios show significant reductions in high-risk areas, particularly under SSP5-8.5 (−12.21% very high, −3.12% high). Model validation achieved an AUC of 0.795, confirming robust predictive accuracy.
Discussion: The findings highlight the critical impact of declining precipitation on flood susceptibility, emphasizing the need for adaptive strategies in water resource management and infrastructure planning. The integration of AHP-GIS provides a scalable framework for flood risk assessment, aligning with Ghana’s National Climate Change Adaptation Strategy and the Sendai Framework.
1 Introduction
Flooding is one of the most pervasive natural disasters worldwide, causing substantial loss of life, property, and livelihoods. Between 2000 and 2018, floods inundated approximately 2.23 million square kilometres globally, directly impacting 255 to 290 million people (Tellman et al., 2021). The socio-economic consequences are profound, with affected regions often experiencing disruptions to agriculture, damage to infrastructure, and displacement of vulnerable populations. In Africa, the challenges posed by flooding are particularly acute. The continent ranks second after Asia in terms of flood-related fatalities and damages, with Sub-Saharan Africa identified as a hotspot of vulnerability due to its limited adaptive capacity and reliance on climate-sensitive livelihoods (Hu et al., 2018). Ghana, like many countries in Sub-Saharan Africa, has been grappling with the increasing frequency and intensity of floods. These events are driven by natural factors such as erratic rainfall patterns and human activities including deforestation, urbanization, and poor land-use practices (Mensah and Ahadzie, 2020; Abass, 2022). The White Volta Basin, a critical watershed in northern Ghana, is one of the most flood-prone areas in the country. Spanning approximately 49,663.7 km2 across five administrative regions, the basin plays a vital role in agriculture, water resources, and local economies (Klutse, 2022; WRC, 2021). However, recurrent flooding, particularly during the rainy season and following the release of water from the Bagre Dam in Burkina Faso, has led to widespread damage to livelihoods and infrastructure (Atanga and Tankpa, 2021). Recent flood events, such as the 2007 disaster that displaced ovewr 275,000 people, and the 2023 Akosombo Dam spill, which affected over 35,000 individuals, underscore the urgent need for proactive flood risk management (United Nations Office for the Coordination of Humanitarian Affairs, 2023; Kankam-Yeboah et al., 2013). These floods have resulted in crop losses of up to 35% annually in some areas, threatening food security and economic stability (Antwi-Agyei et al., 2018). Despite these challenges, research on future flood susceptibility in the White Volta Basin remains limited. Existing studies often focus on historical trends or immediate impacts without adequately integrating future climate projections or advanced multi-criteria decision-making tools (Mastrorillo et al., 2016; Smits et al., 2024). To address this critical gap, this study utilizes dynamic downscaling methods to project future precipitation patterns in the basin under different Shared Socioeconomic Pathways (SSPs). By evaluating key flood-conditioning factors, such as elevation, slope, drainage density, distance to rivers, and precipitation, it applies the Analytical Hierarchy Process (AHP) integrated with Geographic Information Systems (GIS) to assess flood susceptibility and project risks across near-term (2020–2039), mid-term (2040–2069), and long-term (2080–2,100) time horizons. The integration of AHP with GIS provides a systematic framework for generating high-resolution flood susceptibility maps tailored to the unique conditions of the White Volta Basin (Das, 2022; Ouma and Tateishi 2014). Leveraging data from 15 Global Climate Models (GCMs) under the IPCC’s Sixth Assessment Report, the study identifies areas most vulnerable to future flooding while offering insights into potential changes in susceptibility over time. These findings contribute significantly to disaster risk reduction, sustainable land-use planning, and adaptive flood management strategies. By addressing gaps in existing research and aligning with frameworks such as Ghana’s National Climate Change Adaptation Strategy, the Sustainable Development Goals (SDG 13: Climate Action), and the Sendai Framework for Disaster Risk Reduction (2015–2030), this study supports policy decisions and infrastructure investments aimed at mitigating flood impacts. Furthermore, it enriches the body of literature on climate change impacts in West Africa by offering a robust methodological approach to integrating climate projections with spatial decision-making tools. This research provides a critical resource for stakeholders, policymakers, and researchers, enabling them to better understand and address the socio-economic and environmental impacts of flooding in Ghana and beyond.
2 Materials and methods
2.1 Description of the study area
The White Volta Basin, located in northern Ghana, is a transboundary watershed shared with Burkina Faso, Togo, and Côte d’Ivoire. The basin lies between latitudes 8.7°N and 11°N, and longitudes 2.5°W and 0.03°E (Owusu, 2009). Covering approximately 49,663.7 km2, the basin constitutes about 20% of Ghana’s land area and spans five administrative regions: Upper West, Upper East, Northeast, Northern, and Savannah (Klutse, 2022; WRC, 2021). The region includes major urban centres such as Wa, Bolgatanga, Nalerigu, Tamale, and Damongo. The White Volta River, originating in Burkina Faso, flows into Ghana near Bawku. The basin supports a predominantly agrarian population, with 60–77% of residents relying on rain-fed agriculture for their livelihoods (Atanga and Tankpa, 2021). Other key economic activities include fishing, forestry, charcoal production, stone quarrying, small-scale gold mining (locally known as “galamsey”), and agro-based industries (Antwi-Agyei et al., 2018; Bessah et al., 2021; Tahiru et al., 2020). Flooding is a recurrent issue in the basin, particularly during the rainy season from August to October. The problem is exacerbated by the controlled release of water from Burkina Faso’s Bagre Dam, which coincides with peak rainfall, amplifying flood risks for downstream communities. Vulnerability is especially pronounced in the savannah, northern, and northeastern areas, where adaptive capacity is limited, and food insecurity is prevalent. Over the past decade, floods have increasingly disrupted livelihoods, damaged infrastructure, and strained disaster management systems in the region (Atanga and Tankpa, 2021). Figure 1 illustrates the map of the study area.
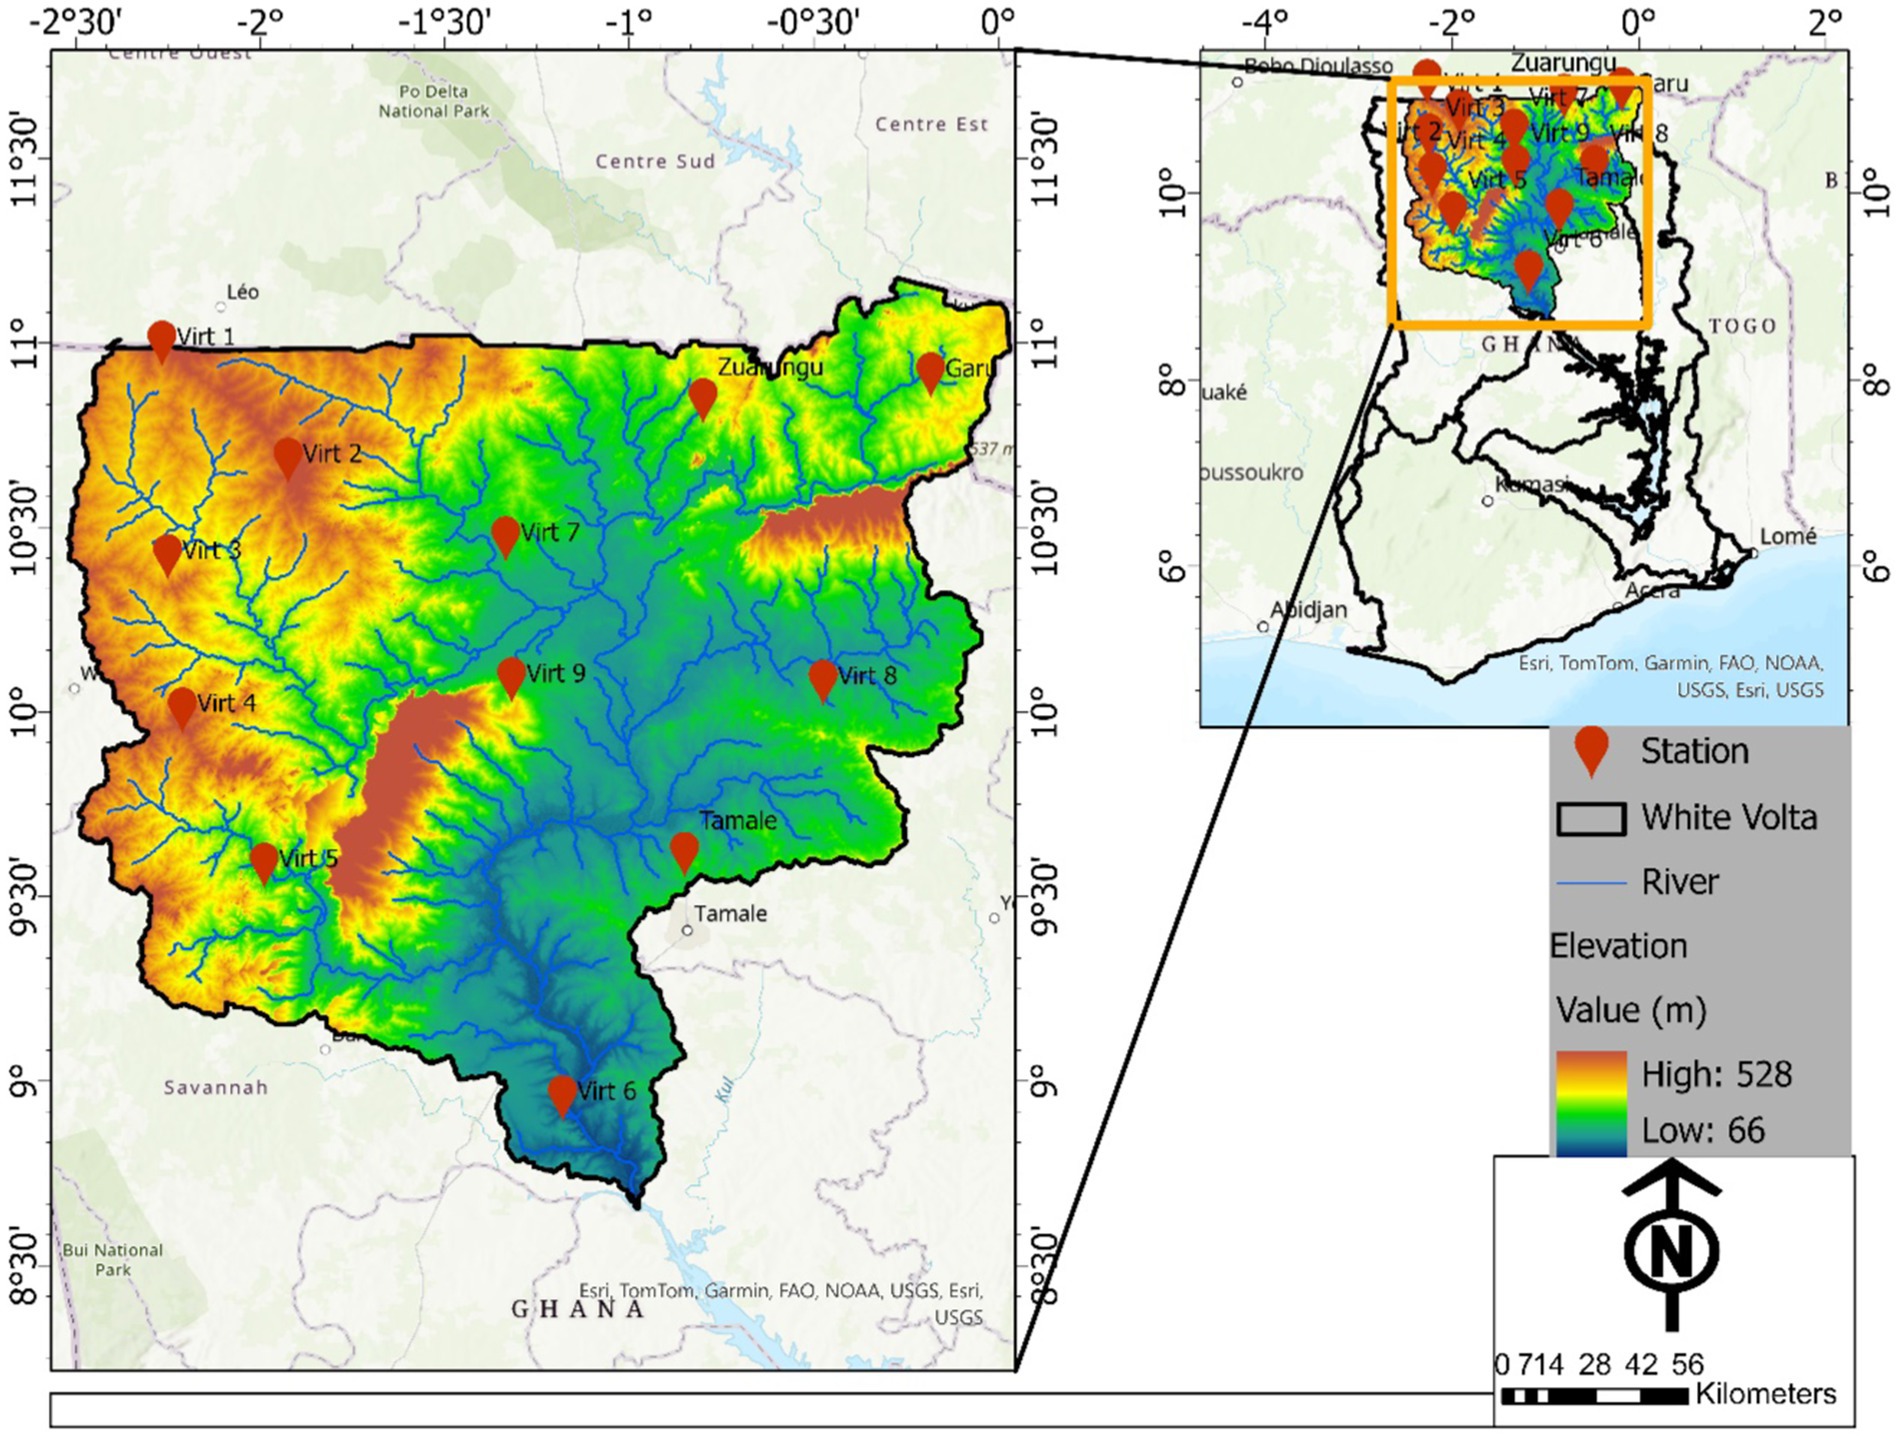
Figure 1. Study area map.
2.2 Observed hydroclimatic data
This study utilized observational data from three weather stations in the White Volta Basin (GMet, 2022) and ERA5 reanalysis data (Agustí-Panareda et al., 2010). ERA5, developed by The European Centre for Medium-Range Weather Forecasts (ECMWF), integrates observations from satellites, weather stations, and aircraft using advanced 4D-Var data assimilation (Hersbach et al., 2020). The ERA5 dataset, spanning January 1981 to October 2020, was sourced from the C3S Climate Data Store and aggregated from hourly to daily scales. Table 1 outlines the characteristics of the Ghana Meteorological Agency ground stations (Garu, Tamale, and Zuarungu) and the virtual stations. Validation against Garu station data (Figure 2) revealed strong mean monthly and annual correlations, confirming the ERA5 dataset’s reliability for this research.
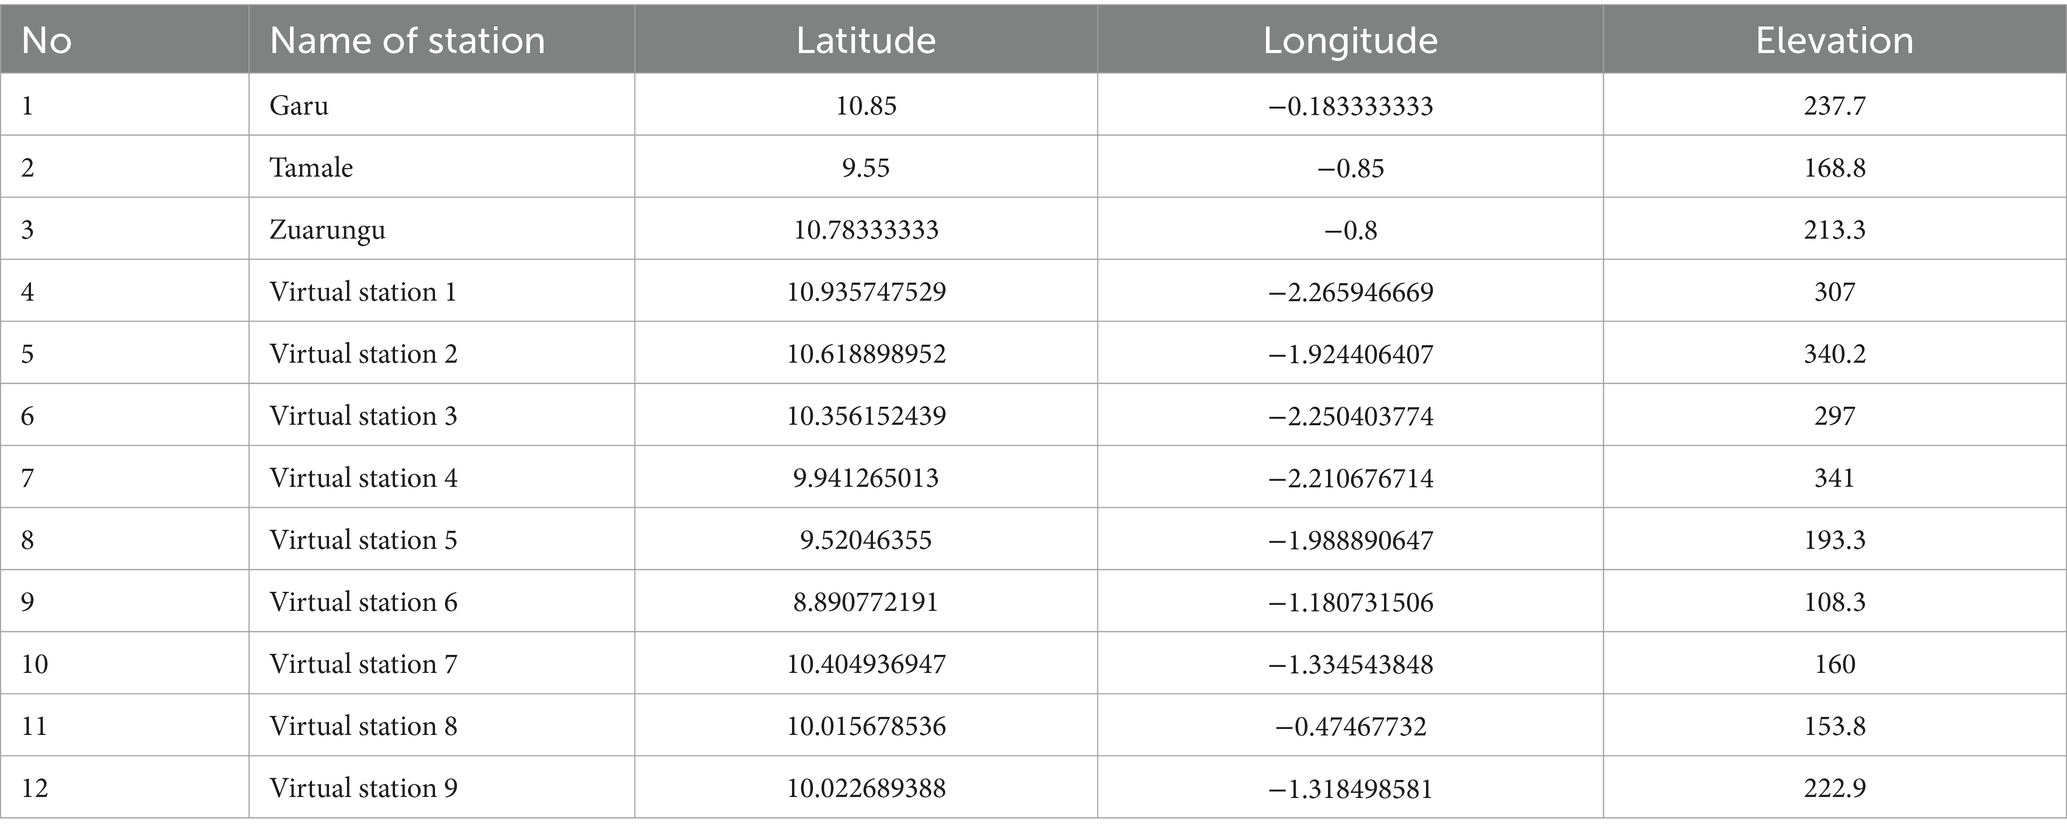
Table 1. Name and characteristics of stations.
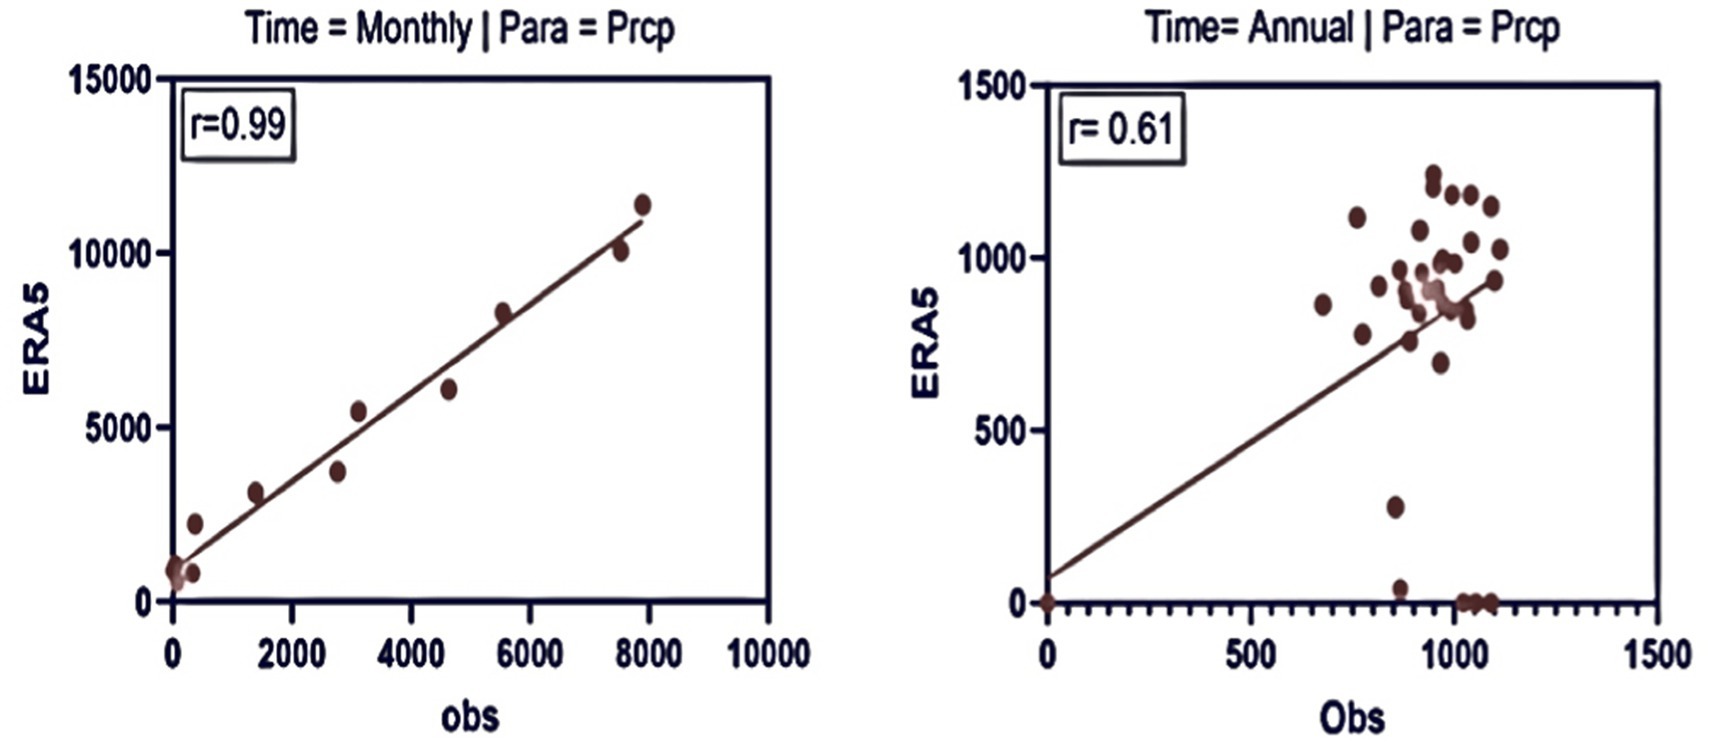
Figure 2. Validation of ERA5 datasets.
2.3 GCM data and climate scenarios
This study utilized future precipitation projections from the sixth phase of the Climate Model Intercomparison Project (CMIP6) due to its improved accuracy, precision, and integration of socioeconomic dimensions of climate change compared to CMIP5 (Oruc, 2022; Gebrechorkos et al., 2023). To enhance the reliability of precipitation projections, 15 global climate models (GCMs) were carefully selected based on their performance in simulating historical climate conditions, spatial resolution, and representation of key physical processes relevant to the study region. The selection criteria were guided by established methodologies in climate modelling, ensuring that the chosen models effectively capture precipitation variability in the White Volta Basin. The use of multiple GCMs allows for a more comprehensive assessment of model uncertainty, reduces dependence on individual model biases, and enhances the robustness of projections (Knutti et al., 2010; Eyring et al., 2016). These 15 GCMs, listed in Table 2, were employed to correct statistical biases and analyse precipitation under Shared Socioeconomic Pathways (SSP1-2.6, SSP2-4.5, SSP3-7.0, and SSP5-8.5). These scenarios represent different greenhouse gas concentration trajectories and socioeconomic pathways, allowing for a comprehensive assessment of potential precipitation changes. The study focuses on the near- to medium-term period (2015–2059) and compares projected changes to baseline conditions (1960–2015 for observed data and 1981–2020 for virtual stations). To minimize uncertainties associated with individual model assumptions, a multi-model mean ensemble (MMME) approach was applied, following best practices in climate modelling (Tebaldi and Knutti, 2007; Tegegne et al., 2020). This method provides robust precipitation estimates for the White Volta Basin by leveraging the strengths of multiple models while reducing errors linked to individual GCM limitations.
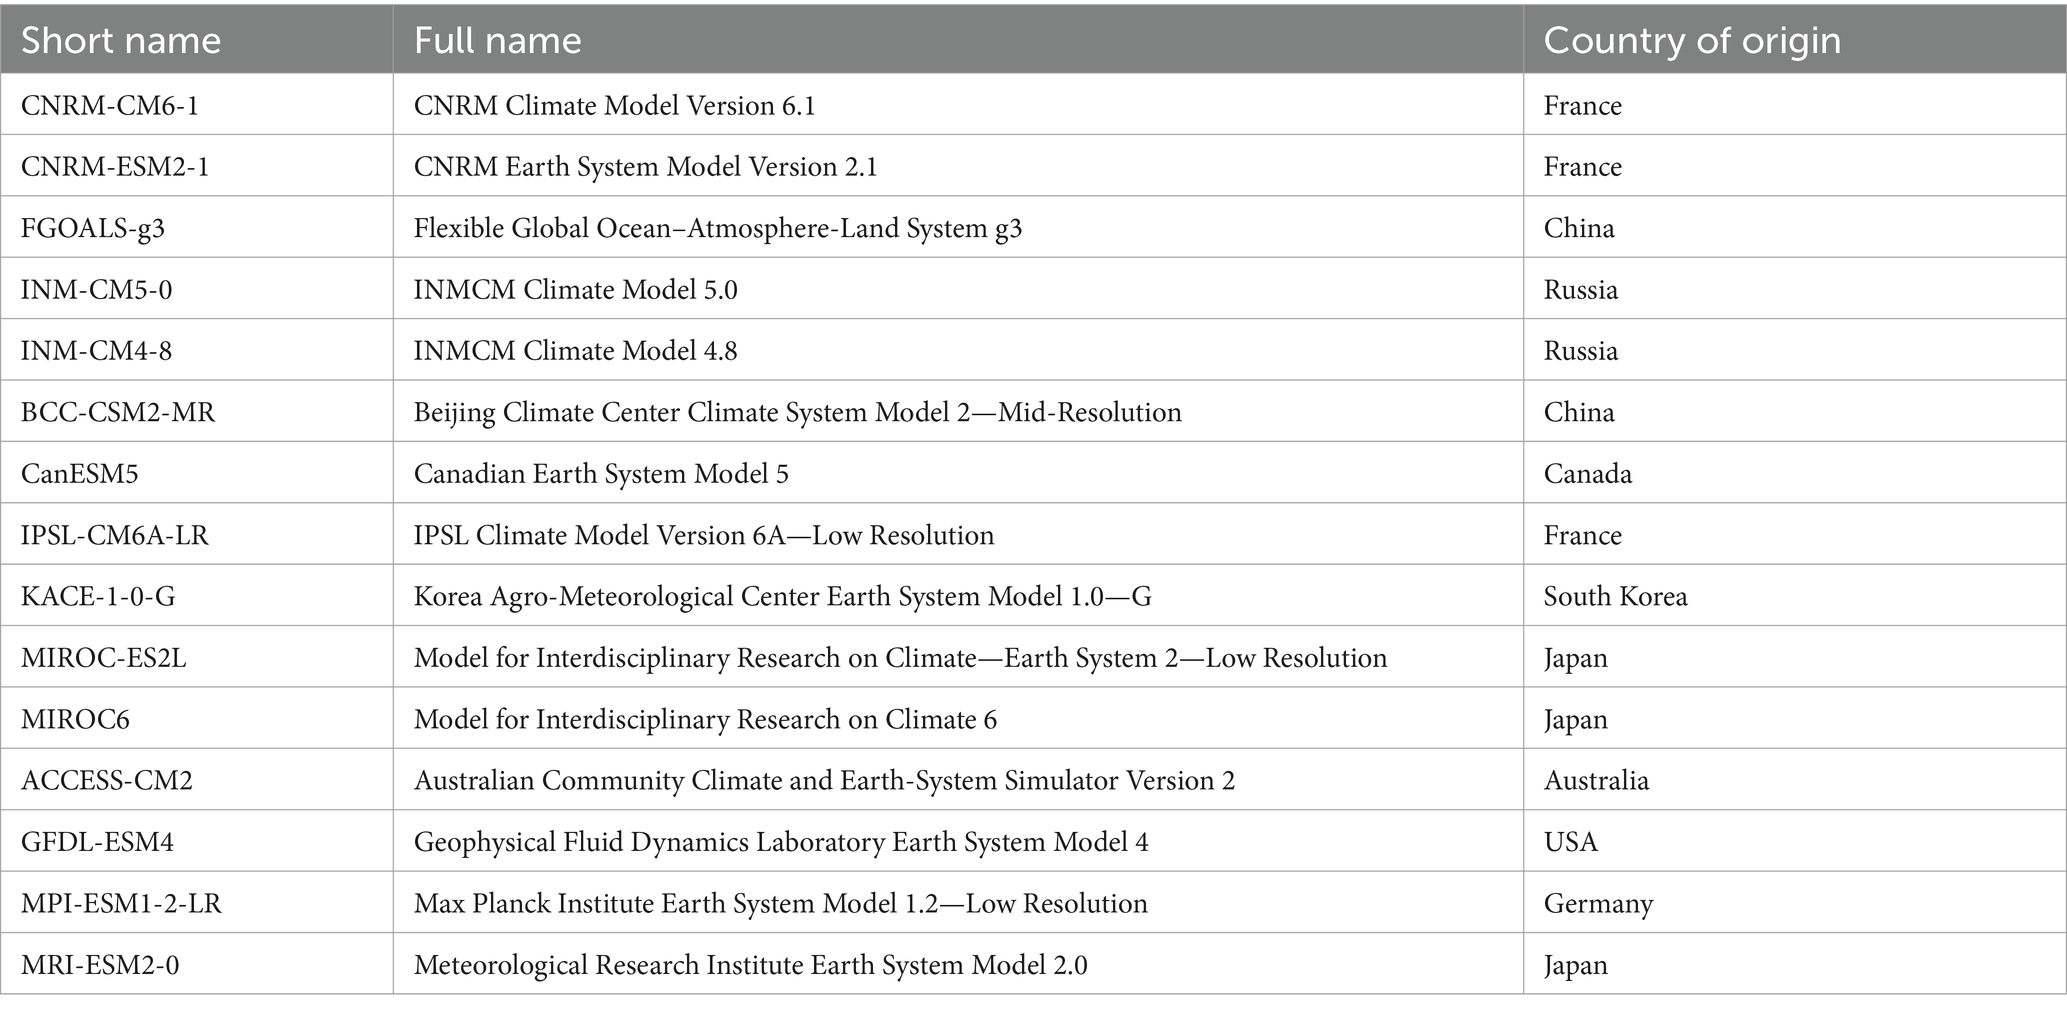
Table 2. Climate models and origin.
2.4 Mean multi-model ensemble
To address uncertainties arising from parameterization, assumptions, and estimations in General Circulation Models (GCMs), climate researchers often use the mean multi-model ensemble (MMME) technique (Mesta et al., 2024). Mensah et al. (2024) note that while no strict guidelines exist for selecting the number of GCMs in Multi-Model Ensemble Analysis (MMEA), the typical range is between three and ten models. However, some studies include all available GCMs without prioritization, which can reduce the effectiveness of MMME if underperforming models fail to capture key boundary conditions (Grose et al., 2020). Using many GCMs can also significantly increase computational demands during downscaling. Therefore, identifying the optimal number of GCMs is essential for efficient and accurate climate modelling. For this study, precipitation estimates for the White Volta Basin were generated using a carefully selected ensemble of fifteen GCMs, balancing model diversity with computational efficiency.
2.5 Statistical bias-correction
Correcting systemic biases in climate model outputs, particularly from GCMs and RCMs, is essential for accurate hydrological modelling. The Climate Model data for Hydrologic Modelling (CMhyd) tool was selected for bias correction in this study due to its robust framework, ease of implementation, and support for multiple correction techniques. CMhyd provides a standardized and widely accepted approach for adjusting climate model data, making it particularly useful for hydrological applications. Unlike other correction tools, CMhyd offers a user-friendly interface, efficient processing capabilities, and compatibility with various hydrological models, ensuring seamless integration into the study’s workflow. Shaikh et al. (2022) emphasize that biases in temperature and precipitation datasets can significantly distort hydrological predictions, leading to unreliable decision-making. Van Calster and Vickers (2015) highlight the need to correct discrepancies between simulated and observed data caused by the coarse resolution of climate models. Bias correction relies on transformation algorithms that adjust model outputs to better align with observed data. This method assumes that the relationships established during correction remain valid under future climatic conditions (Teutschbein and Seibert, 2012). CMhyd supports eight bias correction techniques, with quantile mapping (or distribution mapping) chosen for this study due to its ability to improve peak values, particularly those above the 90th percentile (Yeboah et al., 2022). Research indicates that quantile mapping can reduce bias in daily precipitation and temperature data by an order of magnitude (Piani et al., 2010). Unlike methods that focus solely on averages, quantile mapping ensures extreme weather events are accurately represented by emphasizing the distribution of values. This technique applies monthly mean values to create a transfer function that modifies the distribution of GCM outputs for temperature and precipitation (Kankam-Yeboah et al., 2013). Quantile mapping was selected as the optimal bias-correction method after evaluating multiple techniques, including gamma mapping (Equation 3), due to its superior performance in preserving extreme precipitation values and reducing distributional biases. By aligning model output quantiles with observational data, it effectively minimizes biases, ensuring more reliable hydrological modelling and risk assessments. Enayati et al. (2021) quantile mapping (Equations 1, 2) was applied to correct precipitation biases by transforming the cumulative distribution functions (CDFs) of raw GCM outputs to align with observational data. Figure 3 illustrates the overall bias correction procedure.
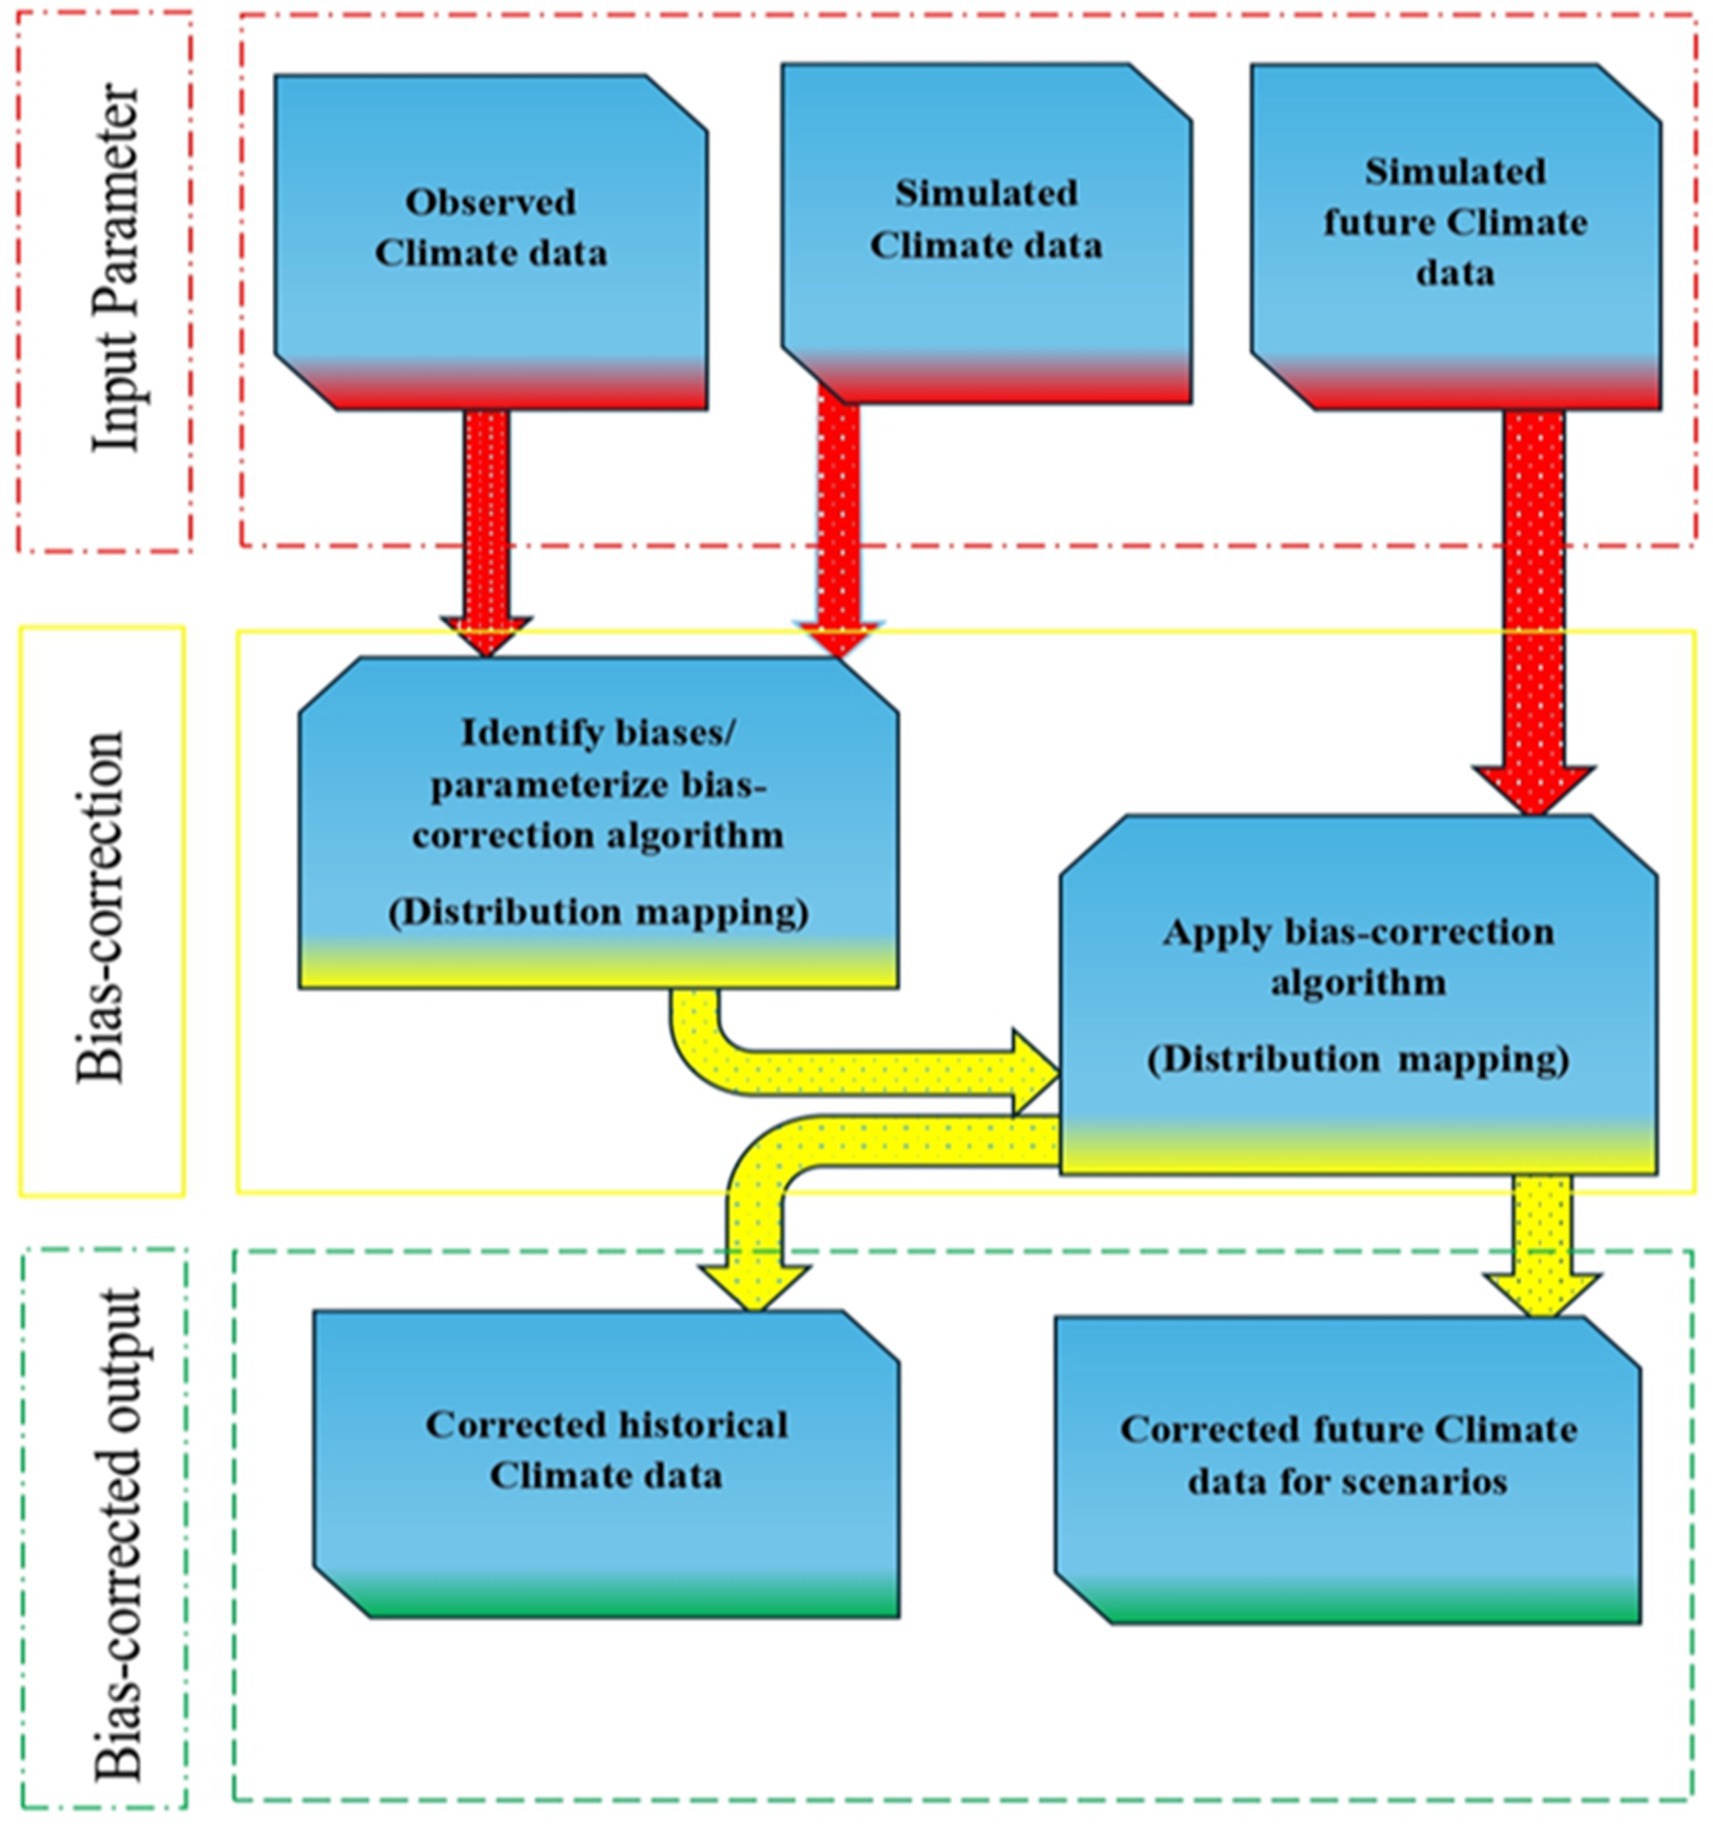
Figure 3. Bias-correction framework in CMhyd modified from Rathjens et al. (2016).
In this context, “Prep” refers to precipitation, “d” signifies daily, and “m” denotes monthly measurements. The symbol “*” is used to represent bias-corrected data, while “raw” refers to the unprocessed data from Regional Climate Models (RCM), and “obs” stands for observed data. The future data from Raw RCM is represented by “sim.” Additionally, “CDF” denotes the Cumulative Distribution Function, with the inverse of the CDF represented as CDF − 1
The shape and scale parameters of the gamma function, denoted as Γ, are represented by α and β. For temperature events, the Gaussian distribution, characterized by the mean parameter μ and the scale parameter σ, is identified as the most suitable fit. Several studies have validated the use of this distribution.
2.6 Future change analysis
The precipitation forecast by the model until 2,100 was compared to the reference periods (1961–2020 for virtual stations and 1960–2015 for observed data). Equation 4 is used to compute the absolute and percentage differences for precipitation to estimate the underlying anomalies.
Where,
Δ = absolute and relative changes.
Qbase = Precipitation for the baseline period.
Qfuture = Precipitation for the future period.
The future fluctuations of the variables are indicated by both positive and negative signals.
2.7 Model performance evaluation
The performance of the bias-corrected model was assessed using multiple evaluation metrics, including the coefficient of determination (R2) (Equation 5), Nash-Sutcliffe Efficiency (NSE) (Equation 6), percent bias (Pbias) (Equation 7), and Root Mean Square Error (RMSE) (Equation 8). Together, these metrics provided a robust assessment of model accuracy. RMSE was the primary goodness-of-fit measure, representing the magnitude of differences between observed and simulated data, with lower values indicating better performance. R2 measured the proportion of variance in observed data explained by the model, with values approaching 1 signifying high accuracy. NSE, ranging from negative infinity to 1, evaluated predictive power, where values above 0.7 indicated very good performance and values of 0.5 or higher denoted satisfactory results. Pbias measured the model’s tendency to overestimate, or underestimate observed values, with accuracy improving as Pbias approached zero. These metrics collectively provided a comprehensive understanding of model reliability, helping to identify discrepancies and guiding refinements for better alignment with observed climate conditions.
Where;
Qa = observed data.
Qm = mean predicted data.
Q1a = the mean observed data.
Q1m = mean predicted data.
n = number of observations.
i = represents the initial starting value in the observations.
2.8 Data sources and flood conditioning factors
In this study, the primary flood-conditioning factors include precipitation, soil type, drainage density, distance to rivers, elevation, slope, aspect, topographic wetness index, stream power index, and curvature. Table 3 presents a table of the data sources used in this analysis. Most of these factors, except for precipitation and soil type, were derived from a 30-meter resolution Digital Elevation Model (DEM) obtained from Digital Earth Africa. The DEM was processed using ArcGIS Pro version 3.0, which was employed for all spatial analyses, including slope, aspect, curvature, and drainage density calculations. The Spatial Analyst tool in ArcGIS Pro was used to extract and analyze these parameters, ensuring high-resolution and accurate spatial representation of the flood-conditioning factors. To guarantee consistency and compatibility, all datasets were resampled and normalised prior to the GIS analysis. To provide a fair comparison and integration of various flood-conditioning factors, normalisation was done to standardise the range of values across various datasets. In order to normalise continuous variables like elevation, slope, and precipitation, the minimum and maximum values from each dataset were used to scale the values to a range of 0 to 1. This was accomplished by applying a linear adjustment to the data using ArcGIS Pro’s Rescale by Function tool. To match the resolution of the DEM, resampling was done to bring all datasets into line with a standard spatial resolution of 30 meters. Coarser-resolution datasets were resampled to the 30-meter resolution using the closest neighbour method for categorical data and the bilinear interpolation method for continuous data using ArcGIS Pro’s Resample Tool. This made it possible for all datasets to be fully linked for multi-criteria analysis and to be spatially aligned. To project future flood susceptibility, the study assumes that soil type, drainage density, distance to rivers, elevation, slope, aspect, topographic wetness index, stream power index, and curvature remain constant over time. In contrast, precipitation was modelled to vary under different climate change pathways and socio-economic development scenarios corresponding to the Shared Socioeconomic Pathways (SSPs). This approach allows for a robust assessment of how future precipitation changes impact flood risk. Spatial maps of the flood-conditioning factors are presented in Figure 4, offering a comprehensive visualization of the data inputs used in the analysis. The collected data were aligned to a common coordinate and projection system in the GIS software to avoid any errors while doing the GIS analysis. A summary of the relative importance and description of the flood conditioning factors is shown in Table 4.
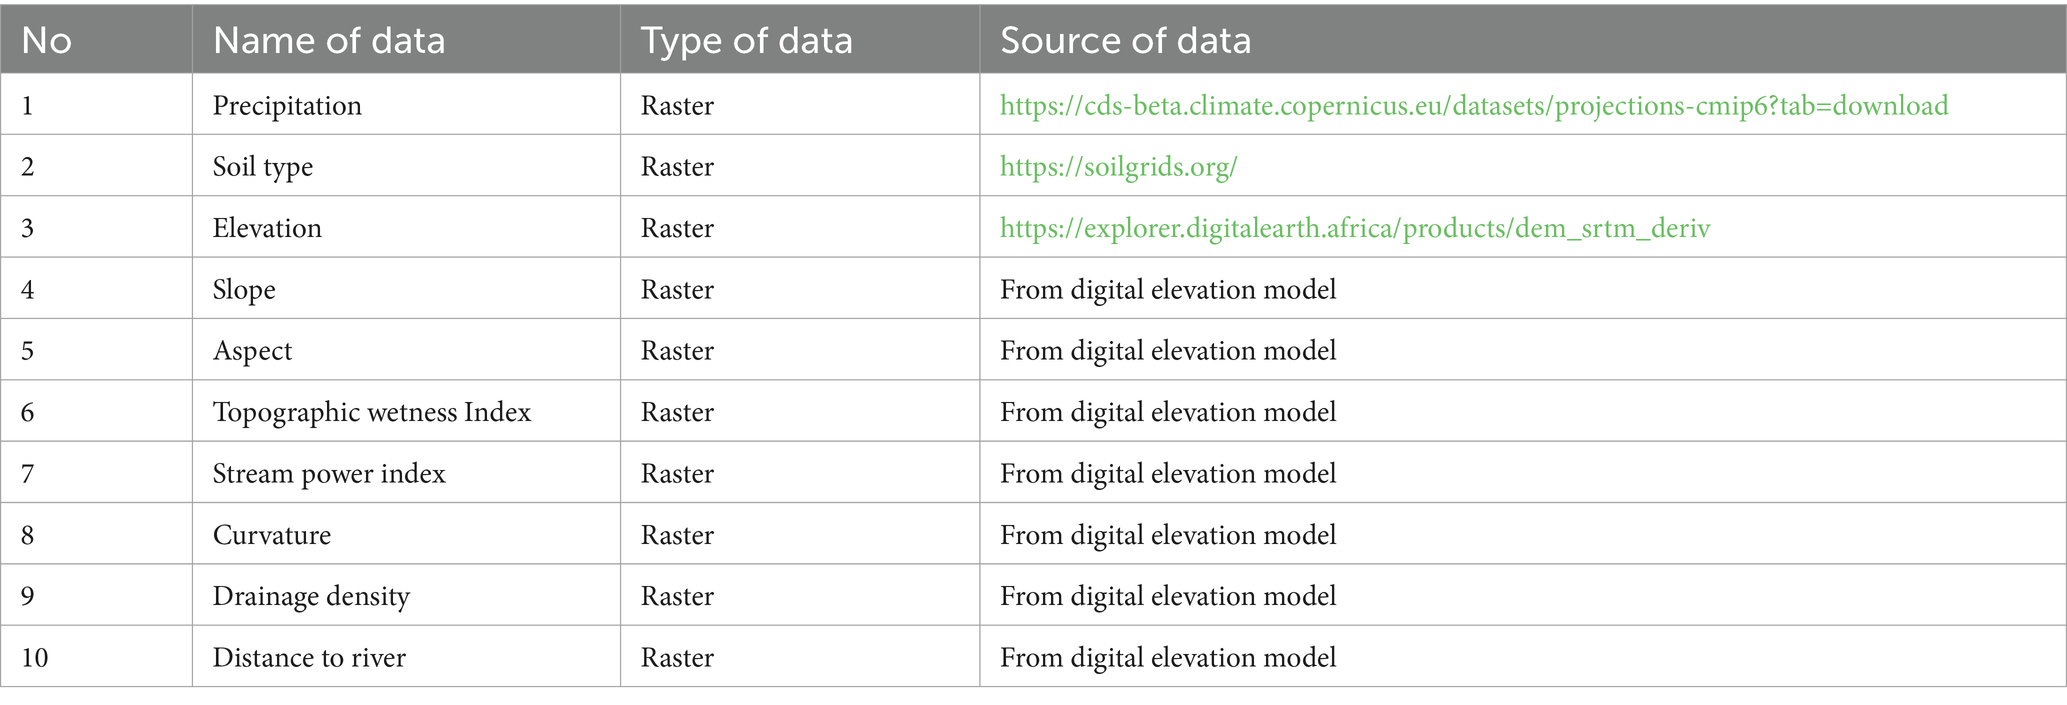
Table 3. Geospatial data, type and sources.
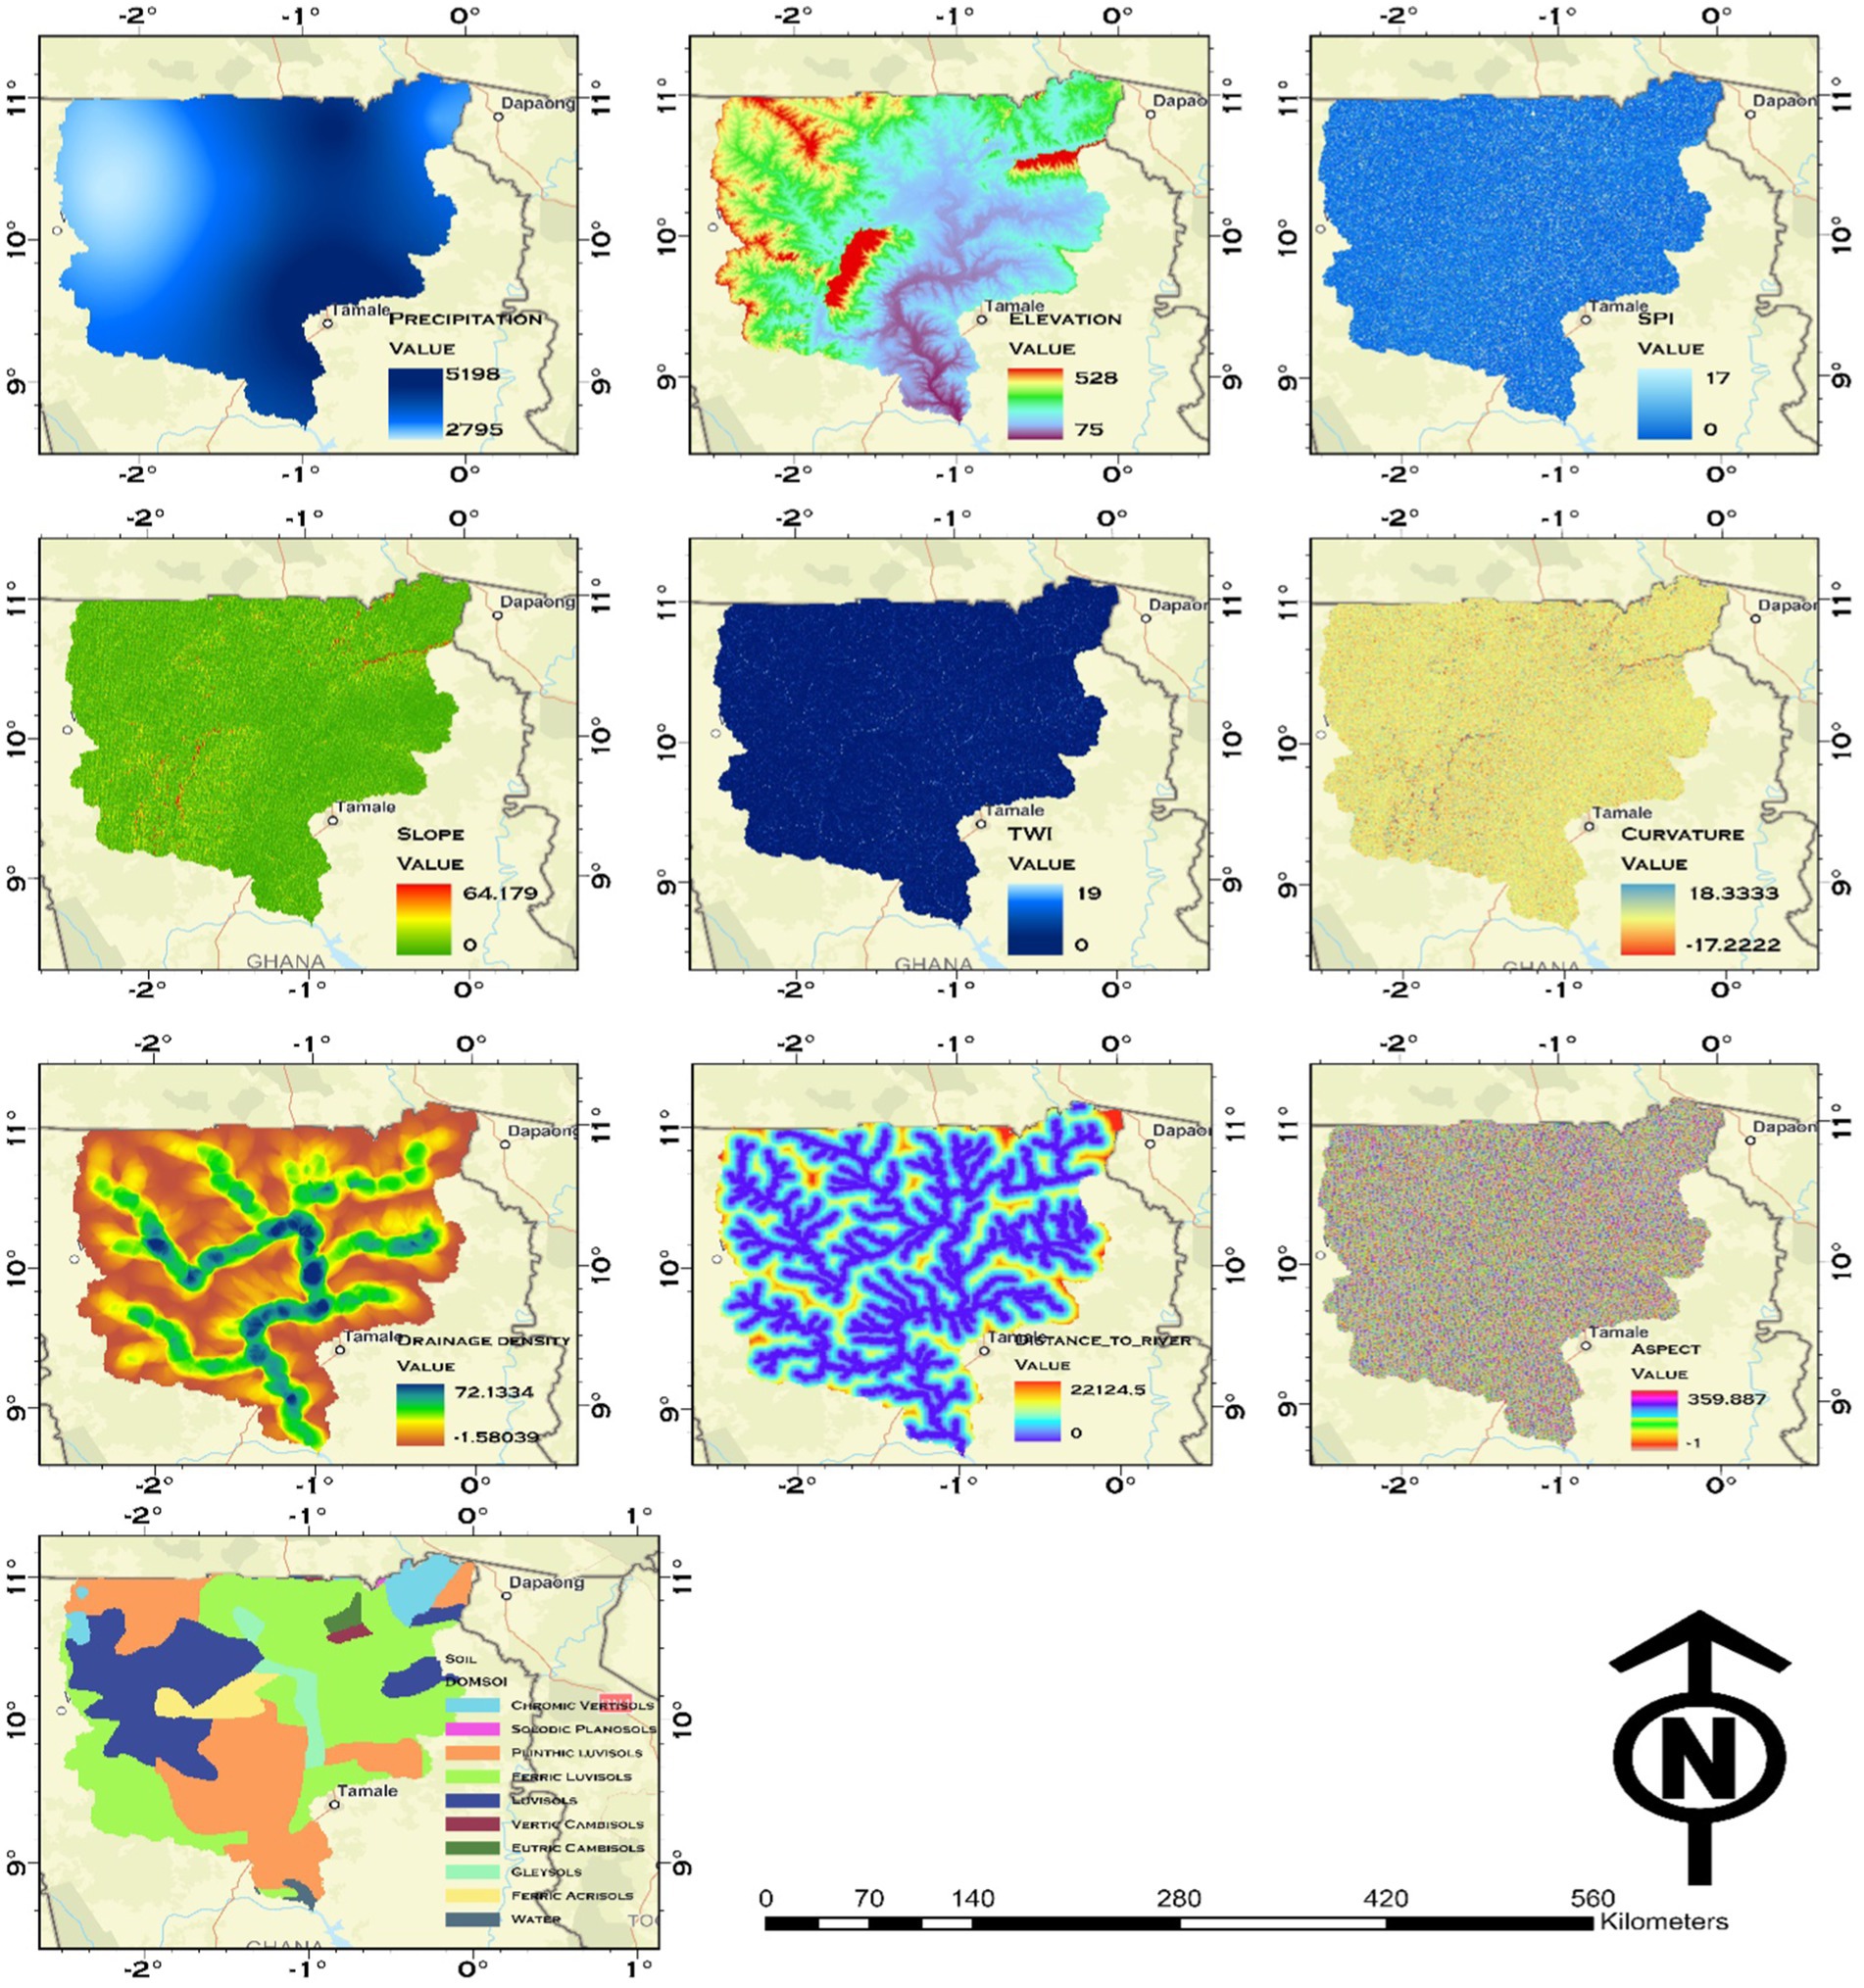
Figure 4. Flood conditioning factors.
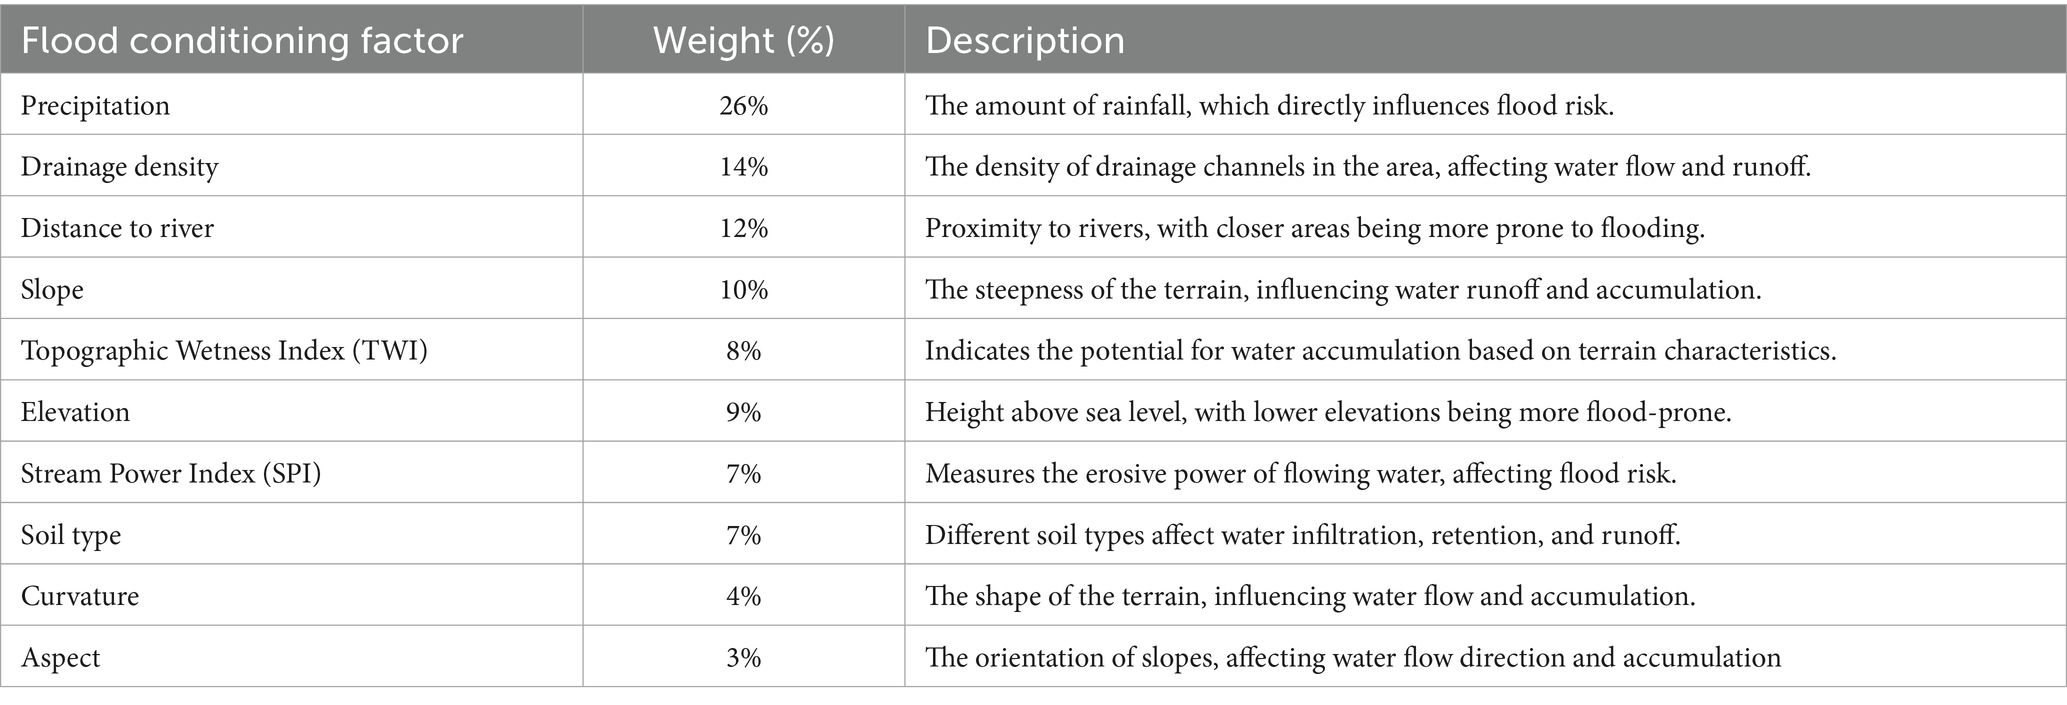
Table 4. Relative importance and description of flood conditioning factors.
2.8.1 Elevation
Elevation data is crucial for understanding topography, as it influences water accumulation and flow patterns. For this study, a 30 × 30-meter resolution Digital Elevation Model (DEM) was obtained from Digital Earth Africa, ensuring detailed terrain representation. The DEM was reprojected to a uniform coordinate system suitable for the study area, minimizing errors from projection mismatches. This standardization improved the integration of multiple geospatial parameters, enhancing the accuracy and reliability of the flood susceptibility assessment.
2.8.2 Topographic wetness index (TWI)
The Topographic Wetness Index (TWI) is a key metric in hydrological modelling, quantifying potential wetness and soil moisture distribution across a terrain. TWI is critical for assessing flood susceptibility as it captures the influence of slopes and contours on water flow and retention, identifying areas prone to flooding and waterlogging. In this study, TWI was calculated using the upslope contributing area derived from the Digital Elevation Model (DEM). A flow accumulation model in GIS software was used to determine the contributing area (A), providing valuable insights into water flow dynamics across the landscape. By integrating slope and flow accumulation data, TWI enhances the understanding of flood risks, supporting effective flood management and mitigation strategies for the study area.
2.8.3 Slope
Slope data for this study were derived from the Digital Elevation Model (DEM) using the Slope Tool in ArcGIS Pro. This tool computes the rate of elevation change between neighbouring cells, expressed in degrees to enhance terrain understanding. The generated slope map provides critical information for flood susceptibility analysis by categorizing terrain steepness at each location. To improve visualization, the slope raster was enhanced using the Stretch method, which adjusts pixel values for better contrast, allowing minor slope variations to be distinguished.
2.8.4 Aspect
Aspect evaluates slope orientation and its influence on runoff, moisture retention, and flood risks. Using the Digital Elevation Model (DEM), an aspect map was generated with ArcGIS Pro’s Aspect Tool to determine the direction of maximum elevation change for each cell. Aspect values were classified into eight primary compass directions (N, NE, E, SE, S, SW, W, NW), with level areas assigned a value of −1.
2.8.5 Curvature
Curvature examines the concavity and convexity of terrain, which significantly affect water flow and accumulation. Using the Digital Elevation Model (DEM), a curvature map was generated with ArcGIS Pro’s Curvature Tool, calculating the second derivative of the elevation surface. Negative curvature values indicate concave areas that promote water accumulation and increase flood risk, while positive values denote convex areas where water disperses, reducing flood potential.
2.8.6 Stream power index (SPI)
The Stream Power Index (SPI) quantifies the erosive potential of flowing water across terrain, making it a critical parameter for flood risk and erosion analysis. By integrating slope and upstream contributing area, SPI assesses the energy exerted by water on the landscape. Higher SPI values indicate areas with increased erosion potential and sediment transport risk during flood events. In this study, SPI was derived using the Digital Elevation Model (DEM) in ArcGIS Pro. The index was computed using Equation 9, combining slope and flow accumulation data to provide spatially detailed insights into regions with heightened erosion susceptibility. This analysis supports targeted flood and sediment management strategies within the White Volta Basin.
2.8.7 Drainage density
Drainage density, a key metric for assessing the extent of drainage networks relative to land area, is critical for understanding flood risks in the White Volta Basin. It reflects how well a landscape is drained, influencing water flow and accumulation patterns. Using ArcGIS Pro, a drainage density map was created by extracting the stream network from the Digital Elevation Model (DEM). Flow direction and flow accumulation were first calculated to determine natural water flow patterns. Streams were identified based on a flow accumulation threshold, incorporating smaller tributaries to represent the drainage network comprehensively. The Line Density Tool was then applied to calculate the total stream length within defined areas, resulting in the final drainage density map.
2.8.8 Distance to river
Proximity to rivers plays a significant role. The likelihood of flooding increases in areas closer to water bodies due to high rainfall events or river overflows. To map the distance to rivers, ArcGIS Pro was utilized, employing hydrological tools derived from the Digital Elevation Model (DEM). The river network of the White Volta Basin was delineated by extracting river and stream features from the flow accumulation layer, which identifies natural water flow paths across the terrain. Subsequently, the Euclidean Distance Tool in ArcGIS Pro was applied to calculate the straight-line distance between each point in the basin and the nearest river or stream. This process resulted in a comprehensive map illustrating the spatial relationship between locations in the basin and their proximity to water bodies.
2.8.9 Precipitation
Precipitation data for the analysis were obtained from 15 Global Climate Models (GCMs) using statistical downscaling to refine global climate projections to the local scale of the White Volta Basin. This approach enhanced the accuracy of precipitation trends, improving the reliability of flood risk assessments. The GCMs, sourced from the Coupled Model Intercomparison Project (CMIP6), provided projections under Shared Socioeconomic Pathways (SSP1-2.6, SSP2-4.5, SSP3-7.0, and SSP5-8.5), representing diverse future socio-economic and emission scenarios. Local historical rainfall data were used for bias correction, ensuring projections aligned with observed climatic conditions. Downscaled precipitation data for 2020, 2050, and 2080 were analysed to identify trends in extreme weather events, seasonal shifts, and potential flooding risks. Spatial distribution maps of annual and seasonal rainfall were generated using kriging in ArcGIS Pro, providing a comprehensive visualization of precipitation patterns across the basin.
2.9 Determining criteria weights
The Analytic Hierarchy Process, a consistent approach to assigning criterion weights in multi-criteria decision-making, was developed by Saaty and Vargas (2012). The basis of the AHP is pairwise comparisons in matrix format in which each cell represents the relative importance of a criterion.
In this study, the AHP methodology was implemented by first constructing a pairwise comparison matrix (5), where the relative weights of criteria were assigned based on a standardized 1–9 scale. The values in the matrix were informed by reviewing of relevant literature and the author’s expertise. Upon completing the comparison matrix, eigenvalues were obtained to find the final weights. For ensuring the reliability of the results, there was a consistency check. This phase checks how well the given values follow logical transitivity. Figure 5 describes the steps.
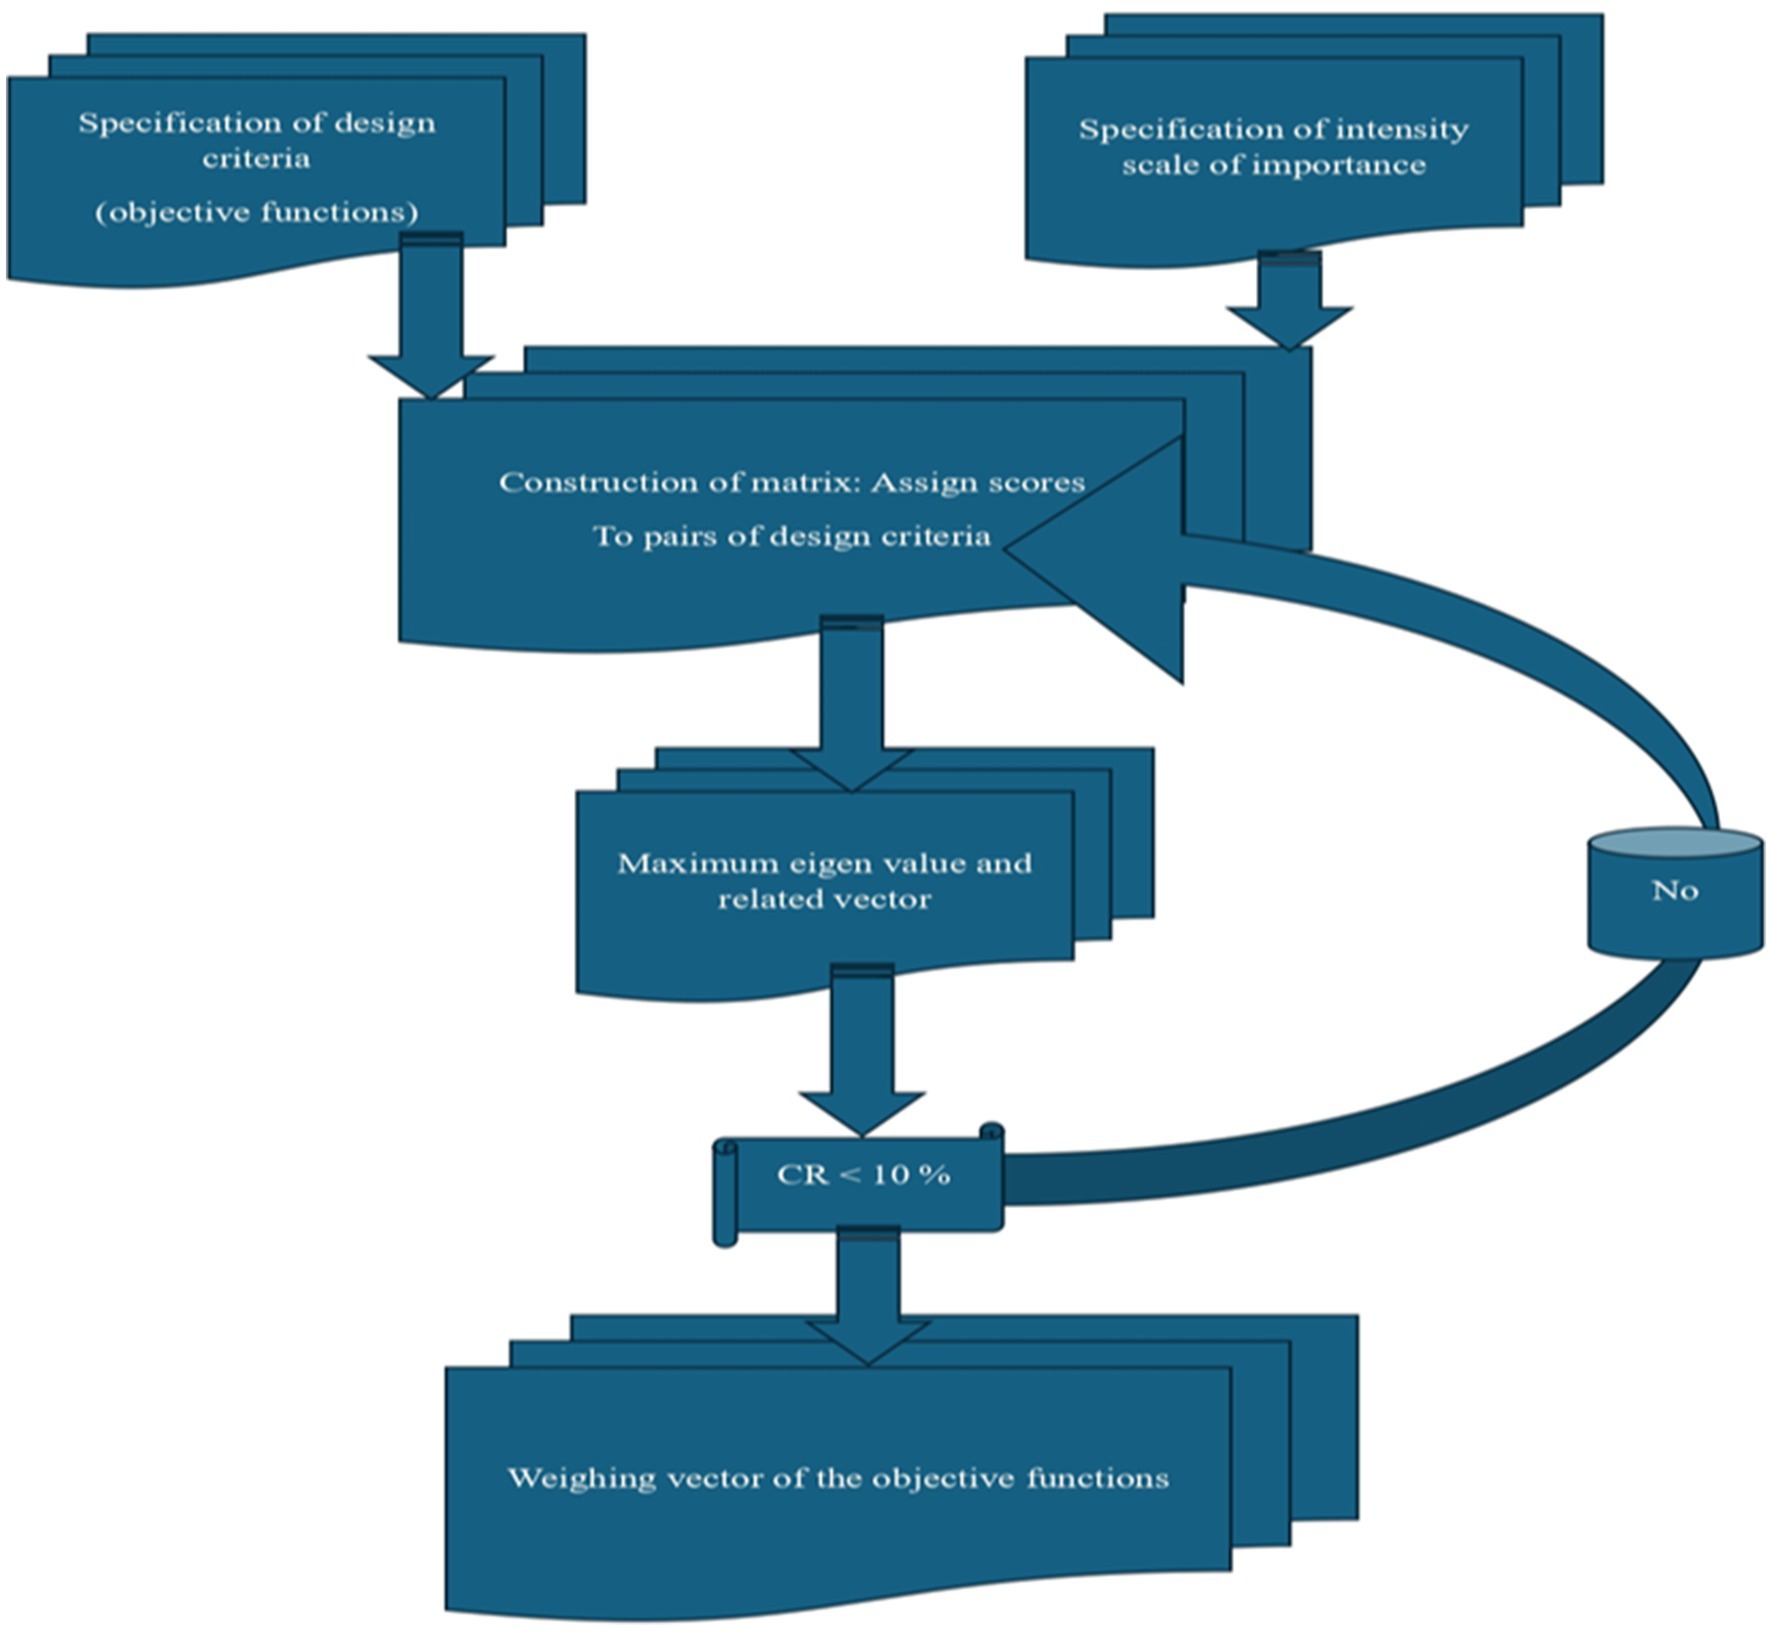
Figure 5. AHP process flowchart.
In this study, the AHP methodology was implemented by first constructing a pairwise comparison matrix (Table 5), where the relative weights of criteria were assigned based on a standardized 1–9 scale. The values in the matrix were informed by reviewing of relevant literature and the author’s expertise. The process began with populating the comparison matrix, followed by deriving the final weights through eigenvalue calculations. To ensure reliability, a consistency check was performed. This step evaluates whether the assigned values adhere to logical transitivity. The entire workflow is summarized in Figure 5.
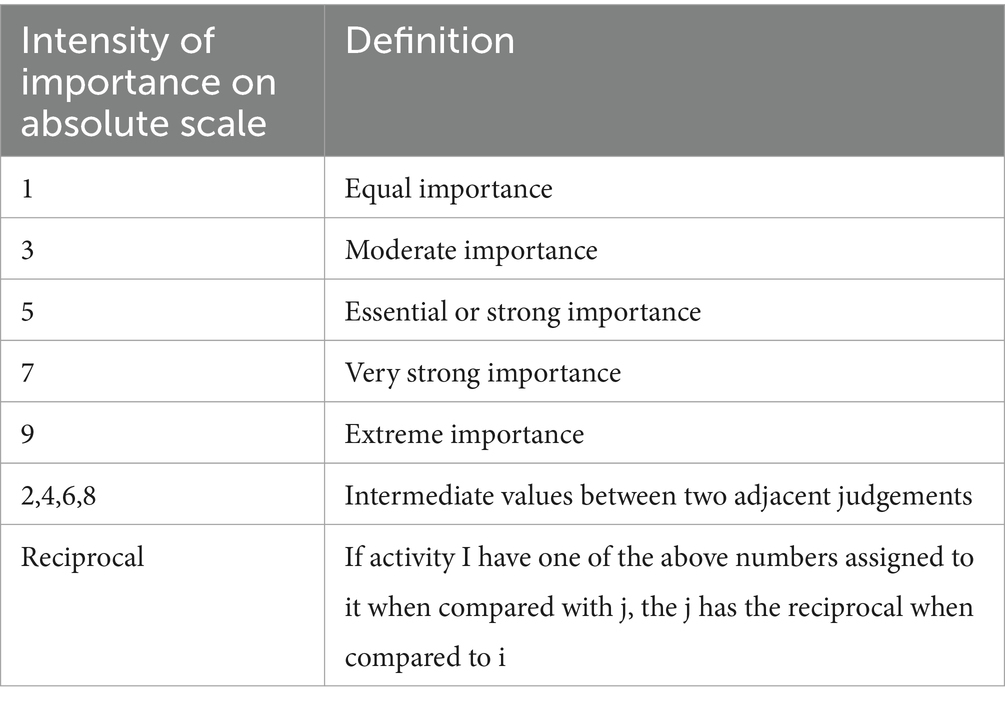
Table 5. AHP scale of measurement.
After assigning values to each pair of criteria, a pairwise comparison matrix was constructed to calculate the relative weights of the criteria. The eigenvalue method was employed to derive these weights from the pairwise comparisons. A crucial aspect of this process was the consistency check, which ensured that the judgments in the comparisons were logically sound. The Consistency Ratio (CR) was calculated to assess the reliability of the pairwise comparisons. A CR value below 0.10 (10%) indicates acceptable consistency; otherwise, revisions to the comparisons are required. In this analysis, the computed Consistency Index (CI) was 0.34, resulting in a CR value of 0.09 for the nine factors (with 𝑛 = 9 and a Random Index (RI) of 1.45). Since the CR value was below the threshold of 0.10, the pairwise comparison matrix was deemed consistent. These weights represent the relative influence of each factor on flood susceptibility and were subsequently applied in the spatial analysis to generate the flood susceptibility maps for the White Volta Basin.
The flood conditioning factors, their subclasses, and the percentage of weighted criteria is presented in Table 6. Precipitation was assigned a weight of 26%, suggesting significant relevance in relation to the other factors. Aside from that, drainage density and distance from drainage had significant rates of 14 and 12%, respectively. Findings for TWI, Elevation, and Slope at 8, 9, and 10% were acquired. These three components have a close weighted criterion value because of their strong ties. Finally, to compare with other factors, Aspect and Curvature were given weights of 3 and 4%, respectively, as indicated in the table above. Furthermore, to evaluate the consistency of the generated ratings, the consistency ratio (CR) was calculated. The study’s computed CR of 0.09 confirms the validity of the ratings that were employed. Since the resultant value is less than 0.1 or 10%, the CR value is regarded as acceptable. The collection of assessments may be too inconsistent to be trusted if the CR ratio is higher than 0.1 Elkhrachy (2015) said. The sub-thematic factors were integrated and overlaid to generate the flood vulnerability maps.
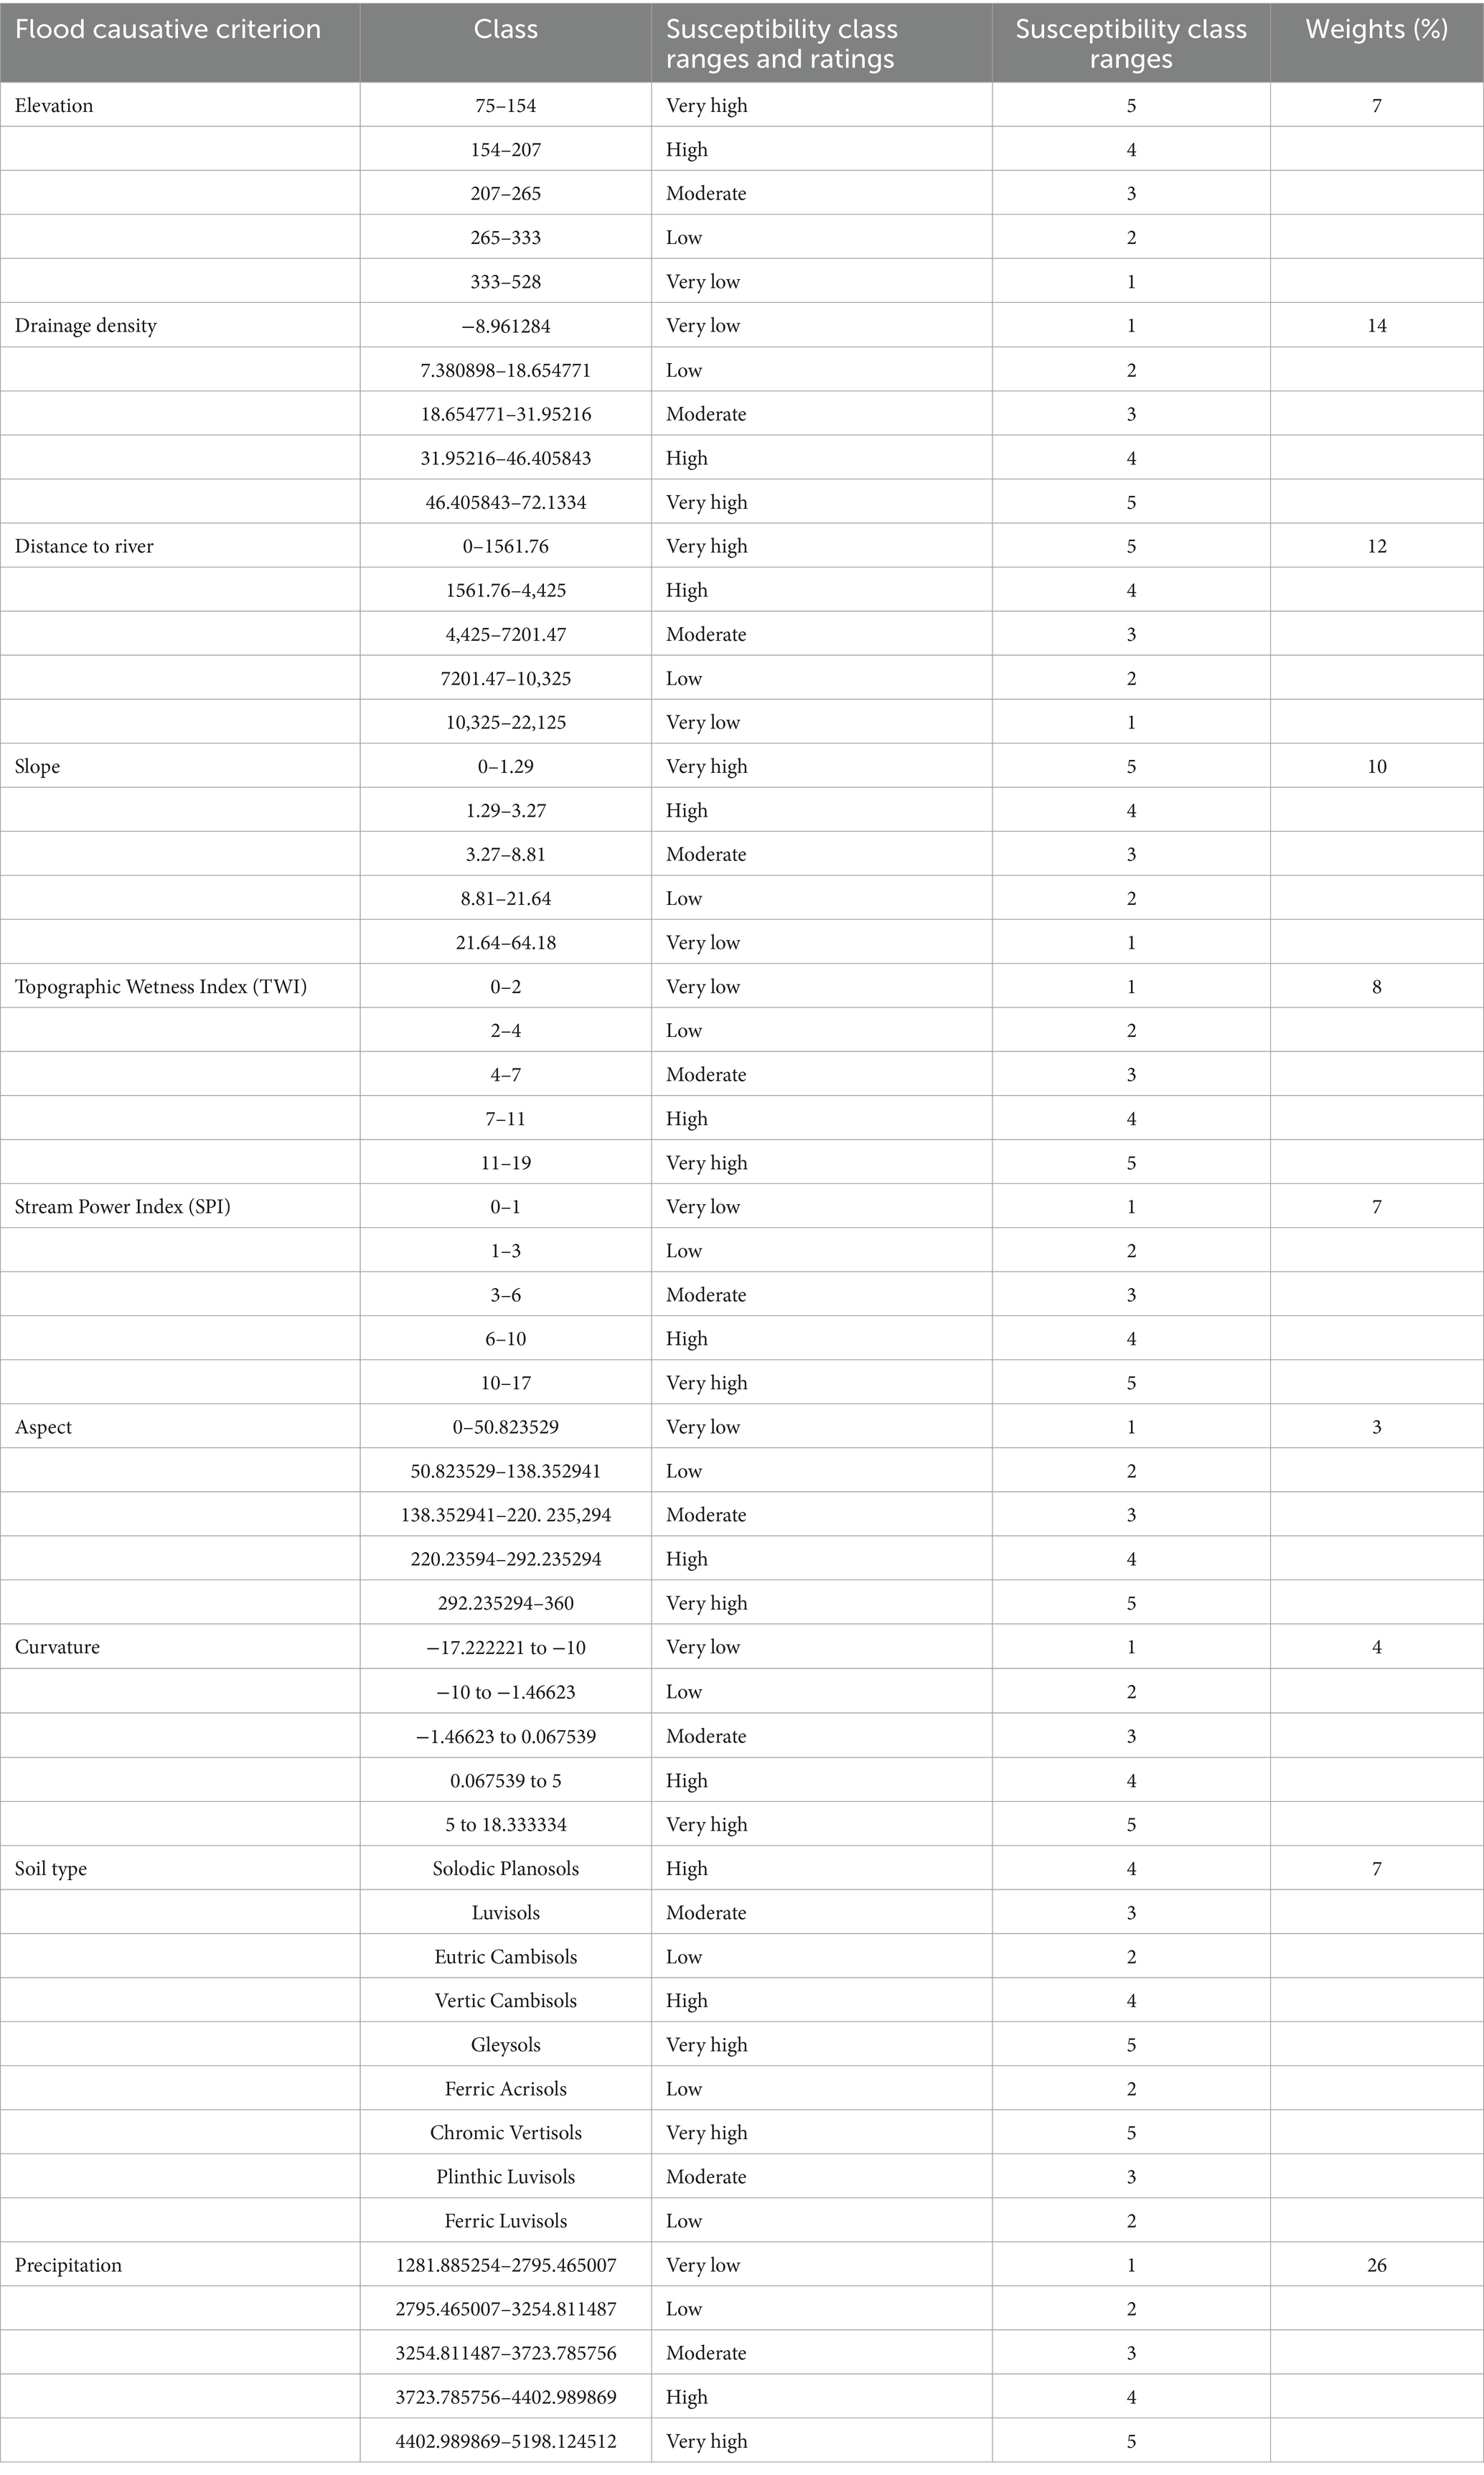
Table 6. Weight assignment of flood conditioning factors.
2.10 Model validation
Utilising the receiver operating characteristic (ROC) curve, the baseline flood susceptibility map was verified. A general and scientific method for determining a model’s accuracy is the ROC curve. The false and true positive rates are displayed on the abscissa and Ordinate axes of the ROC curve, respectively. The area under the curve (AUC) is taken into consideration to support the prediction of models. For mapping flood susceptibility, an AUC value of less than 0.50 is deemed inadequate. An AUC of 1 indicates that the model is perfect. Consequently, when the AUC falls between 0.5 and 0.6, the model is considered bad. When the AUC falls between 0.7 and 0.8, the model is considered acceptable; when it falls between 0.8 and 0.9 and 0.9–1, on the other hand, the model is very good and excellent. The ROC curve was generated from a GIS tool called ArcSDM (Arc Spatial Decision Maker).
3 Results
3.1 Bias correction performance evaluation
The graphical comparison of ensemble bias-corrected and raw precipitation data in Figure 6 highlights the significant improvements achieved through bias correction. The corrected data closely aligns with observed precipitation patterns, with R2 values ranging from 0.905 to 1, compared to the raw data’s broader range of 0.02 to 1. Similarly, the Percentage Bias (Pbias) improved to between 26 and −7.2, while the Nash-Sutcliffe Efficiency (NSE) increased to between 0.384 and 1, reflecting enhanced model performance. The Root Mean Square Error (RMSE) also showed substantial reductions, confirming improved accuracy. The models’ performance statistics demonstrate a satisfactory agreement between the simulated and recorded values of these variables (see Figures E, F in the Supplementary materials). A station-level analysis revealed that raw GCM data overestimated precipitation at Garu from March to August and underestimated it at Zuarungu from January to April, with notable improvements after bias correction. These findings align with previous studies by Siabi et al. (2023a,b) and Yeboah et al. (2022), reinforcing the reliability of bias-corrected data. While the distribution mapping method effectively reduced discrepancies, it introduced minor uncertainties, consistent with earlier research (Zhang et al., 2024). Despite these challenges, CMIP6 data demonstrated improved performance over CMIP5, particularly in replicating observed precipitation patterns. Addressing gaps in ground station data remains crucial for further enhancing model outputs. Overall, the bias-corrected data significantly reduces uncertainties and improves the reliability of climate simulations for impact assessments.
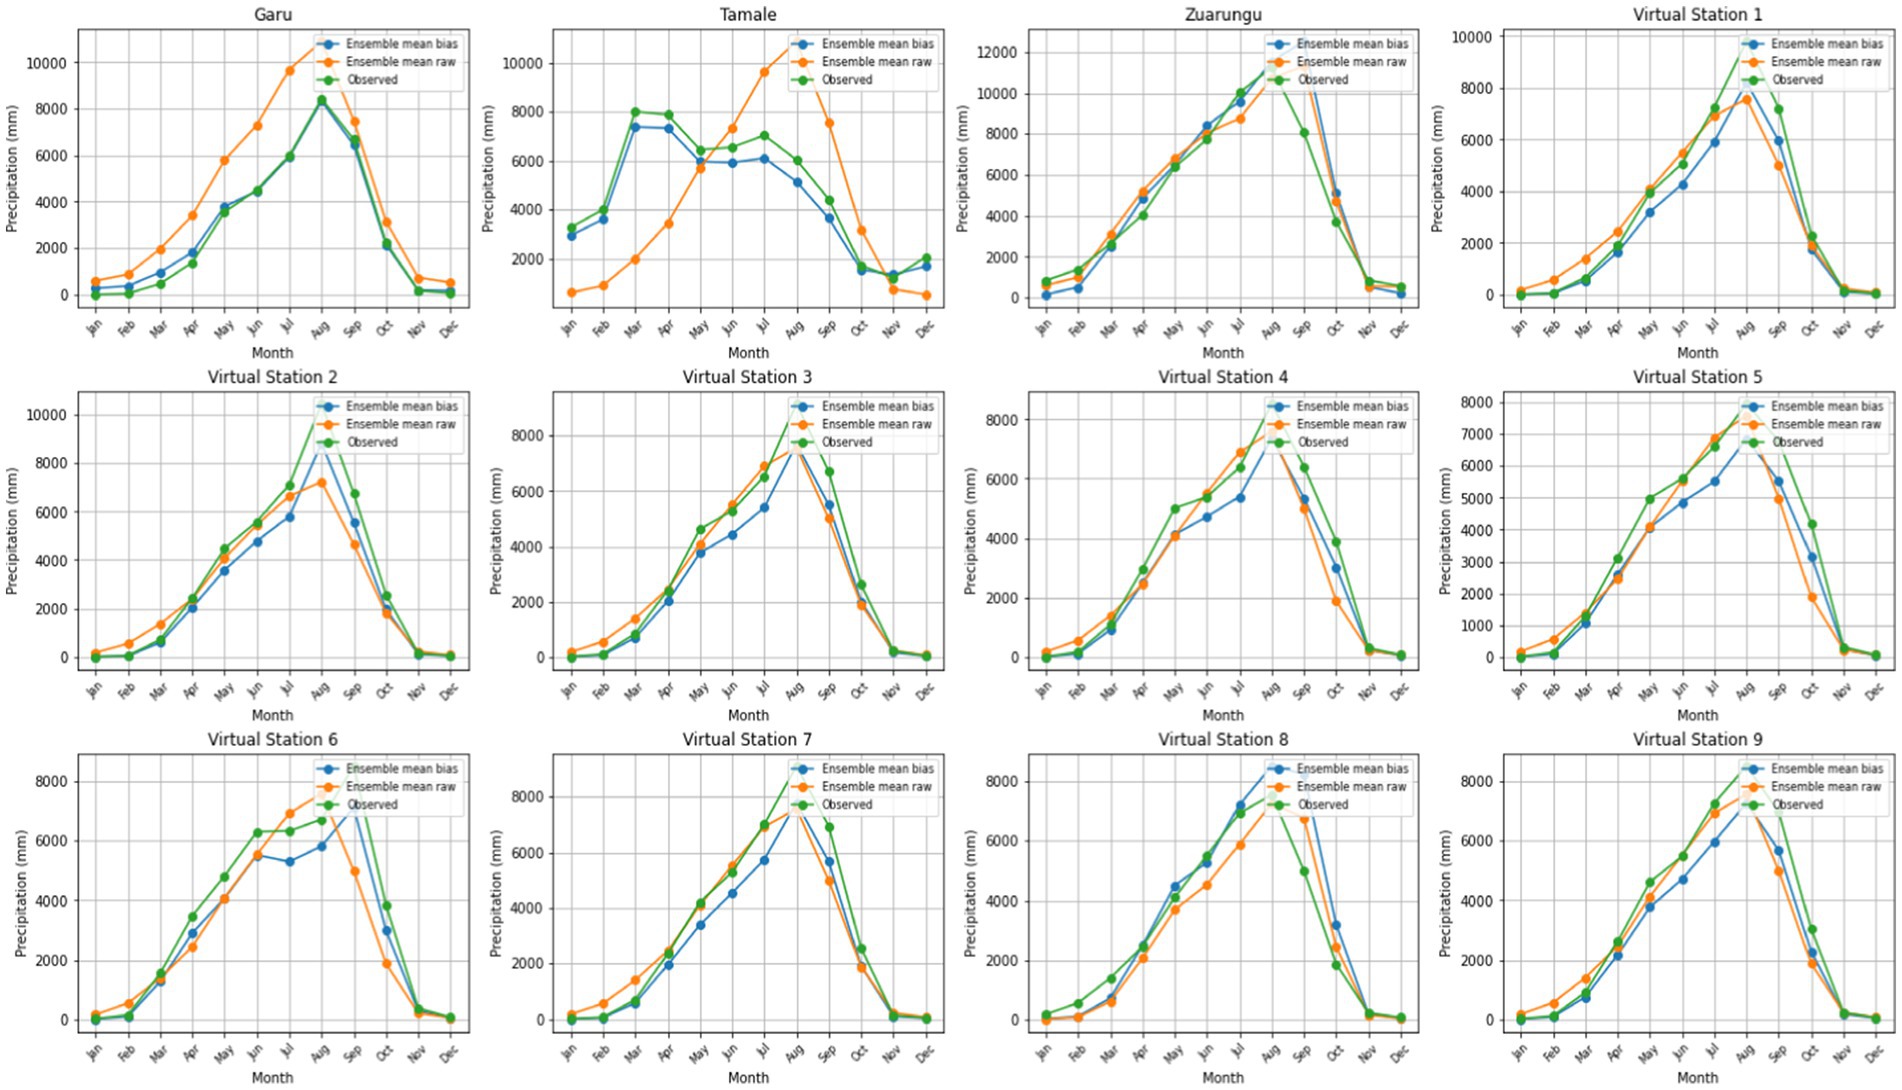
Figure 6. Evaluation of ensemble bias-corrected and raw precipitation compared to baseline periods (Obs = Observed, Mod = Modelled).
3.2 Variation in annual precipitation under SSP1-2.6, SSP2-4.5, SSP3-7.0 and SSP5-8.5 until 2,100
The projected average precipitation for the White Volta River Basin under the four SSP scenarios is shown in Figure 7. The results indicate a general decline in total precipitation under SSP5-8.5 relative to the baseline period, extending to 2,100. At Garu station, annual precipitation will decrease across all scenarios, shifting from a baseline range of 737–1,239 mm/year to 640–1,363 mm/year. Similarly, Tamale station’s precipitation will decline from 791–1,466 mm/year to 919–1,565 mm/year. At Zuarungu station, the baseline range of 725–1,354 mm/year is projected to drop to 608–1,331 mm/year. Virtual Stations 1–4 will experience a reduction from 1,001–1,054 mm/year to 706–1,311 mm/year, while Virtual Stations 6–9 will see a decrease from 1,001–1,054 mm/year to 520–1,281 mm/year. Despite the overall decline in precipitation under SSP5-8.5, all scenarios will show an upward trend in precipitation from the present to 2,100, albeit at varying rates depending on location and scenario. At Garu and Tamale, higher emissions scenarios will lead to increased rainfall, with SSP1-2.6 showing the steepest increases toward the end of the century. While Garu and Zuarungu will exhibit moderate growth, projections suggest that all scenarios will converge by the late 21st century. Tamale, however, is expected to experience a more pronounced increase in precipitation, particularly under SSP1-2.6, peaking around 2080. Variability among virtual stations will also be evident. For instance, Virtual Station 1 will show significant differences between SSPs, whereas Virtual Station 4 will display less variation. Nonetheless, all virtual stations are projected to exhibit a steady increase in precipitation over time.
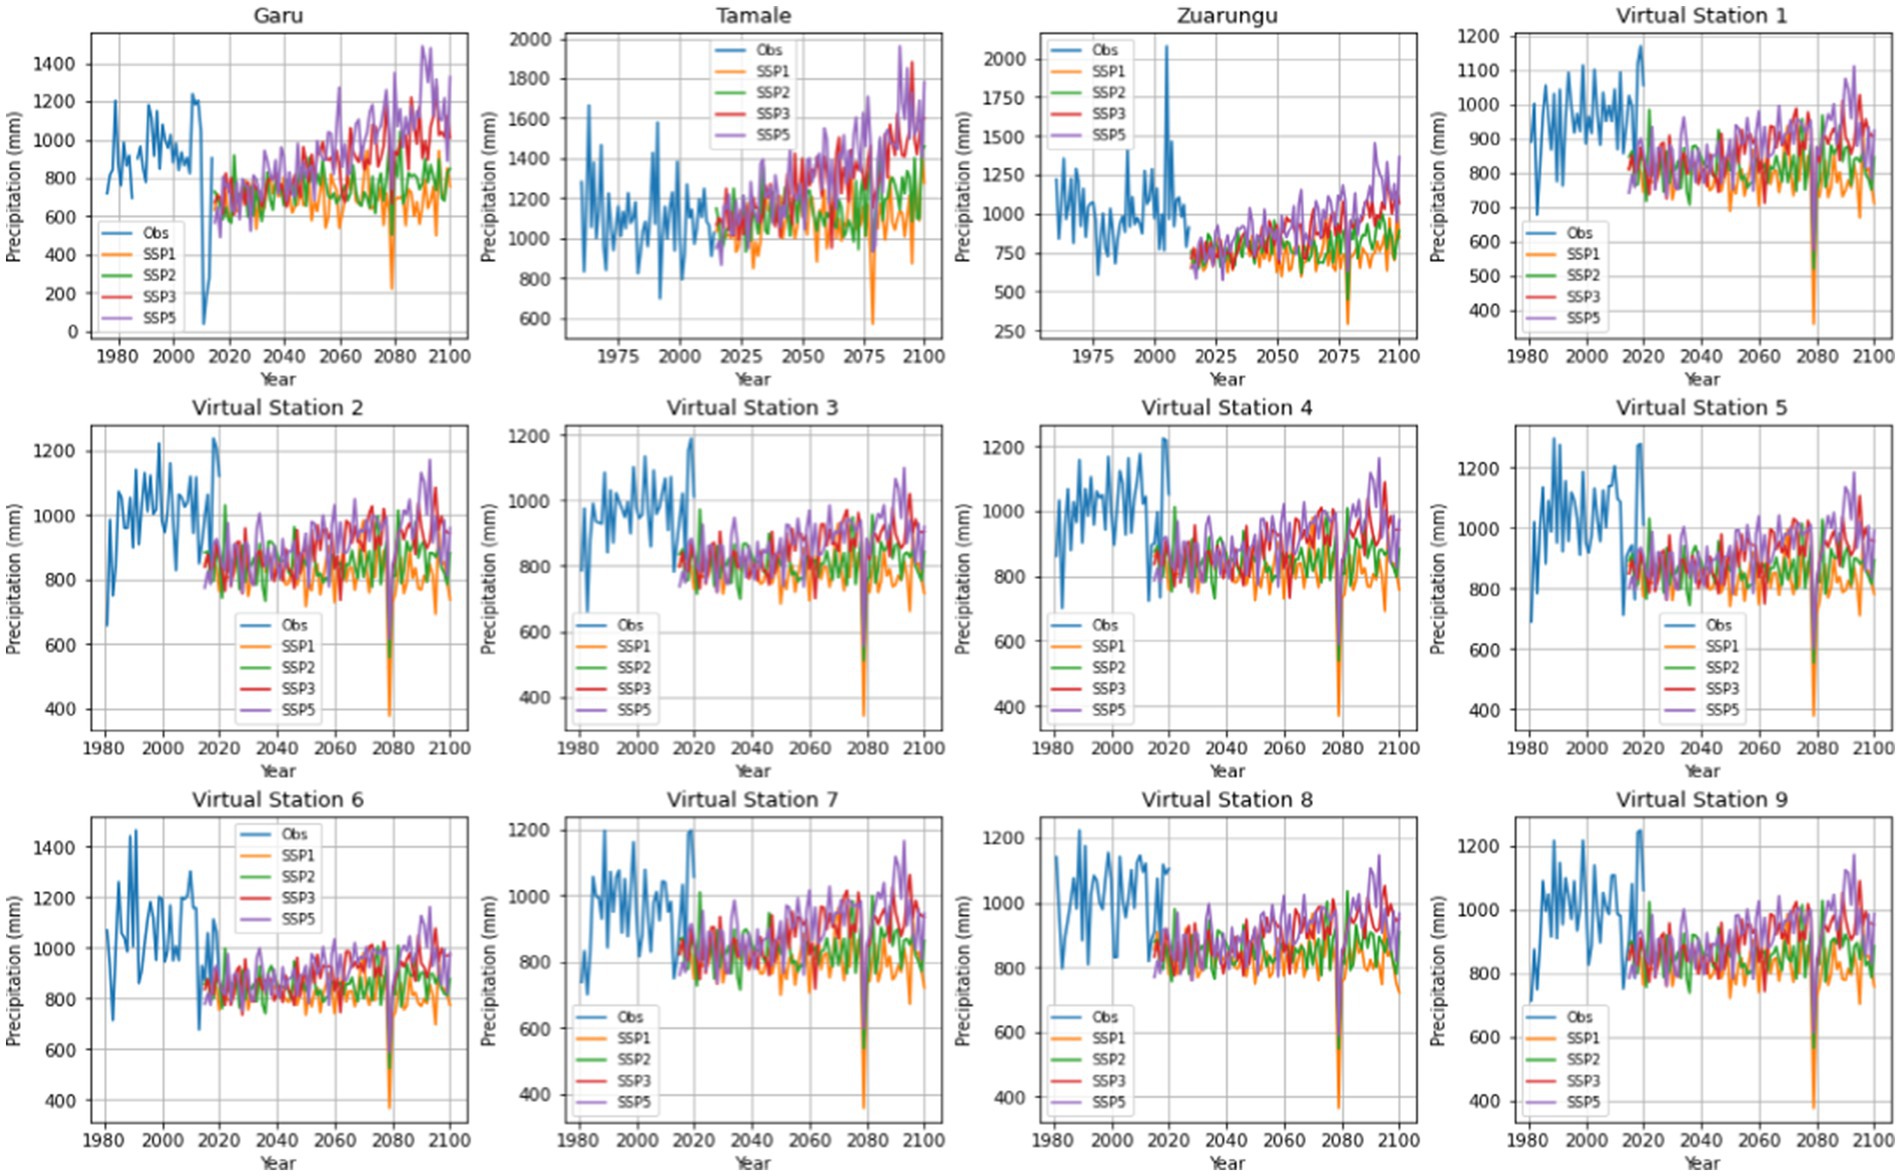
Figure 7. Long-term variations in annual precipitation (1,960–2,100).
3.3 Mean monthly precipitation changes under climate scenarios for the time periods
The projected average monthly change in precipitation for the 2020s (Figure 8) indicates a general decline across most months and locations under various SSP scenarios, except for November. This decreasing trend will persist through the 2050s and 2080s, particularly in Zuarungu, in the northern region of the White Volta Basin, where mean monthly precipitation is projected to decline across all months and scenarios. At Virtual Station 6, located in the southern basin, a similar decline in mean monthly precipitation is expected, except for a 25% increase in the 2020s under SSP5-8.5. However, this anomaly will disappear by the 2050s and 2080s, as precipitation levels continue to decline under all scenarios.
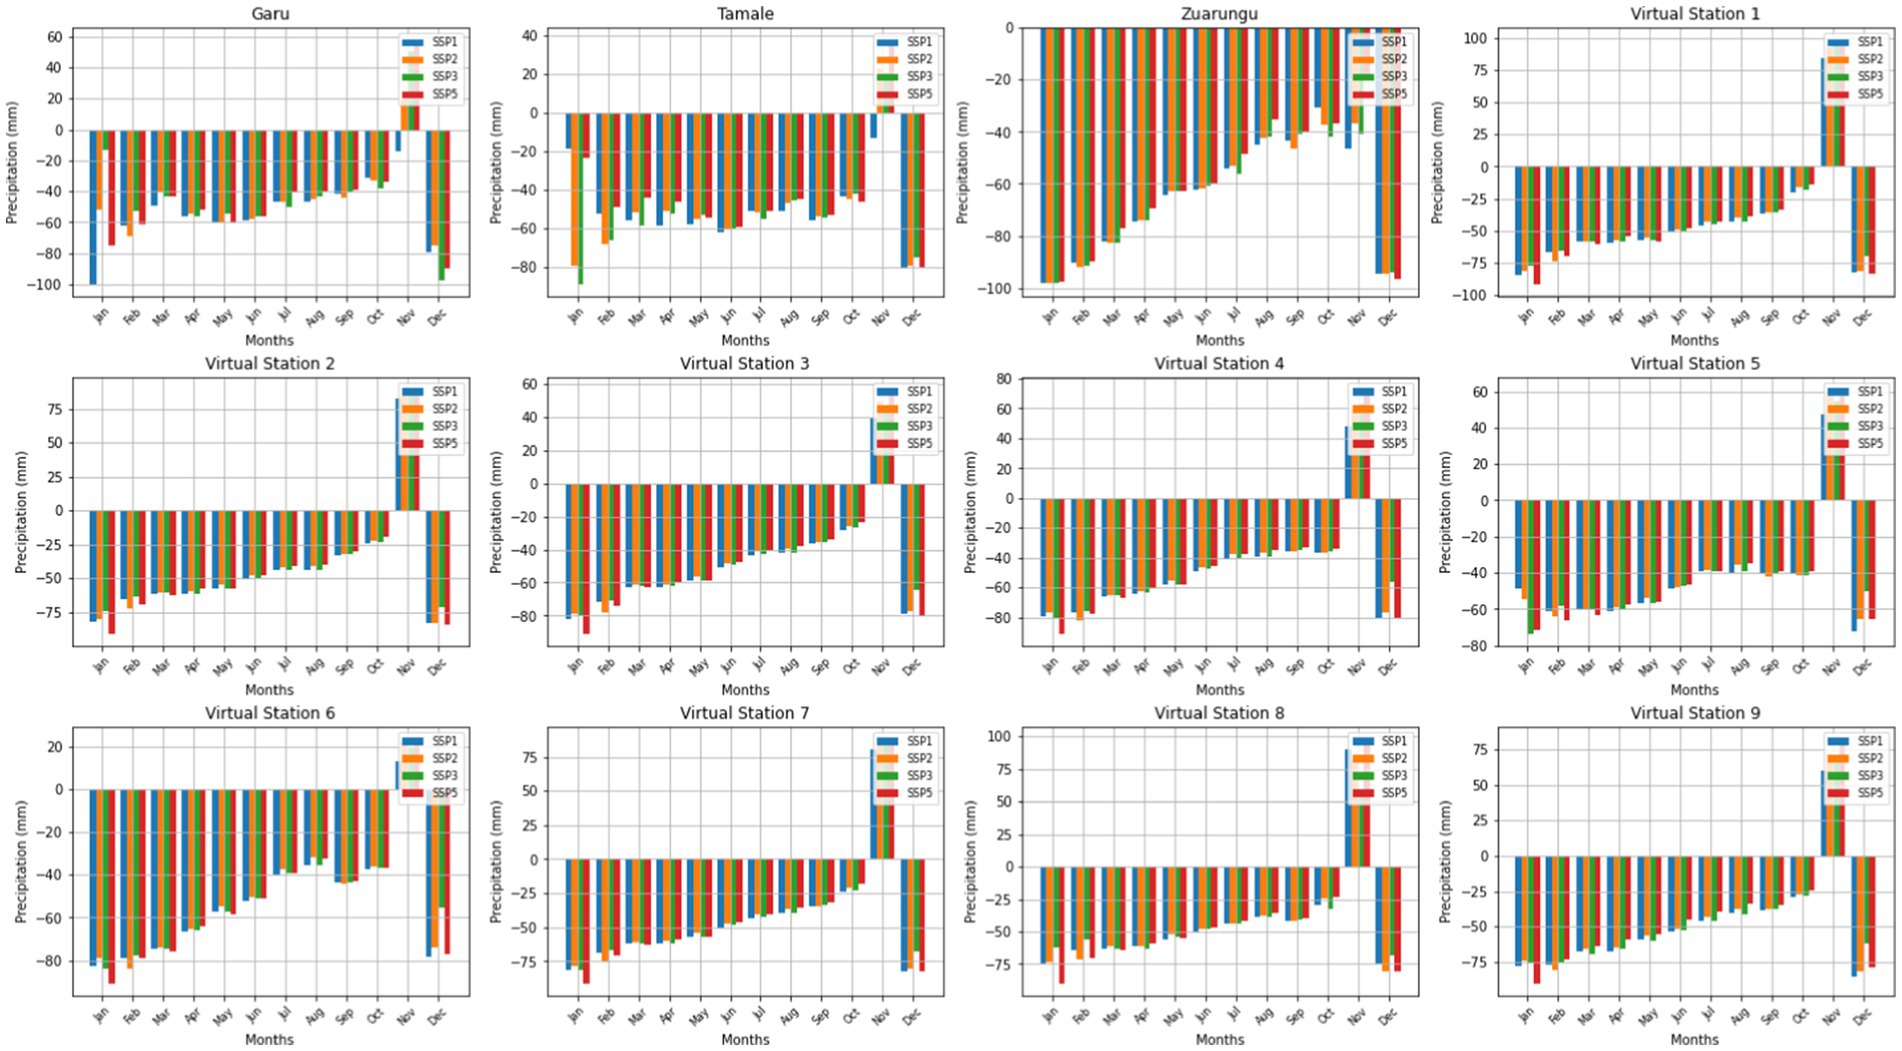
Figure 8. Relative changes in mean monthly precipitation (%) for 2,020–2,039 compared to 1981–2020 and 1960–2015 under SSP scenarios.
Mean monthly precipitation patterns at Tamale and Garu will exhibit temporal and spatial variability. In the 2020s, precipitation is projected to increase at these locations, except in November, which will experience a decrease. However, by the 2050s (Figure 9), mean monthly precipitation will decline across most months, with a slight 10% increase in March at Garu under SSP3-7.0. By the 2080s, precipitation levels will show a mix of increases and decreases across different months. For instance, at Garu, mean monthly precipitation is projected to increase in February, March, July, and December, with particularly notable rises in February (98% increase under SSP5-8.5) and November (20% increase under SSP5-8.5). In contrast, precipitation levels in April, May, and September are expected to decrease under multiple scenarios.
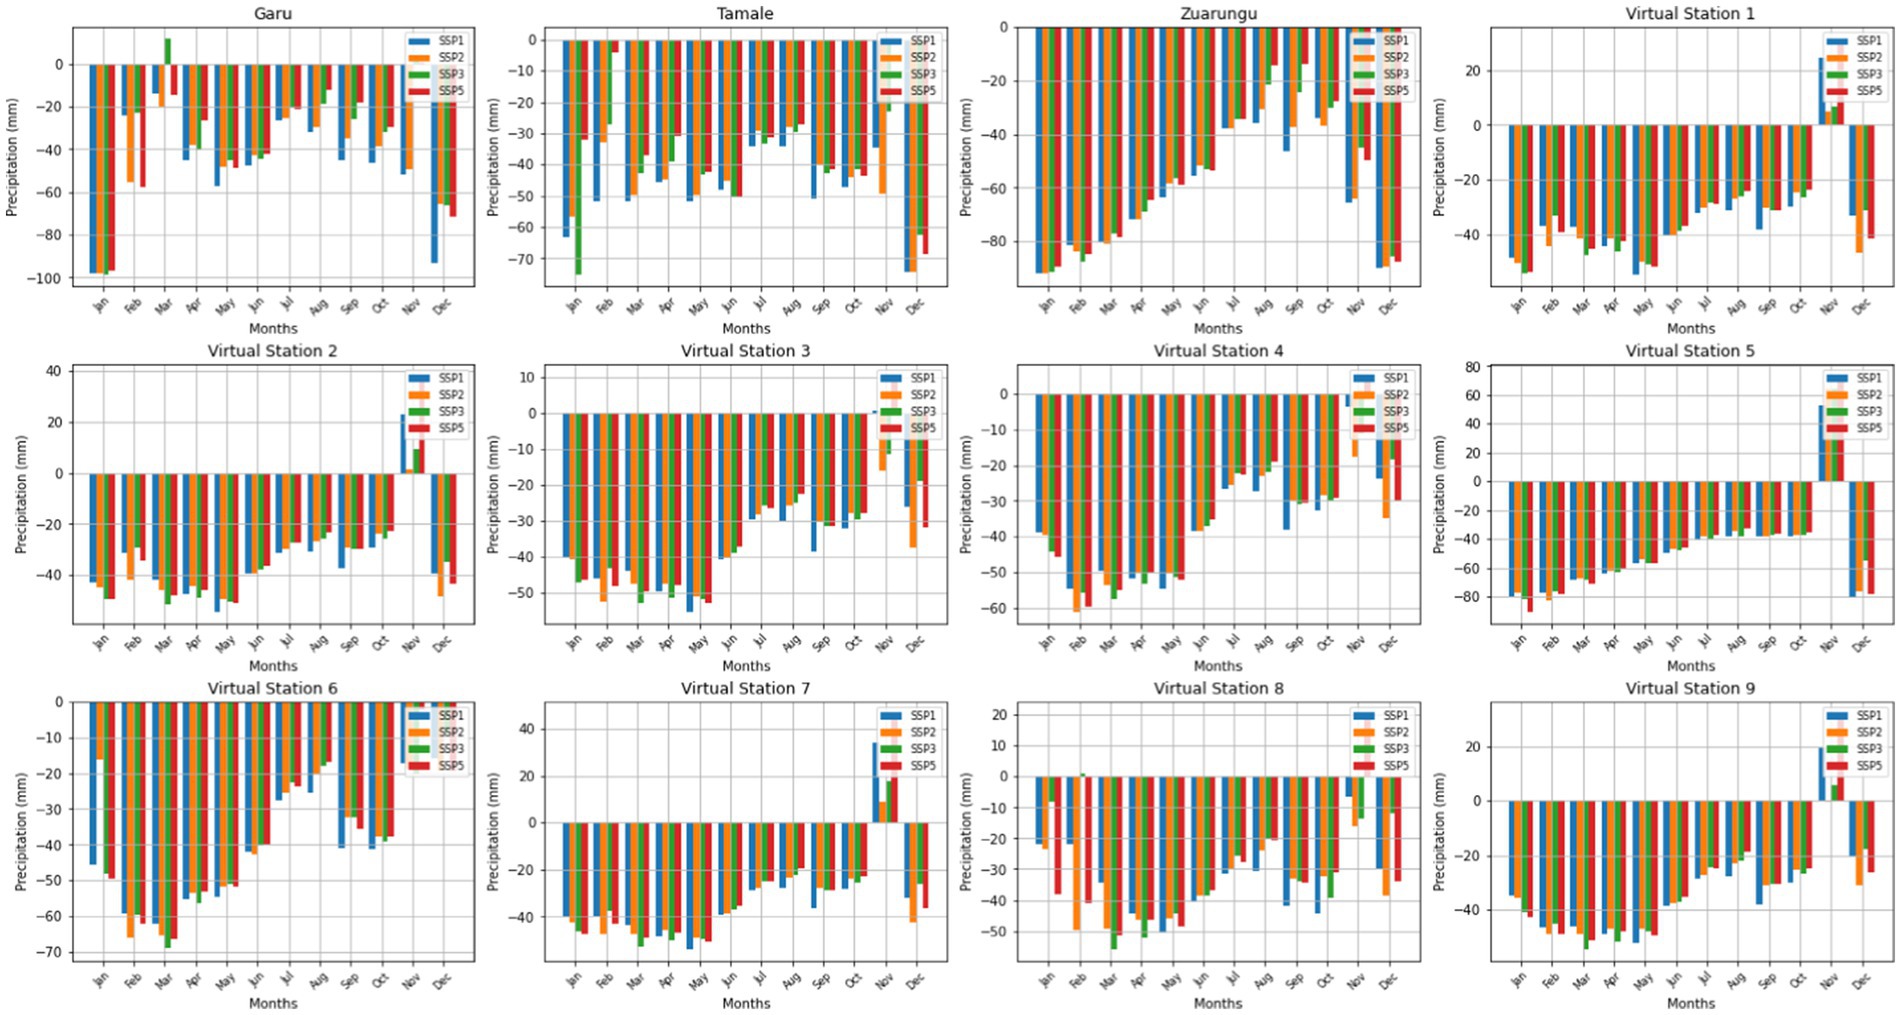
Figure 9. Relative changes in mean monthly precipitation (%) for 2,040–2,069 compared to 1981–2020 and 1960–2015 under SSP scenarios.
These precipitation trends align with broader regional climate projections for West Africa. Sylla et al. (2016) confirm that northern areas like Zuarungu routinely experience reduced mean monthly precipitation under high-emission scenarios, particularly during the rainy season. The short-term rainfall increases observed at Virtual Station 6 in the 2020s align with transitional precipitation patterns noted by Nkrumah et al. (2019). Meanwhile, erratic precipitation trends at Garu and Tamale agree with James et al. (2017), who attribute mid-2050s rainfall variability to shifting air circulation patterns and local–global climatic interactions. Furthermore, as Niang et al. (2014) noted, the significant precipitation increases in February and March in the 2080s under SSP5-8.5 reflect potential shifts in seasonal rainfall patterns, as shown in Figure 10. These changes could have profound implications for water resource management and agriculture, increasing the likelihood of both droughts and floods. The overall decline in mean monthly precipitation under high-emission pathways, as projected by the Masson-Delmotte et al. (2021), underscores the vulnerability of the White Volta Basin to water stress and erratic weather patterns, posing significant threats to livelihoods in the region.
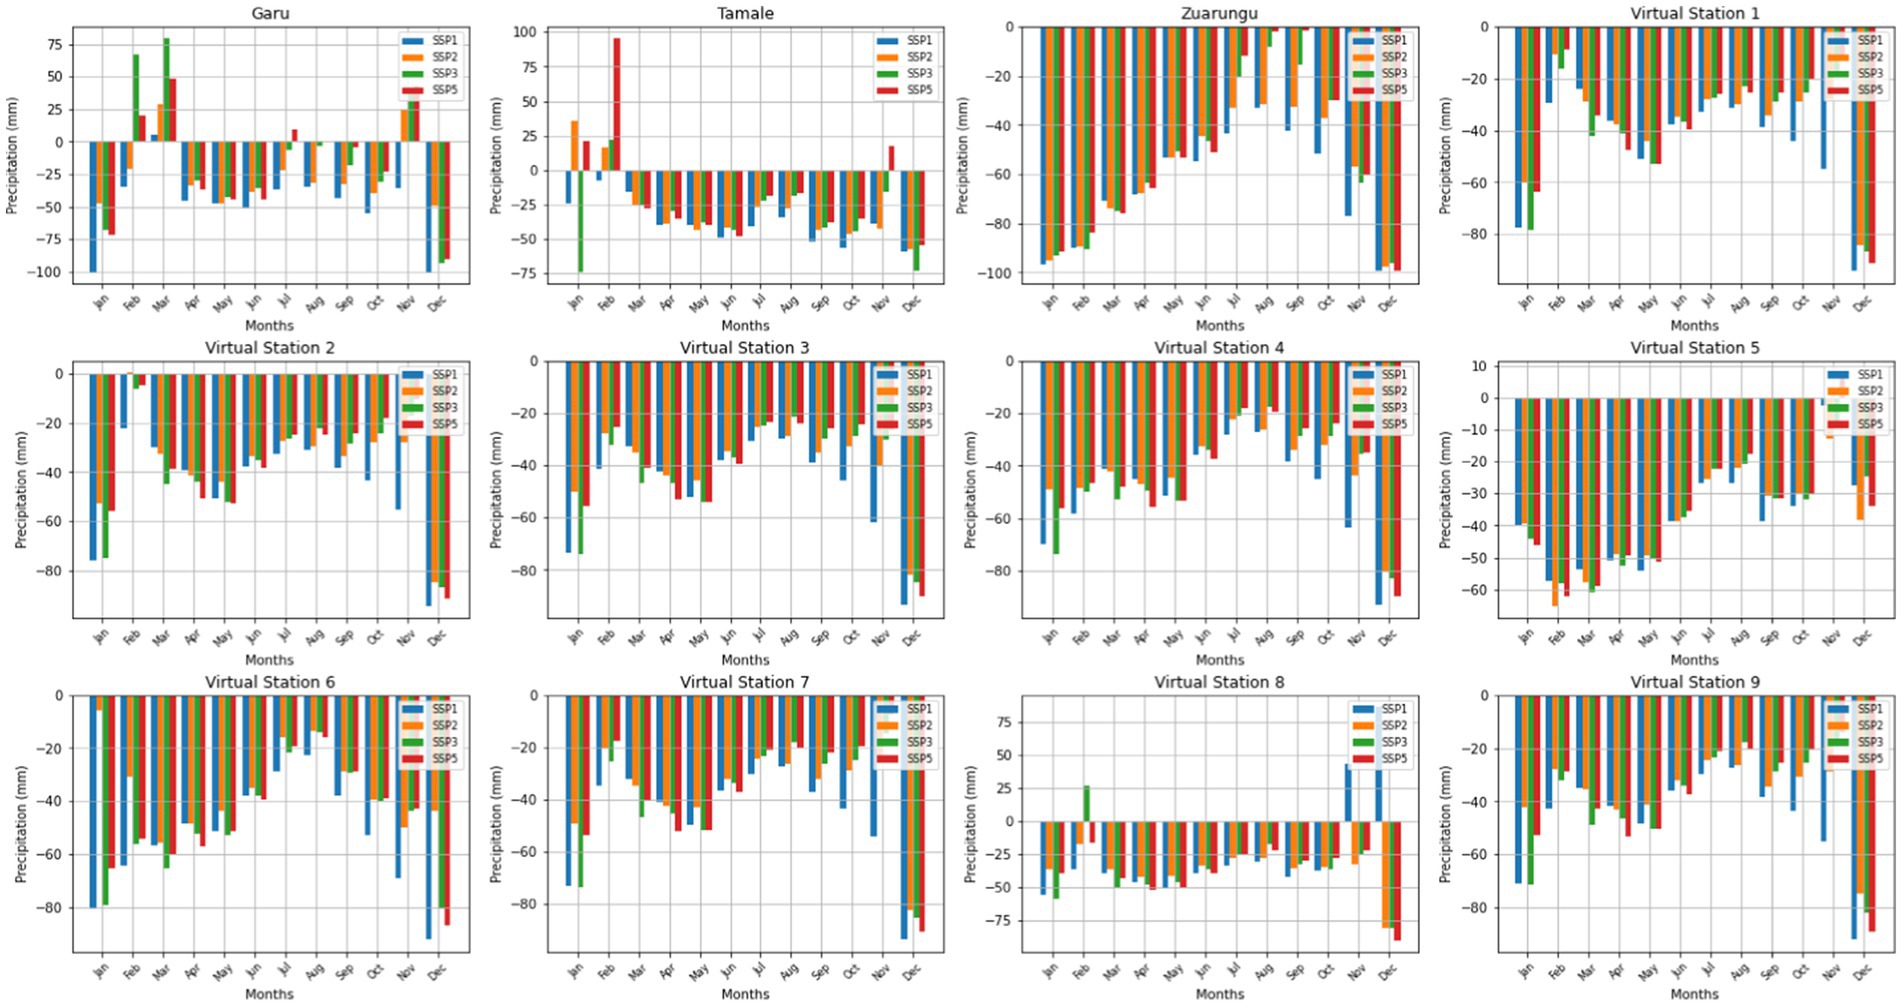
Figure 10. Relative changes in mean monthly precipitation (%) for 2,070–2,100 compared to 1981–2020 and 1960–2015 under SSP scenarios.
3.4 Spatial distribution of precipitation change
The projected precipitation changes across all SSP scenarios and time periods exhibit consistent spatial patterns, as illustrated in Figures 11, 12. The northeastern region of the basin, particularly around Zuarungu, is expected to experience the most significant reductions in precipitation, depicted by deep red colouring. Conversely, the western and southwestern parts of the basin are projected to display more moderate changes, often represented by cooler blue or green tones, indicating smaller decreases or even slight increases in precipitation. The central and southern regions, including Tamale, are anticipated to experience intermediate levels of change, reflecting significant but less extreme variations in precipitation. A temporal trend is evident across all SSP scenarios, with precipitation changes intensifying from the 2020s to the 2080s. In the 2020s, these changes remain relatively mild, with a mix of slight increases and reductions in precipitation. By the 2050s, the spatial patterns become more pronounced, with larger and more widespread reductions in precipitation. The most severe changes are expected by the 2080s, particularly in the northeast, where reductions are projected to be most extreme, highlighting a progressive shift in the basin’s hydrological cycle over time. Each SSP scenario presents distinct spatial patterns of precipitation change. Under SSP2-4.5, projections for the 2080s indicate significant spatial variability, with potential precipitation increases in some western areas (depicted by blue spots) and substantial reductions in the northeast. This scenario suggests that precipitation patterns in the future could become highly localized. In contrast, SSP3-7.0 for the same period presents a more uniform drying trend, with moderate precipitation declines across the basin. Although the northeast still experiences severe reductions, the differences between regions are less pronounced, reflecting a more evenly distributed drying trend. The SSP5-8.5 scenario for the 2080s projects the most severe precipitation declines, particularly in the northeast, indicating widespread and catastrophic reductions in precipitation. This high-emission scenario represents the most intense drying trend across the basin. These findings suggest that the White Volta Basin will face increasingly severe and geographically varied impacts on its hydrological cycle, with the northeast emerging as the most vulnerable under all scenarios. The decline in precipitation, especially under high-emission scenarios, could have significant implications for water availability, agriculture, and livelihoods in the region. The regional distribution of precipitation values and their implications for annual precipitation under different SSP scenarios are illustrated in Figures 13, 14. A significant increase in annual precipitation is projected under SSP5-8.5 compared to SSP1-2.6, SSP2-4.5, and SSP3-7.0, reflecting the impact of varying emission levels across the scenarios. Under SSP1-2.6, Tamale is expected to receive the highest annual precipitation, peaking at 4,972.81 mm/year, while Garu is projected to receive the lowest, with an annual precipitation of 226.39 mm over the 2020s, 2050s, and 2080s. Notably, except for Garu, all stations under SSP1-2.6 are anticipated to experience an increase in annual precipitation levels. SSP2-4.5 forecasts a general decline in annual precipitation across the basin, similar to SSP1-2.6. Despite this decline, Tamale is projected to maintain the highest annual mean precipitation values, with 3,452.85 mm/year in the 2020s, 3,172.91 mm/year in the 2050s, and 2,966.9 mm/year in the 2080s. However, under the worst-case scenario, SSP5-8.5, the lowest annual mean precipitation is projected at Virtual Station 1, with a value of 1,026.79 mm/year by the 2080s. Tamale, which receives the highest precipitation levels under lower-emission scenarios, is expected to record the lowest annual precipitation of 1,572.81 mm/year under SSP5-8.5 in the 2080s. These trends highlight the pronounced variability in precipitation patterns under different emission scenarios, emphasizing the significant hydrological challenges posed by climate change in the White Volta Basin. The severe precipitation declines projected under SSP5-8.5 underscore the urgent need for adaptive water resource management strategies to mitigate the impacts of changing rainfall patterns on agriculture, water availability, and local livelihoods.
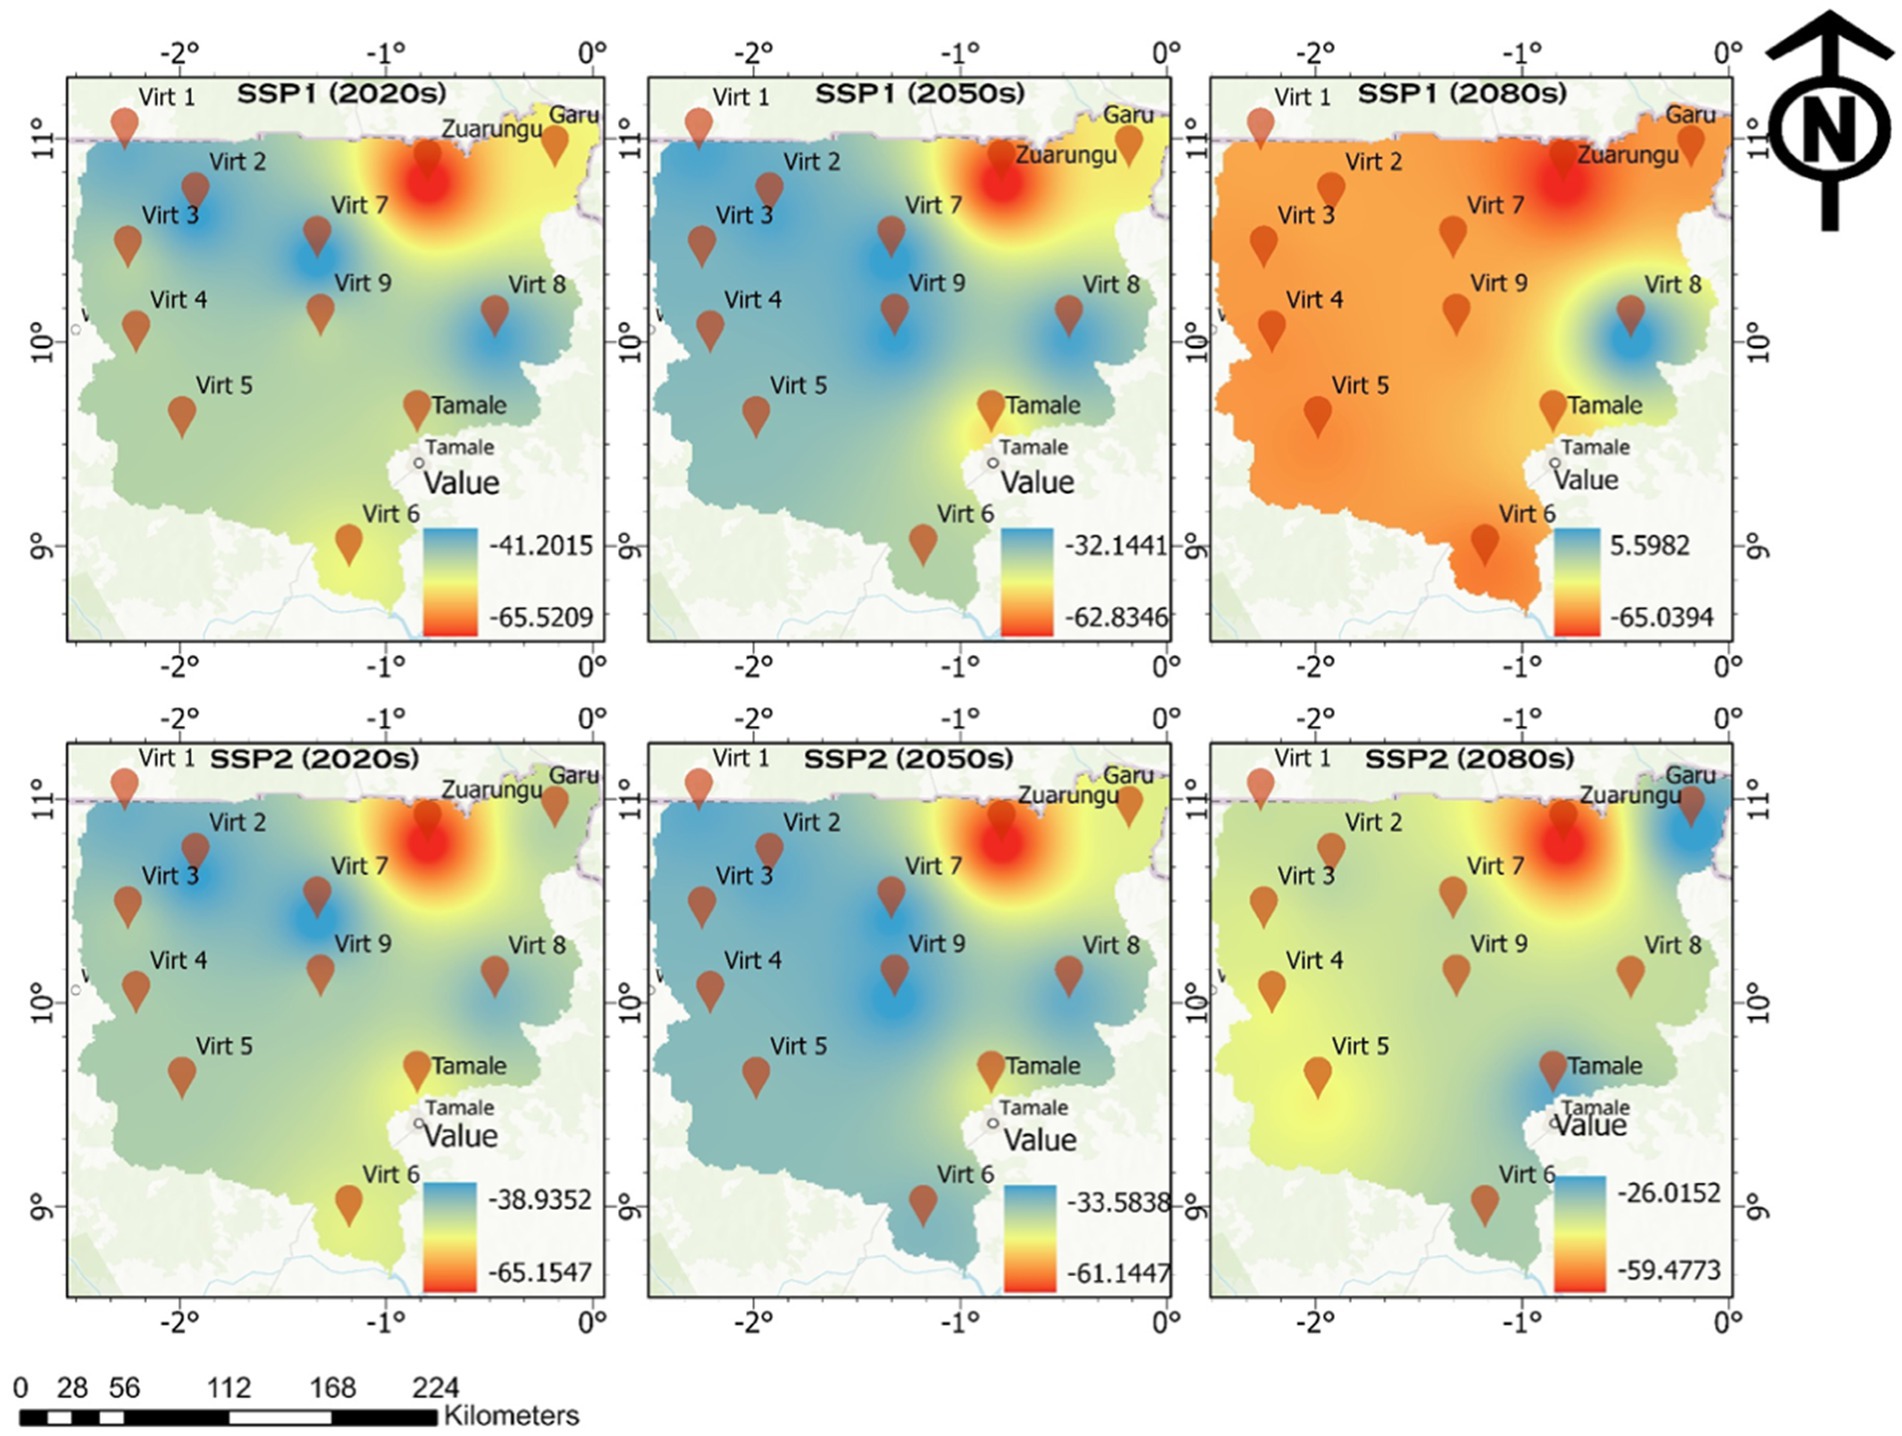
Figure 11. Annual mean precipitation percentage changes under SSP1-2.6 and SSP2-4.5 climate scenarios.
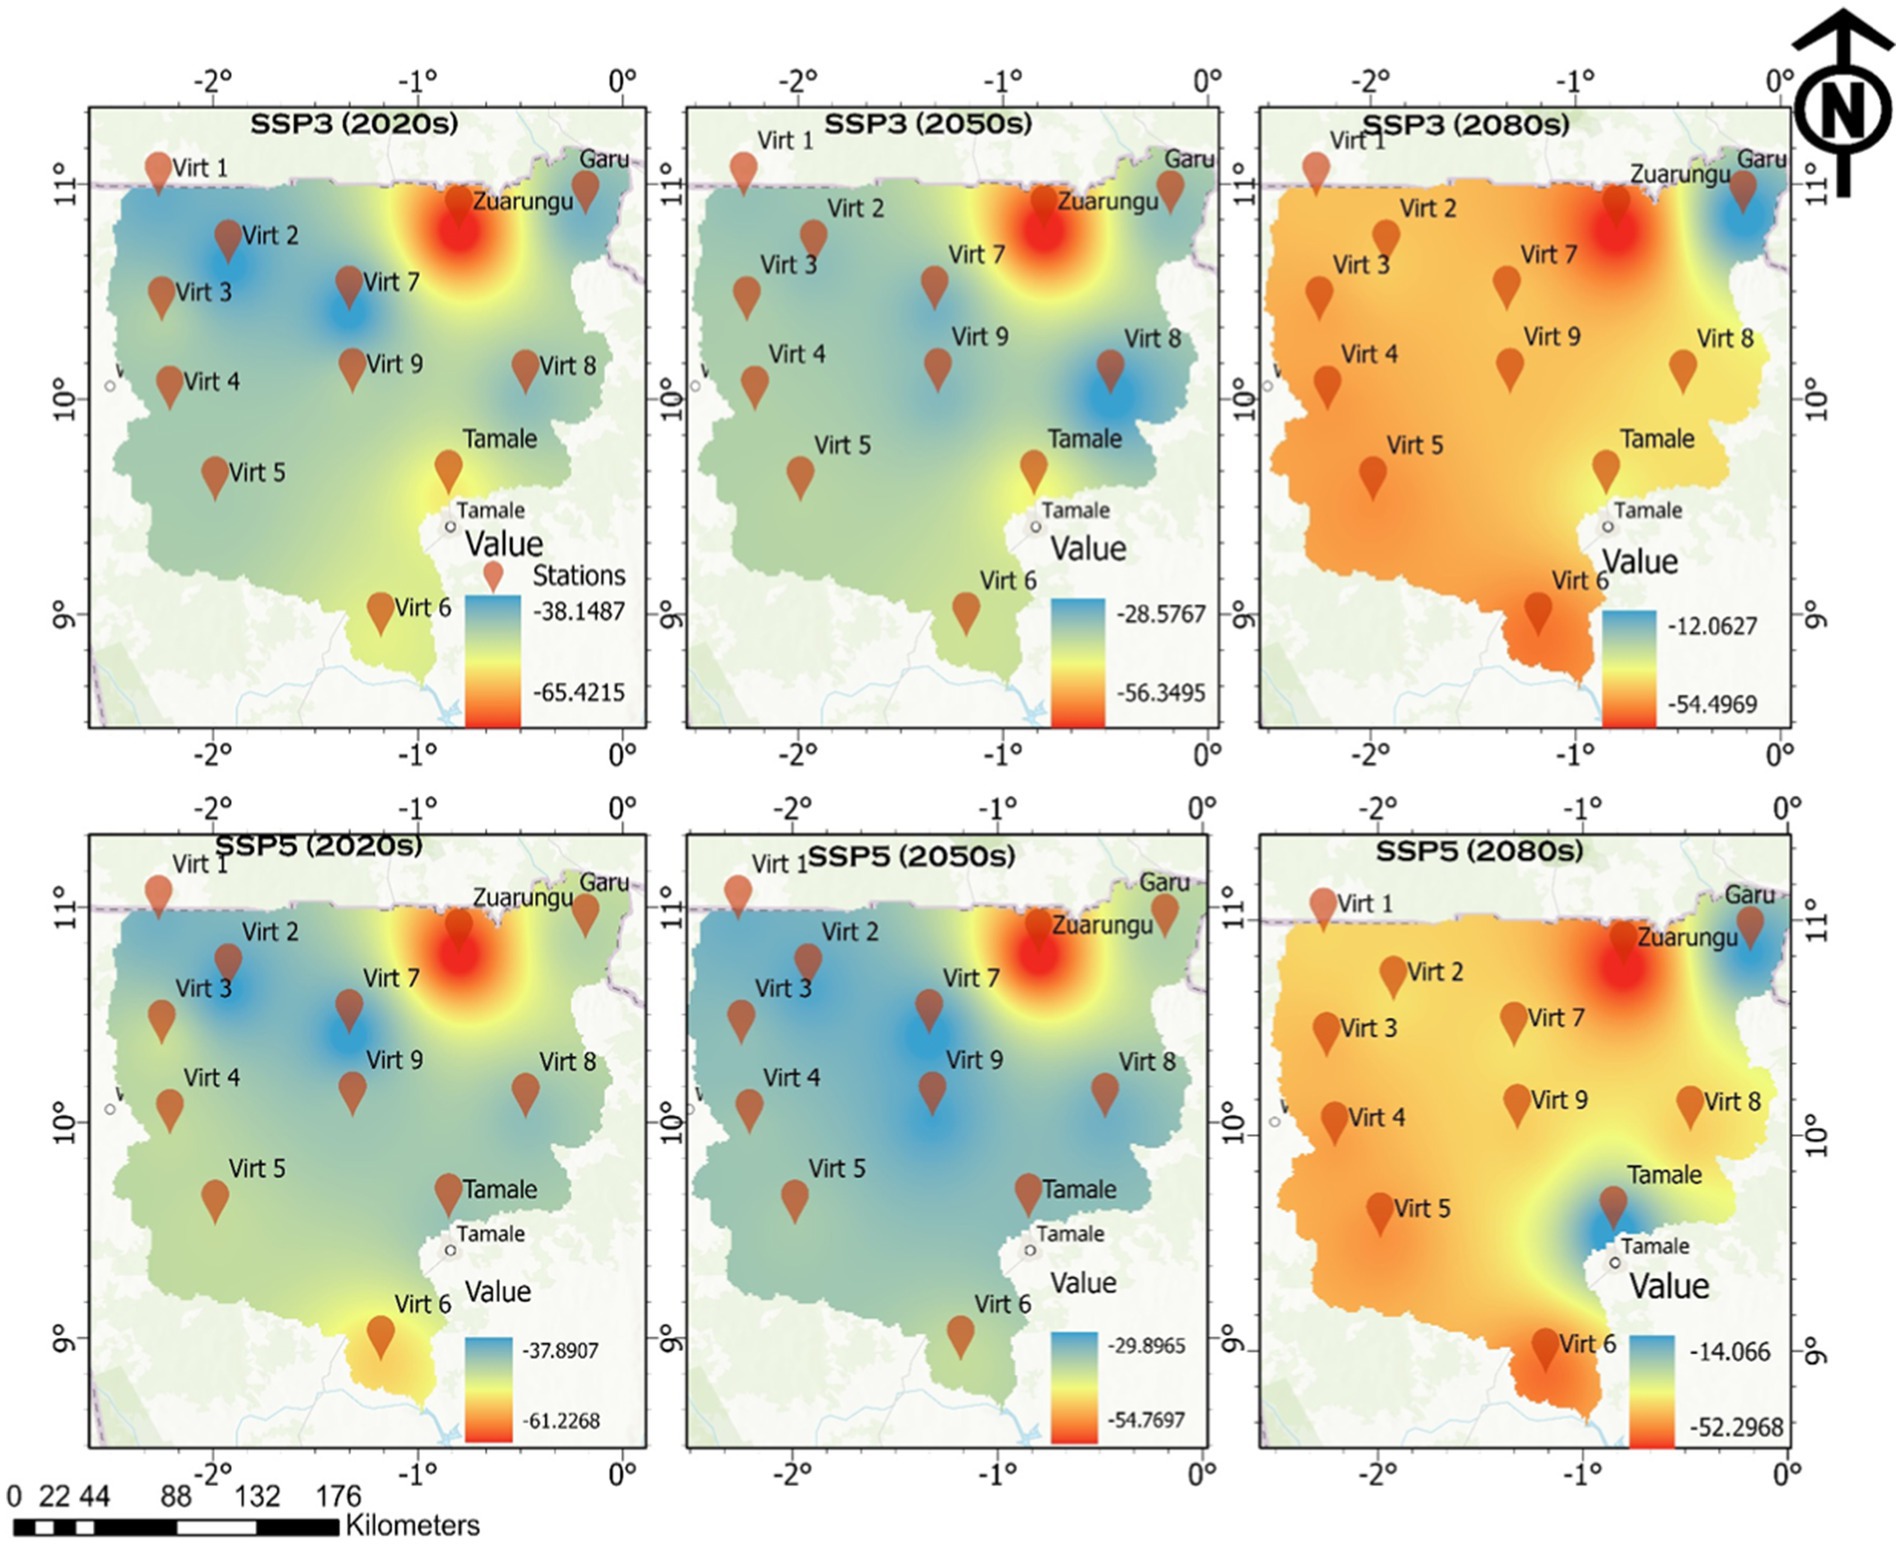
Figure 12. Annual mean precipitation percentage changes under SSP3-4.5 and SSP5-8.5 climate scenarios.
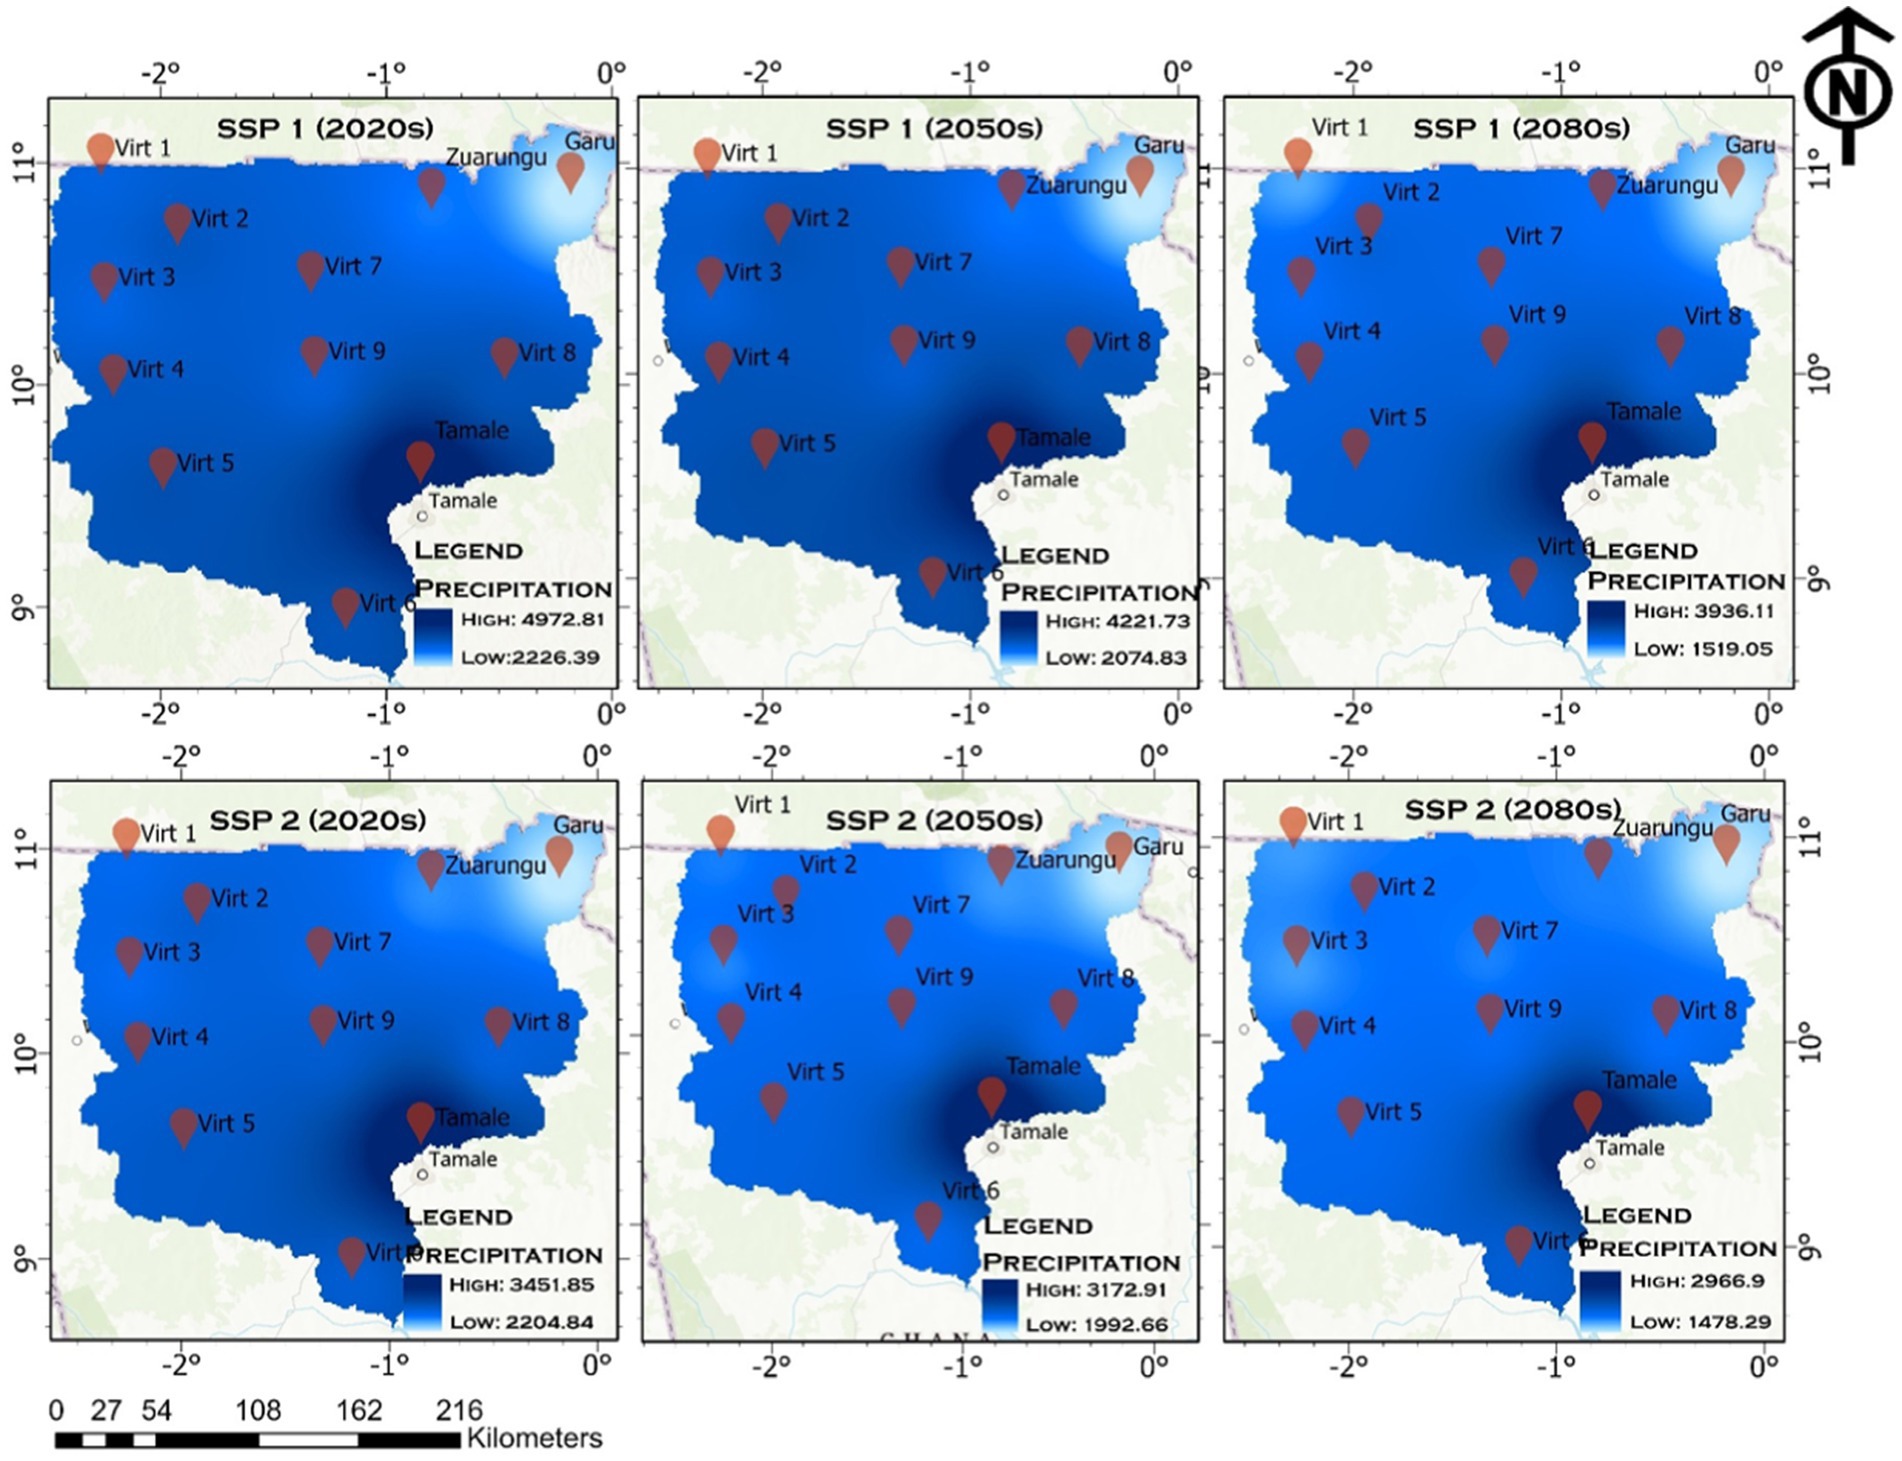
Figure 13. Projected annual precipitation for SSP 1–2.6 and SSP 2–4.5.
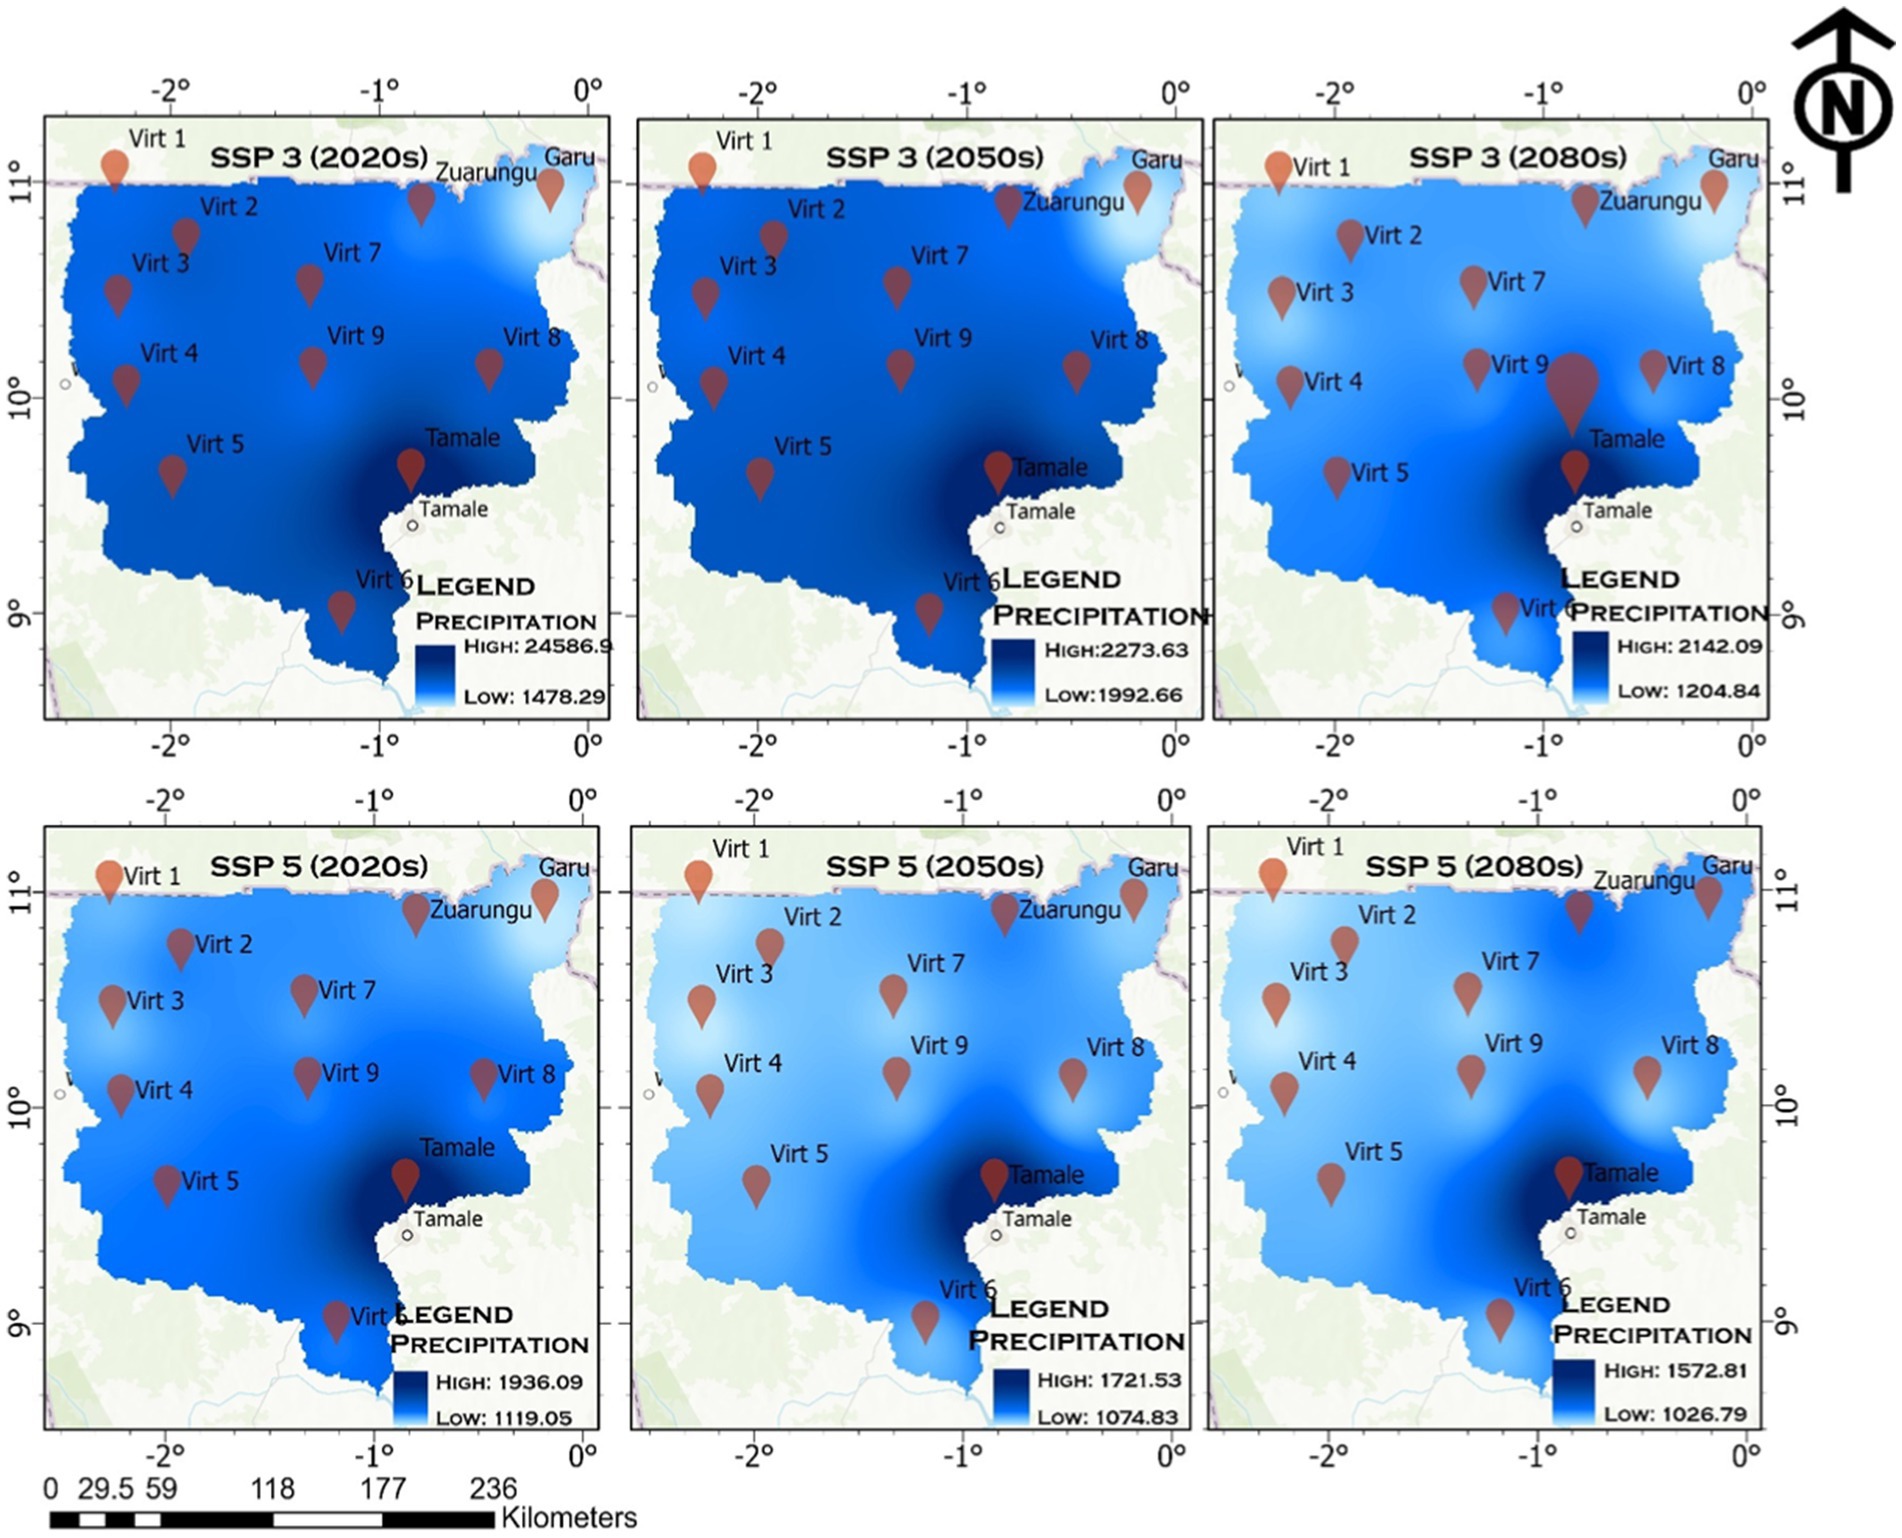
Figure 14. Annual mean precipitation percentage changes: spatiotemporal analysis for SSP3-7.0 and SSP5-8.5.
3.5 Flood susceptibility distribution in the White Volta Basin under the baseline scenario
The flood susceptibility distribution across the White Volta Basin under the baseline scenario, as depicted in Figure 15, highlights regions that are particularly vulnerable to flooding. The analysis reveals that areas with the highest flood susceptibility span approximately 5,957.51 km2, constituting 12.09% of the total basin area. These highly susceptible regions are predominantly located in the northeastern and southern portions of the basin, where topographical and hydrological factors contribute to elevated flood risks. In addition to these highly susceptible zones, areas classified as having high flood susceptibility cover an estimated 11,117.26 km2, accounting for 22.56% of the total basin area. Meanwhile, moderate susceptibility regions extend over 12,008.19 km2, representing 24.38% of the total area. Collectively, these three susceptibility categories indicate that a substantial portion of the basin is at considerable risk of flooding. Conversely, regions classified as having low susceptibility to flooding span approximately 11,998.11 km2, which corresponds to 24.36% of the total basin area. Very low susceptibility areas cover 8,192.61 km2, making up 16.64% of the basin. The regions identified as having high flood susceptibility are strongly associated with low-elevation areas, emphasizing the critical role of topography in influencing flood risk. This spatial distribution of flood susceptibility provides a comprehensive understanding of flood vulnerability across the basin, pinpointing regions that require targeted interventions to mitigate potential flood impacts. The findings underscore the need for strategic flood management efforts, including improved drainage infrastructure, land-use planning, and early warning systems, particularly in the most vulnerable areas.
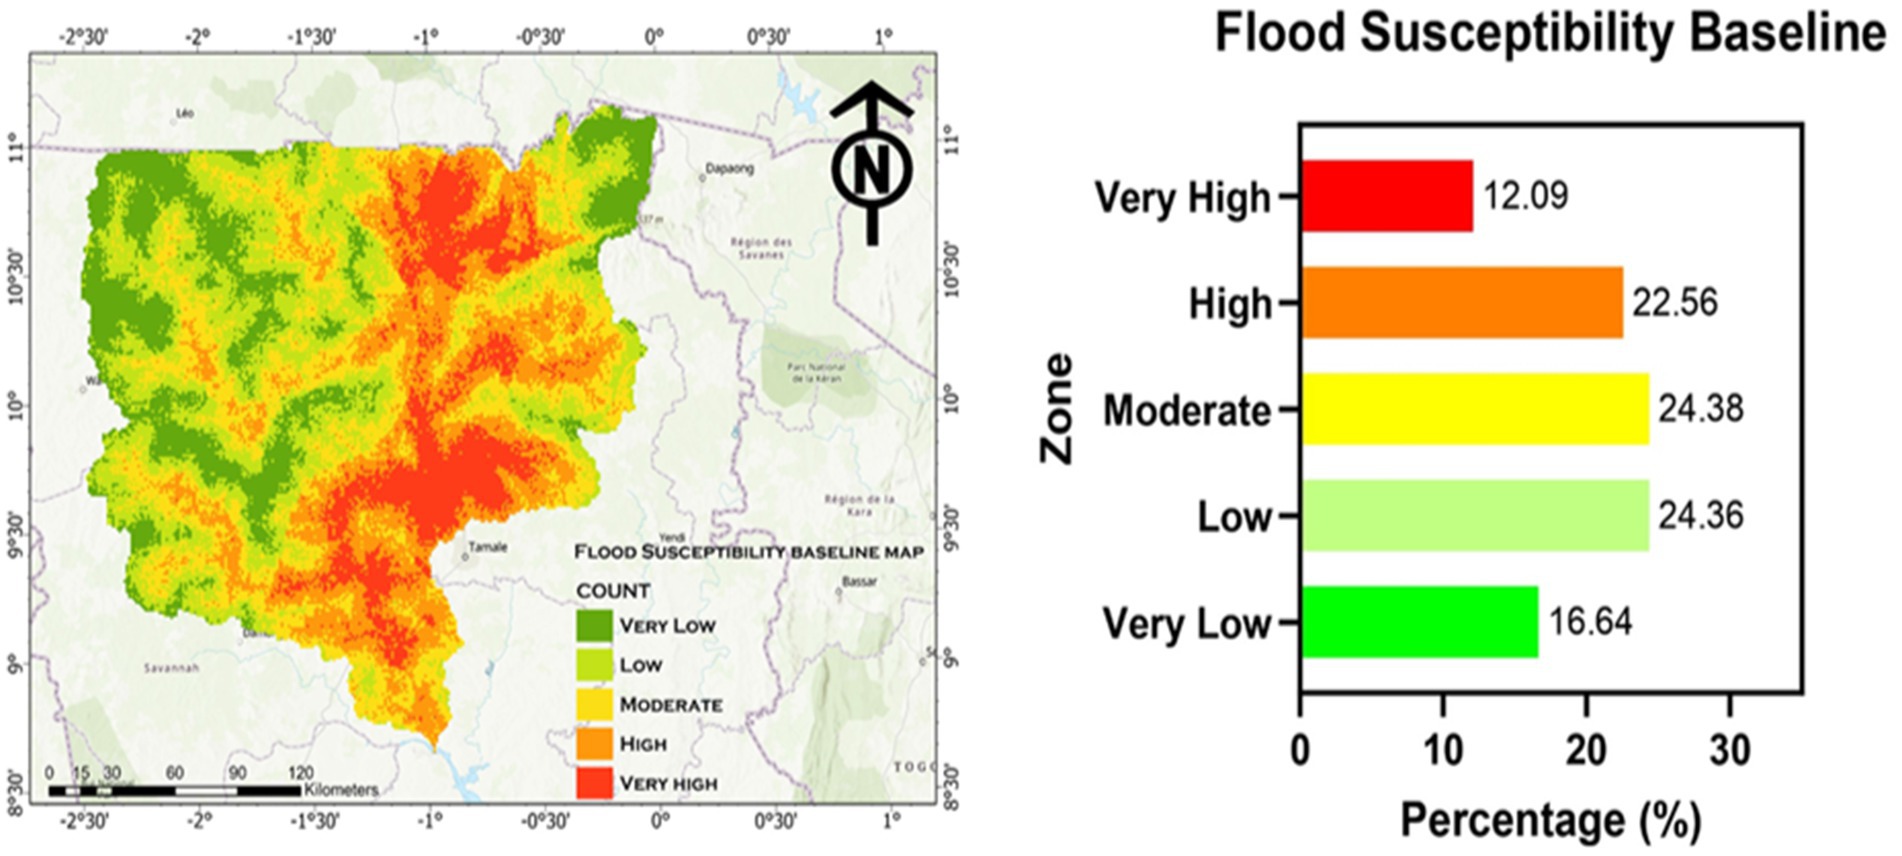
Figure 15. Flood baseline map.
3.6 Flood susceptibility projections under the SSP scenarios
Flood susceptibility projections for the White Volta Basin under various SSP scenarios (SSP1, SSP2, SSP3, and SSP5) across the 2020s, 2050s, and 2080s are illustrated in Figures A, B in the Supplementary materials. The findings reveal that low-lying and coastal areas, particularly around Tamale and Zuarungu, remain highly vulnerable to flooding. However, the degree of susceptibility varies across scenarios, reflecting differences in emission pathways and adaptation measures. Under SSP1, which emphasizes sustainability and effective environmental management, very high flood susceptibility zones accounted for 11.52% of the basin in the 2020s. This percentage gradually declines to 9.98% by the 2080s, as shown in Figures A in the Supplementary materials. The prevalence of low and moderate flood risk zones covering over 50% of the basin suggests a trend toward risk reduction with sustainable water and land-use management. SSP2, which follows a moderate mitigation pathway, shows a lower initial very high-risk zone at 8.48%, decreasing slightly to 7.74% by the 2080s. However, moderate-risk zones remain prominent, emphasizing the need for consistent flood mitigation efforts to prevent escalating risks. SSP3, representing a fragmented world with minimal cooperation on climate adaptation, exhibits the lowest proportion of very high flood susceptibility areas. These zones account for 6.24% in the 2020s, decreasing further to 5.29% by the 2080s. The dominance of low and moderate flood risk zones suggests that while extreme flood risks may decrease, widespread moderate risks persist due to inadequate infrastructure improvements and limited adaptation efforts. Under SSP5, characterized by rapid economic growth driven by fossil-fuelled development, very high flood susceptibility zones are initially the smallest among all scenarios, at 4.32% in the 2020s, dropping to 3.12% by the 2080s. However, moderate-risk zones remain widespread, indicating persistent flooding challenges despite overall reductions in extreme flood susceptibility. Overall, the projections highlight that while extreme flood risks may decline across all scenarios, moderate flood risks continue to pose significant threats to the White Volta Basin. This underscores the necessity of effective flood management strategies, particularly in moderate-risk areas, to enhance resilience and adapt to future climate conditions. SSP1 demonstrates the greatest potential for long-term flood risk reduction through sustainability initiatives, while SSP2 and SSP3 produce mixed outcomes. SSP5, despite achieving the lowest extreme risk levels, still faces notable challenges due to the persistence of moderate flood susceptibility zones.
3.7 Model validation outcome
The Area Under the Receiver Operating Characteristic Curve (AUC) for the baseline flood susceptibility map, evaluated using ArcSDM (Arc Spatial Decision Maker), was determined to be 0.795, as illustrated in Figure D in the Supplementary materials. This outcome indicates that the model exhibits a moderate to great ability to forecast flood susceptibility across the study area. An AUC value of 0.795 signifies a fair degree of discriminating power, meaning that the model correctly distinguishes between flood-prone and non-flood-prone locations with a 79.5% probability. Comparing this result with similar studies in West Africa and other flood-prone regions highlights the model’s relative performance. For instance, Acheampong (2021) applied an AHP-based flood susceptibility model in the Pra Basin, Ghana, achieving an AUC of 0.78, which is comparable to this study’s result. Similarly, Ouma and Tateishi (2014) obtained an AUC of 0.80 in a study on flood hazard mapping in Kenya using remote sensing and GIS-based multi-criteria analysis. These findings suggest that the performance of this model is consistent with or slightly better than those applied in similar geographical and hydrological contexts. This level of accuracy suggests that the model is a reliable tool for assessing flood risk, as it effectively identifies areas with high susceptibility to flooding.
4 Discussion
The flood susceptibility analysis of the White Volta Basin provides crucial insights into the region’s flood risk dynamics under both baseline conditions and projected climate scenarios. Under the baseline scenario, 12.09% of the basin, particularly in the northeast and southern parts, is classified as highly susceptible to flooding. This finding aligns with existing studies emphasizing the role of topography in flood risk, where low-lying areas near water bodies exhibit greater vulnerability due to their elevation and proximity to rivers (Nguyen et al., 2021; Odoh and Nwokeabia, 2024). The results highlight the significance of hydrological parameters, such as slope and elevation, in flood risk assessments (Dottori et al., 2016). Projections under the Shared Socioeconomic Pathways (SSPs) suggest potential shifts in flood susceptibility over time. The SSP1 scenario, which emphasizes sustainable development, predicts a decline in very high susceptibility zones from 11.52% in the 2020s to 9.98% by the 2080s, demonstrating the positive impact of sustainable land and water management. In contrast, the SSP5 scenario, characterized by fossil-fuelled development, indicates reduced susceptibility in highly urbanized areas but highlights the paradox of persistent flooding risks due to broader climate change impacts (Ritchie et al., 2020). The SSP3 scenario, representing a fragmented world with weak governance, exhibits the most substantial decrease in very high flood susceptibility zones, reaching 5.29% by the 2080s. However, this decline is accompanied by governance challenges and resource misallocation, which exacerbate vulnerabilities in low and moderate-risk areas (Mastrorillo et al., 2016). Despite the variations across SSPs, moderate and low susceptibility zones remain widespread, posing ongoing risks to communities, agriculture, and infrastructure (Brouwer et al., 2018). The validation of the flood susceptibility model, with an AUC score of 0.795, confirms its predictive reliability. This outcome demonstrates the model’s effectiveness in identifying flood-prone areas and reinforces its potential as a tool for guiding flood risk mitigation strategies (Fouladi Semnan et al., 2024). Spatial analysis reveals that regions along the White Volta River, particularly those characterized by flat slopes and low elevations, remain highly vulnerable to flooding. These findings corroborate previous research emphasizing the heightened flood risk in such areas (Sofa and Nikolopoulos, 2020; Ullah and Zhang, 2020). Overall, the study underscores the necessity for integrated flood risk management approaches that balance sustainable development with environmental considerations. Effective strategies should not only target high-risk zones but also address persistent threats in moderate-susceptibility areas, ensuring long-term resilience against future flooding scenarios.
5 Conclusion
The flood susceptibility analysis of the White Volta Basin provides crucial insights into flood risk dynamics under both baseline conditions and future projections. Under the baseline scenario, 12.09% of the basin, primarily in the northeast and southern regions, is classified as highly susceptible to flooding. This finding is consistent with studies emphasizing the influence of topography, where low-lying areas near water bodies are particularly vulnerable due to their elevation and proximity to rivers (Nguyen et al., 2021; Odoh and Nwokeabia, 2024). The study underscores the importance of hydrological parameters such as slope and elevation in assessing flood risk (Dottori et al., 2016).
Projections under the Shared Socioeconomic Pathways (SSPs) highlight potential shifts in flood susceptibility across different future scenarios. The SSP1 scenario, which emphasizes sustainable development, predicts a decrease in very high susceptibility zones from 11.52% in the 2020s to 9.98% by the 2080s, demonstrating the benefits of proactive water and land-use management strategies (Noble et al., 2015). Conversely, the SSP5 scenario shows reduced susceptibility in highly urbanized regions but underscores the paradox of persistent flooding risks driven by climate change’s broader impacts (Ritchie et al., 2020). The SSP3 scenario, which represents a fragmented world with weak governance, exhibits the most substantial decline in very high flood susceptibility zones, reaching 5.29% by the 2080s. However, this reduction is tempered by governance challenges and resource misallocation, which exacerbate vulnerabilities in low and moderate-risk areas (Mastrorillo et al., 2016). Despite variations across SSPs, moderate and low susceptibility zones remain widespread, posing ongoing risks to communities, agriculture, and infrastructure (Brouwer et al., 2018). The validation of the flood susceptibility model, with an AUC score of 0.795, confirms its predictive reliability. This outcome demonstrates the model’s effectiveness in identifying flood-prone areas and reinforces its potential as a valuable tool for guiding flood risk mitigation strategies (Chafjiri et al., 2024). Spatial analysis reveals that regions along the White Volta River, particularly those characterized by flat slopes and low elevations, remain highly vulnerable to flooding. These findings align with previous research that highlights the increased flood risk in such areas (Sofa and Nikolopoulos, 2020; Ullah and Zhang, 2020). This study underscores the urgent need for integrated flood risk management strategies that balance sustainable development with environmental considerations. Effective flood mitigation measures should not only target high-risk zones but also address persistent threats in moderate-susceptibility areas, ensuring long-term resilience against future flooding scenarios.
Data availability statement
The raw data supporting the conclusions of this article will be made available by the authors, without undue reservation.
Author contributions
AK: Methodology, Resources, Supervision, Writing – review & editing. NC: Conceptualization, Formal analysis, Methodology, Visualization, Writing – original draft, Writing – review & editing. ES: Formal analysis, Methodology, Supervision, Visualization, Writing – original draft, Writing – review & editing. SS: Formal analysis, Methodology, Writing – original draft, Writing – review & editing. WA: Formal analysis, Methodology, Writing – original draft, Writing – review & editing.
Funding
The author(s) declare that no financial support was received for the research and/or publication of this article.
Conflict of interest
The authors declare that the research was conducted in the absence of any commercial or financial relationships that could be construed as a potential conflict of interest.
Generative AI statement
The author(s) declare that no Gen AI was used in the creation of this manuscript.
Publisher’s note
All claims expressed in this article are solely those of the authors and do not necessarily represent those of their affiliated organizations, or those of the publisher, the editors and the reviewers. Any product that may be evaluated in this article, or claim that may be made by its manufacturer, is not guaranteed or endorsed by the publisher.
Supplementary material
The Supplementary material for this article can be found online at: https://www.frontiersin.org/articles/10.3389/fclim.2025.1564665/full#supplementary-material
References
Abass, K. (2022). Rising incidence of urban floods: understanding the causes for flood risk reduction in Kumasi, Ghana. Geo J. 87, 1367–1384. doi: 10.1007/s10708-020-10319-9
Acheampong, C. (2021). Climatic projections of Western India using global and regional climate models. Water Pract. Technol. PAUWES Repository. Available at: Available: http://repository.pauwes-cop.net/handle/1/447
Agustí-Panareda, A., Beljaars, A., Ahlgrimm, M., Balsamo, G., Bock, O., Forbes, R., et al. (2010). The ECMWF re-analysis for the AMMA observational campaign. Q. J. R. Meteorol. Soc. 136, 1457–1472. doi: 10.1002/qj.662
Antwi-Agyei, P., Dougill, A. J., Stringer, L. C., and Codjoe, S. N. A. (2018). Adaptation opportunities and maladaptive outcomes in climate vulnerability hotspots of northern Ghana. Clim. Risk Manag. 19, 83–93. doi: 10.1016/j.crm.2017.11.003
Atanga, R. A., and Tankpa, V. (2021). Climate change, flood disaster risk and food security nexus in northern Ghana. Front. Sustain. Food Syst. 5:706721. doi: 10.3389/fsufs.2021.706721
Bessah, E., Boakye, E. A., Agodzo, S. K., Nyadzi, E., Larbi, I., and Awotwi, A. (2021). Increased seasonal rainfall in the twenty-first century over Ghana and its potential implications for agriculture productivity. Environment, Development and Sustainability, 23, 12342–12365. doi: 10.1007/s10668-020-01171-5
Brouwer, R., Koundouri, P., Linderhof, V., Birol, E., and Ansink, E.. (2018). Evaluating the impact of climate change on flood risk in the European Union: A comparative analysis. Environ. Sci. Pol. 83, 1–11. doi: 10.1016/j.envsci.2018.01.001
Chafjiri, A. S., Gheibi, M., Chahkandi, B., Eghbalian, H., Waclawek, S., Fathollahi-Fard, A. M., et al. (2024). Enhancing flood risk mitigation by advanced data-driven approach. Heliyon 10:e37758.. doi: 10.1016/j.heliyon.2024.e37758
Das, S. (2022). GIS-based flood susceptibility mapping using ensemble machine learning algorithms and fuzzy analytic hierarchy process in the Himalayan foothills region of India. Environmental Earth Sciences, 81, 491. doi: 10.1007/s12665-022-10543-1
Dottori, F., Salamon, P., Bianchi, A., Alfieri, L., Hirpa, F. A., and Feyen, L. (2016). Global flood hazard mapping: A review of the current state of knowledge. J. Flood Risk Manag. 9, 1–11. doi: 10.1111/jfr3.12109
Elkhrachy, I. (2015). Flash flood hazard mapping using satellite images and GIS tools: a case study of Najran City, Kingdom of Saudi Arabia (KSA). Egypt. J. Remote Sens. Space Sci. 18, 261–278. doi: 10.1016/j.ejrs.2015.06.007
Enayati, M., Bozorg-Haddad, O., Bazrafshan, J., Hejabi, S., and Chu, X. (2021). Bias correction capabilities of quantile mapping methods for rainfall and temperature variables. J. Water Clim. Change 12, 401–419. doi: 10.2166/wcc.2020.261
Eyring, V., Bony, S., Meehl, G. A., Senior, C. A., Stevens, B., Stouffer, R. J., et al. (2016). Overview of the Coupled Model Intercomparison Project Phase 6 (CMIP6) experimental design and organization. Geoscientific Model Development, 9, 1937–1958. doi: 10.5194/gmd-9-1937-2016
Fouladi Semnan, A., Maqsood, T., and Venkatesan, S. (2024). Applying Machine Learning Techniques to Identify Key Factors Motivating Flood-Prone Residents to Implement Private Flood Mitigation Measures. Natural Hazards Review 25:04024026. doi: 10.1061/NHREFO.NHENG-1928
Gebrechorkos, S., Leyland, J., Slater, L., Wortmann, M., Ashworth, P. J., and Bennett, G. L.. (2023). A high-resolution daily global dataset of statistically downscaled CMIP6 models for climate impact analyses. Scientific Data 10:611. doi: 10.1029/2022EF003011
Grose, M. R., Narsey, S., Delage, F. P., Dowdy, A. J., Bador, M., Boschat, G., et al. (2020). Insights from CMIP6 for Australia's future climate. Earth's Fut. 8:e2019EF001469. doi: 10.1029/2019EF001469
Hersbach, H., Bell, B., Berrisford, P., Hirahara, S., Horányi, A., Muñoz-Sabater, J., et al. (2020). The ERA5 global reanalysis. Quarterly Journal of the Royal Meteorological. Society, 146, 1999–2049. doi: 10.1002/qj.3803
Hu, P., Zhang, Q., Shi, P., Chen, B., and Fang, J. (2018). Flood-induced mortality across the globe: spatiotemporal pattern and influencing factors. Sci. Total Environ. 643, 171–182. doi: 10.1016/j.scitotenv.2018.06.197
James, R., Washington, R., Schleussner, C. F., Rogelj, J., and Conway, D.. (2017). Characterizing half‐a‐degree difference: a review of methods for identifying regional climate responses to global warming targets. Wiley Interdisciplinary Reviews: Climate Change 82:e457. doi: 10.1002/wcc.457
Kankam-Yeboah, K., Obuobie, E., Amisigo, B., and Opoku-Ankomah, Y. (2013). Impact of climate change on streamflow in selected river basins in Ghana. Hydrol. Sci. J. 58, 773–788. doi: 10.1080/02626667.2013.782101
Klutse, A. (2022). Integrating Flood and Drought Management and Early Warning for Adaptation to climate change in the Volta Basin (VFDM): Assessment of plans, policies, and guidelines related to the long-term management of floods and drought in the Voltwa Basin existing at t. 6, 1–40.
Knutti, R., Furrer, R., Tebaldi, C., Cermak, J., and Meehl, G. A. (2010). Challenges in combining projections from multiple climate models. Journal of Climate 23. doi: 10.1007/s42452-020-3095-3
Masson-Delmotte, V., Zhai, P., Pirani, A., Connors, S. L., Péan, C., Berger, S., et al. (2021). (Eds.). Summary for Policymakers. In: Climate Change 2021: The Physical Science Basis. Contribution of Working Group I to the Sixth Assessment Report of the Intergovernmental Panel on Climate Change. IPCC, pp., 3–32. doi: 10.1017/9781009157896.001
Mastrorillo, M., Licker, R., Bohra-Mishra, P., Fagiolo, G., Estes, L. D., Oppenheimer, M., et al. (2016). Governance and flood risk management in urban areas: lessons from the Netherlands. Int. J. Dis. Risk Reduct. 16, 165–174. doi: 10.1016/j.gloenvcha.2016.04.014
Mensah, H., and Ahadzie, D. K. (2020). Causes, impacts and coping strategies of floods in Ghana: a systematic review. SN Appl. Sci. 2, 1–13. doi: 10.1007/s42452-020-2548-z
Mensah, J. K., Akpoti, K., Antwi-Ofosu, E., Kabo-bah, A. T., Siabi, E. K., Asare, A., et al. (2024). Evaluating climate change scenarios in the White Volta Basin: A statistical bias-correction approach. Physics and Chemistry of the Earth, Parts A/B/C, 134:103584. doi: 10.1016/j.pce.2024.103584
Mesta, B., Akgun, O. B., and Kentel, E. (2024). Improving precipitation estimates for Turkey with multimodel ensemble: a comparison of nonlinear artificial neural network method with linear methods. Neural Comput. Applic., 36:1–20. doi: 10.1007/s00521-024-09598-x
Nguyen, T.T., Nakatsugawa, M., Yamada, T. J., and Hoshino, T.. (2021). Flood inundation assessment in the low-lying river basin considering extreme rainfall impacts and topographic vulnerability. Water, 13, 896. doi: 10.3390/w13070896
Niang, I., Ruppel, O. C., Abdrabo, M. A., Essel, A., Lennard, C., Padgham, J., et al. (2014). “Africa” in Climate change 2014: Impacts, adaptation, and vulnerability. Part B: Regional aspects. Contribution of working group II to the fifth assessment report of the intergovernmental panel on climate change. eds. V. R. Barros, C. B. Field, D. J. Dokken, M. D. Mastrandrea, K. J. Mach, and T. E. Bilir (Cambridge, United Kingdom and New York, NY, USA: Cambridge University Press), 1199–1265.
Nkrumah, F., Vischel, T., Panthou, G., Klutse, N. A. B., Adukpo, D. C., and Diedhiou, A. (2019). Recent trends in the daily rainfall regime in southern West Africa. Atmos. 10:741. doi: 10.3390/atmos10120741
Noble, I. R., Huq, S., Anokhin, Y. A., Carmin, J. A., Goudou, D., Lansigan, F. P., et al. (2015). The role of urban planning in flood risk management: A case study in Australia. Urban Water J. 833–868. doi: 10.1017/CBO9781107415379.019
Odoh, B. I., and Nwokeabia, C. N. (2024). Impact of drainage density and geological factors on flood risk: A comprehensive study of Abia state. Res. J. Sci. Technol. 4, 1–21. Available at: https://www.rejost.com.ng/index.php/home/article/view/132
Oruc, S. (2022). Performance of bias corrected monthly CMIP6 climate projections with different reference period data in Turkey. Acta Geophys. 70, 777–789. doi: 10.1007/s11600-022-00731-9
Owusu, K. (2009). Changing rainfall climatology of West Africa: Implications for rainfed agriculture in Ghana and water sharing in the Volta basin. Gainesville, FL, USA: University of Florida.
Ouma, Y. O., and Tateishi, R. (2014). Urban flood vulnerability and risk mapping using integrated multi-parametric AHP and GIS: Methodological overview and case study assessment. Water, 6, 1515–1545. doi: 10.3390/w6061515
Piani, C., Weedon, G. P., Best, M., Gomes, S. M., Viterbo, P., Hagemann, S., et al. (2010). Statistical bias correction of global simulated daily precipitation and temperature for the application of hydrological models. J. Hydrol. 395, 199–215. doi: 10.1016/j.jhydrol.2010.10.024
Rathjens, H., Bieger, K., Srinivasan, R., and Arnold, J. G. (2016). CMhyd user manual documentation for preparing simulated climate change data for hydrologic impact studies, 1413.
Ritchie, H., Reay, D. S., and Higgins, P.. (2020). Climate change, flooding, and sustainable development: A review of the evidence. J. Environ. Manag. 261:110257. doi: 10.1016/j.jenvman.2020.110257
Saaty, T. L., and Vargas, L. G. (2012). Models, methods, concepts & applications of the analytic hierarchy process. 2nd Edn. New York, NY, USA: Springer.
Shaikh, M. M., Lodha, P., Lalwani, P., and Mehta, D. (2022). Climatic projections of Western India using global and regional climate models. Water Pract. Technol. 17, 1818–1825. doi: 10.2166/wpt.2022.090
Siabi, E. K., Awafo, E. A., Kabo-bah, A. T., Derkyi, N. S. A., Akpoti, K., Mortey, E. M., et al. (2023a). Assessment of shared socioeconomic pathway (SSP) climate scenarios and its impacts on the Greater Accra region. Urban Clim. 49:101432. doi: 10.1016/j.uclim.2023.101432
Siabi, E. K., Phuong, D. N. D., Kabobah, A. T., Akpoti, K., Anornu, G., Incoom, A. B. M., et al. (2023b). Projections and impact assessment of the local climate change conditions of the black Volta Basin of Ghana based on the statistical DownScaling model. J. Water Clim. Change 14, 494–515. doi: 10.2166/wcc.2023.352
Smits, W. K., Attoh, E. M., and Ludwig, F. (2024). Flood risk assessment and adaptation under changing climate for the agricultural system in the Ghanaian white Volta Basin. Clim. Chang. 177:39.
Sofa, S. O., and Nikolopoulos, A. (2020). Flooding and its impact on riverine communities: A study of the white Volta River in Ghana. Hydrol. Earth Syst. Sci. 24, 4561–4577. doi: 10.5194/hess-24-4561-2020
Sylla, M. B., Nikiema, P. M., Gibba, P., Kebe, I., and Klutse, N. A. B. (2016). Climate change over West Africa: recent trends and future projections. Adapt. Clim. Change Variabil. Rural West Africa, 25–40. doi: 10.1007/978-3-319-31499-0_3
Tahiru, A. A., Doke, D. A., and Baatuuwie, B. N. (2020). Effect of land use and land cover changes on water quality in the Nawuni catchment of the white Volta Basin, northern region, Ghana. Appl. Water Sci. 10, 1–14. doi: 10.1007/s13201-020-01272-6
Tebaldi, C., and Knutti, R. (2007). The use of the multi-model ensemble in probabilistic climate projections. Philos. Trans. R. Soc. A Math. Phys. Eng. Sci. 365, 2053–2075. doi: 10.1098/rsta.2007.2076
Tegegne, G., Melesse, A. M., and Worqlul, A. W. (2020). Development of multi-model ensemble approach for enhanced assessment of impacts of climate change on climate extremes. Sci. Total Environ. 704:135357. doi: 10.1016/j.scitotenv.2019.135357
Tellman, B., Sullivan, J. A., Kuhn, C., Kettner, A. J., Doyle, C. S., Brakenridge, G. R., et al. (2021). Satellite imaging reveals increased proportion of population exposed to floods. Nature 596, 80–86. doi: 10.1038/s41586-021-03695-w
Teutschbein, C., and Seibert, J. (2012). Bias correction of regional climate model simulations for hydrological climate-change impact studies: review and evaluation of different methods. J. Hydrol. 456, 12–29. doi: 10.1016/j.jhydrol.2012.05.052
Ullah, A., and Zhang, W. (2020). Evaluating flood risk factors in mountainous regions: A case study of the Karakoram region in Pakistan. Geogr. J. 186, 370–383. doi: 10.1111/geoj.12348
United Nations Office for the Coordination of Humanitarian Affairs. (2023). Ghana: Akosombo Dam spillage floods - Situation Report No. 3 (October 2023). Retrieved March 15, 2024, from https://reliefweb.int/report/ghana/ghana-akosombo-dam-spillage-floods-situation-report-no-3-17-october-2023 (Accessed March 15, 2024).
Van Calster, B., and Vickers, A. J. (2015). Calibration of risk prediction models: impact on decision-analytic performance. Med. Decis. Mak. 35, 162–169. doi: 10.1177/0272989X14547233
WRC. (2021). White Volta Basin Integrated Water Resources Management Plan. Water Resources Commission, Government of Ghana. Retrieved October 26, 2021, from https://www.wrc-gh.org/basins/white-volta/ (Accessed October 26, 2021).
Yeboah, K. A., Akpoti, K., Kabo-bah, A. T., Ofosu, E. A., Siabi, E. K., Mortey, E. M., et al. (2022). Assessing climate change projections in the Volta Basin using the CORDEX-Africa climate simulations and statistical bias-correction. Environmental. Challenges 6:100439. doi: 10.1016/j.envc.2021.100439
Keywords: flood susceptibility, climate change, White Volta Basin, shared socioeconomic pathways, GIS, AHP
Citation: Kabo-Bah AT, Cobbina NA, Siabi EK, Siabi SE and Ahiada WB (2025) Flood projections over the White Volta Basin under the shared socioeconomic pathways: an analytical hierarchical approach. Front. Clim. 7:1564665. doi: 10.3389/fclim.2025.1564665
Edited by:
Anthony Lupo, University of Missouri, United StatesReviewed by:
Sarah Weaver, University of Missouri, United StatesBibhu Prasad Mishra, Odisha University of Technology and Research, India
Copyright © 2025 Kabo-Bah, Cobbina, Siabi, Siabi and Ahiada. This is an open-access article distributed under the terms of the Creative Commons Attribution License (CC BY). The use, distribution or reproduction in other forums is permitted, provided the original author(s) and the copyright owner(s) are credited and that the original publication in this journal is cited, in accordance with accepted academic practice. No use, distribution or reproduction is permitted which does not comply with these terms.
*Correspondence: Nana Asirifi Cobbina, bmFuYS5jb2JiaW5hLnN0dUB1ZW5yLmVkdS5naA==