 Sabrina L. Cohen
 James W. Hurrell
 Danica L. Lombardozzi2
- 1Department of Atmospheric Science, Colorado State University, Fort Collins, CO, United States
- 2Department of Ecosystem Science and Sustainability, Colorado State University, Fort Collins, CO, United States
Stratospheric aerosol injection (SAI) is a form of climate intervention that has been proposed to limit future warming and mitigate some of the adverse impacts of climate change while humanity continues efforts to reduce emissions and atmospheric concentrations of greenhouse gases. In this study, we use an Earth system model to compare the projected effects of a climate change scenario to three different SAI scenarios. Our analysis centers on both climate and crop productivity impacts. We focus on four Global South regions: South Asia, East Asia, South Central America, and West Africa. These regions were selected due to their socioeconomic vulnerability to climate change. The SAI scenarios project reduced temperature extremes and greater wet season precipitation, soil moisture and crop productivity compared to the climate change scenario over all four regions. We also find that the extent to which SAI mitigates crop productivity declines due to climate change is likely greater in South Central America and West Africa than in South and East Asia. Our study is a step toward addressing the need for more regional analyses of the potential impacts of different SAI scenarios.
1 Introduction
As the impacts of anthropogenic climate change become more prevalent and severe, an increasing number of scientists are researching climate intervention as a possible approach to rapidly lessen or even reduce the rate of warming (NRC, 2015; NASEM, 2021; UNEP, 2023). One of the most studied climate intervention techniques is stratospheric aerosol injection (SAI). SAI involves the injection of sulfur dioxide or some other material, such as aluminum oxide (e.g., Vattioni et al., 2023), into the stratosphere to form aerosols, which reflect a small percentage of incoming shortwave radiation (Crutzen, 2006; Zhang et al., 2024; Haywood et al., 2025).
The possibility of employing SAI has engendered tremendous political, ethical, and environmental debate. Some argue that employing SAI to lower or stabilize Earth’s surface temperature would dissuade humanity from aggressively pursuing greenhouse gas (GHG) emission cuts (Halstead, 2018). Others comment on the enormous political difficulties of establishing a worldwide system of governance and regulation of SAI (Smith and Henly, 2021) or the potential environmental consequences of actual deployment, such as the potential reduction of stratospheric ozone (e.g., Bednarz et al., 2023), the possibility of shifts in regional rainfall patterns (e.g., Simpson et al., 2019; Da-Allada et al., 2020; Krishnamohan and Bala, 2022), and the possibility of “termination shock”—the rapid climate change that would occur if SAI deployment was suddenly halted (e.g., Parker and Irvine, 2018).
These and other concerns are valid and warrant serious consideration and debate. Despite the numerous potential problems and risks of SAI, however, many have argued that its potential benefits are worth investigating (e.g., Crutzen, 2006; Kravitz et al., 2011; Simpson et al., 2019; Richter et al., 2022; Haywood et al., 2025) given the growing risks posed by anthropogenic climate change. In particular, the geopolitical challenges of reducing GHG emissions make it unlikely that global surface warming will be limited to 1.5o or even 2o C above the preindustrial baseline (IPCC, 2023), with warming of nearly 2.5o C or more likely given current emission rates (UNEP, 2023). Thus, it is very probable that adverse consequences of climate change, such as heat waves, floods, droughts, and crop failures, will become more frequent and severe in coming decades (Bevacqua et al., 2020; Anderson et al., 2020; Tripathy et al., 2023; IPCC, 2023).
Many previous studies have carried out global analyses of SAI impacts (e.g., Mamalakis et al., 2023; Simpson et al., 2019; Richter et al., 2022; Haywood et al., 2025; Zhang et al., 2024); here, we contribute a primarily regional analysis to this rapidly growing field of research. While it has been established that global-mean temperatures could potentially be stabilized or cooled under many SAI scenarios, and precipitation changes would lessen in many regions compared to future changes projected under climate change, specific impacts vary regionally (e.g., Richter et al., 2022; Kravitz et al., 2017). We analyze how different SAI scenarios might affect four Global South regions that may be particularly vulnerable to the harmful impacts of climate change: South Asia (SAS), East Asia (EAS), South Central America (SCA), and West Africa (WAF). The geographical boundaries of these “IPCC AR6 regions” combine areas with similar climatological characteristics and projected changes in future climate (Iturbide et al., 2020).
Less economically developed countries, such as those in the regions studied here, suffer disproportionately from the effects of anthropogenic climate change (e.g., World Bank, 2013; Bathiany et al., 2018; Jafino et al., 2020). One reason for this is the vulnerability of such countries to worsening heat waves, floods, tropical cyclones, and other climate-related events (Bowen et al., 2012). As subsistence agriculture is particularly prominent in many less economically developed countries, their citizens’ well-being depends more intimately on climatic conditions (Fankhauser and McDermott, 2014). In addition, such countries have relatively low levels of technological, institutional and economic capacity that would allow for effective adaptation to climate change (Barr et al., 2010). The Socioeconomic Data and Applications Center (SEDAC, n.d.) at Gao (2020) has generated population projection data for various IPCC climate change scenarios. We used SEDAC’s data for the IPCC’s Shared Socioeconomic Pathway (SSP) 2–4.5 moderate emissions scenario (O’Neill et al., 2017) to determine the projected percentage changes in future regional populations. The projected populations of SAS, SCA, and WAF all exceed the world average change of 24.1% by the year 2070, with the largest change in the population of WAF (Table 1). In EAS, population is projected to decrease, although the region remains a tremendously populated area in 2070, comprising 12.8% of the total world population. The population burden in these regions means that any socioeconomic difficulties already present will likely be worse in the future due to climate change.
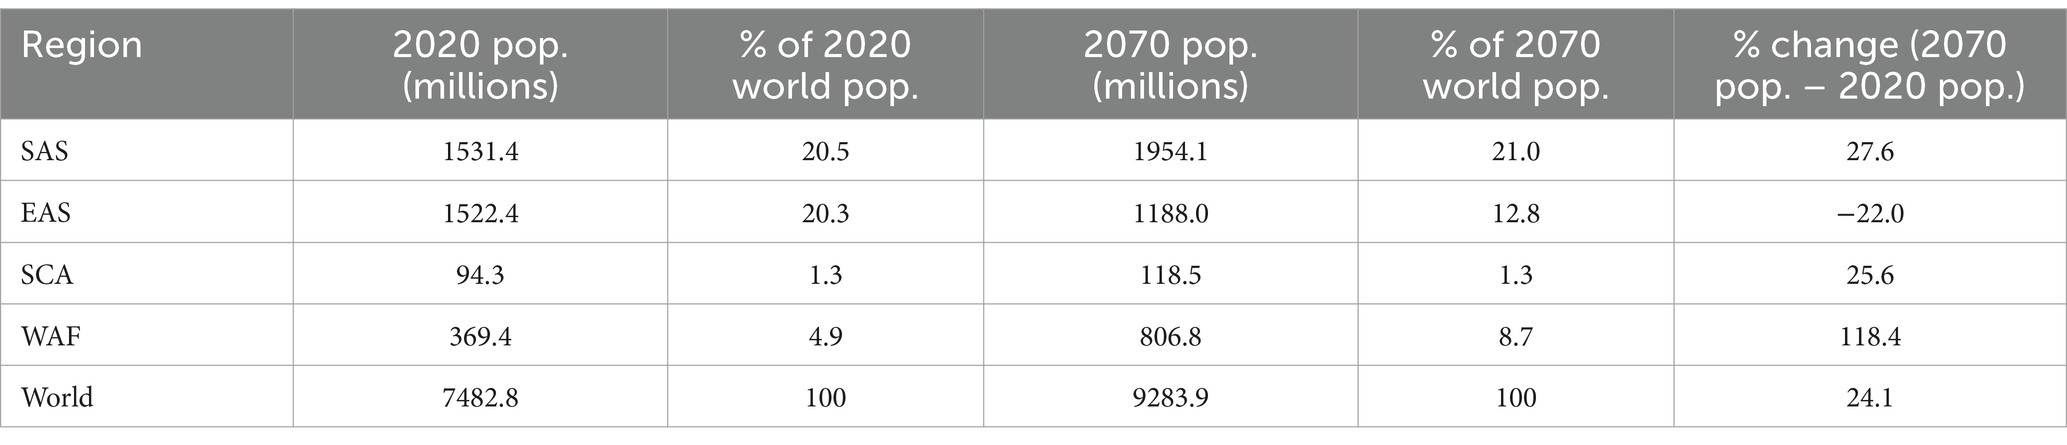
Table 1. Projected changes in population growth for this study’s four regions, as well as worldwide totals, from 2020 to 2070.
A critical challenge will be ensuring food security for the inhabitants of these regions. In 2022, the percent of the population that could not afford a healthy diet was 16.3, 26.3, 53.1, and 69.3% for Eastern Asia, Central America, Southern Asia, and Western Africa, respectively (FAO, 2024). Climatological factors such as droughts and heatwaves have also driven food insecurity in these regions (Zakari et al., 2014; Singh, 2016; Alpízar et al., 2020; Xu et al., 2024). Projected population growth, as well as climate-change-induced crop failures from plant diseases (Singh et al., 2023) and drought and temperature extremes (Lesk et al., 2022; Rezaei et al., 2023), further threaten future food security.
These four regions have also been ravaged by extreme weather events in recent years. For instance, in March–May 2022, India and Pakistan suffered an extremely intense, long-lasting heat wave, with surface air temperatures reaching up to 50°C locally, making it perilous for people to go outdoors (Zargar, 2022). Zachariah et al. (2023) concluded that climate change made this heat wave 30 times more likely, and Nath et al. (2024) determined that climate change made the median value of the heat wave likelihood 41 times greater. During the monsoon season (June–October) of the same year, a combination of torrential rains and melting glaciers gave rise to a flood in Pakistan affecting 33 million people, resulting in over 1,000 deaths and approximately $15 billion USD in damages (World Bank, 2022). Otto et al. (2023) concluded that climate change increased the rainfall in Pakistan by up to 50%, and You et al. (2024) found that, while natural variability played a role, the influence of anthropogenic warming was evident via intensified moisture transport and convection.
From May to October 2022, Nigeria experienced extreme flooding that killed over 600 people, displaced over a million, and wrecked thousands of homes (Khalid and Maishman, 2022). Zachariah et al. (2022) found that climate change made the event 80 times more probable and that the precarious economic, political, and infrastructural conditions exacerbated its effects. In summer 2022, Sichuan, a province in southwestern China, suffered a multi-month heatwave that severely disturbed the economy, resulting in multiple factory shutdowns and city blackouts (Gan, 2022). In August 2023, Hebei, a province in northeastern China, experienced its heaviest rainfall in 140 years (the aftermath of a tropical cyclone), displacing over a million people (McCarthy et al., 2023). In 2020, Central America was hit by two devastating hurricanes, Eta and Iota, within 2 weeks. In Honduras, one of the poorest Latin American countries, the hurricanes’ destruction to land and infrastructure impacted over 4 million people (Lakhani, 2021).
In this paper, we examine the projected and possible impacts of anthropogenic climate change and several SAI scenarios on these four world regions by analyzing changes in temperature, precipitation, heat extremes, soil moisture, and crop productivity.
2 Materials and methods
Our analysis is based on numerical simulations performed with the Community Earth System Model, version 2 (CESM2) with the Whole Atmosphere Community Climate Model, version 6 (WACCM6) as its atmospheric component (Danabasoglu et al., 2020). WACCM6 was run with a latitude and longitude grid of 0.9 and 1.25 degrees, respectively (Brody et al., 2024), and 70 vertical layers extending up to about 140 km. WACCM6 has been shown to effectively simulate stratospheric dynamics and chemistry (including aerosol creation) when compared to observations of volcanic eruptions (Gettelman et al., 2019). The simulations analyzed in this study also used the Community Land Model 5 (CLM5), which simulates temperate and tropical corn, temperate and tropical soybean, rice, cotton, spring wheat, sugarcane, miscanthus, and switchgrass (Lawrence et al., 2019; Lombardozzi et al., 2020).
We consider three SAI scenarios under the “Assessing Responses and Impacts of Solar Climate Intervention on the Earth System with Stratospheric Aerosol Injection” (ARISE-SAI) simulations (Richter et al., 2022). Each SAI scenario, consisting of ten ensemble members, uses the SSP2-4.5 emissions scenario to simulate policymakers’ stated intentions regarding GHG emission cuts (Hausfather, 2025). To stabilize or cool global temperatures while simultaneously minimizing other disruptions to the climate system, ARISE-SAI uses an algorithm called the “controller” (Kravitz et al., 2017). Sulfur dioxide is injected at 30oN, 15oN, 15oS, and 30oS, all at 180°E longitude and an altitude of ~21.5 km. WACCM6 simulates the conversion of sulfur dioxide into sulfuric acid through oxidation, as well as the conversion of sulfuric acid into sulfate aerosol through nucleation and coagulation. Most of the simulated stratospheric sulfate aerosols lie in the coarse mode, though the Aitken and accumulation modes are also simulated. The modeled aerosols are eliminated through gravity and atmospheric circulation (Richter et al., 2022). The aerosols are introduced to achieve three temperature targets: global mean temperature, the north-to-south-pole (inter-hemispheric) temperature gradient, and the equator-to-pole temperature gradient. Maintenance of the temperature gradients is fundamental so that atmospheric dynamical circulations are altered as little as possible. The controller analyzes these metrics every year and adjusts the injection amounts in the four locations accordingly.
In CESM2(WACCM6) under SSP2-4.5, Earth is projected to reach a global-mean temperature of 1.5°C above pre-industrial levels during 2020–2039. Thus, in the SAI-1.5 scenario, injections begin in 2035 and continue through 2069 to maintain the global-mean temperature at 1.5°C, even as GHG emissions continue increase (Richter et al., 2022). In the SAI-1.0 scenario, injections also begin in 2035 but are larger in magnitude to cool the planet to 1.0°C (MacMartin et al., 2022). In the SAI-DELAYED scenario, the global mean temperature target is once again 1.5°C, but injections do not begin until 2045; thus, injection quantities are greater than in SAI-1.5 to counteract the additional global warming that occurs over 2035–2045. We note that, due to an error when running the simulations, SAI-DELAYED overshoots its temperature target (1.5°C) and cools the planet to 1.37°C (Brody et al., 2024). The delayed start scenario was constructed because of the possibility that humanity might not be ready to deploy SAI as soon as 2035 (Brody et al., 2024).
As mentioned, each SAI scenario is simulated with increasing GHG concentrations over time that follow SSP2-4.5, which specifies that annual CO2 emissions peak mid-century and then decrease (O’Neill et al., 2017). We refer to this as the “climate change” scenario, and we compare each SAI scenario to it. We use 2020–2039 under SSP2-4.5 as the base period, following Richter et al. (2022). Our focus is on mid-century changes averaged over a twenty-year period (2050–2069) to enhance the magnitude of the climate change and SAI signals (Hueholt et al., 2023). We used a program called “regionmask,” compatible with Python (Hauser et al., 2024), to analyze AR6 regions (Iturbide et al., 2020). We also used the Python program “xclim” (Bourgault et al., 2023) to analyze simulated changes in maximum annual temperatures (TXx) and the annual number of warm spell days, as measured by the Warm Spell Duration Index (WSDI) (Zhang et al., 2024).
3 Results
3.1 Global changes
While we primarily focus on regional analyses of possible climate futures, global maps facilitate a more comprehensive understanding of regional climate change patterns. Figures 1, 2 show annual-mean surface temperature and precipitation changes in the SAI and climate change scenarios (see also Richter et al., 2022; Visioni et al., 2023; Brody et al., 2024). Compared to the base period (2020–2039), average annual-mean surface temperatures increase by mid-century (2050–2069) under the climate change scenario (Figure 1a) almost everywhere except for the North Atlantic. The latter is due to a slowing of the Atlantic Meridional Overturning Circulation in the CESM2 (Gu et al., 2024). Polar amplification, particularly in the Northern Hemisphere due to such factors as the ice-albedo feedback, is also evident, as has been found in CMIP6 models in general (Södergren and McDonald, 2022). Large warming is noted in the tropical eastern Pacific, consistent with projections in CMIP6 models (e.g., Cai et al., 2021) that the El Niño phase of the El Niño Southern Oscillation (ENSO) will become more prevalent under climate change.
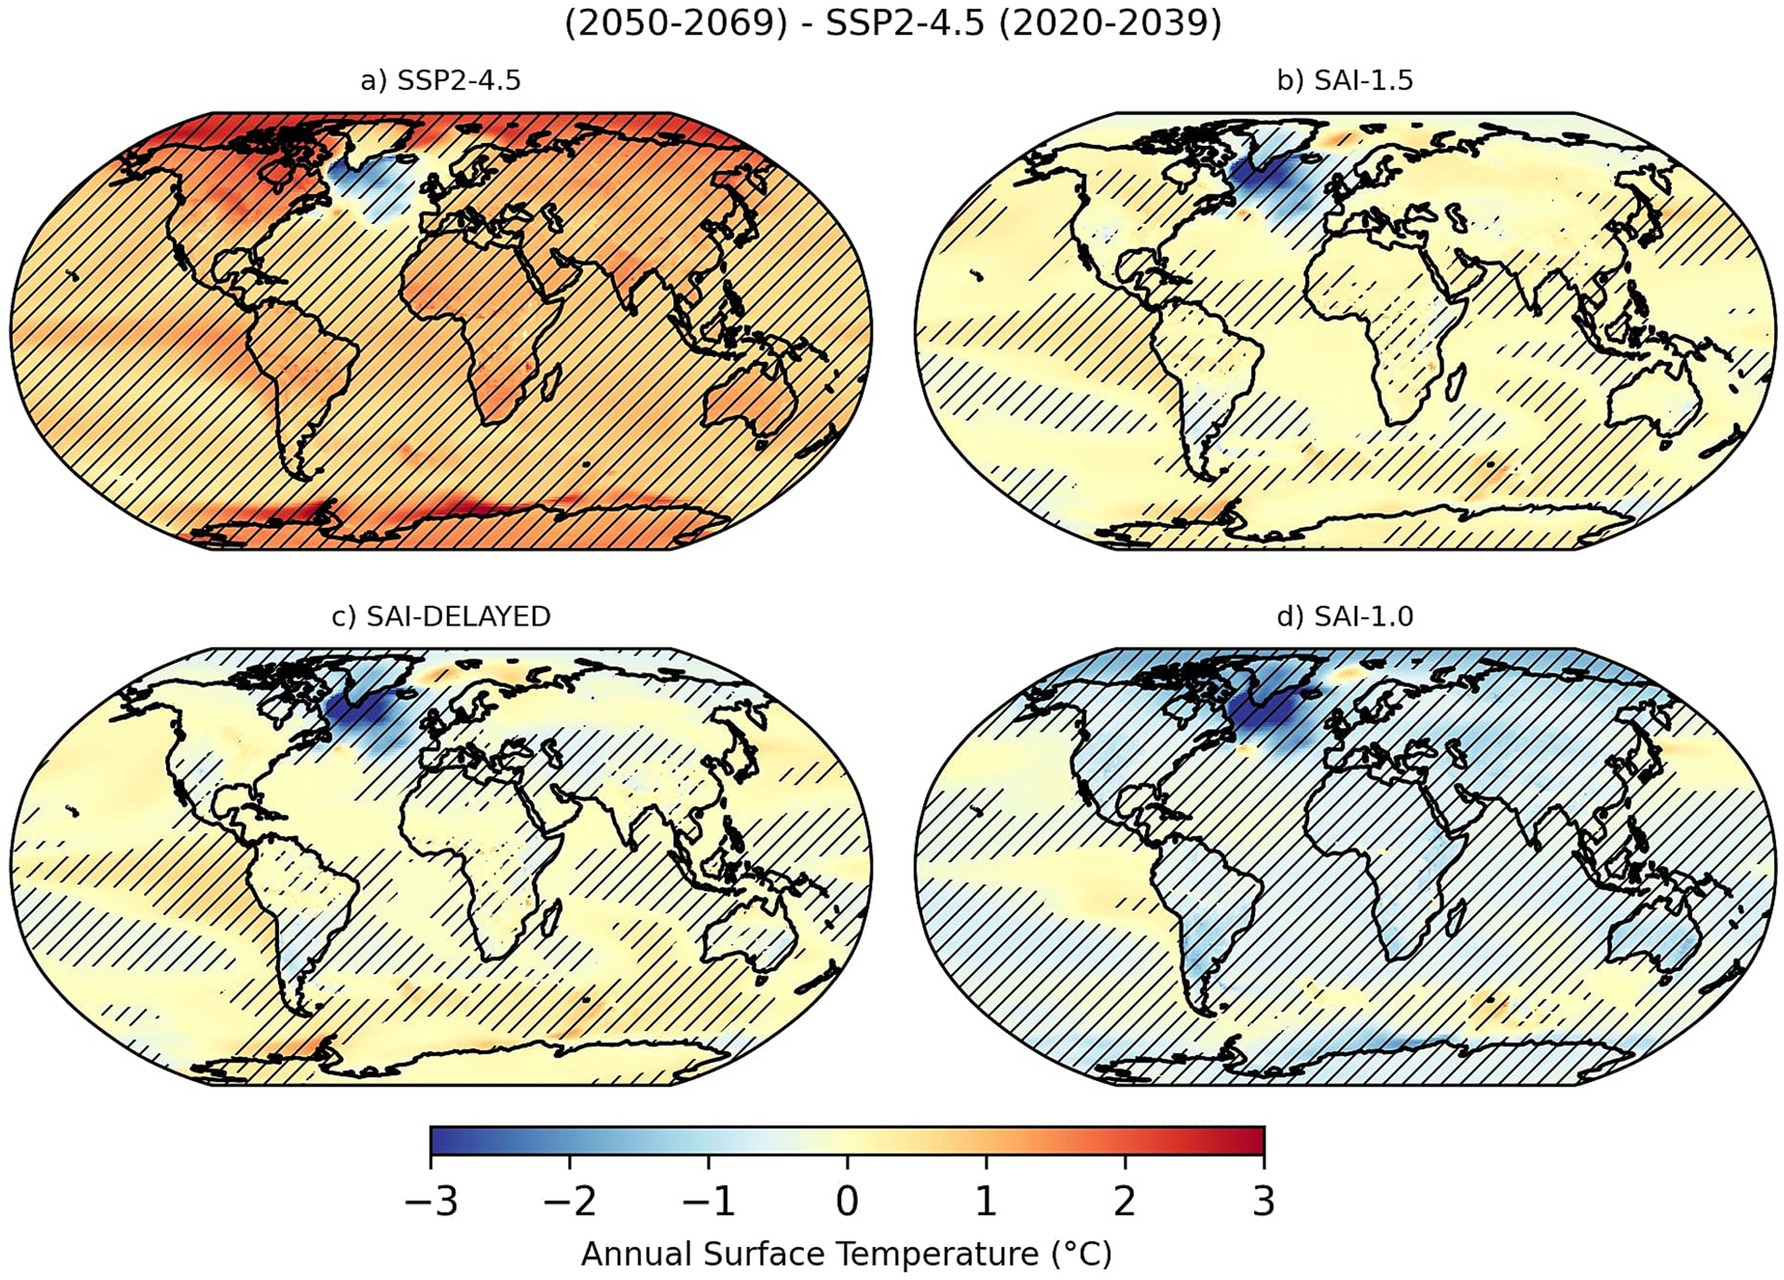
Figure 1. A comparison of changes in mean annual surface temperature under the three SAI and climate change scenarios relative to the base period. Hatching indicates statistically significant changes [at the 99% confidence level using a Welch t-test (West, 2021)] in the distribution of ensemble members relative to the base period. (a,b) show changes under the climate change and SAI-1.5 scenarios, respectively, as in Richter et al. (2022). (c) shows changes in the SAIDELAYED scenario. (d) shows changes under the SAI-1.0 scenario, as in Visioni et al. (2023).

Figure 2. Changes in mean annual precipitation relative to the base period under the climate change scenario (a), SAI-1.5 (b), SAI-DELAYED (c) and SAI-1.0 (d).
Figures 1b,c, which depict mid-century changes from the base period in SAI-1.5 and SAI-DELAYED, respectively, are generally similar. Both SAI scenarios result in warming of the tropical eastern Pacific, though it is smaller in magnitude than in the climate change scenario (Figure 1a). Under SAI-1.0 (Figure 1d), significant cooling is present nearly everywhere except a few oceanic regions. This is consistent with having a global-mean temperature target (1.0°C) cooler than the average global-mean temperature of the base period (1.5°C).
In terms of future annual-mean precipitation changes, two of the most prominent features of the simulated climate change scenario (Figure 2a) are the intensification of the Intertropical Convergence Zone (ITCZ) coupled with enhanced drying over the subtropical oceans, particularly in the Northern Hemisphere. These changes have been attributed to enhanced convection in a warmer, tropical climate and, by mass continuity, greater subsidence and drying in the adjacent sub-tropics (e.g., Held and Soden, 2006; IPCC, 2021; Zaitchik et al., 2023).
In contrast, to balance Earth’s energy budget under SAI, the decrease in incoming solar radiation is compensated by a decrease in evaporative cooling of the surface; thus, future precipitation changes overall are smaller (Simpson et al., 2019). Additionally, heating due to increased aerosol burdens in the stratosphere leads to increased atmospheric static stability, which produces weaker tropical convection and less subtropical subsidence (Ferraro et al., 2014). Simpson et al. (2019) summarize this finding by saying that “wet regions… become drier and dry regions…become wetter” under SAI relative to future hydrological cycle changes with climate change. These general changes are evident under the SAI-1.5, SAI-DELAYED and SAI-1.0 simulations examined here (Figures 2b,c).
3.2 Regional changes
3.2.1 Annual cycle
While many studies (e.g., Simpson et al., 2019; Haywood et al., 2025; Zhang et al., 2024) have examined changes in annual-or seasonal-average precipitation and temperature under climate change and SAI scenarios, relatively few have analyzed the annual cycles of these variables (e.g., Da-Allada et al., 2020). Potential changes in the annual cycle of precipitation are important, as concerns have been expressed that SAI-induced changes in the onset and termination dates of regional monsoons, as well as their intensity, could have profound impacts (e.g., Robock et al., 2008; Simpson et al., 2019).
The annual cycles of precipitation and temperature are critical for food security in the regions examined here (Gbode et al., 2021; He et al., 2022; Stewart et al., 2022; Amale et al., 2023). Several studies (e.g., Zhang and Wang, 2008; Gadgil, 2018; Bombardi et al., 2020) have pointed out that the monsoon’s traditional wind-based definition (Ramage, 1971) can exclude regions, such as the Americas (Zhou and Lau, 1998). The monsoon can also be defined as seasonal changes in precipitation due to a meridional shift in the ITCZ (Geen et al., 2020); however, this definition can also exclude regions such as northwest India (Bombardi et al., 2020). Thus, we join others (e.g., Wang and Ho, 2002; Liebmann et al., 2012; Zhang and Wang, 2008) in referring to a wet season rather than a monsoon season.
For each simulation and region, we computed a cosine-weighted regional average of daily temperature and precipitation, using only land grid points, and we use a five-day centered moving average to smooth the daily data. Even though the SAI scenarios do not explicitly target the preservation of the seasonal cycle, the overall shapes of the temperature and precipitation cycles are well-preserved in all scenarios (see Supplementary Figures 1, 2). Differences by day from the base-period annual cycle are shown for both precipitation (Figure 3) and surface temperature (Figure 4).
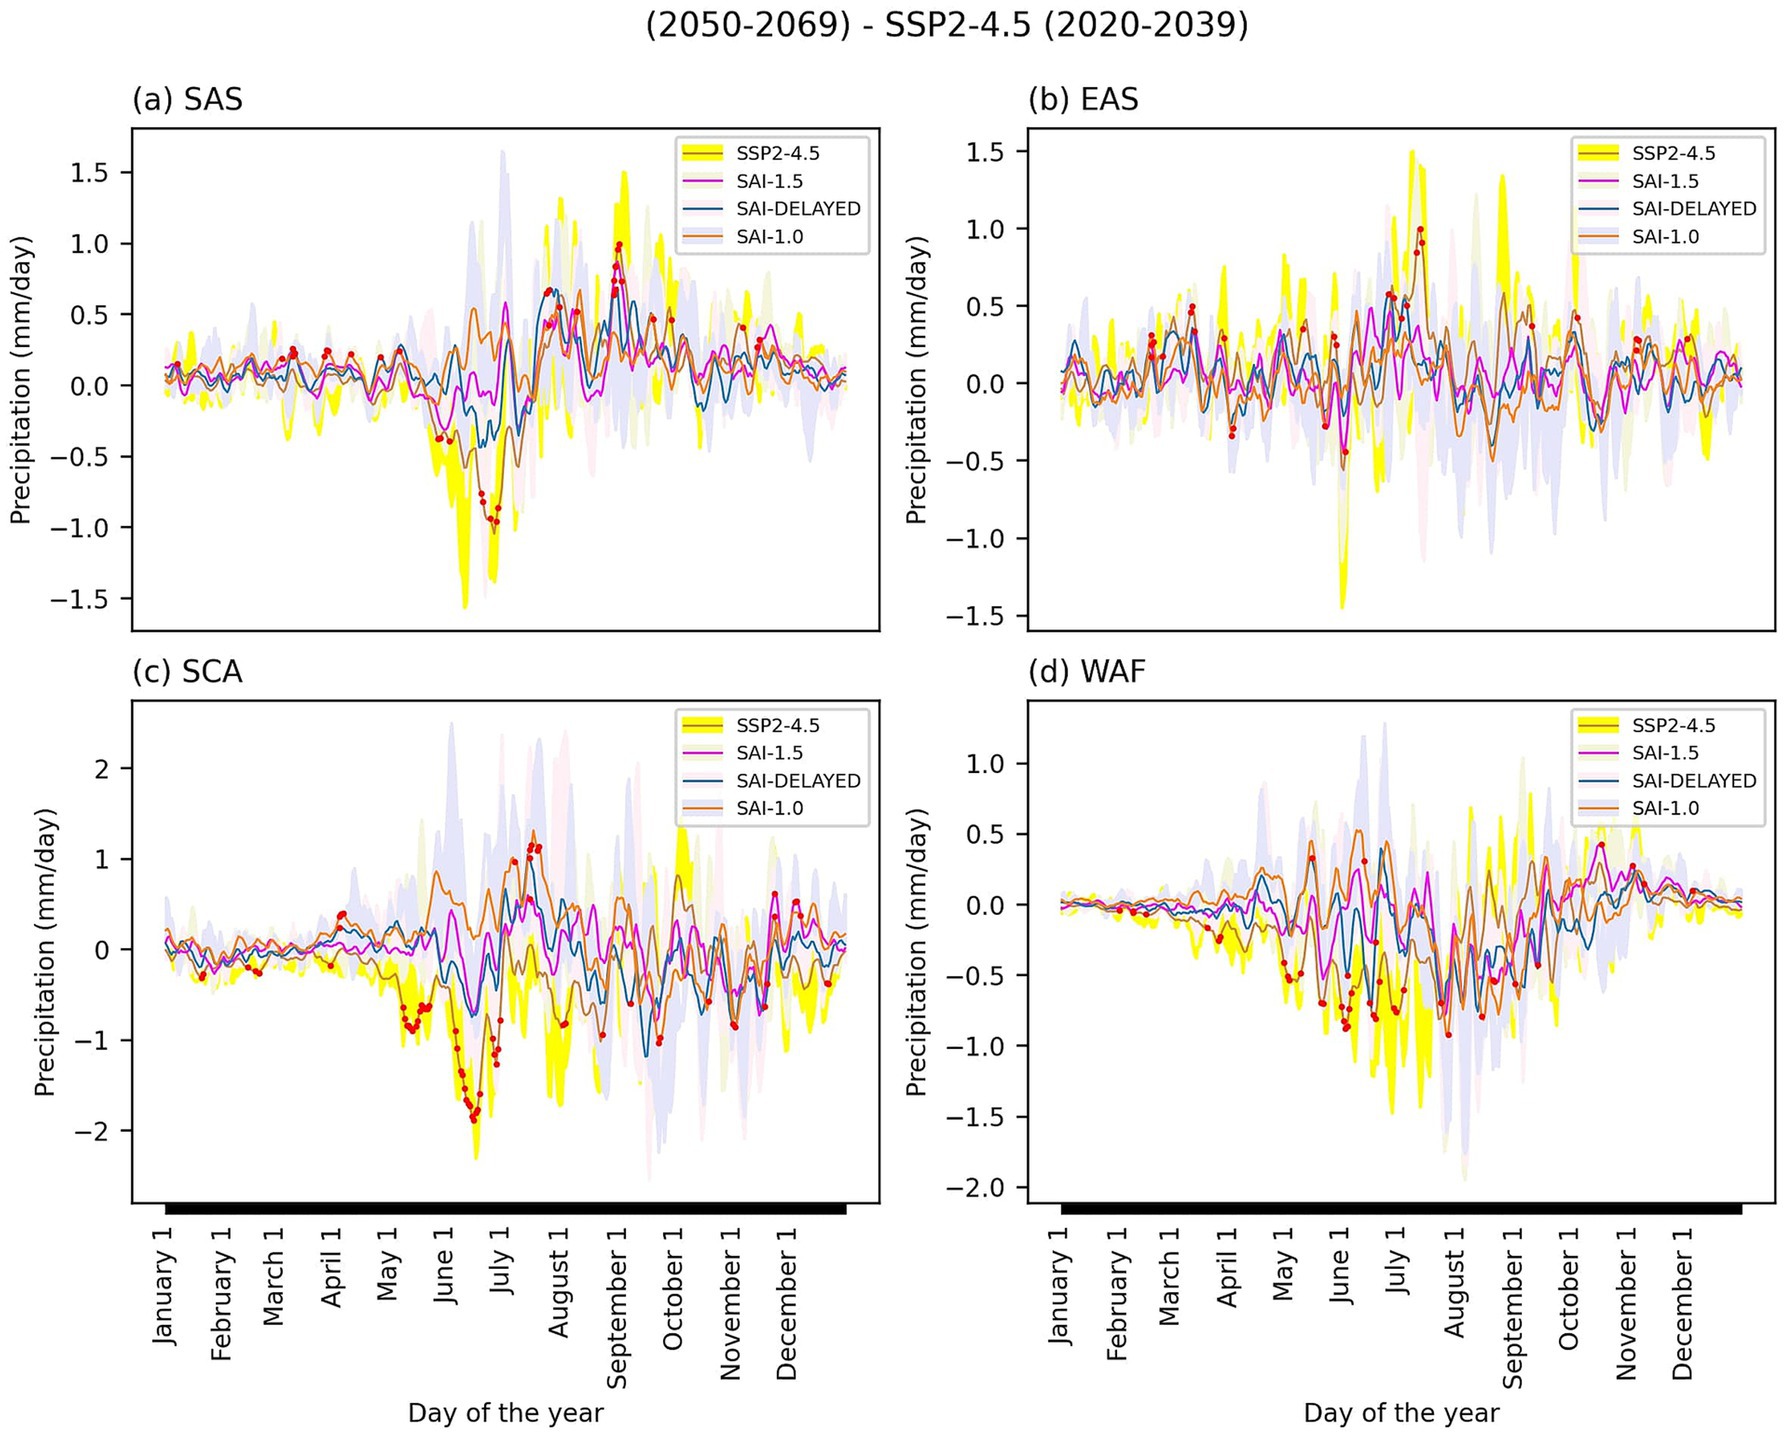
Figure 3. Changes in 2050-2069 average precipitation relative to SSP2-4.5 (2020-2039) by day of the year for SSP2-4.5 (brown), SAI-1.5 (pink), SAI-DELAYED (blue), and SAI-1.0 (orange). Changes are shown for South Asia (a), East Asia (b), South Central America (c), and West Africa (d). Red dots indicate days of the year in which differences are statistically significant at the 99% confidence level using a Welch t-test.
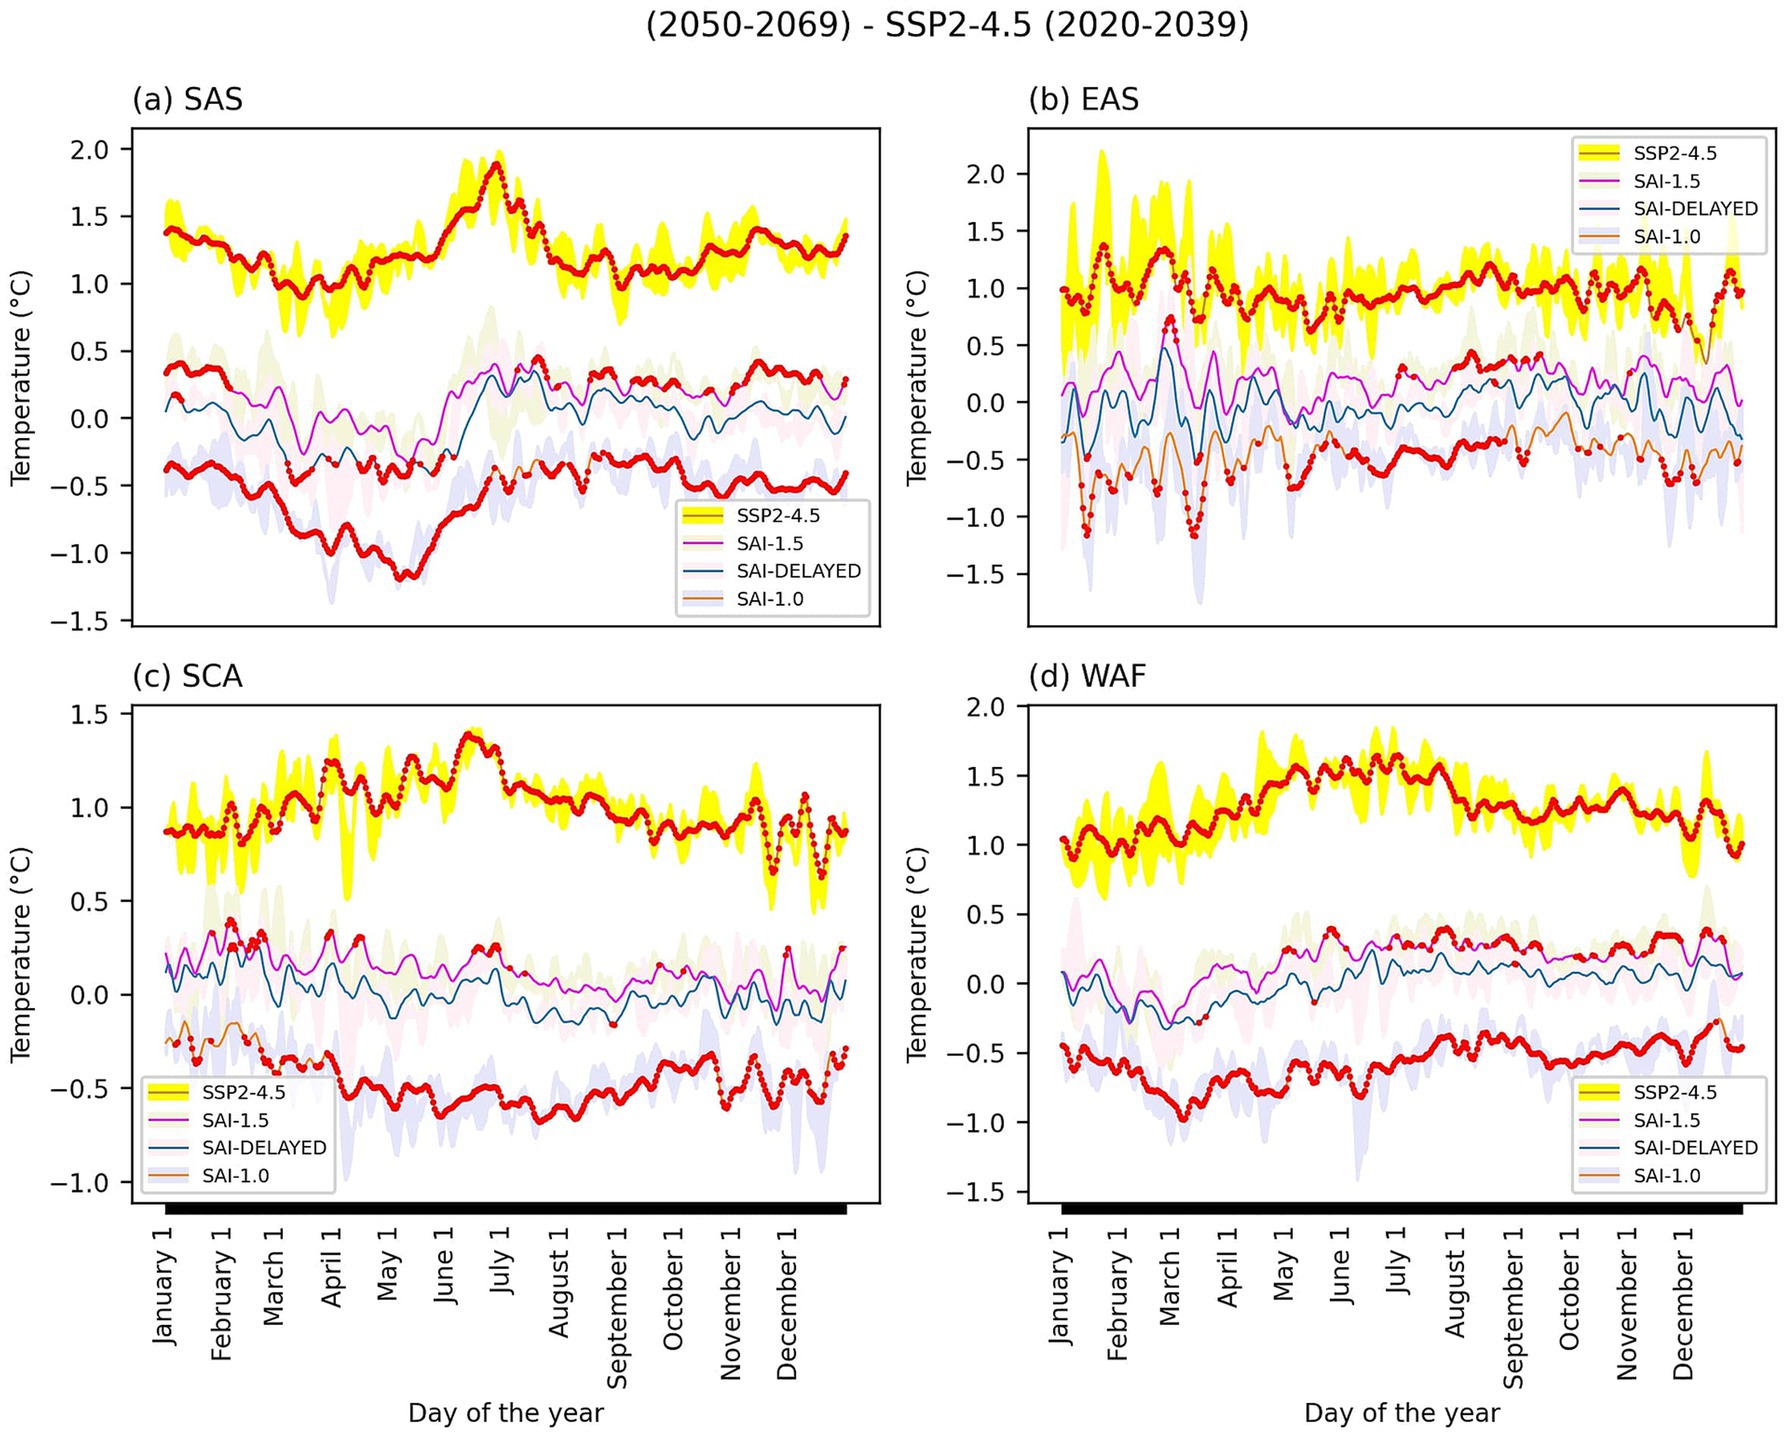
Figure 4. As for Figure 3, but for surface temperature. Changes are shown for South Asia (a), East Asia (b), South Central America (c), and West Africa (d).
As precipitation (Figure 3) is a relatively noisy variable (IPCC, 2021), the ensemble ranges for the different scenarios largely overlap; the extent and nature of this overlap, however, differ regionally. In EAS (Figure 3b), days of significantly different precipitation under the climate change scenario tend to have greater precipitation than the base period, but they are not concentrated in one season. In contrast, in SCA and WAF, and to a lesser extent SAS (Figures 3a,c,d), precipitation tends to be significantly less during the wet season (May–October) in the climate change scenario, as is also evident in Figure 2a. As will be shown later, these precipitation decreases are associated with deficits in simulated soil moisture and declines crop yields, especially in SCA and WAF. It is noteworthy, however, that even in these regions, the number of days with significantly less precipitation is a relatively small fraction of the year due to the presence of large internal variability.
Consistent changes in surface temperature relative to the base period are much clearer (Figure 4). Under the climate change scenario, temperatures are significantly greater than those in the base period for nearly every day of the year in all regions. However, the number of days per year with significant changes from the base period is relatively few under SAI-1.5 and SAI-DELAYED, and the magnitude of these changes is also less than those of the climate change scenario. In SAI-1.5, changes in surface temperature tend to be positive (i.e., temperature increases). In SAI-DELAYED, the changes are mostly negative (i.e., temperature decreases). Finally, under SAI-1.0, surface temperatures decrease significantly in all four regions for most of the year, with fewer days with statistically significant decreases in EAS. Thus, the SAI simulations fulfill their objective of stabilizing or lowering surface temperatures relative to the base period even regionally.
The regional precipitation changes under the different climate futures (Figure 3) are further highlighted in Figure 5, which—unlike Figure 2—shows changes for only the wet season (May–October). Under climate change, large parts of SAS and EAS experience no significant change in wet season precipitation, while isolated regions exhibit precipitation increases (Figure 5a). In contrast, SCA and WAF, due to their location in the lower latitudes, are affected by increased subsidence and drying under the SSP2-4.5 climate change scenario (Figure 2; see also Held and Soden, 2006; IPCC, 2021; Zaitchik et al., 2023). This drying is lessened or even reversed in SAI-1.5, SAI-DELAYED, and (especially) SAI-1.0 (Figures 5b–d). Note that the spatial distribution of SAI-1.0 changes for WAF is nearly a mirror image of the climate change signal. Several areas of SAS and SCA also experience significant wetting in SAI-1.0. As discussed previously, less vigorous tropical convection under SAI leads to tropical drying and, thus, reduced subsidence and wetting of the adjacent subtropics (Figure 2; see also Simpson et al., 2019).

Figure 5. Changes in wet season (May-October) average precipitation for East Asia (EAS), South Asia (SAS), South Central America (SCA), and West Africa (WAF) relative to the base period. Changes are shown for the climate change scenario (a), SAI-1.5 (b), SAI-DELAYED (c), and SAI-1.0 (d). The boxes in each panel delimit these four regions. Hatching indicates significant differences at the 99% significance level using a Welch t-test.
3.2.2 Extremes
Global increases in the frequency, intensity, and duration of high temperature extremes since 1950 are virtually certain (≥99% probability) (IPCC, 2021), and an increasing number of studies have attributed these changes to GHG forcing using indices such as the WSDI (Christidis and Stott, 2016; Hu et al., 2020) and the maximum annual temperature (TXx) (Kim et al., 2016; Dong et al., 2018). In both CMIP5 and CMIP6 models, there are much more frequent, persistent, and severe high temperature extremes on land with 2°C of warming (relative to 1850–1900) compared to 1.5°C of warming (Fischer and Knutti, 2014; IPCC, 2021; Li et al., 2021). In SSP2-4.5, global temperatures are projected to reach ~2°C above pre-industrial levels by 2050 (IPCC, 2021). Regarding changes in high temperature extremes under SAI scenarios, geographically widespread decreases relative to climate change scenarios have been documented in several temperature indices, such TXx (Ji et al., 2018) and WSDI (Ji et al., 2018; Alamou et al., 2022; Jiang et al., 2024), as well as the percentage of days with maximum temperatures above the 90th percentile (Barnes et al., 2022).
Here, we show future regional changes in surface temperature extremes that are broadly consistent with the existing literature (Figures 6, 7). Under the climate change scenario, TXx increases significantly over nearly all of the regions relative to the base period (Figure 6a). In parts of EAS, such as in Southern China, these increases are relatively small compared to other areas, consistent with relatively small increases in annual-mean annual temperatures in this area with climate change (Figure 1). In the SAI-1.5 and SAI-DELAYED scenarios, TXx shows relatively few significant changes compared to the base period, with considerable spatial heterogeneity in the sign of the changes (Figures 6b,c). In the SAI-1.0 scenario, TXx is projected to decrease significantly over most of the four regions (Figure 6d).

Figure 6. Changes in the maximum annual surface temperature (TXx) for each region relative to the base period. Changes are shown for the climate change scenario (a), SAI-1.5 (b), SAI-DELAYED (c), and SAI-1.0 (d). Hatching indicates significant differences at the 99% significance level using a Welch t-test.
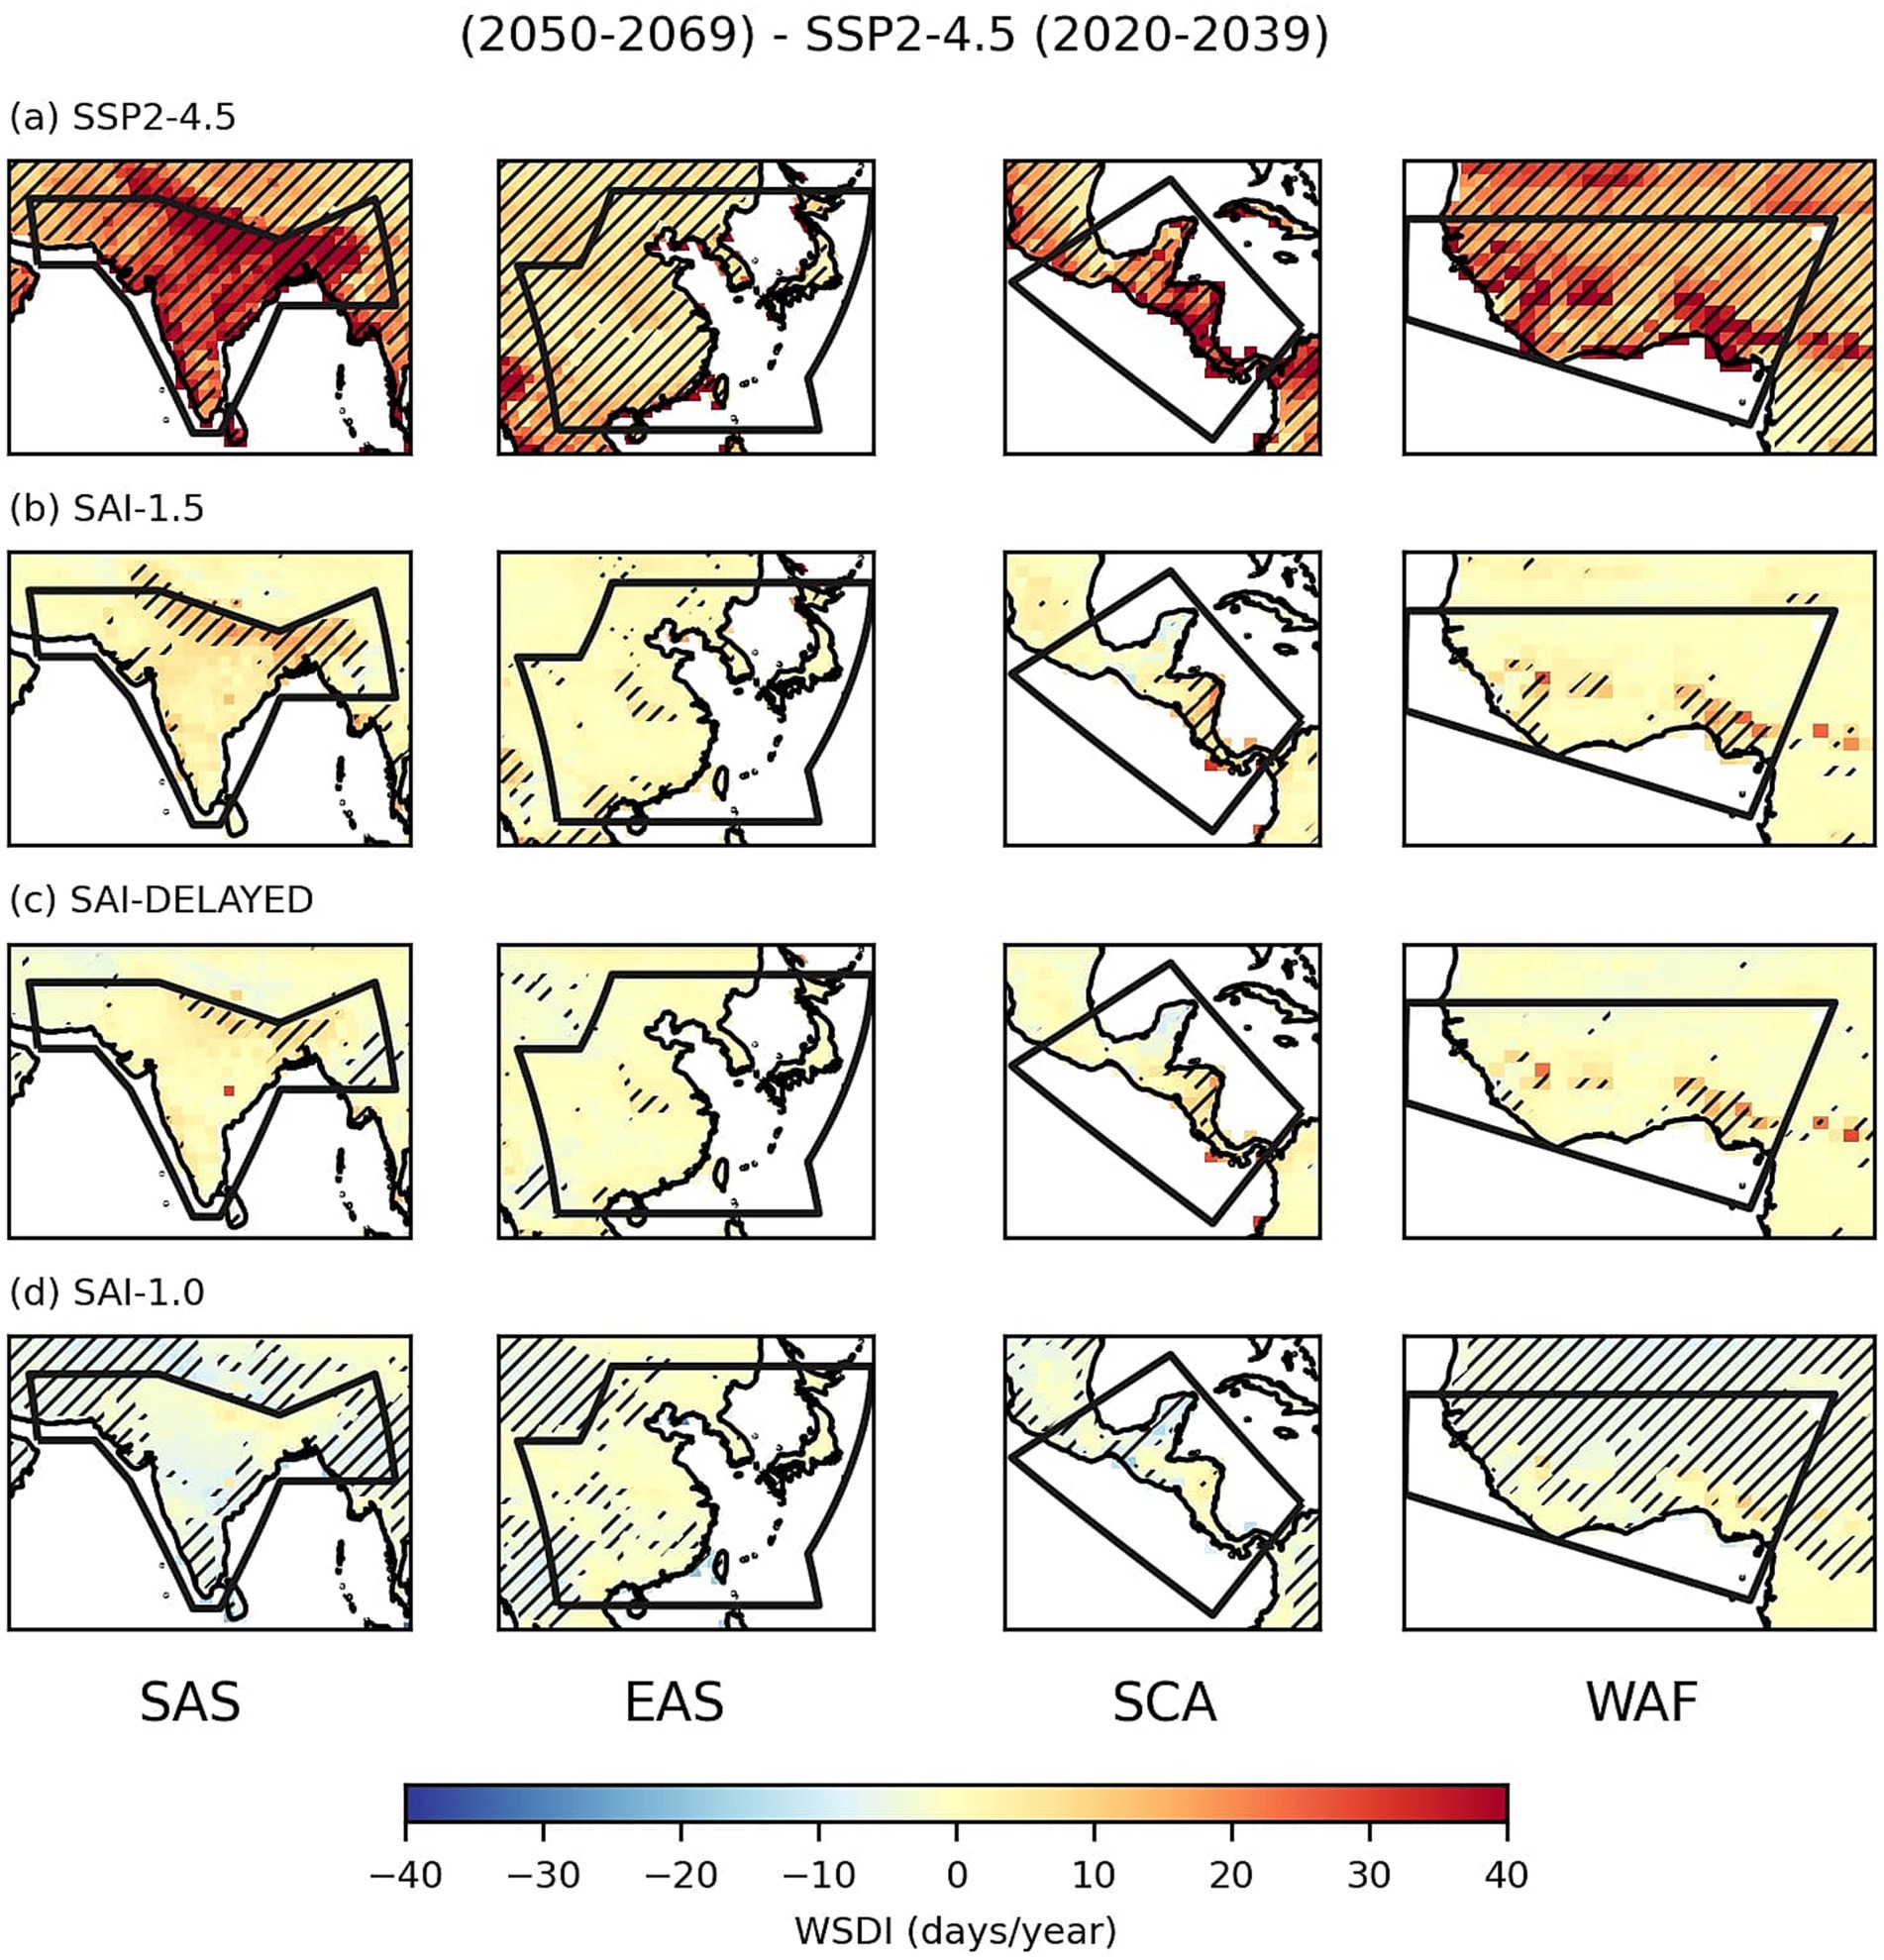
Figure 7. Changes in the Warm Spell Duration Index (WSDI) for each region relative to the base period. Changes are shown for the climate change scenario (a), SAI-1.5 (b), SAIDELAYED (c), and SAI-1.0 (d). The WSDI is the number of days per year that are part of heat spells (at least six consecutive days with temperatures above the 90th percentile relative to the SSP2-4.5 (2020-2039) base period. Hatching indicates significant differences at the 99% significance level using a Welch t-test.
The implications of TXx reductions in the SAI scenarios relative to the climate change scenario are significant. Vicedo-Cabrera et al. (2021) find that, in studied locations in Panama, Costa Rica, and Guatemala, ~40–60% of heat-related human deaths in 1991–2018 could be ascribed to climate change. In China, South Korea, Japan, and Taiwan, the percentages were ~20–40%. In India, as heat waves have become more frequent, intense, and persistent (e.g., Rohini et al., 2016; Singh et al., 2021), so has heat-related mortality. Mazdiyasni et al. (2017) find that, as summer mean temperatures and heat wave frequency in India increased from 1960 to 2009, the probability of more than 100 deaths from a given heat wave rose by 146%. In West Africa, although heat-related mortality has been much less extensively documented (Barry et al., 2018; Fotso-Nguemo et al., 2023), the risks are high. According to records from 13 West African countries over 1960–2010, mean annual maximum and minimum temperatures as well as the frequency of warm days and nights have all significantly increased (Barry et al., 2018). Thus, in the coming decades, even a small increase in TXx could have serious or even lethal impacts, which SAI (under the scenarios examined here) may lessen or even prevent.
Another extreme temperature index is WSDI, which measures the total number of days per year that are characterized as warm spells. A warm spell is a period of at least six consecutive days in which daily maximum temperatures exceed those of the 90th percentile for SSP2-4.5 (2020–2039) (ETCCDI, n.d.). Using all 10 ensemble members of SSP2-4.5 (2020–2039), we calculated, for each day of the year and grid point, the 90th percentile of maximum surface temperatures, using a centered, five-day moving average of daily data, as stipulated by ETCCDI (n.d.). WSDI is relevant to not only human well-being (e.g., Christidis and Stott, 2016; Hu et al., 2020), but also to the productivity of crops, which are vulnerable to heat stress (Luo, 2011; Kaushal et al., 2016; Hassan et al., 2021).
WSDI increases significantly relative to the base period under the climate change scenario for nearly all areas of the four regions (Figure 7a), consistent with projected changes in annual mean surface temperatures. Indeed, SAS experiences relatively large increases in both WSDI and annual mean surface temperatures (Figure 1a) relative to other regions of approximately the same latitude; in EAS, the increases in both these variables are smaller. Under SAI-1.5 and SAI-DELAYED, there are relatively few significant changes in WSDI in the four regions (Figures 7b,c), while under the SAI-1.0 scenario, WSDI decreases significantly across the four regions, particularly in SAS and WAF (Figure 7d).
3.2.3 Soil moisture
Quantifying observed changes in soil moisture over the past few decades is hampered by a lack of geographically and temporally extensive observations (Dorigo et al., 2012; IPCC, 2021). Recent decreases in soil moisture have been documented in parts of EAS and WAF, while in many other regions, including SAS and SCA, recent soil moisture changes are unclear (Dai and Zhao, 2017; Jia et al., 2018; Spinoni et al., 2019; Padrón et al., 2020). Model projections of soil moisture involve uncertainty not only with precipitation processes but also with soil processes (IPCC, 2021; Quintana-Seguí et al., 2020). A further problem is a lack of observations against which to test the models (Dorigo et al., 2012; IPCC, 2021). Overall, the CMIP6 models find a positive correlation between reduced precipitation and reduced soil moisture (Qiao et al., 2022). Decreases in soil moisture in the topmost layers of the soil tend to be relatively greater than decreases in precipitation due to anthropogenic changes in evaporative demand (Dai et al., 2018; Lu et al., 2019). However, the importance of internal variability relative to that of external forcing is high, rendering it difficult to make confident projections of future changes due to GHG forcing (IPCC, 2021).
One region expected to experience soil moisture decreases with relatively high confidence is SCA, and the decreases become even more pronounced with higher levels of global warming (Cook et al., 2014; Lu et al., 2019). Figure 8a shows that almost all land areas in SCA experience soil moisture decreases under climate change relative to the base period. Large portions of WAF also experience significant decreases in soil moisture. The SCA and WAF soil moisture decreases are consistent with projected future decreases in annual mean (Figure 2a) and wet season (Figure 5a) precipitation. In contrast, SAS experiences soil moisture decreases in only a few areas under climate change, while no clear drying signal emerges in EAS. In the SAI scenarios, due to both increased precipitation and decreased temperatures, soil moisture generally increases (Figures 8b–d), and these increases are most widely significant in SAI-1.0.
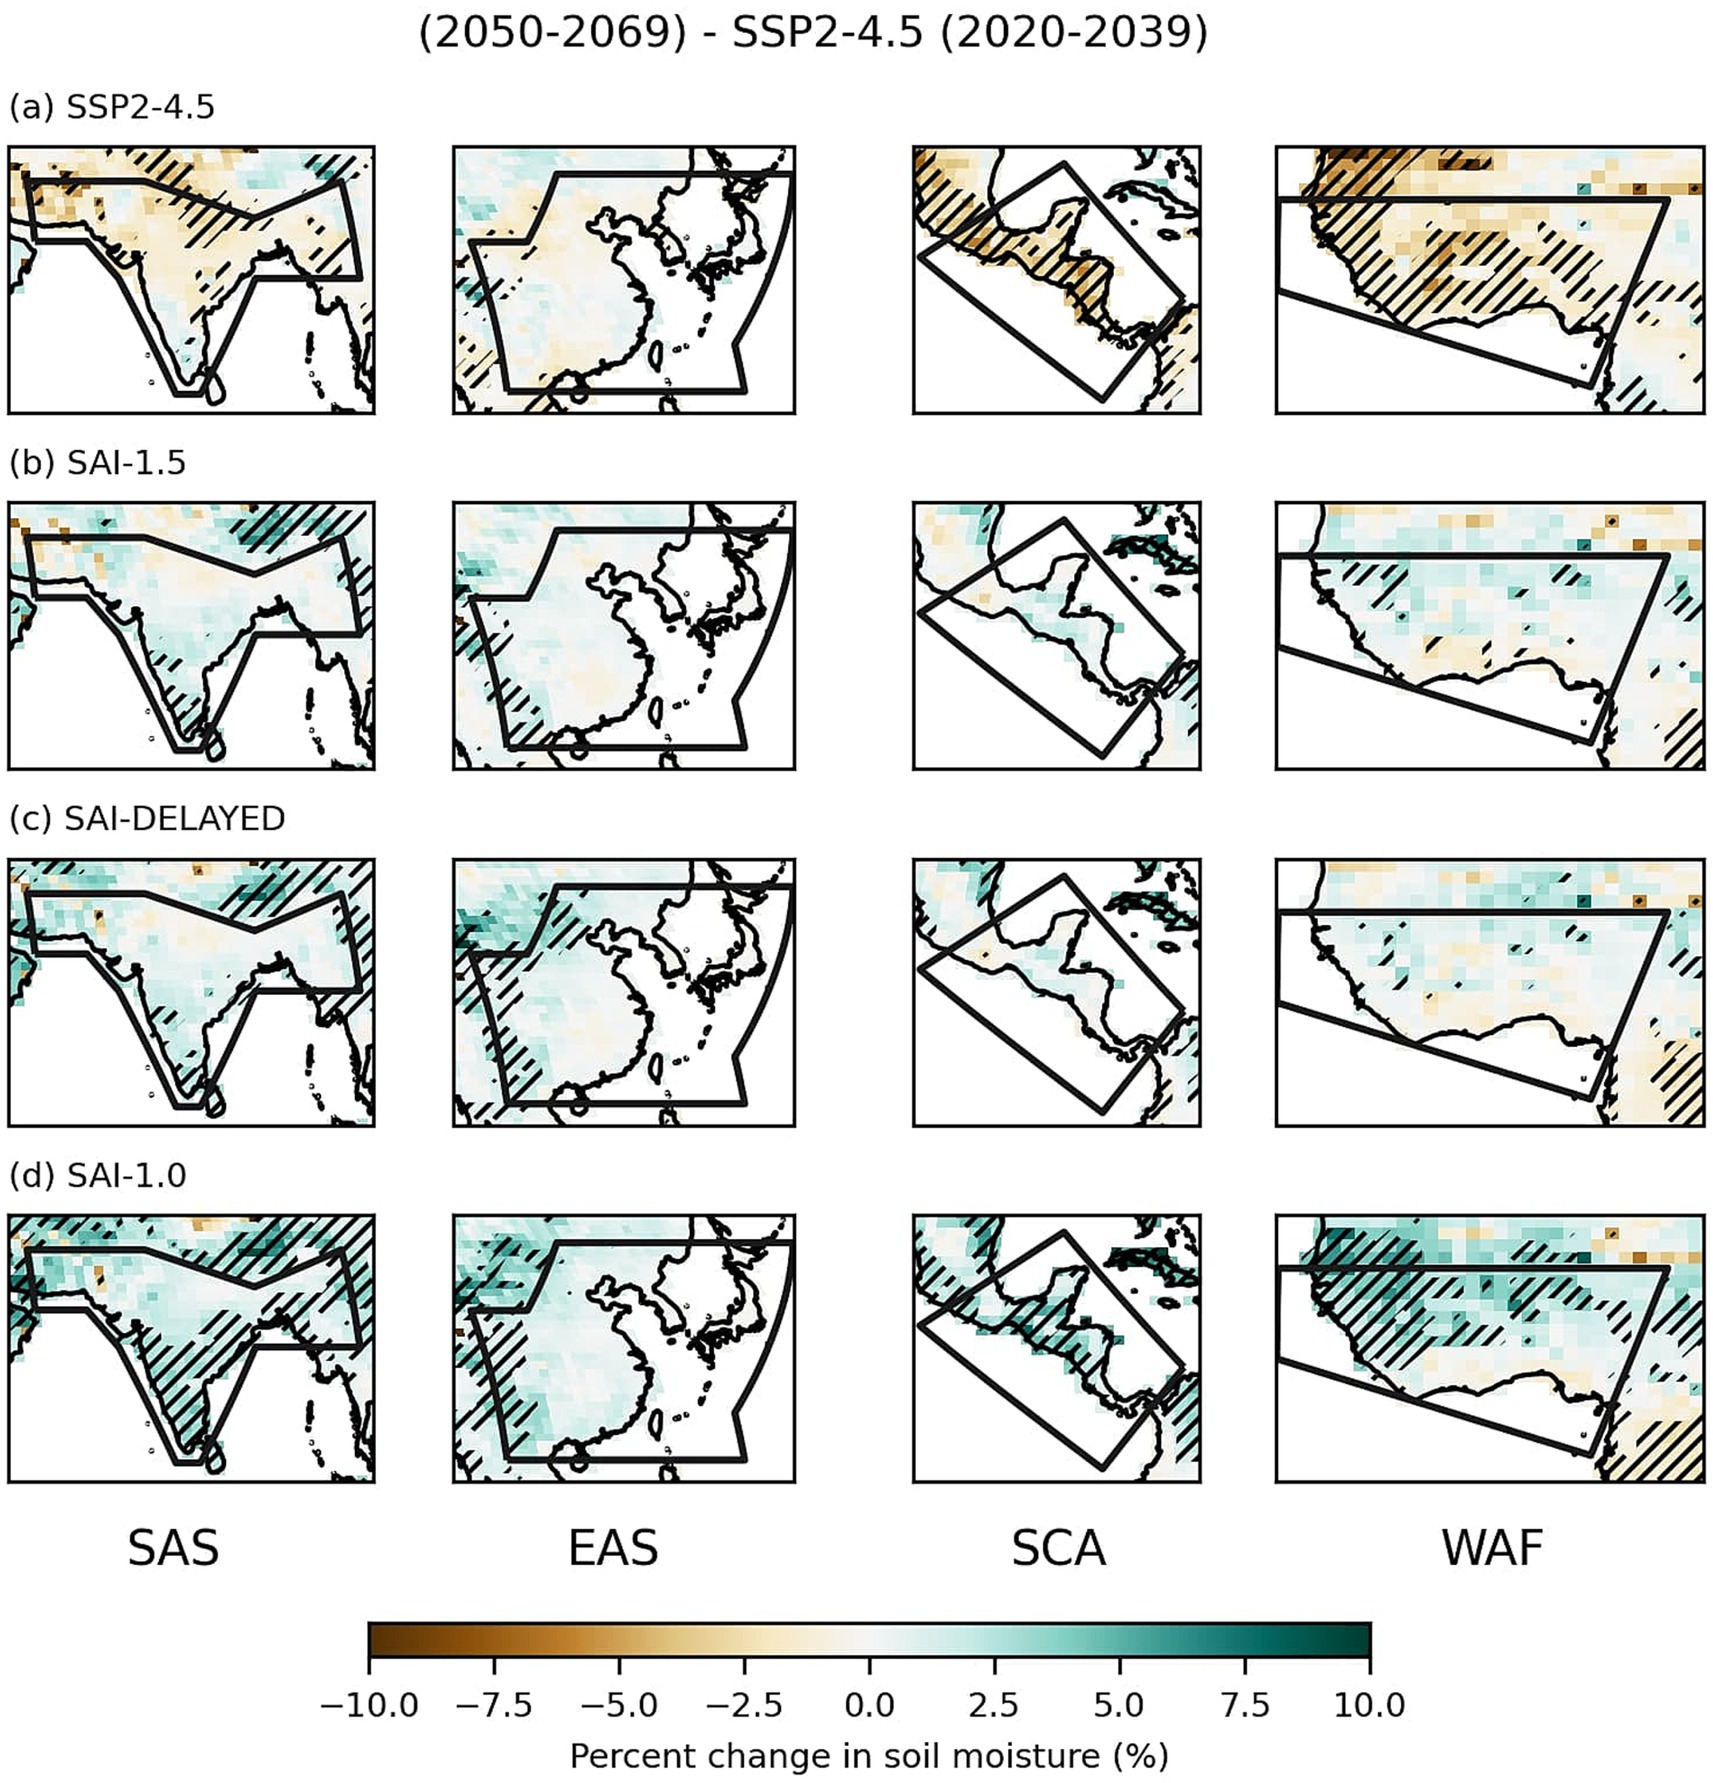
Figure 8. Percent changes in soil moisture in the top ten centimeters of the soil for each region and scenario relative to the base period. Changes are shown for the climate change scenario (a), SAI-1.5 (b), SAI-DELAYED (c), and SAI-1.0 (d). Hatching indicates significant differences at the 99% significance level using a Welch t-test.
Previous SAI studies have found fairly similar results in soil moisture changes. For instance, Cheng et al. (2019) found that soil moisture in the top 3.8 m of the soil under an SAI scenario (GLENS, Tilmes et al., 2018) increases in many world regions by the end of the century compared to the RCP 8.5 scenario (Riahi et al., 2011). Cheng et al. (2019) also show that soil moisture is greater under SAI relative to climate change in parts of EAS and SCA, but, unlike our study, it is less in parts of WAF and SAS. Such differences in results are likely due to differences in soil moisture definitions, models, and future scenarios. Liu et al. (2024) compare an SAI scenario (G6sulfur, Kravitz et al., 2015) to SSP2-4.5, both averaged over 2081–2,100. They find that, under the SAI scenario, soil moisture significantly increases in most land regions, including most areas of EAS, SAS, and WAF and a few areas of SCA.
3.2.4 Crop productivity
Under many climate change scenarios, the detrimental effect of heat stress has been found to override the “CO2 fertilization effect,” by which greater atmospheric CO2 stimulates photosynthesis and crop growth (Deryng et al., 2014; Fan et al., 2021; Rezaei et al., 2023). Other factors influencing crop productivity include changes in precipitation, soil moisture, and the extent to which plants open their stomata to receive CO2 for photosynthesis. The greater the amount of CO2, the less the stomata open and the less water leaves the plant, which is crucial in hot and arid conditions (Liang et al., 2023).
Under SAI, one might expect that plant productivity increases from CO2 fertilization and decreased heat stress (Pongratz et al., 2012; Irvine et al., 2017; Zhan et al., 2019). However, sunlight is critical for photosynthesis, and SAI scatters a small percentage of total sunlight away from Earth (Proctor et al., 2018). The abundance of diffuse sunlight, however, would increase under SAI. Some studies (e.g., Cheng et al., 2015) have indicated that plant productivity increases under diffuse sunlight, while others (e.g., Proctor et al., 2018; Xia et al., 2016) find that this tendency is not universal. Overall, there have been relatively few studies examining crop productivity under SAI. One exception is Grant et al. (2025). They found that, due to decreased heat stress combined with largely unchanged monsoon rainfall, rainfed rice and wheat yields tend to be greater in India in SAI-1.5 relative to SSP2-4.5 (both analyzed over 2050–2069).
Figure 9 analyzes percent changes in total crop yields relative to the base period. For a given crop, we combined rainfed and irrigated yields. We converted crop yields in a flux form (i.e., monthly-averaged values of grams of carbon per square meter per second) to average annual yields (grams of carbon per square meter). We then calculated percentage changes in yields. We note that, while CLM5 simulates important staples such as soy, rice, corn, and wheat, many important crops (e.g., cassava, millet, etc.) are not actively simulated by CLM5 (Lombardozzi et al., 2020).
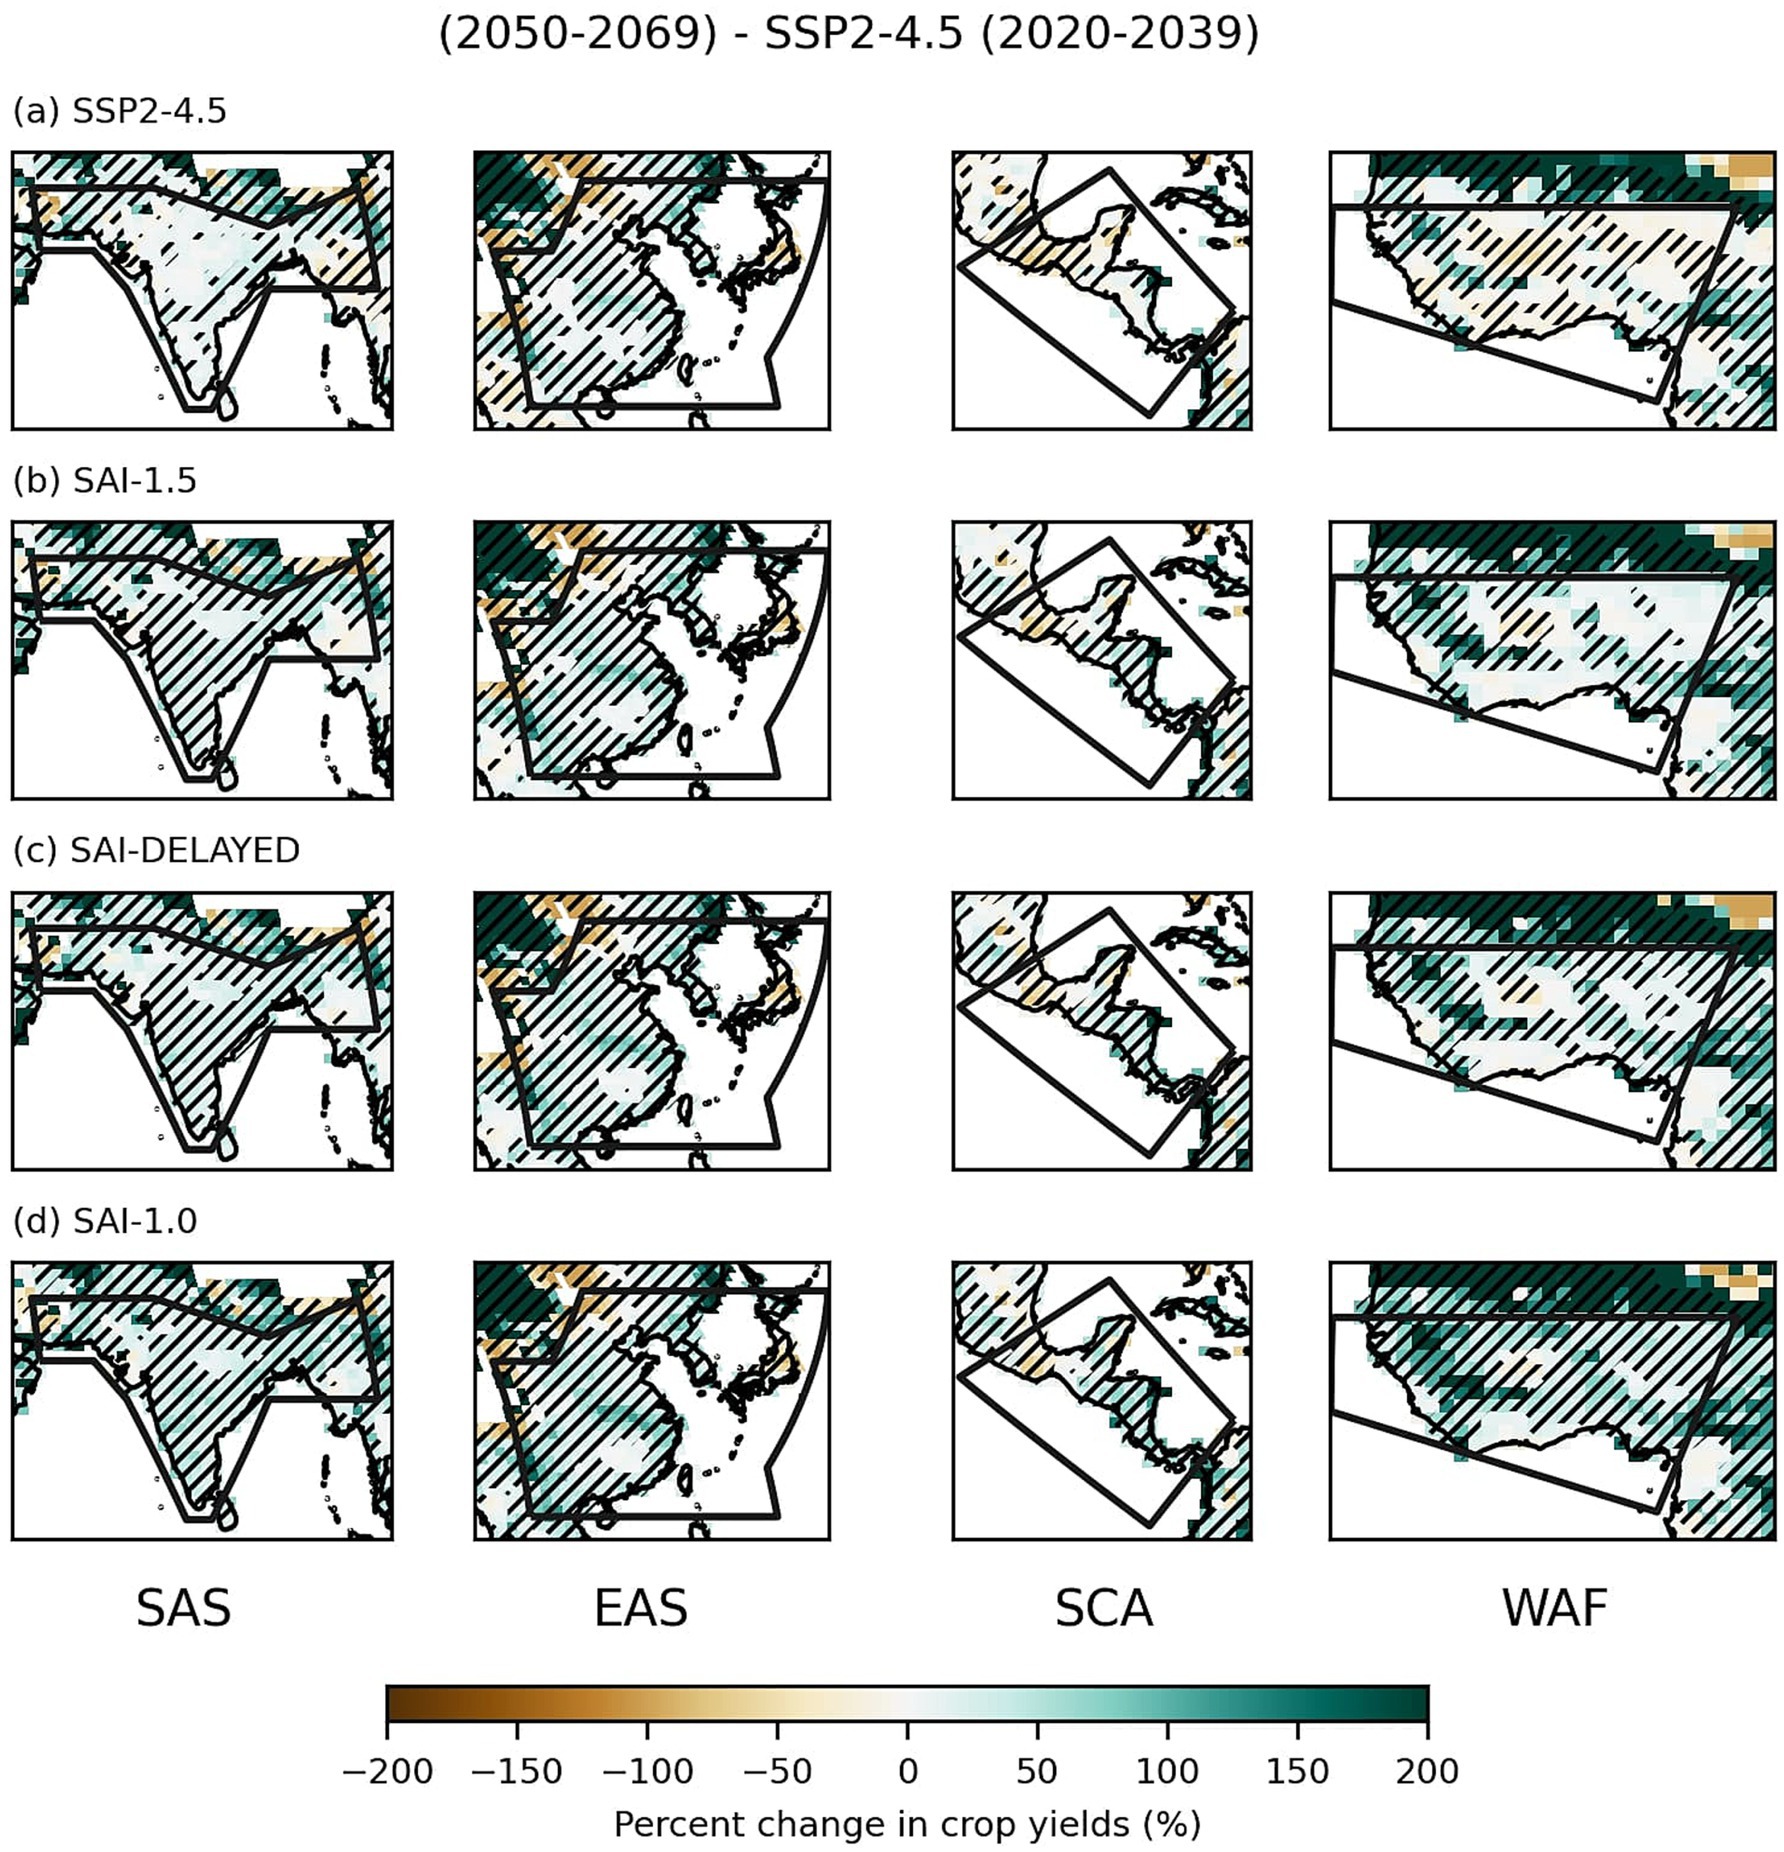
Figure 9. Percent changes in average annual total crop yields (measured in grams of carbon per square meter) for each region and scenario relative to the base period. Changes are shown for the climate change scenario (a), SAI-1.5 (b), SAI-DELAYED (c), and SAI-1.0 (d). Hatching indicates significant differences at the 99% significance level using a Welch t-test.
In Figure 9a, some areas of SAS, SCA, and WAF show significant increases in crop yields, but several areas experience overall yield decreases, particularly in WAF and SCA. In all three SAI scenarios (Figures 9b–d), crop yields increase in most areas of SAS, SCA, and WAF, consistent with decreased heat stress, greater precipitation and soil moisture (Figures 2, 5–8), as well as enhanced CO2 fertilization. In contrast, EAS crop yields increase under all scenarios, consistent with the overall lack of statistically significant reductions in precipitation and soil moisture due to both climate change and SAI, as well as the effect of CO2 fertilization (Figures 2, 5, 8).
Another important factor in analyzing future projected changes in crop yields is the crop type. C3 crops (e.g., rice, wheat, and soybeans) have higher stomatal conductance than C4 crops (e.g., sugarcane and corn) and therefore lose more water in warmer conditions. The higher water use during photosynthesis means that C3 crops are more susceptible to drought and extreme heat than C4 crops (Wang et al., 2008; Rezaei et al., 2023). C3 crops also benefit more from elevated CO2 than C4 crops (Rezaei et al., 2023). Fan et al. (2021) doubled CO2 concentrations from 380 to 760 ppm and found that corn yields increased by only 9%, while they increased by 20 and 31% for rice and wheat, respectively. They also concluded that wheat and rice were much less sensitive to temperature changes than the other crops. Lombardozzi et al. (2018) found that rice and wheat yields increased in all regions under RCP 8.5 in 2100 relative to 2000, whereas crop yields of soy and corn depended on the region.
In SAS and EAS, rice and wheat are major crops, which helps explain why these regions fare better in terms of crop yields than SCA and WAF, where corn is a major grain staple (Leff et al., 2004). In 2022, China was the world’s largest producer of rice and wheat, whereas India was the second largest producer (FAO, n.d.). Although corn is a major commodity in these countries, especially in China, the relative importance of rice and wheat is greater; for instance, in 2022, the combined yields of rice and wheat in China and India were about 1.3 and 9.2 times greater than those of corn, respectively (FAO, no date). In contrast, in Nigeria and Guatemala, corn yields were about 1.5 and 74.3 times greater, respectively, than combined rice and wheat yields (FAO, n.d.).
Given the importance of rice to SAS and EAS and corn to SCA and WAF, Figure 10 illustrates how yields of these crops would change under the climate change and SAI scenarios. The changes in precipitation, changes in soil moisture, and the distributions of C3 and C4 plants all contribute to the different trajectories of SAS and EAS versus WAF and SCA. In EAS, rice yields increase significantly in all scenarios in most areas. In SAS, rice yields increase significantly in the three SAI scenarios (Figures 10b–d) and to a lesser extent under the climate change scenario (Figure 10a). The increase in SAS rice yields under SAI-1.5 compared to SSP2-4.5 is consistent, overall, with the findings of Grant et al. (2025). In SCA and WAF, by contrast, the climate change scenario leads to a statistically significant decrease in corn yields. Under the SAI scenarios, corn yields are the same or, in a few areas, statistically significantly greater than in the base period, but these increases are much smaller than those experienced in SAS and EAS.

Figure 10. Percent changes in yields of major crops (rice for SAS and EAS, corn for WAF and SCA) for each region and scenario relative to the base period. Changes are shown for the climate change scenario (a), SAI-1.5 (b), SAIDELAYED (c), and SAI-1.0 (d). Hatching indicates significant differences at the 99% significance level using a Welch t-test.
Finally, Figure 11 analyzes percentage changes of spring wheat, soybeans, corn, and rice in each region and under each scenario. CLM5 makes a distinction between tropical and temperate soybeans and corn based on latitude (Lombardozzi et al., 2020). EAS is the only region producing both temperate and tropical corn and soybeans. Thus, for a just comparison among regions, only the tropical varieties of corn and soybeans were considered.
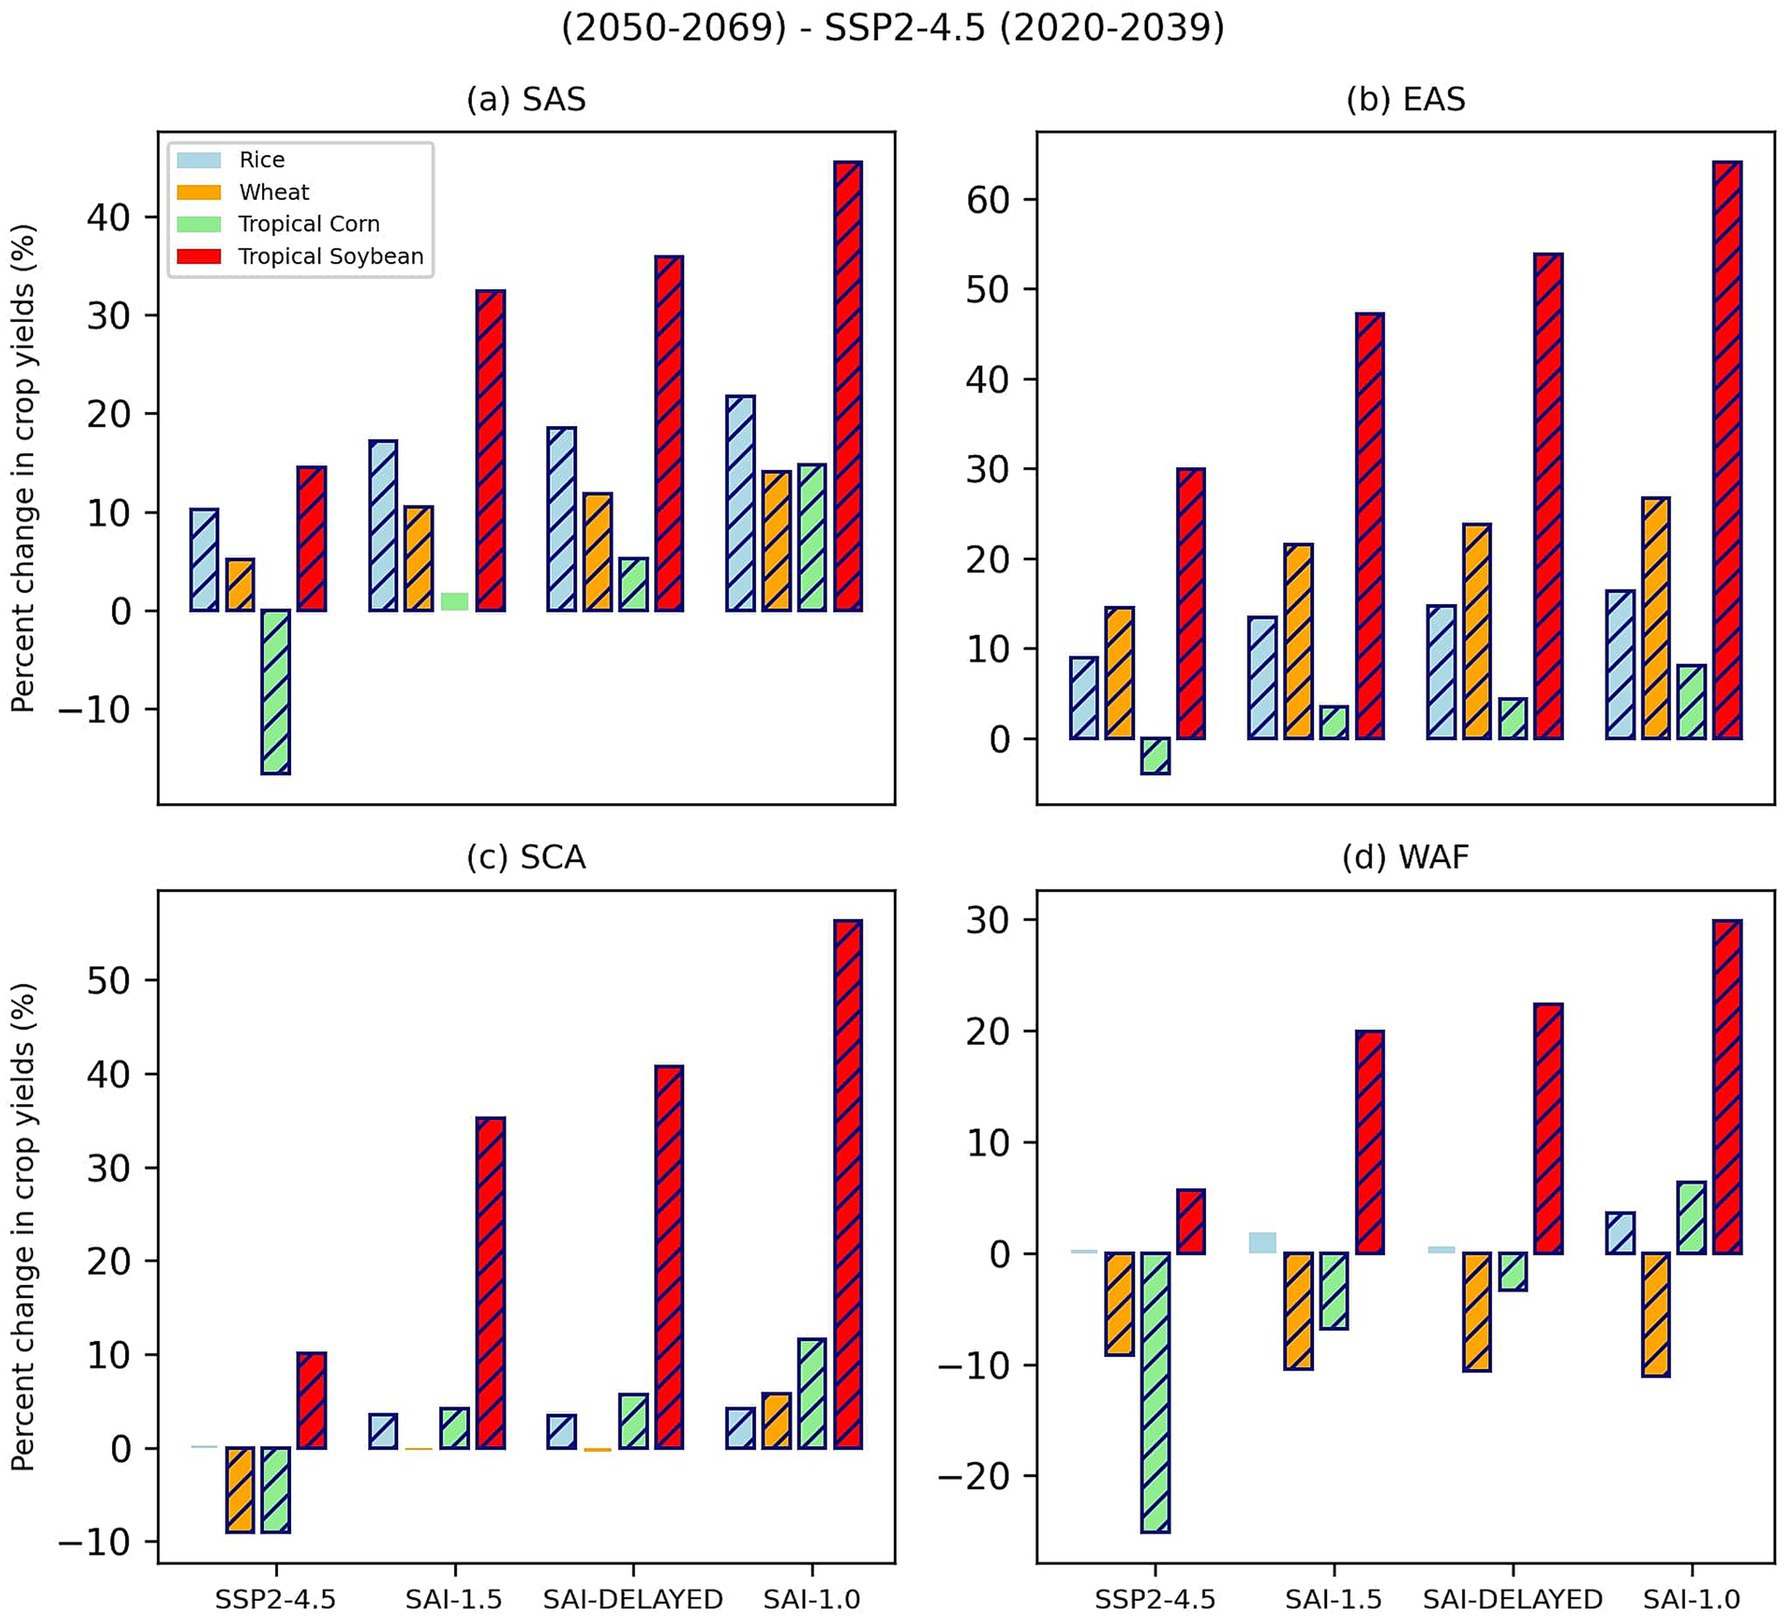
Figure 11. A comparison of percent changes in corn, rice, wheat, and soy yields for the four regions with respect to the base period. The climate change and SAI scenarios are analyzed from 2050-2069. Changes are shown for South Asia (a), East Asia (b), South Central America (c), and West Africa (d). Hatched bars indicate statistically significant changes at the 99% confidence level using a Welch t-test.
For all regions, the yields of rice, wheat, corn and soy are generally greater under SAI-1.0 compared to climate change. One exception is wheat yield in WAF, which is slightly smaller under SAI-1.0 than under climate change. Soybean yields, which tend to be overestimated in CLM5 (Fan et al., 2021), increased substantially in all regions and all scenarios relative to the base period. Corn yields experience significant decreases under the climate change scenario in all four regions.
In EAS and SAS, rice and wheat show large increases in crop growth compared to the base period under all scenarios. In contrast, in SCA, the yields of rice and wheat increase slightly or decrease. In WAF, wheat yields significantly decrease under all four scenarios and corn yields significantly decrease under all scenarios except SAI-1.0. The reduced precipitation and soil moisture in SCA and WAF help explain the differences in the results relative to EAS and SAS. We computed the correlation coefficient between regionally averaged, annual-mean time series of total crop yields and soil moisture for SSP2-4.5 (2020–2069), with all 10 ensemble members combined as one 500-year time series. The coefficients were 0.14, −0.03 (not significantly different from zero), 0.40, and 0.61 for SAS, EAS, SCA, and WAF, respectively. Thus, in SCA and WAF, the relationship between soil moisture and crop yields is much stronger than in SAS and EAS. Since soil moisture decreases overall under climate change in SCA and WAF, crop yields also dwindle in these regions.
4 Discussion
In recent years, as the effects of anthropogenic climate change have become more widespread and severe, scientific investigation into the potential benefits and risks of SAI has also increased. Many studies (e.g., Mamalakis et al., 2023; Simpson et al., 2019; Richter et al., 2022; Haywood et al., 2025; Zhang et al., 2024) have analyzed the global impacts of SAI on fundamental variables such as temperature and precipitation. Other studies have globally analyzed the impact of SAI on other Earth-system variables, such as temperature extremes (e.g., Ji et al., 2018; Alamou et al., 2022; Jiang et al., 2024) and soil moisture (e.g., Cheng et al., 2019; Liu et al., 2024). Relatively few studies (e.g., Da-Allada et al., 2020; Grant et al., 2025) have examined various SAI-induced impacts in specific regions.
Our study is a somewhat unique contribution to this ever-growing body of scholarship. While the relationship between socioeconomic conditions and climate change severity has been extensively studied (World Bank, 2013; Bathiany et al., 2018; Jafino et al., 2020), the socioeconomic aspect of SAI has received relatively little attention. We analyze regions (SAS, EAS, SCA, and WAF) whose populations may be particularly vulnerable to climate change. We examine several variables pertinent to human well-being, such as wet season precipitation, temperature extremes, and crop productivity. We also analyzed three different SAI scenarios; to our knowledge, no other study has done so.
We found that the SAI scenarios mitigate some of the adverse impacts of climate change in our four regions. Specifically, under the SAI scenarios, precipitation, soil moisture and crop productivity tend to be greater relative to climate change, and average temperatures and temperature extremes (TXx and WSDI) are reduced. The overall shapes of the annual temperature and precipitation cycles over the four regions examined are also maintained under the SAI scenarios. In general, larger changes relative to the climate change scenario are observed in SAI-1.0 relative to SAI-1.5 and SAI-DELAYED due to the targeting of lower global surface temperatures in the former.
In contrast to the SAI impacts, which are similar in the four regions, the simulated impacts of climate change differ substantially from one region to the next. For instance, under the climate change scenario, there are few significant changes (relative to the base period) in SAS and EAS in wet season precipitation; in SCA and WAF, however, wet season precipitation decreases significantly. These regional differences help explain projected changes in soil moisture. Under the climate change scenario, soil moisture experiences few significant changes in EAS and decreases in relatively small areas of SAS and large areas of SCA and WAF. Under the SAI scenarios, particularly SAI-1.0, soil moisture generally increases in all regions.
Total crop yield changes further mirror the tendencies in soil moisture: SCA, WAF, and to a lesser extent, SAS experience lower yields under climate change (relative to the base period) and higher yields under SAI, while EAS yields increase under all scenarios. Besides reduced heat stress, CO2 fertilization, and increased precipitation, the type of crop also helps explain these regional differences. In SAS and EAS, major crops include rice and wheat, while, in SCA and WAF, corn is a major staple (Leff et al., 2004; FAO, n.d.). Higher CO2 concentrations tend to increase the productivity of rice and wheat (C3 crops) but not corn (a C4 crop) due to their greater stomatal conductance (Rezaei et al., 2023). The percent changes in yields of major crops (rice, wheat, corn, and soy) compared to the base period are mostly positive in all scenarios in SAS and EAS, but this is not the case for SCA and WAF (Figure 11).
We emphasize that our findings are dependent on the model and emissions scenario used. Many different SAI scenarios exist (e.g., Kravitz et al., 2011; Tilmes et al., 2017; Lee et al., 2021; Lee et al., 2023; Goddard et al., 2023). Some scenarios are more unrealistic than others, such as those using the RCP 8.5 emissions scenario with SAI deployment starting in 2020, further hindering effective comparison among scenarios (MacMartin et al., 2022). One such scenario is the Geoengineering Large Ensemble (GLENS) (Tilmes et al., 2018). Simpson et al. (2019) compare precipitation in GLENS (2075–2095) to RCP 8.5 (2010–2030). They found a failure of the Indian monsoon (represented by JJA precipitation), which would be a disaster for millions of people. In contrast, we found that Indian subcontinent wet season (and annual-mean) precipitation under ARISE-SAI overall shows no significant change from the base period, with some significant increases in southern regions of India in SAI-DELAYED and SAI-1.0 (Figures 2, 5). Similarly, Grant et al. (2025) found that Indian monsoon rainfall in ARISE-SAI-1.5 (2050–2069) is maintained relative to 2015–2034. GLENS and ARISE, however, differ in important aspects. For instance, GLENS and ARISE were simulated with CESM1 and CESM2, use the RCP 8.5 and SSP2-4.5 emissions scenarios, and SAI deployment begins in 2020 and 2035, respectively (Tilmes et al., 2018; Richter et al., 2022). MacMartin et al. (2022) have also created new SAI simulations to facilitate future inter-scenario comparisons. Additional model and scenario comparison studies, while beyond the scope of this paper, will prove valuable in future SAI research.
In addition, while Earth-system models are an incredibly powerful tool, they also possess limitations, including biases in the simulated mean climate (Danabasoglu et al., 2020), shortcomings in the parameterizations of microphysical aerosol processes (Haywood et al., 2025), and problems in their simulation of crops, including over our regions of study. The crop biases are due to such factors as recent technological agricultural advances and the impacts of plant pathogens and extreme weather, none of which are incorporated in CLM5 (Lawrence et al., 2019; Lombardozzi et al., 2020). While the total yields found in our study are affected by these biases, our analysis only focuses on the net changes over time under various future climate scenarios. We also note that crop yields do not indicate the crops’ nutritional value. High temperature and enhanced CO2 growing conditions, for instance, decrease the nutritional value of cereals and legumes, compounding the problem of decreased yields (Scheelbeek et al., 2018; Soares et al., 2019).
Overall, the detrimental impacts of climate change, particularly from a crop productivity perspective, are projected to be more severe in world regions already quite susceptible socioeconomically to climate change, such as WAF and SCA. If SAI were deployed under the scenarios examined here, some of climate change’s deleterious impacts might be alleviated in these regions. We recommend further research to examine SAI’s possible impacts on human welfare in other regions, especially those most vulnerable to climate change (Hurrell et al., 2024; Haywood et al., 2025).
Data availability statement
The original contributions presented in the study are included in the article/Supplementary material, further inquiries can be directed to the corresponding author.
Author contributions
SC: Writing – original draft. JH: Writing – review & editing. DL: Writing – review & editing.
Funding
The author(s) declare that financial support was received for the research and/or publication of this article. This work was supported by a gift from the LAD Climate Fund as well as the Walter Scott Jr. College of Engineering at Colorado State University.
Conflict of interest
The authors declare that the research was conducted in the absence of any commercial or financial relationships that could be construed as a potential conflict of interest.
Generative AI statement
The authors declare that no Gen AI was used in the creation of this manuscript.
Publisher’s note
All claims expressed in this article are solely those of the authors and do not necessarily represent those of their affiliated organizations, or those of the publisher, the editors and the reviewers. Any product that may be evaluated in this article, or claim that may be made by its manufacturer, is not guaranteed or endorsed by the publisher.
Supplementary material
The Supplementary material for this article can be found online at: https://www.frontiersin.org/articles/10.3389/fclim.2025.1582747/full#supplementary-material
References
Alamou, E. A., Zandagba, J. E., Biao, E. I., Obada, E., Da-Allada, C. Y., Bonou, F. K., et al. (2022). Impact of stratospheric aerosol geoengineering on extreme precipitation and temperature indices in West Africa using GLENS simulations. J. Geophys. Res. Atmos. 127:855. doi: 10.1029/2021JD035855
Alpízar, F., Saborío-Rodríguez, M., Martínez-Rodríguez, M. R., Viguera, B., Vignola, R., Capitán, T., et al. (2020). Determinants of food insecurity among smallholder farmer households in Central America: recurrent versus extreme weather-driven events. Reg. Environ. Chang. 20:22. doi: 10.1007/s10113-020-01592-y
Amale, H. S., Birthal, P. S., and Negi, D. S. (2023). Delayed monsoon, irrigation and crop yields. Agric. Econ. 54, 77–94. doi: 10.1111/agec.12746
Anderson, R., Bayer, P. E., and Edwards, D. (2020). Climate change and the need for agricultural adaptation. Curr. Opin. Plant Biol. 56, 197–202. doi: 10.1016/j.pbi.2019.12.006
Barnes, E. A., Hurrell, J. W., and Sun, L. (2022). Detecting changes in global extremes under the GLENS-SAI climate intervention strategy. Geophys. Res. Lett. 49:198. doi: 10.1029/2022GL100198
Barr, R., Fankhauser, S., and Hamilton, K. (2010). Adaptation investments: a resource allocation framework. Mitig. Adapt. Strateg. Glob. Chang. 15, 843–858. doi: 10.1007/s11027-010-9242-1
Barry, A. A., Caesar, J., Klein Tank, A. M. G., Aguilar, E., McSweeney, C., Cyrille, A. M., et al. (2018). West Africa climate extremes and climate change indices. Int. J. Climatol. 38, e921–e938. doi: 10.1002/joc.5420
Bathiany, S., Dakos, V., Scheffer, M., and Lenton, T. M. (2018). Climate models predict increasing temperature variability in poor countries. Sci. Adv. 4:eaar5809. doi: 10.1126/sciadv.aar5809
Bednarz, E. M., Butler, A. H., Visioni, D., Zhang, Y., Kravitz, B., and MacMartin, D. G. (2023). Injection strategy–a driver of atmospheric circulation and ozone response to stratospheric aerosol geoengineering. Atmos. Chem. Phys. 23, 13665–13684. doi: 10.5194/acp-23-13665-2023
Bevacqua, E., Vousdoukas, M. I., Zappa, G., Hodges, K., Shepherd, T. G., Maraun, D., et al. (2020). More meteorological events that drive compound coastal flooding are projected under climate change. Commun. Earth Environ. 1:47. doi: 10.1038/s43247-020-00044-z
Bombardi, R. J., Moron, V., and Goodnight, J. S. (2020). Detection, variability, and predictability of monsoon onset and withdrawal dates: a review. Int. J. Climatol. 40, 641–667. doi: 10.1002/joc.6264
Bourgault, P., Huard, D., Smith, T. J., Logan, T., Aoun, A., Lavoie, J., et al. (2023). Xclim: xarray-based climate data analytics. J. Open Source Softw. 8:5415. doi: 10.21105/joss.05415
Bowen, A., Cochrane, S., and Fankhauser, S. (2012). Climate change, adaptation and economic growth. Clim. Chang. 113, 95–106. doi: 10.1007/s10584-011-0346-8
Brody, E., Visioni, D., Bednarz, E. M., Kravitz, B., MacMartin, D. G., Richter, J. H., et al. (2024). Kicking the can down the road: understanding the effects of delaying the deployment of stratospheric aerosol injection. Environ. Res. 3:ad53f3. doi: 10.1088/2752-5295/ad53f3
Cai, W., Santoso, A., Collins, M., Dewitte, B., Karamperidou, C., Kug, J. S., et al. (2021). Changing El Niño–southern oscillation in a warming climate. Nat. Rev. Earth Environ. 2, 628–644. doi: 10.1038/s43017-021-00199-z
Cheng, S. J., Bohrer, G., Steiner, A. L., Hollinger, D. Y., Suyker, A., Phillips, R. P., et al. (2015). Variations in the influence of diffuse light on gross primary productivity in temperate ecosystems. Agric. For. Meteorol. 201, 98–110. doi: 10.1016/j.agrformet.2014.11.002
Cheng, W., MacMartin, D. G., Dagon, K., Kravitz, B., Tilmes, S., Richter, J. H., et al. (2019). Soil moisture and other hydrological changes in a stratospheric aerosol geoengineering Large ensemble. J. Geophys. Res. Atmos. 124, 12773–12793. doi: 10.1029/2018JD030237
Christidis, N., and Stott, P. A. (2016). Attribution analyses of temperature extremes using a set of 16 indices. Weather and climate. Extremes 14, 24–35. doi: 10.1016/j.wace.2016.10.003
Cook, B. I., Smerdon, J. E., Seager, R., and Coats, S. (2014). Global warming and 21st century drying. Clim. Dyn. 43, 2607–2627. doi: 10.1007/s00382-014-2075-y
Crutzen, P. J. (2006). Albedo enhancement by stratospheric sulfur injections: a contribution to resolve a policy dilemma? Clim. Chang. 77:211. doi: 10.1007/s10584-006-9101-y
Da-Allada, C. Y., Baloïtcha, E., Alamou, E. A., Awo, F. M., Bonou, F., Pomalegni, Y., et al. (2020). Changes in West African summer monsoon precipitation under stratospheric aerosol geoengineering. Earths Future 8:595. doi: 10.1029/2020EF001595
Dai, A., and Zhao, T. (2017). Uncertainties in historical changes and future projections of drought. Part I: estimates of historical drought changes. Clim. Change 144, 519–533. doi: 10.1007/s10584-016-1705-2
Dai, A., Zhao, T., and Chen, J. (2018). Climate change and drought: a precipitation and evaporation perspective. Curr. Clim. Chang. Rep. 4, 301–312. doi: 10.1007/s40641-018-0101-6
Danabasoglu, G., Lamarque, J.-F., Bacmeister, J., Bailey, D. A., DuVivier, A. K., Edwards, J., et al. (2020). The community earth system model version 2 (CESM2). J. Adv. Model. Earth Syst. 12:e2019MS001916. doi: 10.1029/2019MS001916
Deryng, D., Conway, D., Ramankutty, N., Price, J., and Warren, R. (2014). Global crop yield response to extreme heat stress under multiple climate change futures. Environ. Res. Lett. 9:034011. doi: 10.1088/1748-9326/9/3/034011
Dong, S., Sun, Y., Aguilar, E., Zhang, X., Peterson, T. C., Song, L., et al. (2018). Observed changes in temperature extremes over Asia and their attribution. Clim. Dyn. 51, 339–353. doi: 10.1007/s00382-017-3927-z
Dorigo, W., de Jeu, R., Chung, D., Parinussa, R., Liu, Y., Wagner, W., et al. (2012). Evaluating global trends (1988-2010) in harmonized multi-satellite surface soil moisture. Geophys. Res. Lett. 39:988. doi: 10.1029/2012GL052988
ETCCDI. (n.d.). ETCCDI Climate Change Indices. Available online at: https://etccdi.pacificclimate.org/list_27_indices.shtml (Accessed February 12, 2025).
Fankhauser, S., and McDermott, T. K. (2014). Understanding the adaptation deficit: why are poor countries more vulnerable to climate events than rich countries? Glob. Environ. Chang. 27, 9–18. doi: 10.1016/j.gloenvcha.2014.04.014
Fan, Y., Tjiputra, J., Muri, H., Lombardozzi, D., Park, C. E., Wu, S., et al. (2021). Solar geoengineering can alleviate climate change pressures on crop yields. Nat. Food 2, 373–381. doi: 10.1038/s43016-021-00278-w
FAO. (2024). The State of Food Security and Nutrition in the World 2024: Financing to end hunger, food insecurity and malnutrition in all its forms. Rome: FAO, IFAD, UNICEF, WFP and WHO.
FAO. (n.d.). FAOSTAT (Food and Agriculture Organization Corporate Statistical Database). Available online at: https://www.fao.org/faostat/en/ (Accessed February 12, 2025).
Ferraro, A. J., Highwood, E. J., and Charlton-Perez, A. J. (2014). Weakened tropical circulation and reduced precipitation in response to geoengineering. Environ. Res. Lett. 9:014001. doi: 10.1088/1748-9326/9/1/014001
Fischer, E. M., and Knutti, R. (2014). Detection of spatially aggregated changes in temperature and precipitation extremes. Geophys. Res. Lett. 41, 547–554. doi: 10.1002/2013GL058499
Fotso-Nguemo, T. C., Weber, T., Diedhiou, A., Chouto, S., Vondou, D. A., Rechid, D., et al. (2023). Projected impact of increased global warming on heat stress and exposed population over Africa. Earths Future 11:268. doi: 10.1029/2022EF003268
Gadgil, S. (2018). The monsoon system: land–sea breeze or the ITCZ? J. Earth Syst. Sci. 127, 1–29. doi: 10.1007/s12040-017-0916-x
Gan, N. (2022). China’s worst heat wave on record is crippling power supplies. How it reacts will impact us all. Available online at: https://www.cnn.com/2022/08/26/china/china-sichuan-power-crunch-climate-change-mic-intl-hnk/index.html (Accessed February 12, 2025).
Gao, J. (2020). Global 1-km Downscaled Population Grids, SSP-Consistent Projections and Base Year, v1.01 (2000- 2100). doi: 10.7910/DVN/TLJ99B
Gbode, I. E., Ogunjobi, K. O., Dudhia, J., Ajayi, V. O., and Liu, C. (2021). Impacts of global warming on West African monsoon rainfall: downscaling by pseudo global warming method. Atmos. Res. 249:105334. doi: 10.1016/j.atmosres.2020.105334
Geen, R., Bordoni, S., Battisti, D. S., and Hui, K. (2020). Monsoons, ITCZs, and the concept of the global monsoon. Rev. Geophys. 58:e2020RG000700. doi: 10.1029/2020RG000700
Gettelman, A., Mills, M. J., Kinnison, D. E., Garcia, R. R., Smith, A. K., Marsh, D. R., et al. (2019). The whole atmosphere community climate model version 6 (WACCM6). J. Geophys. Res. Atmos. 124, 12380–12403. doi: 10.1029/2019JD030943
Goddard, P. B., Kravitz, B., MacMartin, D. G., Visioni, D., Bednarz, E. M., and Lee, W. R. (2023). Stratospheric aerosol injection can reduce risks to Antarctic ice loss depending on injection location and amount. J. Geophys. Res. Atmos. 128:434. doi: 10.1029/2023JD039434
Grant, N., Robock, A., Xia, L., Singh, J., and Clark, B. (2025). Impacts on Indian agriculture due to stratospheric aerosol intervention using agroclimatic indices. Earth's. Future 13:e2024EF005262. doi: 10.1029/2024EF005262
Gu, Q., Gervais, M., Danabasoglu, G., Kim, W. M., Castruccio, F., Maroon, E., et al. (2024). Wide range of possible trajectories of North Atlantic climate in a warming world. Nat. Commun. 15:4221. doi: 10.1038/s41467-024-48401-2
Halstead, J. (2018). Stratospheric aerosol injection research and existential risk. Futures 102, 63–77. doi: 10.1016/j.futures.2018.03.004
Hassan, M. U., Chattha, M. U., Khan, I., Chattha, M. B., Barbanti, L., Aamer, M., et al. (2021). Heat stress in cultivated plants: nature, impact, mechanisms, and mitigation strategies—a review. Plant Biosyst. 155, 211–234. doi: 10.1080/11263504.2020.172798
Hauser, M., Spring, A., Busecke, J., van Driel, M., and Lorenz, R. (2024). Regionmask: Version 0.12.1. Available online at: https://zenodo.org/records/10849860 (Accessed February 12, 2025).
Hausfather, Z. (2025). An assessment of current policy scenarios over the 21st century and the reduced plausibility of high-emissions pathways. Dialog. Climate Change 2, 26–32. doi: 10.1177/29768659241304854
Haywood, J., Boucher, O., Lennard, C., Storelvmo, T., Tilmes, S., and Visioni, D. (2025). World climate research program lighthouse activity: an assessment of major research gaps in solar radiation modification research. Front. Climate 7:1507479. doi: 10.3389/fclim.2025.1507479
Held, I. M., and Soden, B. J. (2006). Robust responses of the hydrological cycle to global warming. J. Clim. 19, 5686–5699. doi: 10.1175/jcli3990.1
He, Y., Oh, J., Lee, E., and Kim, Y. (2022). Land cover and land use mapping of the east Asian summer monsoon region from 1982 to 2015. Land 11:391. doi: 10.3390/land11030391
Hueholt, D. M., Barnes, E. A., Hurrell, J. W., Richter, J. H., and Sun, L. (2023). Assessing outcomes in stratospheric aerosol injection scenarios shortly after deployment. Earth's. Future 11:e2023EF003488. doi: 10.1029/2023EF003488
Hurrell, J. W., Haywood, J. M., Lawrence, P. J., Lennard, C. J., and Oschlies, A. (2024). Climate intervention research in the world climate research Programme: a perspective. Front Climate 6:1505860. doi: 10.3389/fclim.2024.1505860
Hu, T., Sun, Y., Zhang, X., Min, S.-K., and Kim, Y.-H. (2020). Human influence on frequency of temperature extremes. Environ. Res. Lett. 15:64014. doi: 10.1088/1748-9326/ab8497
IPCC (2021). Climate change 2021: The physical science basis. Contribution of working group I to the sixth assessment report of the intergovernmental panel on climate change. Cambridge: Cambridge University Press.
IPCC. (2023). Synthesis Report of the IPCC Sixth Assessment Report: Longer Report. Available online at: https://report.ipcc.ch/ar6syr/pdf/IPCC_AR6_SYR_LongerReport.pdf (Accessed February 12, 2025).
Irvine, P. J., Kravitz, B., Lawrence, M. G., Gerten, D., Caminade, C., Gosling, S. N., et al. (2017). Towards a comprehensive climate impacts assessment of solar geoengineering. Earths Future 5, 93–106. doi: 10.1002/2016EF000389
Iturbide, M., Gutiérrez, J. M., Alves, L. M., Bedia, J., Cimadevilla, E., Cofiño, A. S., et al. (2020). An update of IPCC climate reference regions for subcontinental analysis of climate model data: definition and aggregated datasets. Earth Syst. Sci. Data 12, 2959–2970. doi: 10.5194/essd-12-2959-2020
Jafino, B. A., Walsh, B., Rozenberg, J., and Hallegatte, S. (2020). Revised estimates of the impact of climate change on extreme poverty by 2030. The World Bank. Available online at: https://documents1.worldbank.org/curated/en/706751601388457990/pdf/Revised-Estimates-of-the-Impact-of-Climate-Change-on-Extreme-Poverty-by-2030.pdf (Accessed February 12, 2025).
Jia, B., Liu, J., Xie, Z., and Shi, C. (2018). Interannual variations and trends in remotely sensed and modeled soil moisture in China. J. Hydrometeorol. 19, 831–847. doi: 10.1175/JHM-D-18-0003.1
Jiang, J., Xia, Y., Cao, L., Kravitz, B., MacMartin, D. G., Fu, J., et al. (2024). Different strategies of stratospheric aerosol injection would significantly affect climate extreme mitigation. Earths Future 12:364. doi: 10.1029/2023EF004364
Ji, D., Fang, S., Curry, C. L., Kashimura, H., Watanabe, S., Cole, J. N. S., et al. (2018). Extreme temperature and precipitation response to solar dimming and stratospheric aerosol geoengineering. Atmos. Chem. Phys. 18, 10133–10156. doi: 10.5194/acp-18-10133-2018
Kaushal, N., Bhandari, K., Siddique, K. H. M., Nayyar, H., and Tejada Moral, M. (2016). Food crops face rising temperatures: an overview of responses, adaptive mechanisms, and approaches to improve heat tolerance. Cogent Food Agric. 2:380. doi: 10.1080/23311932.2015.1134380
Khalid, I, and Maishman, E. Nigeria floods: Overwhelming' disaster leaves more than 600 people dead. (2022). Available online at: https://www.bbc.com/news/world-africa-63280518 (Accessed February 12, 2025).
Kim, Y.-H., Min, S.-K., Zhang, X., Zwiers, F., Alexander, L. V., Donat, M. G., et al. (2016). Attribution of extreme temperature changes during 1951–2010. Clim. Dyn. 46, 1769–1782. doi: 10.1007/s00382-015-2674-2
Kravitz, B., MacMartin, D. G., Mills, M. J., Richter, J. H., Tilmes, S., Lamarque, J. F., et al. (2017). First simulations of designing stratospheric sulfate aerosol geoengineering to meet multiple simultaneous climate objectives. J. Geophys. Res. Atmos. 122, 12–616. doi: 10.1002/2017JD026874
Kravitz, B., Robock, A., Boucher, O., Schmidt, H., Taylor, K. E., Stenchikov, G., et al. (2011). The geoengineering model intercomparison project (geo MIP). Atmos. Sci. Lett. 12, 162–167. doi: 10.1002/asl.316
Kravitz, B., Robock, A., Tilmes, S., Boucher, O., English, J. M., Irvine, P. J., et al. (2015). The geoengineering model Intercomparison project phase 6 (geo MIP6): simulation design and preliminary results. Geosci. Model Dev. 8, 3379–3392. doi: 10.5194/gmd-8-3379-2015
Krishnamohan, K. S., and Bala, G. (2022). Sensitivity of tropical monsoon precipitation to the latitude of stratospheric aerosol injections. Clim. Dyn. 59, 151–168. doi: 10.1007/s00382-021-06121-z
Lakhani, N. (2021). ‘We can’t live like this’: Climate shocks rain down on Honduras’s poorest. Available online at: https://www.theguardian.com/environment/2021/oct/28/honduras-climate-crisis-floods-hurricanes-poor-community (Accessed February 12, 2025).
Lawrence, D. M., Fisher, R. A., Koven, C. D., Oleson, K. W., Swenson, S. C., Bonan, G., et al. (2019). The community land model version 5: description of new features, benchmarking, and impact of forcing uncertainty. J. Adv. Model. Earth Syst. 11, 4245–4287. doi: 10.1029/2018MS001583
Lee, W. R., MacMartin, D. G., Visioni, D., and Kravitz, B. (2021). High-latitude stratospheric aerosol geoengineering can be more effective if injection is limited to Spring. Geophys. Res. Lett. 48:696. doi: 10.1029/2021GL092696
Lee, W. R., MacMartin, D. G., Visioni, D., Kravitz, B., Chen, Y., Moore, J. C., et al. (2023). High-latitude stratospheric aerosol injection to preserve the Arctic. Earth’s. Future 11:52. doi: 10.1029/2022EF003052
Leff, B., Ramankutty, N., and Foley, J. A. (2004). Geographic distribution of major crops across the world. Glob. Biogeochem. Cycles 18:108. doi: 10.1029/2003GB002108
Lesk, C., Anderson, W., Rigden, A., Coast, O., Jägermeyr, J., McDermid, S., et al. (2022). Compound heat and moisture extreme impacts on global crop yields under climate change. Nat. Rev. Earth Environ. 3, 872–889. doi: 10.1038/s43017-022-00368-8
Liang, X., Wang, D., Ye, Q., Zhang, J., Liu, M., Liu, H., et al. (2023). Stomatal responses of terrestrial plants to global change. Nat. Commun. 14:2188. doi: 10.1038/s41467-023-37934-7
Li, C., Zwiers, F., Zhang, X., Li, G., Sun, Y., and Wehner, M. (2021). Changes in annual extremes of daily temperature and precipitation in CMIP6 models. J. Clim. 34, 3441–3460. doi: 10.1175/jcli-d-19-1013.1
Liebmann, B., Bladé, I., Kiladis, G. N., Carvalho, L. M., Senay, G. B., Allured, D., et al. (2012). Seasonality of African precipitation from 1996 to 2009. J. Clim. 25, 4304–4322. doi: 10.1175/jcli-d-11-00157.1
Liu, Z., Lang, X., and Jiang, D. (2024). Stratospheric aerosol injection geoengineering would mitigate greenhouse gas-induced drying and affect global drought patterns. J. Geophys. Res. Atmos. 129. doi: 10.1029/2023JD039988
Lombardozzi, D. L., Bonan, G. B., Levis, S., and Lawrence, D. M. (2018). Changes in wood biomass and crop yields in response to projected CO2, O3, nitrogen deposition, and climate. J. Geophys. Res. Biogeo. 123, 3262–3282. doi: 10.1029/2018JG004680
Lombardozzi, D. L., Lu, Y., Lawrence, P. J., Lawrence, D. M., Swenson, S., Oleson, K. W., et al. (2020). Simulating agriculture in the community land model version 5. Journal of geophysical research. Biogeosciences 125:e2019JG005529. doi: 10.1029/2019JG005529
Lu, J., Carbone, G. J., and Grego, J. M. (2019). Uncertainty and hotspots in 21st century projections of agricultural drought from CMIP5 models. Sci. Rep. 9:4922. doi: 10.1038/s41598-019-41196-z
Luo, Q. (2011). Temperature thresholds and crop production: a review. Clim. Chang. 109, 583–598. doi: 10.1007/s10584-011-0028-6
MacMartin, D. G., Visioni, D., Kravitz, B., Richter, J. H., Felgenhauer, T., Lee, W. R., et al. (2022). Scenarios for modeling solar radiation modification. Proc. Natl. Acad. Sci. 119:e2202230119. doi: 10.1073/pnas.2202230119
Mamalakis, A., Barnes, E. A., and Hurrell, J. W. (2023). Using explainable artificial intelligence to quantify “climate distinguishability” after stratospheric aerosol injection. Geophys. Res. Lett. 50:e2023GL106137. doi: 10.1029/2023GL106137
Mazdiyasni, O., AghaKouchak, A., Davis, S. J., Madadgar, S., Mehran, A., Ragno, E., et al. (2017). Increasing probability of mortality during Indian heat waves. Sci. Adv. 3:e1700066. doi: 10.1126/sciadv.1700066
McCarthy, S., Magramo, K., and Wang, B. (2023). More than a million displaced and dozens dead after record rain drenches northeastern China. Available online at: https://www.cnn.com/2023/08/04/china/china-northeast-hebei-beijing-flooding-recovery-intl-hnk/index.html (Accessed February 12, 2025).
NASEM. (2021). Reflecting Sunlight: Recommendations for Solar Geoengineering Research and Research Governance. Available at: https://nap.nationalacademies.org/catalog/25762/reflecting-sunlight-recommendations-for-solargeoengineering-research-and-research-governance (Accessed May 19, 2025).
Nath, S., Hauser, M., Schumacher, D. L., Lejeune, Q., Gudmundsson, L., Quilcaille, Y., et al. (2024). Representing natural climate variability in an event attribution context: indo-Pakistani heatwave of 2022. Weather Climate Extremes 44:100671. doi: 10.1016/j.wace.2024.100671
NRC (2015). Climate intervention: Reflecting sunlight to cool earth. Washington, DC: National Academies Press. Available at: https://nap.nationalacademies.org/catalog/18988/climate-intervention-reflecting-sunlight-to-cool-earth.
O’Neill, B. C., Kriegler, E., Ebi, K. L., Kemp-Benedict, E., Riahi, K., Rothman, D. S., et al. (2017). The roads ahead: narratives for shared socioeconomic pathways describing world futures in the 21st century. Glob. Environ. Chang. 42, 169–180. doi: 10.1016/j.gloenvcha.2015.01.004
Otto, F. E., Zachariah, M., Saeed, F., Siddiqi, A., Kamil, S., Mushtaq, H., et al. (2023). Climate change increased extreme monsoon rainfall, flooding highly vulnerable communities in Pakistan. Environ. Res. Climate 2:025001. doi: 10.1088/2752-5295/acbfd5
Padrón, R. S., Gudmundsson, L., Decharme, B., Ducharne, A., Lawrence, D. M., Jiafu, M., et al. (2020). Observed changes in dry-season water availability attributed to human-induced climate change. Nat. Geosci. 13, 477–481. doi: 10.1038/s41561-020-0594-1
Parker, A., and Irvine, P. J. (2018). The risk of termination shock from solar geoengineering. Earths Future 6, 456–467. doi: 10.1002/2017EF000735
Pongratz, J., Lobell, D. B., Cao, L., and Caldeira, K. (2012). Crop yields in a geoengineered climate. Nat. Clim. Chang. 2, 101–105. doi: 10.1038/nclimate1373
Proctor, J., Hsiang, S., Burney, J., Burke, M., and Schlenker, W. (2018). Estimating global agricultural effects of geoengineering using volcanic eruptions. Nature 560, 480–483. doi: 10.1038/s41586-018-0417-3
Qiao, L., Zuo, Z., and Xiao, D. (2022). Evaluation of soil moisture in CMIP6 simulations. J. Clim. 35, 779–800. doi: 10.1175/JCLI-D-20-0827.1
Quintana-Seguí, P., Barella-Ortiz, A., Regueiro-Sanfiz, S., and Miguez-Macho, G. (2020). The utility of land-surface model simulations to provide drought information in a water management context using global and local forcing datasets. Water Resour. Manag. 34, 2135–2156. doi: 10.1007/s11269-018-2160-9
Rezaei, E. E., Webber, H., Asseng, S., Boote, K., Durand, J. L., Ewert, F., et al. (2023). Climate change impacts on crop yields. Nat. Rev. Earth Environ. 4, 831–846. doi: 10.1038/s43017-023-00491-0
Riahi, K., Rao, S., Krey, V., Cho, C., Chirkov, V., Fischer, G., et al. (2011). RCP 8.5—a scenario of comparatively high greenhouse gas emissions. Clim. Chang. 109, 33–57. doi: 10.1007/s10584-011-0149-y
Richter, J. H., Visioni, D., MacMartin, D. G., Bailey, D. A., Rosenbloom, N., Dobbins, B., et al. (2022). Assessing responses and impacts of solar climate intervention on the earth system with stratospheric aerosol injection (ARISE-SAI): protocol and initial results from the first simulations. Geosci. Model Dev. 15, 8221–8243. doi: 10.5194/gmd-15-8221-2022
Robock, A., Oman, L., and Stenchikov, G. L. (2008). Regional climate responses to geoengineering with tropical and Arctic SO2 injections. J. Geophys. Res. Atmos. 113. doi: 10.1029/2008JD010050
Rohini, P., Rajeevan, M., and Srivastava, A. K. (2016). On the variability and increasing trends of heat waves over India. Sci. Rep. 6:26153. doi: 10.1038/srep26153
Scheelbeek, P. F. D., Bird, F. A., Tuomisto, H. L., Green, R., Harris, F. B., Joy, E. J. M., et al. (2018). Effect of environmental changes on vegetable and legume yields and nutritional quality. Proc. Natl. Acad. Sci. 115, 6804–6809. doi: 10.1073/pnas.1800442115
SEDAC (n.d.). Global One-Eighth Degree Population Base Year and Projection Grids Based on the SSPs, v1.01 (2000–2100). Available online at: https://sedac.ciesin.columbia.edu/data/set/popdynamics-1-8th-pop-base-year-projection-ssp-2000-2100-rev01 (Accessed February 12, 2025).
Simpson, I. R., Tilmes, S., Richter, J. H., Kravitz, B., MacMartin, D. G., Mills, M. J., et al. (2019). The regional hydroclimate response to stratospheric sulfate geoengineering and the role of stratospheric heating. J. Geophys. Res. Atmos. 124, 12587–12616. doi: 10.1029/2019JD031093
Singh, B. K., Delgado-Baquerizo, M., Egidi, E., Guirado, E., Leach, J. E., Liu, H., et al. (2023). Climate change impacts on plant pathogens, food security and paths forward. Nat. Rev. Microbiol. 21, 640–656. doi: 10.1038/s41579-023-00900-7
Singh, G. (2016). Climate change and food security in India: challenges and opportunities. Irrig. Drain. 65, 5–10. doi: 10.1002/ird.2038
Singh, S., Mall, R. K., and Singh, N. (2021). Changing spatio-temporal trends of heat wave and severe heat wave events over India: an emerging health hazard. Int. J. Climatol. 41, E1831–E1845. doi: 10.1002/joc.6814
Smith, W., and Henly, C. (2021). Updated and outdated reservations about research into stratospheric aerosol injection. Clim. Chang. 164:39. doi: 10.1007/s10584-021-03017-z
Soares, J. C., Santos, C. S., Carvalho, S. M. P., Pintado, M. M., and Vasconcelos, M. W. (2019). Preserving the nutritional quality of crop plants under a changing climate: importance and strategies. Plant Soil 443, 1–26. doi: 10.1007/s11104-019-04229-0
Södergren, A. H., and McDonald, A. J. (2022). Quantifying the role of atmospheric and surface albedo on polar amplification using satellite observations and CMIP6 model output. J. Geophys. Res. Atmos. 127:e2021JD035058. doi: 10.1029/2021JD035058
Spinoni, J., Barbosa, P., De Jager, A., McCormick, N., Naumann, G., Vogt, J. V., et al. (2019). A new global database of meteorological drought events from 1951 to 2016. J. Hydrol. Reg. Stud. 22:100593. doi: 10.1016/j.ejrh.2019.100593
Stewart, I. T., Maurer, E. P., Stahl, K., and Joseph, K. (2022). Recent evidence for warmer and drier growing seasons in climate sensitive regions of Central America from multiple global datasets. Int. J. Climatol. 42, 1399–1417. doi: 10.1002/joc.7310
Tilmes, S., Richter, J. H., Kravitz, B., MacMartin, D. G., Mills, M. J., Simpson, I. R., et al. (2018). CESM1(WACCM) stratospheric aerosol geoengineering large ensemble project. Bull. Am. Meteorol. Soc. 99, 2361–2371. doi: 10.1175/BAMS-D-17-0267.1
Tilmes, S., Richter, J. H., Mills, M. J., Kravitz, B., MacMartin, D. G., Vitt, F., et al. (2017). Sensitivity of aerosol distribution and climate response to stratospheric SO2 injection locations. J. Geophys. Res. Atmos. 122:615. doi: 10.1002/2017JD026888
Tripathy, K. P., Mukherjee, S., Mishra, A. K., Mann, M. E., and Williams, A. P. (2023). Climate change will accelerate the high-end risk of compound drought and heatwave events. Proc. Natl. Acad. Sci. 120:e2219825120. doi: 10.1073/pnas.2219825120
UNEP. (2023). Emissions Gap Report 2023: Broken Record: Temperatures hit new highs, yet world fails to cut emissions (again). Available online at: https://www.unep.org/resources/emissions-gap-report-2023 (Accessed February 12, 2025).
Vattioni, S., Luo, B., Feinberg, A., Stenke, A., Vockenhuber, C., Weber, R., et al. (2023). Chemical impact of stratospheric alumina particle injection for solar radiation modification and related uncertainties. Geophys. Res. Lett. 50:e2023GL105889. doi: 10.1029/2023GL105889
Vicedo-Cabrera, A. M., Scovronick, N., Sera, F., Royé, D., Schneider, R., Tobias, A., et al. (2021). The burden of heat-related mortality attributable to recent human-induced climate change. Nat. Clim. Chang. 11, 492–500. doi: 10.1038/s41558-021-01058-x
Visioni, D., Bednarz, E. M., MacMartin, D. G., Kravitz, B., and Goddard, P. B. (2023). The choice of baseline period influences the assessments of the outcomes of stratospheric aerosol injection. Earths Future 11:e2023EF003851. doi: 10.1029/2023EF003851
Wang, B., and Ho, L. (2002). Rainy season of the Asian–Pacific summer monsoon. J. Clim. 15, 386–398. doi: 10.1175/1520-0442(2002)015<0386:rsotap>2.0.co;2
Wang, D., Heckathorn, S. A., Barua, D., Joshi, P., Hamilton, E. W., and LaCroix, J. J. (2008). Effects of elevated CO2 on the tolerance of photosynthesis to acute heat stress in C3, C4, and CAM species. Am. J. Bot. 95, 165–176. doi: 10.3732/ajb.95.2.165
West, R. M. (2021). Best practice in statistics: use the Welch t-test when testing the difference between two groups. Ann. Clin. Biochem. 58, 267–269. doi: 10.1177/0004563221992088
World Bank (2013). Turn up the heat. Climate extremes, regional impacts, and the case for resilience. Washington, DC: World Bank. Available at: https://documents1.worldbank.org/curated/en/975911468163736818/pdf/784240WP0Full00D0CONF0to0June19090L.pdf.
World Bank. (2022). Pakistan: Flood damages and economic losses over USD 30 billion and reconstruction needs over USD 16 billion - New Assessment. Available online at: https://www.worldbank.org/en/news/press-release/2022/10/28/pakistan-flood-damages-and-economic-losses-over-usd-30-billion-and-reconstruction-needs-over-usd-16-billion-new-assessme (Accessed February 12, 2025).
Xia, L., Robock, A., Tilmes, S., and Neely, R. R. (2016). Stratospheric sulfate geoengineering could enhance the terrestrial photosynthesis rate. Atmos. Chem. Phys. 16, 1479–1489. doi: 10.5194/acp-16-1479-2016
Xu, F., Qu, Y., Bento, V. A., Song, H., Qiu, J., Qi, J., et al. (2024). Understanding climate change impacts on drought in China over the 21st century: a multi-model assessment from CMIP6. NPJ Climate Atmosph. Sci. 7, 32–12. doi: 10.1038/s41612-024-00578-5
You, Y., Ting, M., and Biasutti, M. (2024). Climate warming contributes to the record-shattering 2022 Pakistan rainfall. Npj climate and atmospheric. Science 7:89. doi: 10.1038/s41612-024-00630-4
Zachariah, M., Arulalan, T., Achuta Rao, K., Saeed, F., Jha, R., Dhasmana, M. K., et al. (2023). Attribution of 2022 early-spring heatwave in India and Pakistan to climate change: lessons in assessing vulnerability and preparedness in reducing impacts. Environ. Res. 2:045005. doi: 10.1088/2752-5295/acf4b6
Zachariah, M., Barnes, C., Wainwright, C., Balogun, R. A., Vondou, D. A., Adefisan, E. A., et al. (2022). Climate change exacerbated heavy rainfall leading to large scale flooding in highly vulnerable communities in West Africa. Available online at: https://www.worldweatherattribution.org/climate-change-exacerbated-heavy-rainfall-leading-to-large-scale-flooding-in-highly-vulnerable-communities-in-west-africa/ (Accessed February 12, 2025).
Zaitchik, B. F., Rodell, M., Biasutti, M., and Seneviratne, S. I. (2023). Wetting and drying trends under climate change. Nat. Water 1, 502–513. doi: 10.1038/s44221-023-00073-w
Zakari, S., Ying, L., and Song, B. (2014). Factors influencing household food security in West Africa: the case of southern Niger. Sustain. For. 6, 1191–1202. doi: 10.3390/su6031191
Zargar, A.R. (2022). Severe heat wave kills dozens in India and Pakistan in a "snapshot" of what's to come from climate change, expert says. Available online at: https://www.cbsnews.com/news/india-heat-wave-pakistan-climate-change-snapshot/ (Accessed February 12, 2025).
Zhang, S., and Wang, B. (2008). Global summer monsoon rainy seasons. Int. J. Climatol. 28, 1563–1578. doi: 10.1002/joc.1659
Zhang, Y., MacMartin, D. G., Visioni, D., Bednarz, E. M., and Kravitz, B. (2024). Hemispherically symmetric strategies for stratospheric aerosol injection. Earth Syst. Dynam. 15, 191–213. doi: 10.5194/esd-15-191-2024
Zhan, P., Zhu, W., Zhang, T., Cui, X., and Li, N. (2019). Impacts of sulfate geoengineering on rice yield in China: results from a multimodel ensemble. Earths Future 7, 395–410. doi: 10.1029/2018EF001094
Keywords: climate change, climate intervention, stratospheric aerosol injection, human wellbeing, wet season precipitation, crop productivity
Citation: Cohen SL, Hurrell JW and Lombardozzi DL (2025) The impact of stratospheric aerosol injection: a regional case study. Front. Clim. 7:1582747. doi: 10.3389/fclim.2025.1582747
Edited by:
Ángel G. Muñoz, Barcelona Supercomputing Center, SpainReviewed by:
Eduardo Landulfo, Instituto de Pesquisas Energéticas e Nucleares (IPEN), BrazilHan Huynh, University of Colorado Boulder, United States
Copyright © 2025 Cohen, Hurrell and Lombardozzi. This is an open-access article distributed under the terms of the Creative Commons Attribution License (CC BY). The use, distribution or reproduction in other forums is permitted, provided the original author(s) and the copyright owner(s) are credited and that the original publication in this journal is cited, in accordance with accepted academic practice. No use, distribution or reproduction is permitted which does not comply with these terms.
*Correspondence: Sabrina L. Cohen, c2FicmluYS5jb2hlbkBjb2xvc3RhdGUuZWR1