 Chelsea Sauvé
 Hambaliou Baldé1
 Andrew VanderZaag
- 1Agriculture and Agri-Food Canada, ACGEO/AER/Ottawa Research and Development Centre, Ottawa, ON, Canada
- 2School of Environmental Sciences, University of Guelph, Guelph, ON, Canada
- 3Agriculture and Agri-Food Canada, Sherbrooke Research and Development Centre, Sherbrooke, QC, Canada
The agriculture industry is an important source of greenhouse gas emissions globally with livestock production being a main contributor. Therefore, there is a need to reduce methane (CH4) emissions from livestock production, including liquid manure storages. Using an additive that decreases methanogenesis is one approach currently being considered. This study tests two additives: SOP® Lagoon (a commercial additive) and a commonly used, local fertilizer, gypsum. The objective was to determine the capability of the two products to reduce CH4 emissions. Tests were done at 24°C in the laboratory with multiple rates of the additives (100, 1,000, 5,000 and 10,000 g/m3). Methane produced by untreated dairy manure (control) was compared to manure with addition of gypsum or SOP® Lagoon over 162 days. Results showed that peak CH4 reduction occurred between 20 and 30 days, then declined. The lowest dose of both additives (100 g/m3) did not significantly reduce CH4 over the duration of the study. Efficacy increased non-linearly with an increasing dose up to 5,000 g/m3. After 30 days, CH4 reduction decreased by 32, 73, 74% for SOP® Lagoon rates 1,000, 5,000, 10,000 g/m3, and 20, 60, and 63% for gypsum. Both SOP® Lagoon and local gypsum showed similar reduction in methane emissions at similar application rates. This is an indication that farmers can confidently use locally sourced gypsum, a low-cost alternative to the commercial additive, without affecting the overall mitigation potential.
1 Introduction
Manure management contributes 14% of total methane (CH4) emissions from Canadian agriculture (total: 31 Mt. CO2-equivalent, Environment and Climate Change Canada, 2025; Eriksen et al., 2012). Livestock farmers store manure because it is nutrient-rich and needs to be prudently applied to cropland when the fields are trafficable. However, these liquid manure storages create anaerobic conditions that enable methane production. There is interest in strategies that will reduce methane production, and thus limit the amount of greenhouse gasses produced in these systems (Dobson et al., 2023).
Many farmers have adopted the use of additives in their manure management practices to reduce odor and maintain homogenization without the need to agitate manure storages. However, it is not known if those additives reduce CH4 emissions (Cluett et al., 2020). One such additive is the commercially available additive called SOP® Lagoon (SOP), an Italian product primarily comprised of calcium sulfate dihydrate (CaSO4, commonly known as gypsum), prepared with proprietary technology (Chiodini et al., 2023). According to the manufacturer, SOP reduces crusting and the need for agitation, as well as reducing odor, methane, carbon dioxide, ammonia, and nitrous oxide. Since SOP is made of gypsum, it is hypothesized that locally available gypsum fertilizer- composed of the same primary constituents withoutproprietary preparation- will have similar mitigation potential. A few studies have been conducted using the SOP additive (Chiodini et al., 2023; Borgonovo et al., 2019; Peterson et al., 2020); however none have compared the CH4 mitigation efficacy of this additive to local gypsum fertilizer.
Gypsum is a natural resource that is widely available in Canada. Gypsum has been studied for its effect on CH4 emissions from liquid swine manure, reaching the conclusion that higher rates of gypsum were more effective at reducing CH4, and achieving a maximum reduction of 51% (Berg and Model, 2008). However, that study using pig slurry may not be dirrectly applicable to dairy slurry because they havediffering compositions and characteristics.
Overall, previous studies show promising results for both SOP and gypsum’s ability to reduce CH4 emissions, but there are still gaps in the research that need to be addressed, such as low measurement frequency, short study duration and differing climate. In Canada, farmers store manure for months; therefore a longer study period, about 5 months, will be needed to characterize the long-term effects of the additives. Two of the three studies on SOP were only conducted over 26 days and another over 2 weeks (Borgonovo et al., 2019; Peterson et al., 2020). Additionally, all three studies were conducted in a warm climate, vastly different from the cool temperate climate of Canada (Chiodini et al., 2023; Borgonovo et al., 2019; Peterson et al., 2020). Higher rates of SOP were shown to be more effective in one study (Peterson et al., 2020), but a dose–response relationship has not been thoroughly examined. Moreover, there has yet to be a study comparing locally sourced gypsum and SOP in reducing CH4 production. Therefore, the objective of this study was to determine the dose–response of gypsum and SOP on CH4 emissions of liquid dairy manure over a duration relevant to the storage period in cool temperate climates. The hypotheses were that both additives would reduce CH4 emissions by a similar amount, and increasing efficacy with higher doses.
2 Materials and methods
2.1 Farm description
Manure was sourced in June 2023 from a dairy barn near Ottawa, Ontario (45°24′29” N, 75°41′42” W) and refrigerated at 4°C for 4 days before the study began. The manure was a composite sample from the pit located in the barn where manure was constantly supplied by automatic alley scrapers running every 15 min. This facility was a free-stall operation bedded with wood shavings. The farm had approximately 160 lactating Holsteins fed with a partial mixed ration of corn silage, alfalfa/grass hay, and high moisture corn, supplemented with concentrate pellets.
2.2 Manure additives
A 2 kg box of SOP® Lagoon was purchased from a dairy supply company in Kemptville, Ontario, Canada. According to the product label, the powdered mixture contains calcium sulfate, sulfur trioxide, and calcium oxide. The manufacturer recommended dosage for SOP is to add a weekly dose of 4 g/m3 of manure already stored for the first 4 weeks, i.e., 16 g/m3 of stored manure. Thereafter, an additional 2 g/animal/week should be added for every animal supplying manure to the pit. Since previous studies showed higher dosages to be most effective, rates were chosen to determine a dose–response (Table 1). A 22.68 kg box of gypsum was obtained from a local fertilizer retailer in Ottawa, Ontario, Canada. Gypsum was added to manure mixtures at the same rates as the SOP to ensure the same conditions were applied to the manure by both products to test their equivalence. Additives were only added once at the start of the trial, no additional manure or additive was added during the trial.
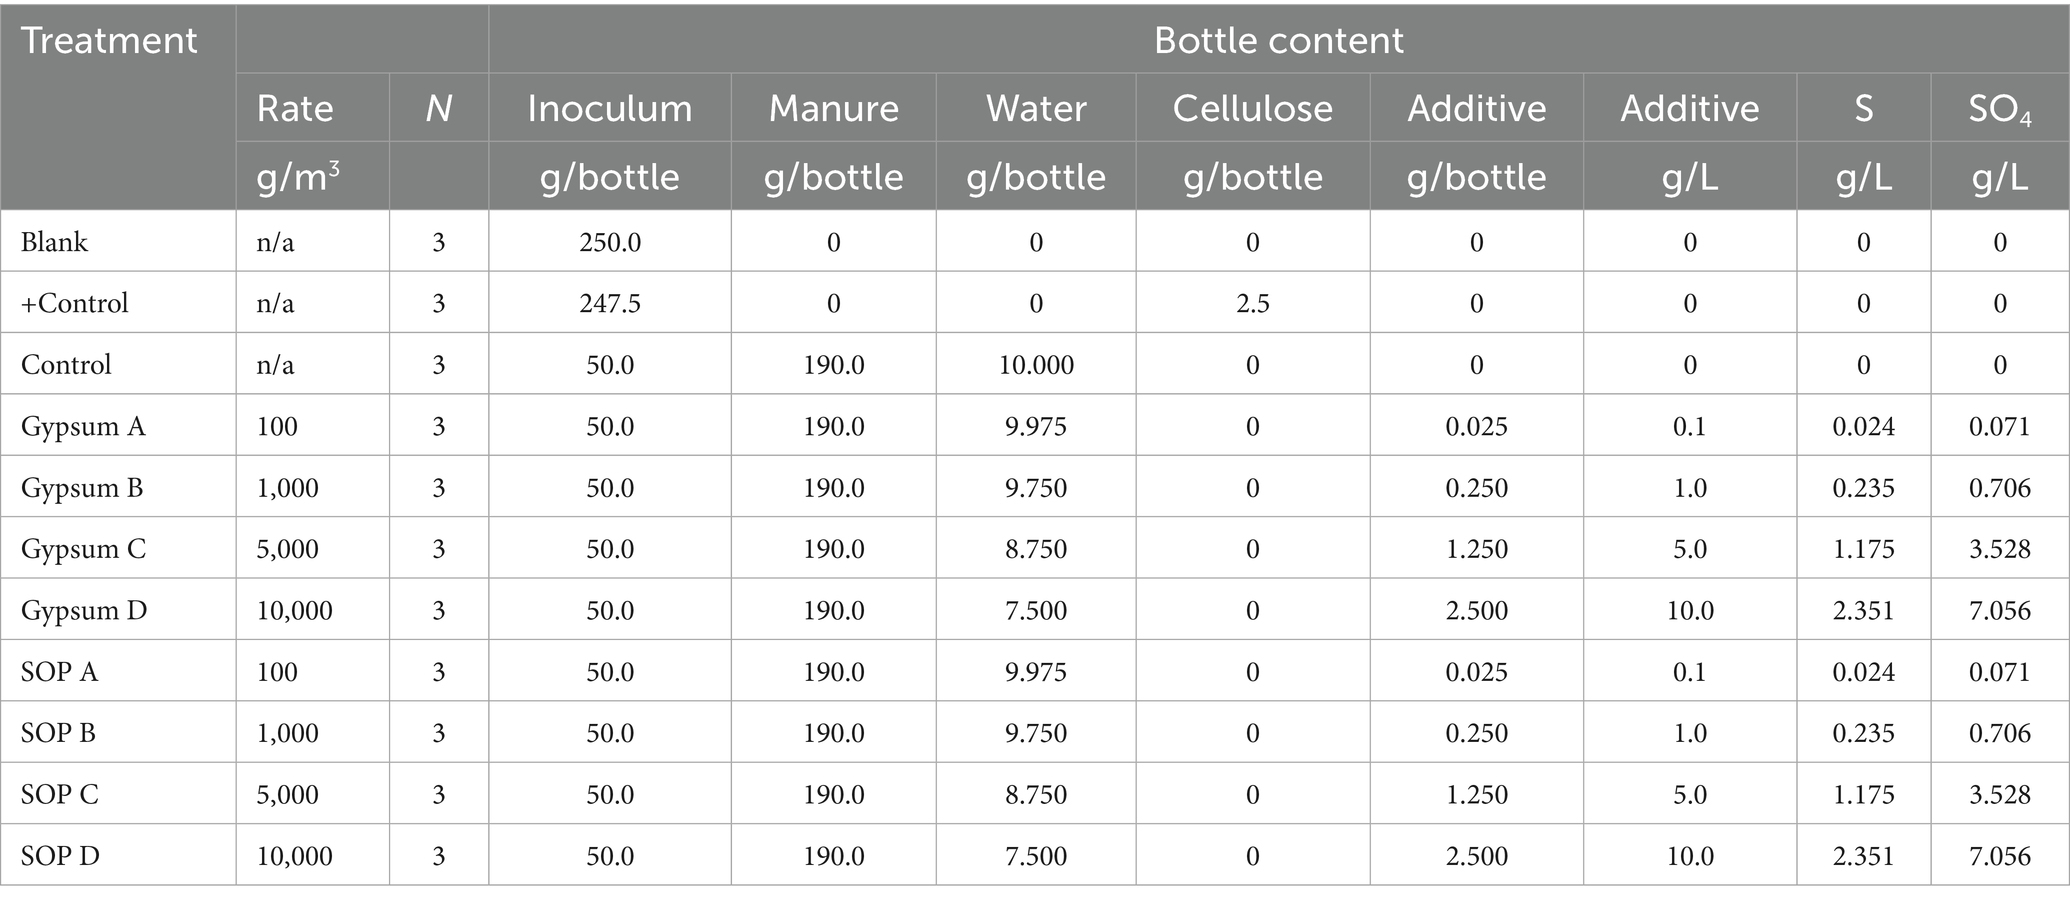
Table 1. Setup of the 33 bottles for incubation at 24°C.
2.3 Methane emissions laboratory setup
A total of 33 bottles were used in this study, including 3 blanks containing only inoculum, 3 positive controls containing cellulose, and 27 bottles containing mixtures of the manure and additives used for the experiment (Table 1). The total volume of the bottles was 600 mL permitting 250 g of substrate. All 27 experimental bottles contained the same amount of raw manure and inoculum. Three bottles were the control, SOP was added at four rates to 12 bottles and gypsum was added at the same four rates to the remaining 12 bottles.
The pH, total solids, and volatile solids of each prepared sample was measured. The final weight of each bottle was recorded. The incubation bottles were sealed with high pressure rubber stoppers allowing gasses produced from the samples to remain in the bottle headspace for analysis (Bellco Glass Inc., Vineland, NJ, United States). Headspace was flushed with N2 to ensure anerobic conditions. Bottles were then incubated at 24°C in an Isotemp Incubator (Fisher Scientific, Toronto, ON, Canada). The temperature of 24°C was selected to represent the manure storage temperature during the late Summer and early Autumn in Canada.
Inoculum was a digestate from a dairy-farm biodigester near Ottawa, Ontario that was stored at 24°C in order to acclimate and degrease the inoculum before the start of the trial. A cellulose (CAS RN: 9004-34-6, Fisher Scientific, Ottawa, ON, Canada) and inoculum mixture was used to verify the method of the study. The purpose of the inoculum was to activate CH4 production by adding methanogens to the raw manure. The yield of CH4 produced by the bottles was determined by subtracting the cumulative CH4 produced by the inoculum from the substrates containing dairy manure and inoculum. The trial was stopped when the daily gas production was less than 1% of the total gas produced.
2.3.1 Chemical and physical characterization
Each sample in the trial was prepared with 1,400 g of substrate before adding 250 g of substrate mixture to each bottle. The samples with a very small amount of additive were prepared with 10,000 g of substrate in order to accurately measure the dose of additive. Before adding 250 g of the mixture to the 3 designated bottles, the pH was taken of each sample in triplicate using an ion selective electrode (Fisher Scientific, Toronto, ON, Canada) with mixing in between each measurement. After the pH was measured, as samples were poured into their bottle, a 20–30 g subsample was taken for the TS (total solids) and VS (volatile solids) measurement according to recommended methods (Peters et al., 2003). This procedure was repeated for all 11 mixtures with 3 replicates each, totaling 33 bottles. The TS/VS of raw manure only was also calculated. The total solids were determined by drying the samples in a 105°C oven for 24 h and logging their weight. The samples were further ignited at 550°C for 2 h and the weight was recorded. The results of the TS, VS, and pH of each bottle is in Table 2.
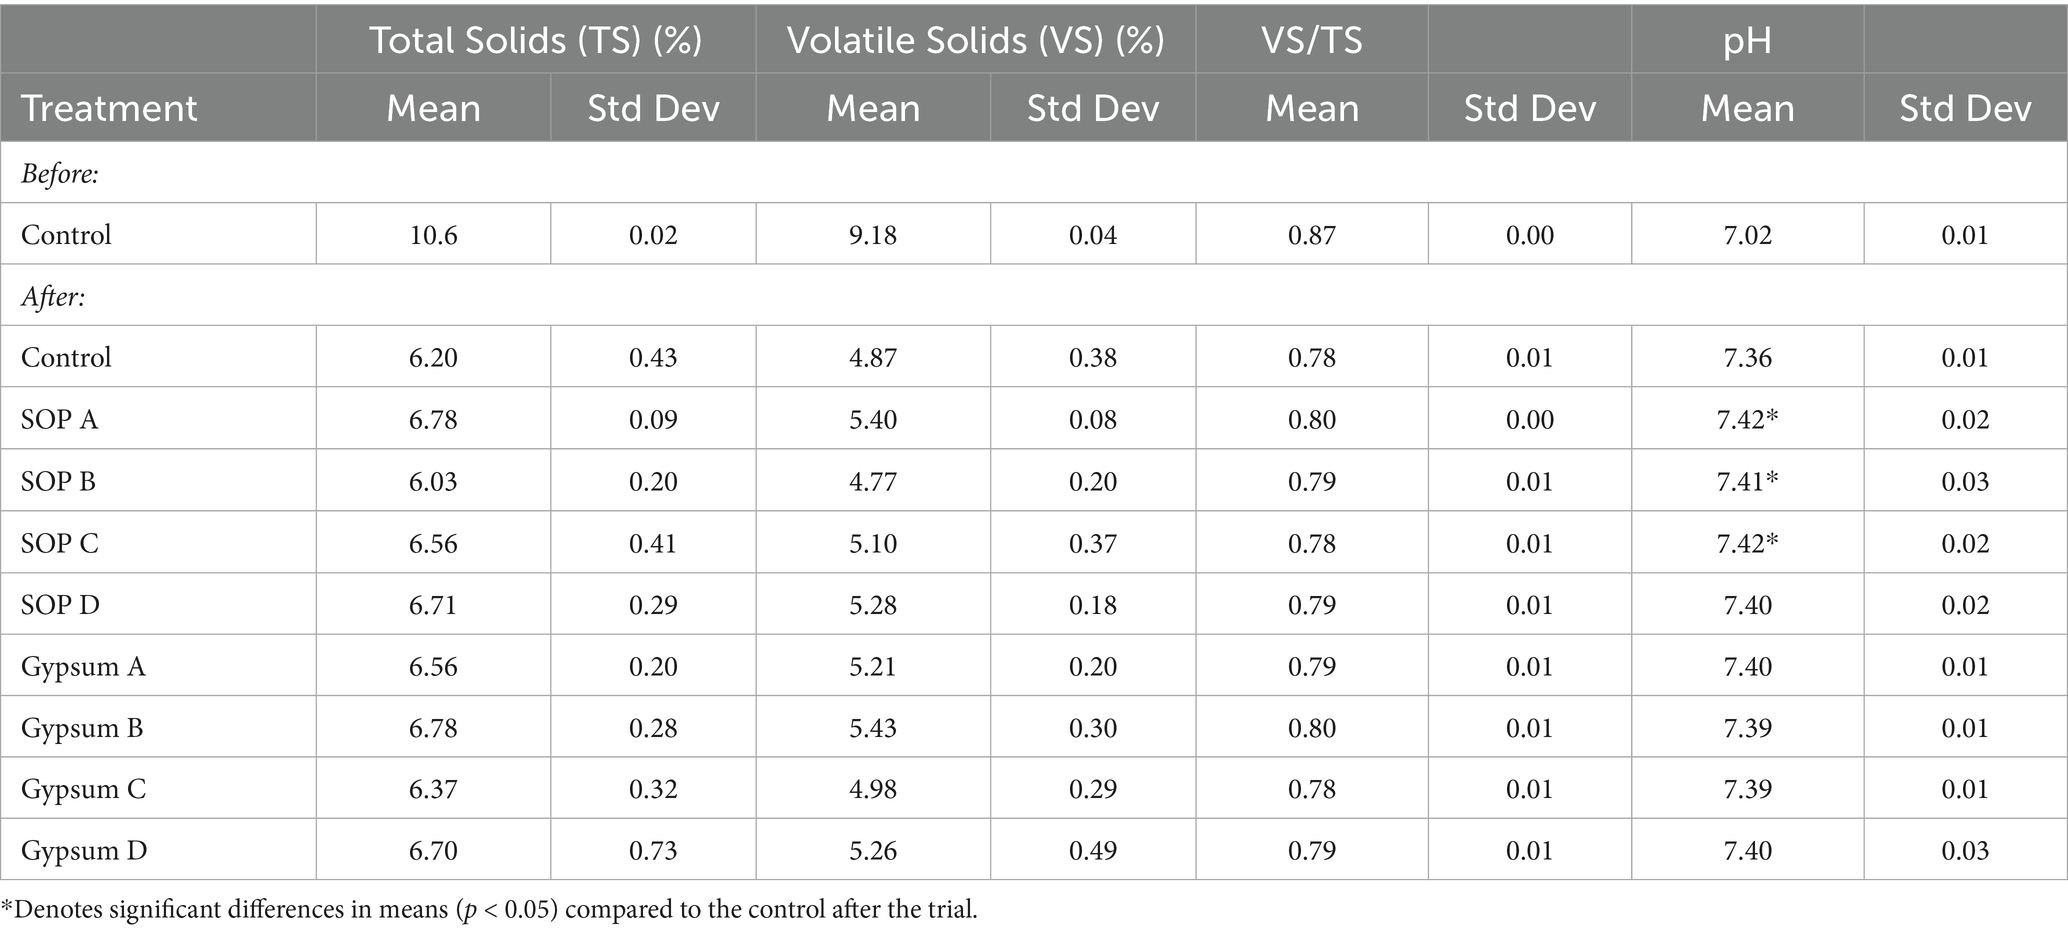
Table 2. Characteristics of before and after the trial.
2.3.2 Gas measurements
Gas sampling was done manually. For the first 2 weeks sampling was done every day due to the high rate of pressure increase. Once the pressure began to decrease, sampling was reduced to every 2 days until it was only required once a week. The pressure of each bottle was measured prior to sampling using a pressure gage (VWR® Traceable®, Radnor, PA, United States) with a 21-gage needle to puncture the rubber stopper. Sampling of the biogas was done by extracting 20 mL of headspace volume from the bottle using a syringe and a 21-gage needle (Becton, Dickinson and Company, Franklin Lakes, NJ, United States). The 20 mL of headspace gasses were injected into a gas chromatograph (490 Micro GC, Agilent, Santa Clara, CA, United States) where the CH4, CO2, O2, and N2 gas concentrations were measured and recorded. Certified standard gasses were used prior to sampling to verify accuracy of the gas chromatograph. In order to release the remaining pressure within the headspace, each bottle was vented using an open syringe after every sampling event. The bottles were then swirled and returned to the 24°C incubator (Fisher Scientific, Toronto, ON, Canada).
2.3.3 Data analysis
The volume of biogas produced by each bottle throughout the sampling period was calculated using the rearranged ideal gas law equation. The volume of CH4 produced by each bottle throughout the sampling period was calculated by multiplying the volume of biogas produced by the measured concentration of CH4 in the sample, on each sampling date.
To determine the yield of CH4, i.e., mL CH4 / g VS, first the net amount of CH4 produced from the cellulose or manure substrate within each bottle was calculated by subtracting the contribution CH4 produced by inoculum. Then, the yield was calculated by dividing the CH4 from the substrate by the initial volatile solids contained in the substrate at the beginning of the study. See Cluett et al. (2020), for the exact equations used.
The trials in this study were dedicated to compare the effectiveness of both SOP and gypsum at reducing methane emissions from liquid dairy manure. The trial was stopped when the control and both additives produced less than 1% of the cumulative CH4 per day. Significant differences between SOP and gypsum were tested using a one-way ANOVA to compare the cumulative CH4 yields of both additives and the control. Comparisons of treatment means to the control were made with the Dunnet’s method with a significance level of p < 0.05.
3 Results
3.1 Substrate characterization
Prior to the study, the manure pH was 6.9 with TS 11.6% and VS 10.2%. The control mixture of manure and inoculum had a pH of 7.0 with a TS of 10.6% and VS of 9.2%. Right after adding gypsum or SOP there was no significant change in pH, TS, or VS.
At the end of the trial, after incubation, the pH in all treatments were significantly higher than at the beginning while the TS, VS, and VS/TS were all significantly lower than before (Table 2). The solids content in the control had declined to a TS of 6.2% and VS of 4.9% while pH increased 0.34 units to 7.36. After incubation, three treatments had pH significantly higher than the control (SOP A, B, C; p < 0.05) but the difference was less than 0.1 pH unit.
3.2 Methane emissions
After 162 days of incubation at 24°C, cumulative CH4 production from the cellulose and inoculum positive-control was 3528 (103) mL CH4 per bottle, on average (mean (standard deviation)). Inoculum bottles produced 2595 (38) mL CH4. The net CH4 yield from the cellulose substrate after subtracting the contribution from inoculum was 376.5 mL CH4/g VS, which is in the expected range (Holliger et al., 2016).
Methane production from the manure and inoculum control increased gradually over the first 15 days, then rapidly increased for the next 40 days, followed by slowing production until the end of the trial (Figure 1). By the end of the trial, the manure control had a CH4 production of 4,495 mL per bottle and the average net CH4 yield was 192 mL/g VS (Table 3). Additionally, the cumulative CH4 production and CH4 yield were significantly lower than the control for the two highest rates of both additives where the average % reduction for rates C and D was 21% for SOP and 23% for gypsum (Figure 2).
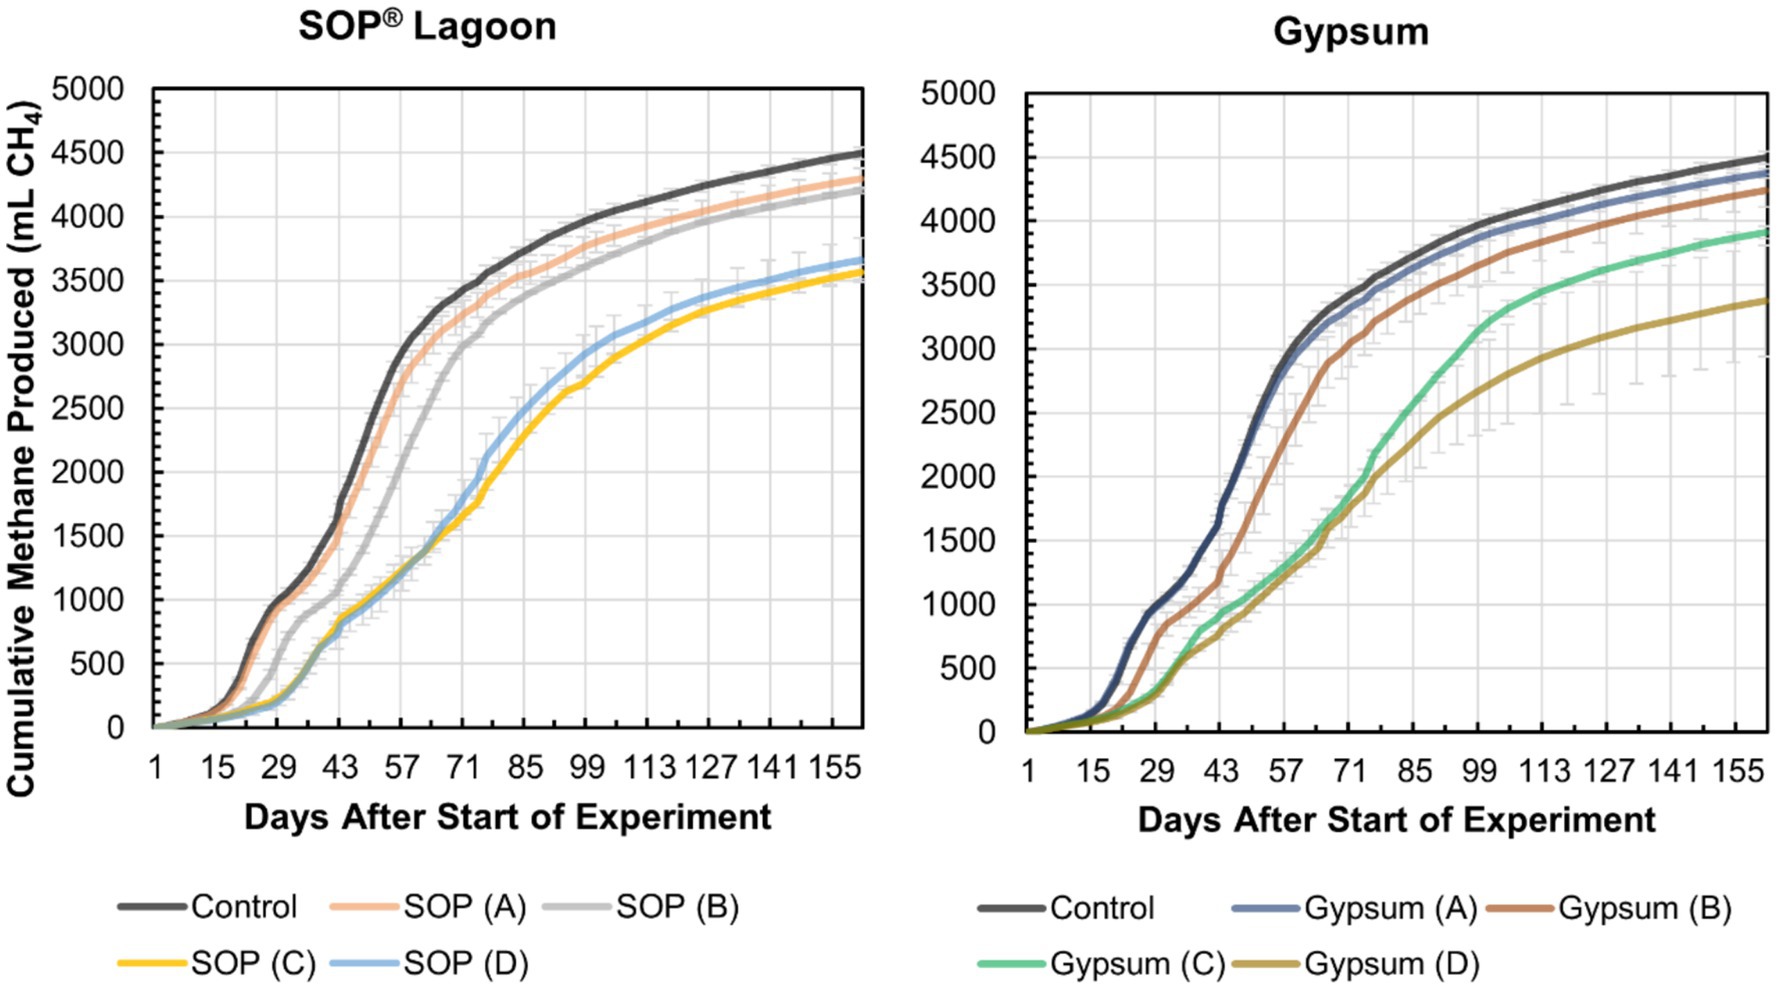
Figure 1. Cumulative CH4 produced from each treatment including the control and additives. Whiskers indicate the standard deviation.
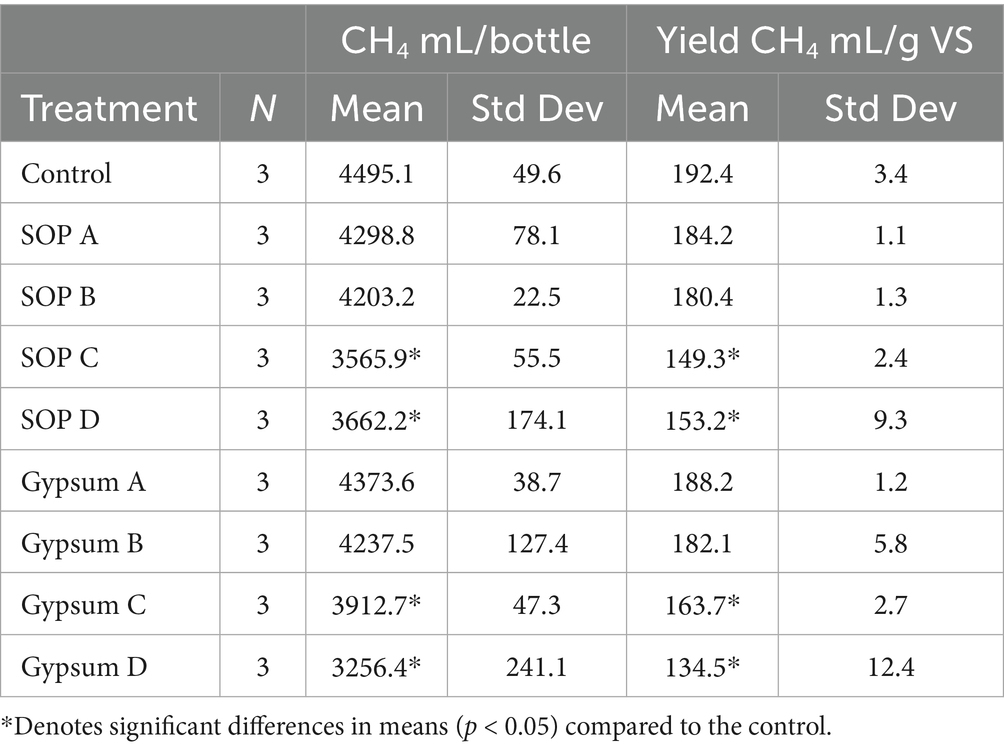
Table 3. Cumulative net CH4 production and yield (scaled per gram of initial VS in substrate) from manure (control) with SOP and gypsum at different rates, incubated for 162 d at 24°C.
As shown in Figure 2, the peak reduction in CH4 emissions occurred between 20 days (SOP A, Gypsum B) and 28 days (SOP C, D). At the peak, SOP had reductions of 68, 78, and 82% for rates B, C, D, respectively. Peak reductions for gypsum were 52, 70, and 74% for the same rates.
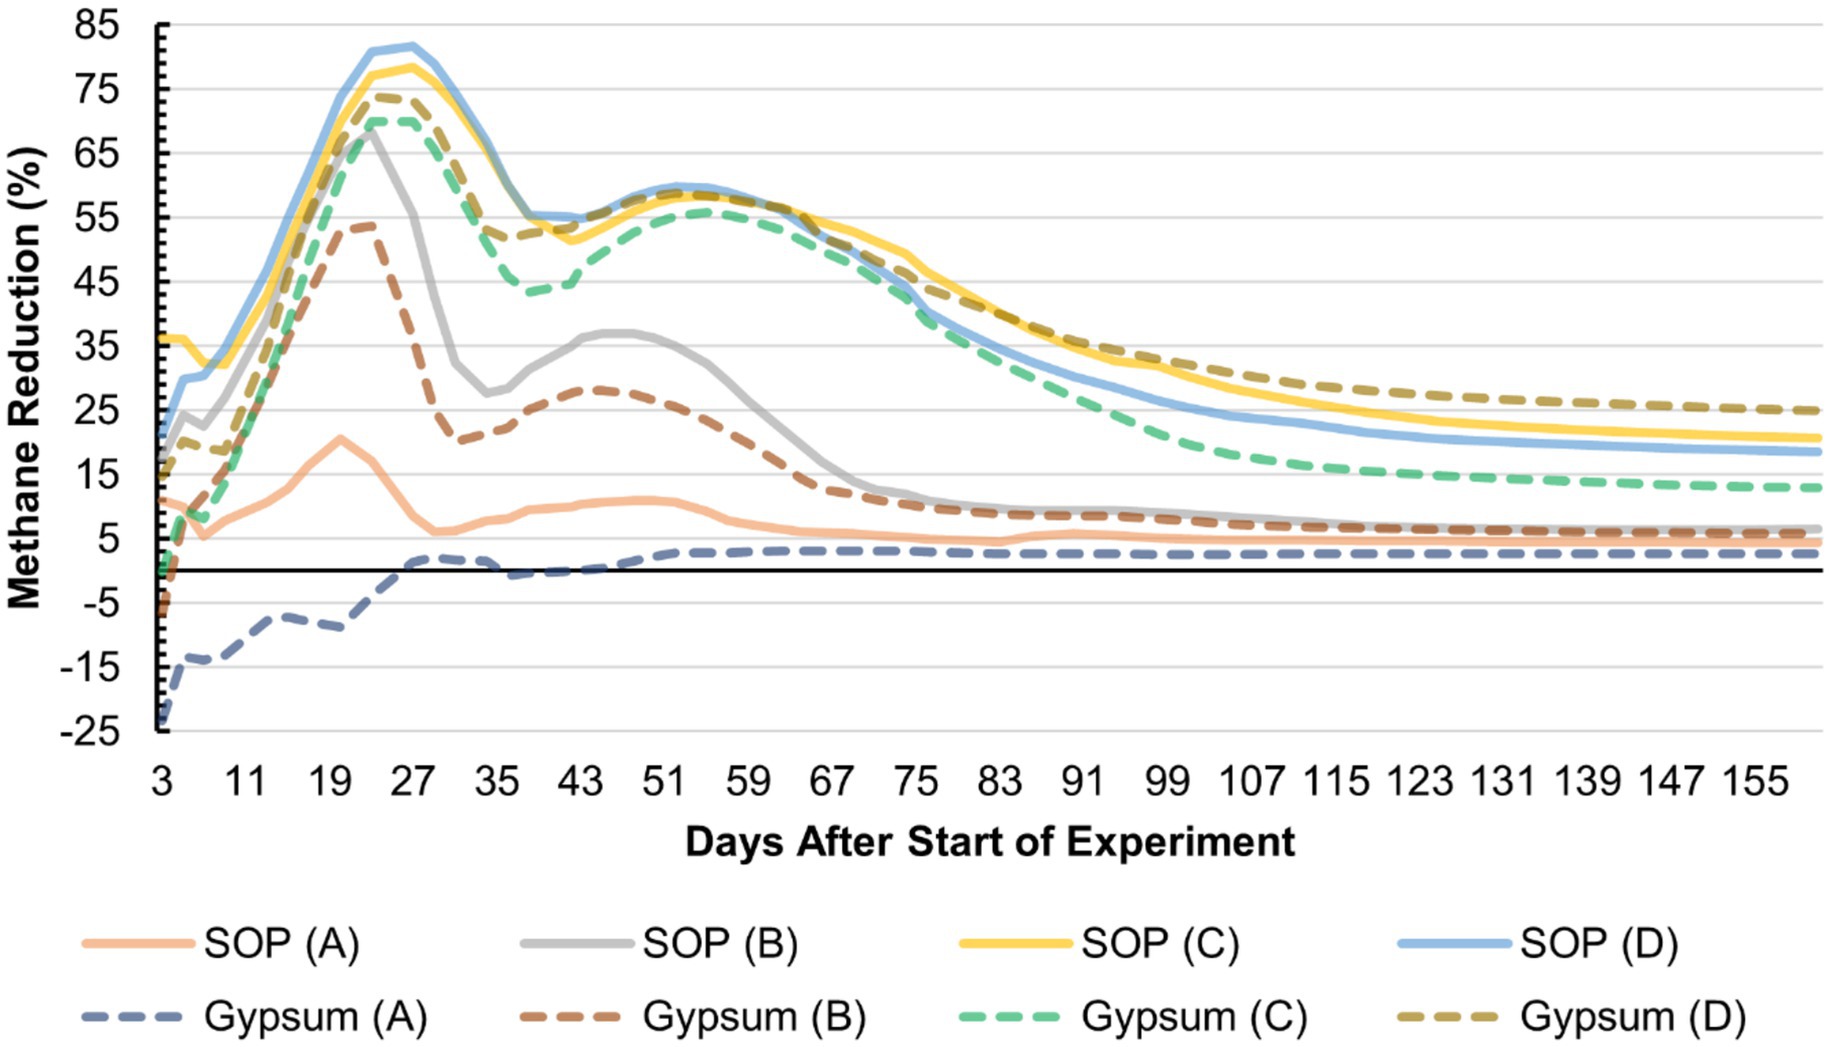
Figure 2. Reduction of cumulative CH4 (% vs. control) over time for each treatment.
Statistical comparisons at 15-day intervals before and after the peak reductions are shown in Table 4. The lowest rate of gypsum was never significantly different from the control, while the lowest rate of SOP had slightly reduced CH4 which was statistically significant at some times (day 15 and 45) but not others (day 30 and 60). All other rates of additives resulted in significant reductions at all four times.
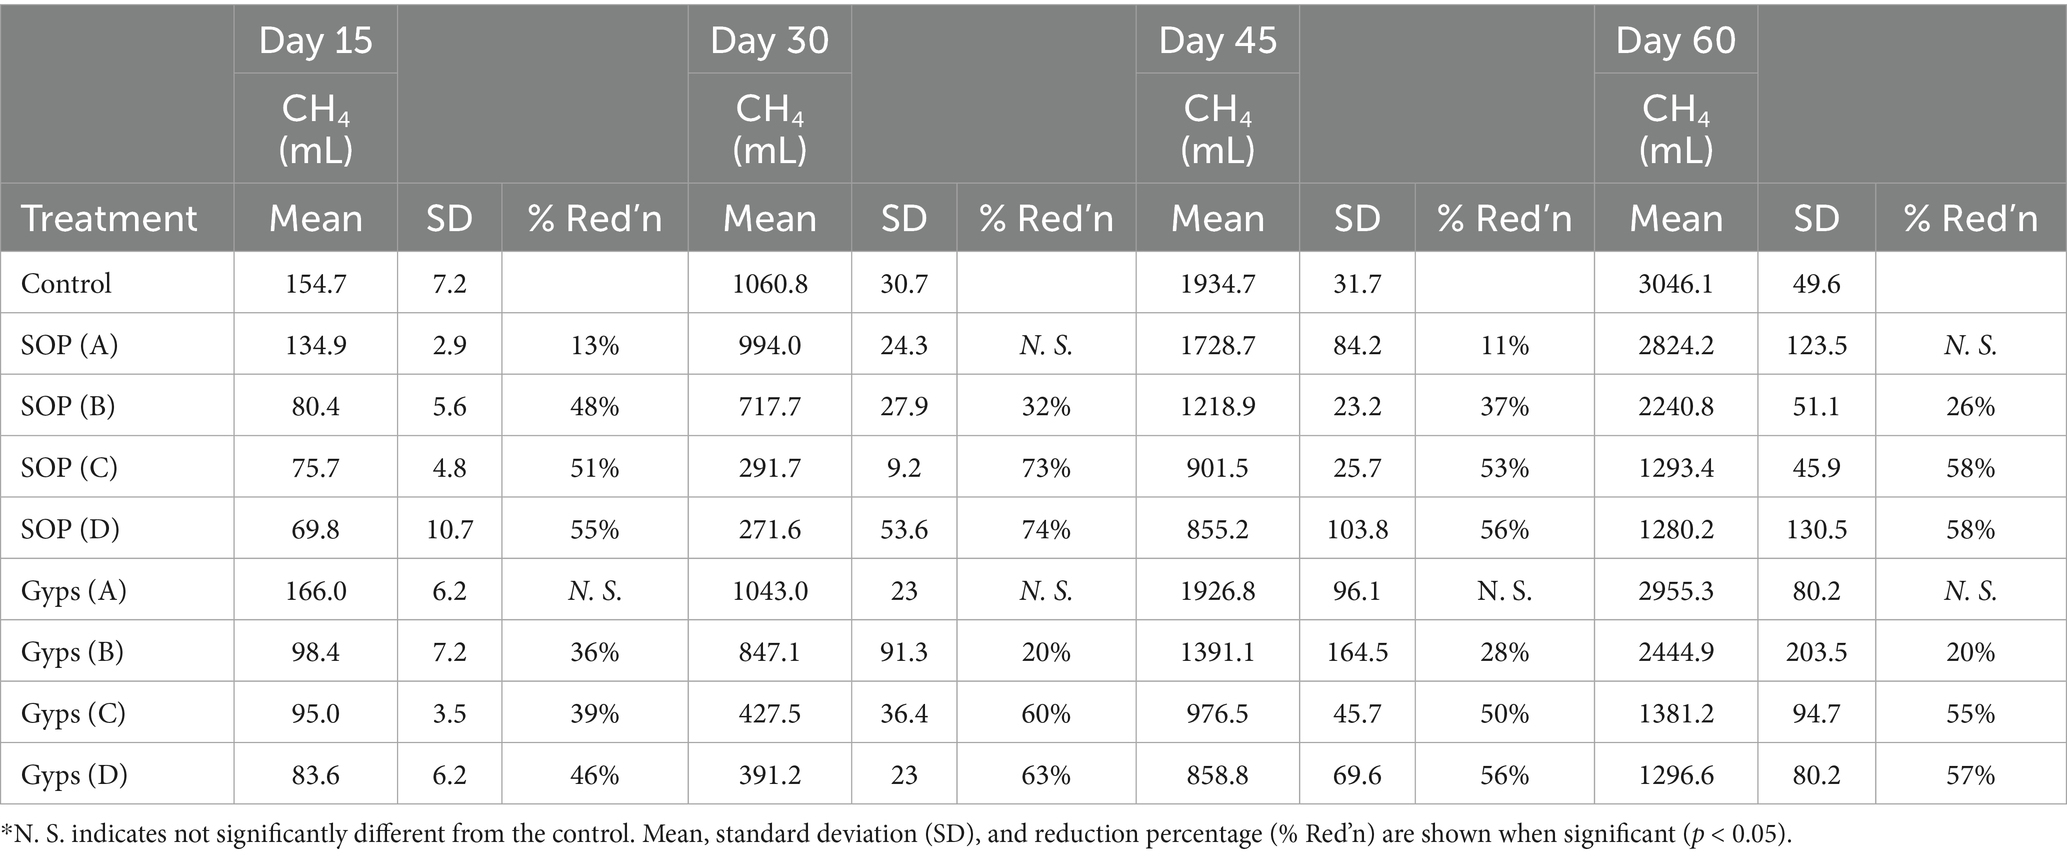
Table 4. Cumulative CH4 production at 15, 30, 45, and 60 days of incubation.
There was a significant dose–response for both additives, where CH4 reduction increased as the rate of additive increased (Figure 3). The slope of the equation was highest around the time of peak emission reductions (30 days) and declined slightly by day 60, and finally having a slope not significantly different from zero at the end of the study (day 162). The dose response was non-linear, indicating that there were large improvements in CH4 mitigation by increasing the dose from 100 g/m3 up to 5,000 g/m3, but little benefit from subsequent doubling to 10,000 g/m3. Comparing the two additives, there were differences at some times, but the overall dose-time relationship was very similar.
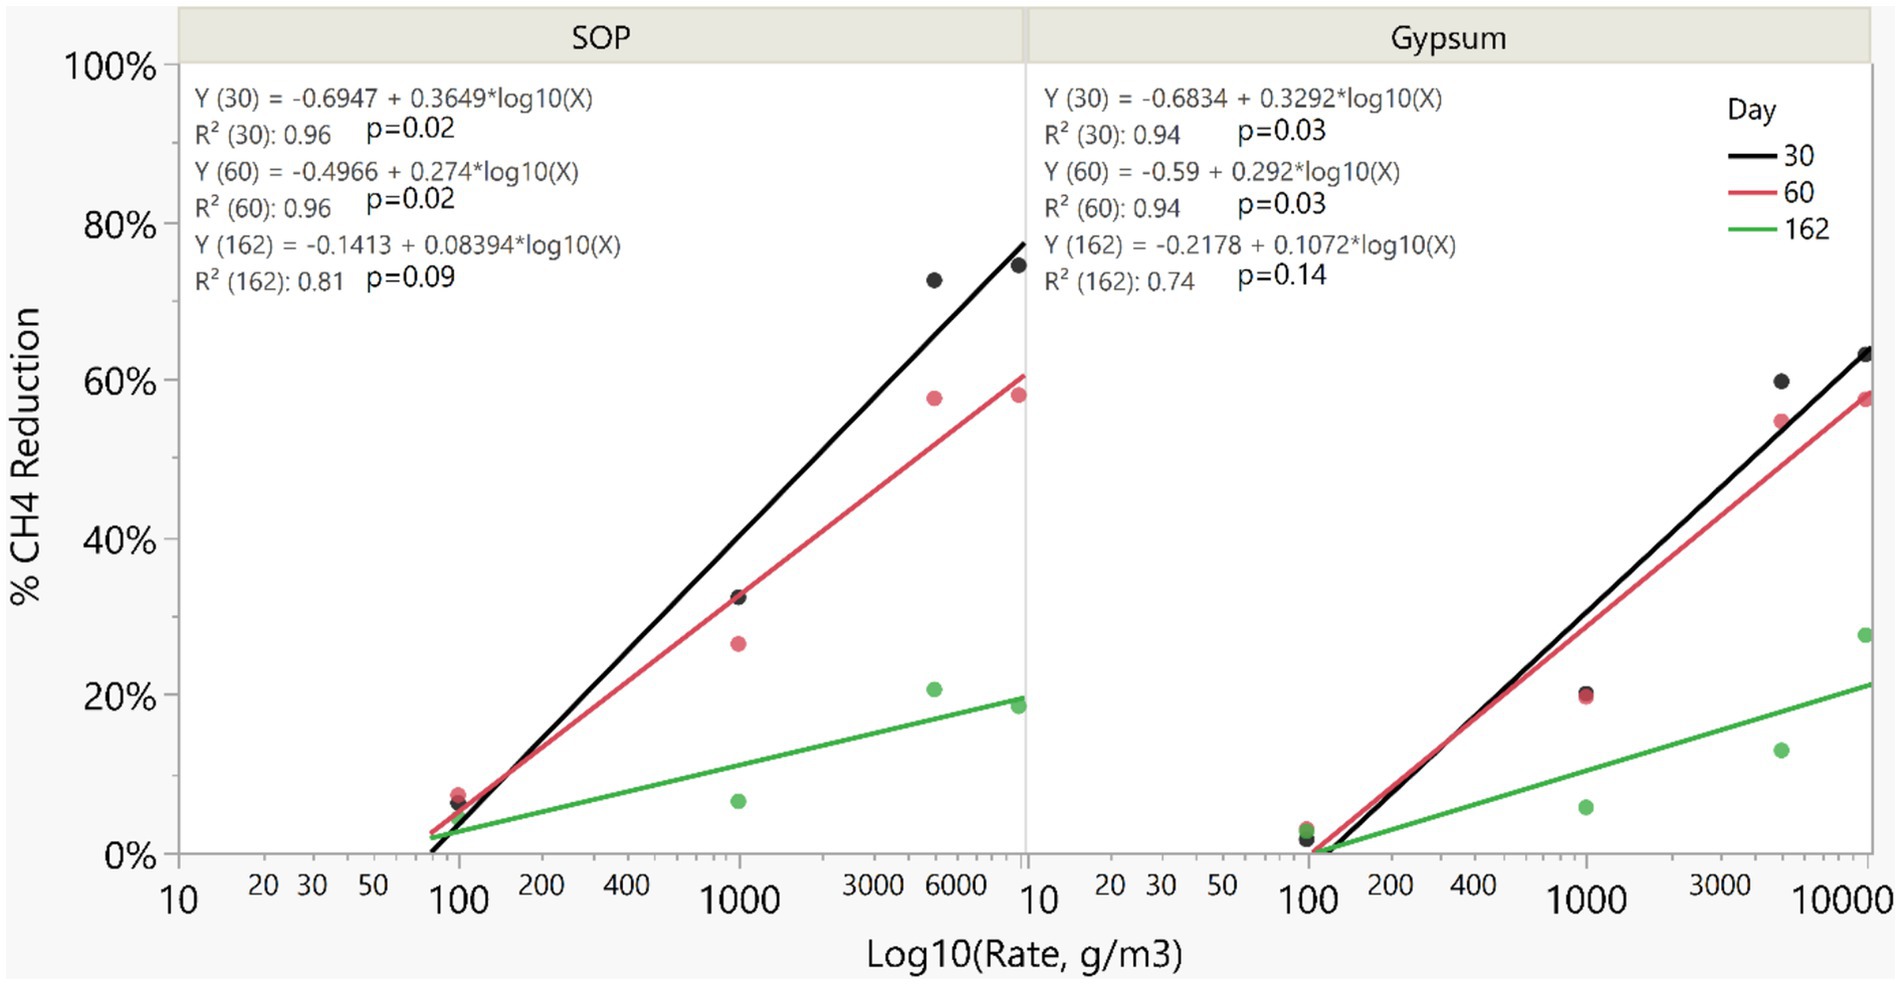
Figure 3. Dose response of CH4 reduction (% compared to control) vs. the log10 transformed rate of each additive (g/m3). Regression lines represent cumulative CH4 reduction at a specific incubation time (30, 60, and 162 days).
4 Discussion
Previous research in flooded rice (Denier Van Der Gon et al., 2001) and sewage systems (Czatzkowska et al., 2020) have shown that sulfate addition leads to CH4 reduction due to competition between sulfate reducing bacteria and methanogens, and inhibition of methanogenesis by sulfide (Eriksen et al., 2012). A dose–response with mitigation increasing with higher sulfate addition was noted in rice systems (Denier Van Der Gon et al., 2001) and liquid manure (Matos Pereira Lima et al., 2025). In the present study, at the lowest rate of addition (100 g/m3) the effect of SOP was inconsistent, and gypsum did not cause a significant reduction. Similarly, previous studies using rates of SOP less than 31 g/m3 have shown no effect over 7 days (Peterson et al., 2020), increased CH4 after 7 and 26 days (Borgonovo et al., 2019), and no effect after ~1 month (Chiodini et al., 2023; Table 5). Borgonovo et al. (2019) observed a numerical CH4 decrease after 4 days, but this was not significantly different from the control (p = 0.568; t-test calculated using mean, SE, and N values provided in the paper).
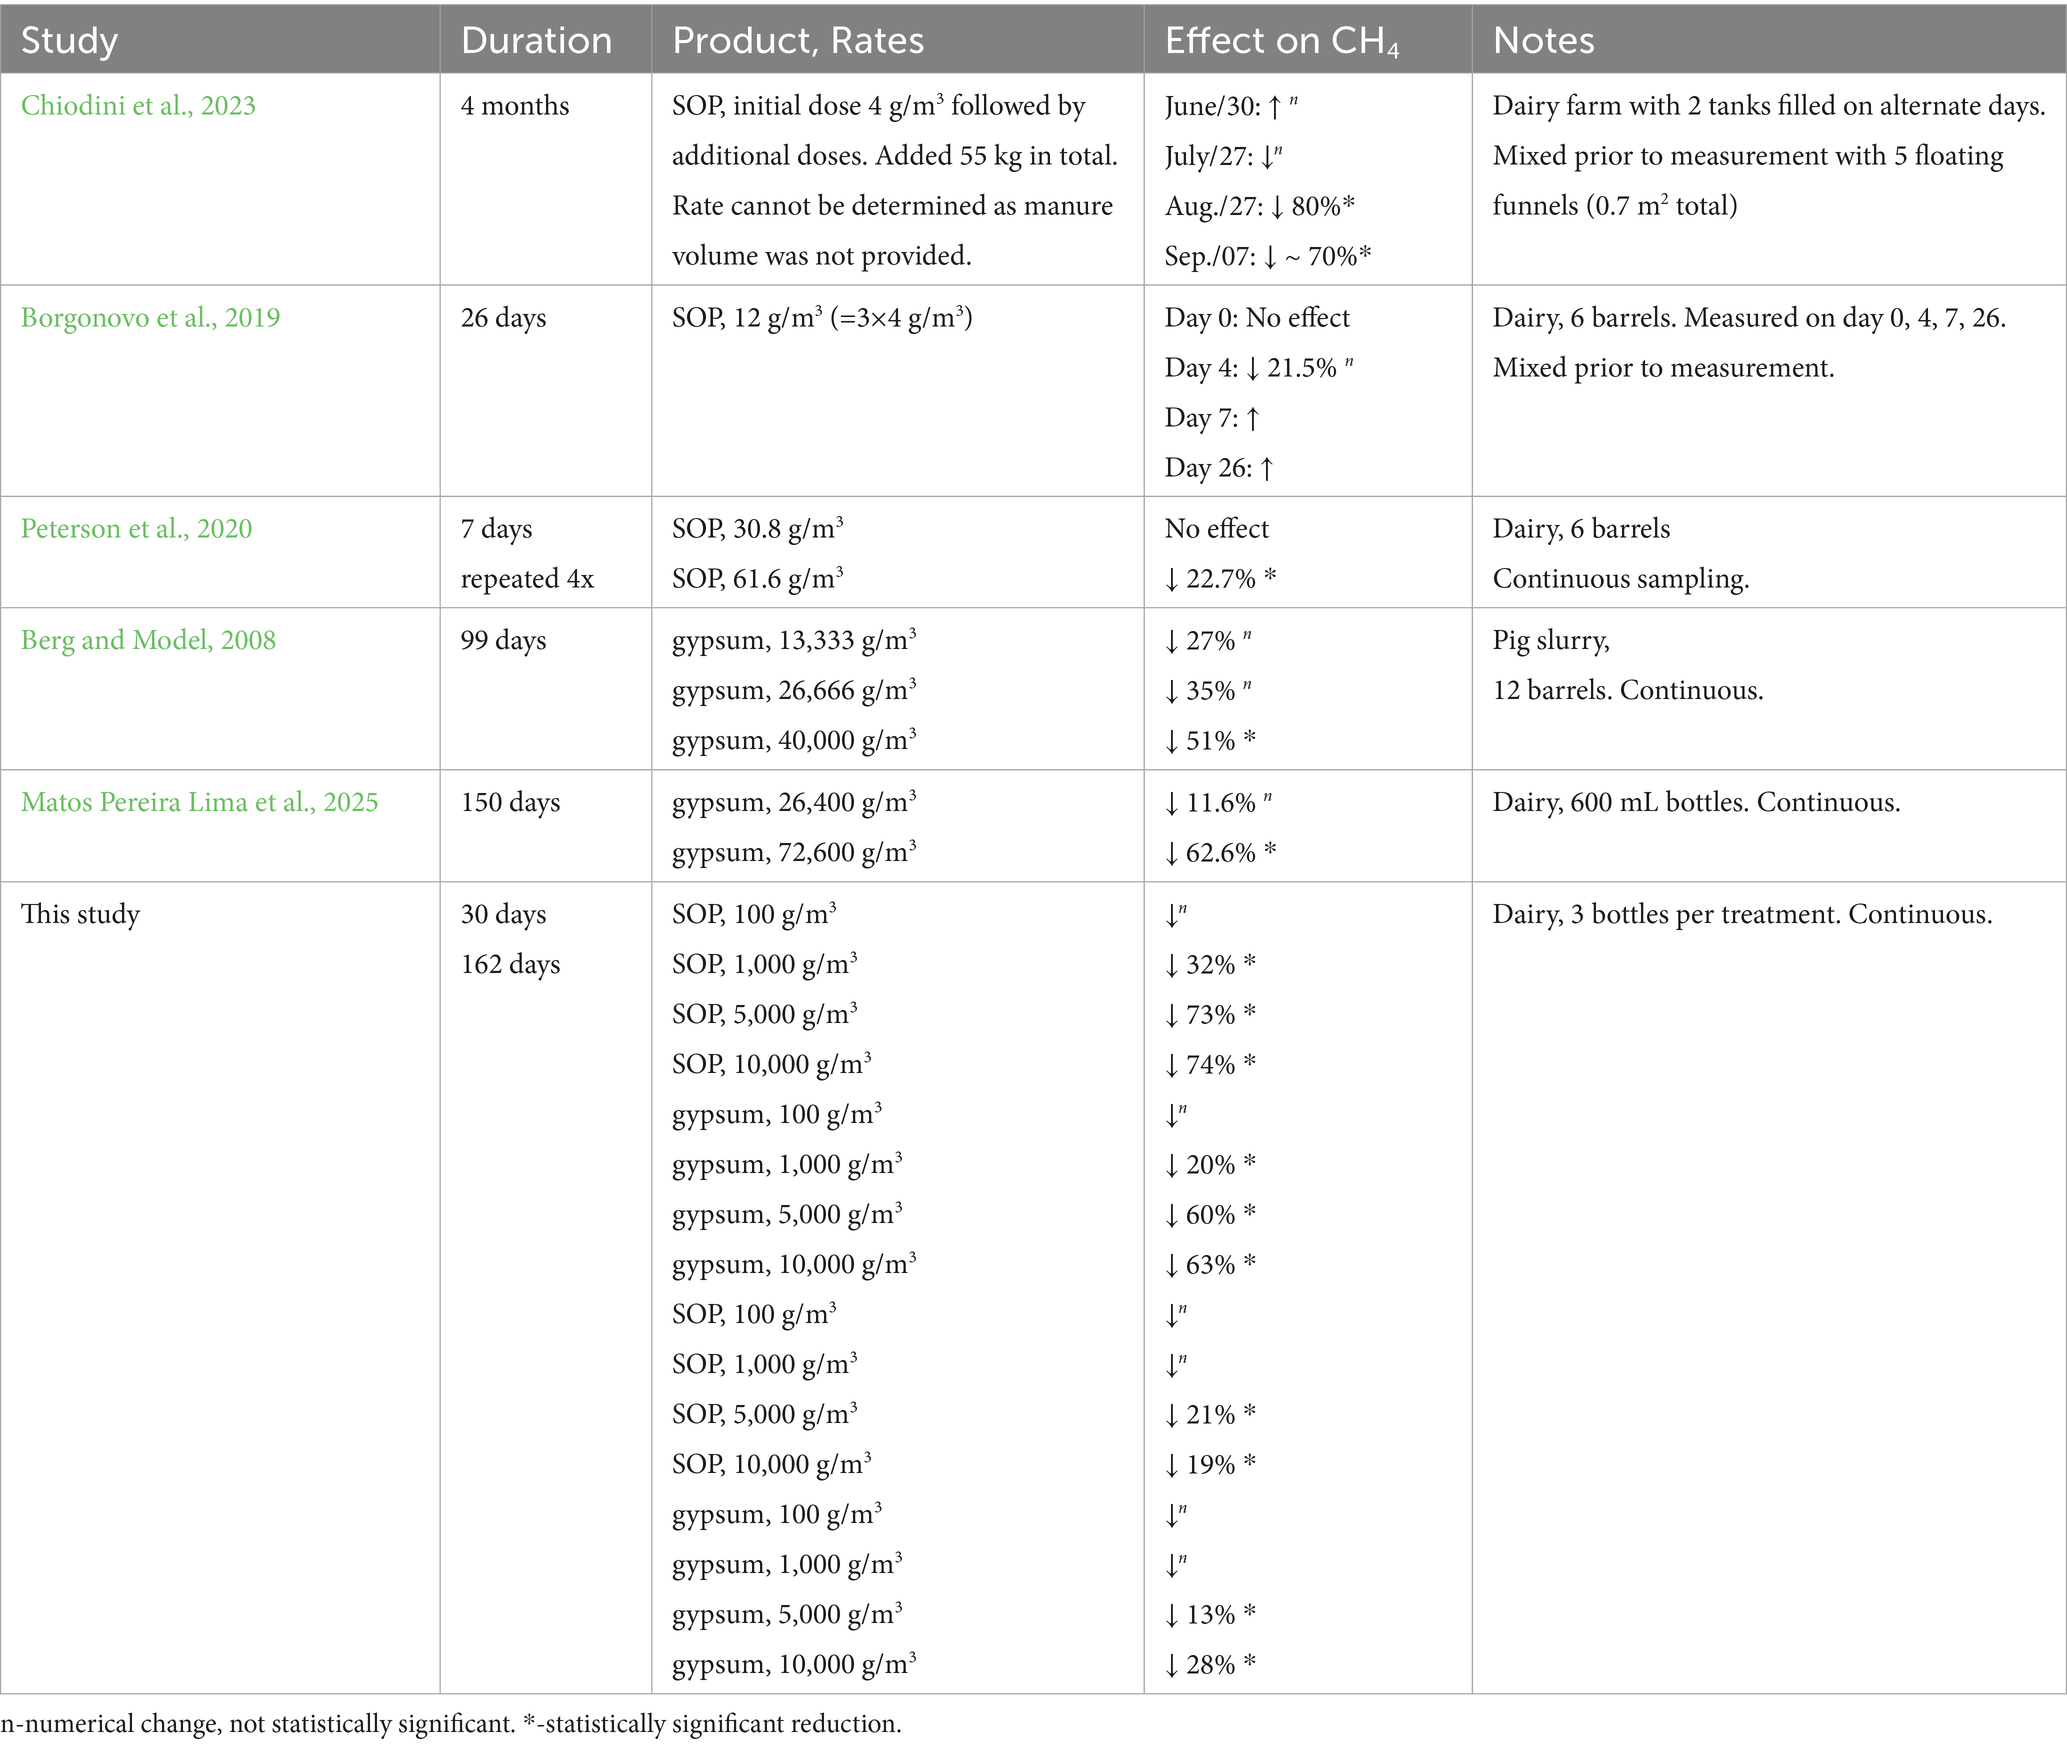
Table 5. Summary of research studies on SOP and gypsum influencing CH4.
Both products reduced CH4 when added at a sufficient rate of 1,000 g/m3 or higher. The maximum reduction observed was 82% on 1 day with the highest rate of SOP. The non-linear relationship between CH4 reduction and dose of SOP and gypsum is the steepest between 100 and 5,000 g/m3 and there was little improvement by doubling the rate to 10,000 g/m3. Therefore, it is unlikely that higher reduction could be realized even at higher rates. Previous studies are consistent with these findings. For example, the high rate used by Peterson et al. (2020) provided a significant CH4 reduction of 23% while the low rate did not. Berg and Model (2008) also observed higher reductions as rates increased, but in their study the CH4 emissions from the control decreased early in the study which may be related to a difference between pig slurry (their study) and dairy slurry (all other studies). Matos Pereira Lima et al. (2025) also found long-term reductions with a higher rate, and notably they found both rates decreased CH4 more similarly after 80 days. Given the results in present and previous studies (Table 5) it is unlikely that 80% reduction could be achieved consistently over time on a farm. Reductions between 20 and 60% appear to be realistic and achievable, with adequate application rate and re-application. Additional studies at larger scale with high-frequency measurements are required for verification.
Chiodini et al. (2023) observed large reductions after ~2 months; however, it is notable that they mixed the tanks before conducting their point measurements which adds an experimental artifact unrelated to the effect of any additive. Previous studies have consistently shown that mixing causes CH4 to be released so measurements after mixing are reduced and are not comparable to normal emissions (e.g., Vander Zaag et al., 2014). Emissions at the end of the trial (Figure 2) are not the most applicable to farm applications, since the temperature in typical locations is not 24°C for 162 days. Rather, most temperate locations (e.g., in Canada) have much lower temperatures and exposure to average temperatures of 24°C would be limited to a shorter period of time. Therefore, looking at the emission reductions at different points in time during the study is informative.
The SOP and gypsum additives had similar effects and similar changes over time. Generally, the efficacy peaked for both additives between 20 and 30 days then declined. During the first 45 days SOP had up to 9-percentage points higher CH4 reduction than gypsum at the same rate; however, at day 60 and at the end of the trial gypsum had greater efficacy. It is possible that this difference is because of particle size. Visual observation of the products indicates that SOP had smaller particles and more uniform size than the local gypsum which had more varied granule sizes. It follows that SOP could be considered rapidly available while gypsum was gradually available in comparison. To maintain efficacy for the entire warm season (when CH4 is produced), both products would likely require reapplication after a period of time, and the amount of time depends on the rate added and the target reduction.
Both gypsum fertilizer and SOP are available in boxes or bags (as used in this study) and can be purchased from existing supply networks. The price paid for SOP in this study was $82.50 CAD /kg, while the price for local gypsum was $1.32 CAD /kg. A rough cost estimate was made using the farm from which the manure was collected that has approximately 160 dairy cows and has a manure storage volume of nearly 4,000 m3 by the end of summer. At an application rate of 1,000 g/m3 the farm would require 4,000 kg of additive. This quantity of local gypsum could be purchased for $5,291, but would cost 62.4-times more to purchase the same quantity of SOP. Local gypsum purchased in bulk, through the fertilizer supply chain, would further reduce the cost of local gypsum. The volume of gypsum supplied for fertilizer use on farms is already large, so it follows that local gypsum was available for much lower cost than SOP which is imported from Italy. While the availability of gypsum will certainly vary from one place to another, it is widely available from mines around the world (e.g., in Iowa, United States, Nova Scotia, Canada, and Spain), with the United States being the largest producer (Clark, 2014; Mineral Management Division, 2024; Escavy et al., 2012). The US Geological Yearbook Survey estimated 20.7 million metric tonnes were mined from the nation in 2017 (Crangle, 2020). Synthetic gypsum is also a growing market.
5 Conclusion
Overall, both SOP and gypsum reduced CH4 emissions when added at 100 g/m3 or more. The two additives generally had similar performance in response to increasing the rate and incubation time, which is consistent with the fact that SOP is made of gypsum. The main apparent difference was SOP having slightly faster activity, consistent with having smaller particle size, while local gypsum was slower acting. Emission reductions of 20 to 58% were achievable with both additives over 60 days depending on application rate. Both SOP and gypsum appear to be viable options to reduce CH4 substantially, although not completely. The cost of local gypsum fertilizer was much lower than SOP. Therefore, either additive can be used to reduce CH4, while applying higher doses of local gypsum on-farm is likely to be a more cost-effective mitigation option.
Data availability statement
The raw data supporting the conclusions of this article will be made available by the authors, without undue reservation.
Author contributions
CS: Conceptualization, Data curation, Formal analysis, Investigation, Methodology, Visualization, Writing – original draft. HB: Data curation, Formal analysis, Methodology, Software, Validation, Writing – review & editing. RR: Funding acquisition, Methodology, Project administration, Resources, Validation, Writing – review & editing. AV: Conceptualization, Funding acquisition, Investigation, Methodology, Project administration, Resources, Supervision, Validation, Visualization, Writing – original draft, Writing – review & editing.
Funding
The author(s) declare that financial support was received for the research and/or publication of this article. This research was supported by a contribution from the Dairy Research Cluster 4 (Dairy Farmers of Canada and Agriculture and Agri-Food Canada) under the Canadian Agricultural Partnership Agri-Science Program, project ID: CAP-J-003352 SCAP-ASC-07-4A.
Conflict of interest
The authors declare that the research was conducted in the absence of any commercial or financial relationships that could be construed as a potential conflict of interest.
The author(s) declared that they were an editorial board member of Frontiers, at the time of submission. This had no impact on the peer review process and the final decision.
Generative AI statement
The authors declare that no Gen AI was used in the creation of this manuscript.
Publisher’s note
All claims expressed in this article are solely those of the authors and do not necessarily represent those of their affiliated organizations, or those of the publisher, the editors and the reviewers. Any product that may be evaluated in this article, or claim that may be made by its manufacturer, is not guaranteed or endorsed by the publisher.
References
Berg, W., and Model, A. (2008). Gypsum reduces methane emission during the storage of pig slurry. Aust. J. Exp. Agric. 48, 96–98. doi: 10.1071/EA07226
Borgonovo, F., Conti, C., Lovarelli, D., Ferrante, V., and Guarino, M. (2019). Improving the sustainability of dairy slurry by a commercial additive treatment. Sustain. For. 11:4998. doi: 10.3390/su11184998
Chiodini, M. E., Costantini, M., Zoli, M., Bacenetti, J., Aspesi, D., Poggianella, L., et al. (2023). Real-scale study on methane and carbon dioxide emission reduction from dairy liquid manure with the commercial additive SOP® lagoon. Sustain. For. 15:1803. doi: 10.3390/su15031803
Clark, R. J. (2014). Highlights of the unique geology of the fort dodge, Iowa, area: field guidebook. Iowa Publications Online. Available online at: https://publications.iowa.gov/25742/.
Cluett, J., VanderZaag, A. C., Baldé, H., McGinn, S., Jenson, E., Hayes, A. C., et al. (2020). Effects of two manure additives on methane emissions from dairy manure. Animals (Basel) 10:807. doi: 10.3390/ani10050807
Crangle, R. (2020). Gypsum, U.S. Geological Survey Minerals Yearbook – 2017. Available online at: https://www.usgs.gov/media/files/gypsum-2017-pdf.
Czatzkowska, M., Harnisz, M., Korzeniewska, E., and Koniuszewska, I. (2020). Inhibitors of the methane fermentation process with particular emphasis on the microbiological aspect: a review. Energy Sci. Eng. 8, 1880–1897. doi: 10.1002/ese3.609
Denier Van Der Gon, H., Van Bodegom, P. M., Wassmann, R., Lantin, R. S., and Metra-Corton, T. M. (2001). Sulfate-containing amendments to reduce methane emission from rice fields: mechanisms, effectiveness, and costs. Mitig. Adapt. Strateg. Glob. Change 6, 71–89. doi: 10.1023/A:1011380916490
Dobson, S., Goodday, V., and Winter, J. (2023). If it matters, measure it: a review of methane sources and mitigation policy in Canada. Int. Rev. Environ. Resour. Econ. 16, 309–429. doi: 10.1561/101.00000146
Environment and Climate Change Canada. (2025). National inventory report 1990–2023: greenhouse gas sources and sinks in Canada. Available online at: https://publications.gc.ca/site/eng/9.506002/publication.html.
Eriksen, J., Andersen, A. J., Poulsen, H. V., Adamsen, A. P. S., and Petersen, S. O. (2012). Sulfur Turnover and Emissions during Storage of Cattle Slurry: Effects of Acidification and Sulfur Addition. J. Environ. Qual. 41, 0047–2425. doi: 10.2134/jeq2012.0012
Escavy, J. I., Herrero, M. J., and Arribas, M. E. (2012). Gypsum resources of Spain: temporal and spatial distribution. Ore Geol. Rev. 49, 72–84. doi: 10.1016/j.oregeorev.2012.09.001
Holliger, C., Alves, M., Andrade, D., Angelidaki, I., Astals, S., Baier, U., et al. (2016). Towards a standardization of biomethane potential tests. Water Sci. Technol. 74, 2515–2522. doi: 10.2166/wst.2016.336
Matos Pereira Lima, F., Laniel, M., Balde, H., Gordon, R., and VanderZaag, A. (2025). Methane emission reduction by adding sulfate to liquid dairy manure. J. Environ. Qual. 54, 349–358. doi: 10.1002/jeq2.70002
Mineral Management Division. (2024). Mineral production in 2022 and exploration in 2023. Nova Scotia Canada. Information Circular ME 78. Available online at: https://novascotia.ca/natr/meb/data/pubs/ic/ic_me_078.pdf.
Peters, J., Combs, S., Hoskins, B., Jarman, J., Kovar, J., Watson, M., et al. (2003). Recommended methods of manure analysis (A3769). University of Wisconsin. Available online at: https://soilsextension.webhosting.cals.wisc.edu/wp-content/uploads/sites/68/2014/02/Manure_Analysis_Methods.pdf.
Peterson, C. B., El Mashad, H. M., Zhao, Y., Pan, Y., and Mitloehner, F. M. (2020). Effects of SOP® lagoon additive on gaseous emissions from stored liquid dairy manure. Sustain. For. 12:1393. doi: 10.3390/su12041393
Keywords: methane, methane mitigation, sulfate, dairy slurry storage, animal agriculture
Citation: Sauvé C, Baldé H, Rajagopal R and VanderZaag A (2025) Methane reductions with gypsum and SOP® lagoon additives in liquid manure. Front. Clim. 7:1592677. doi: 10.3389/fclim.2025.1592677
Edited by:
Titus Zindove, Lincoln University, New ZealandReviewed by:
Walter Svinurai, University of Zimbabwe, ZimbabweJames Madzimure, Africa University College, Zimbabwe
Copyright © 2025 His Majesty the King in Right of Canada, as represented by the Minister of Agriculture and Agri-Food Canada for the contribution of Chelsea Sauvé, Hambaliou Baldé, Rajinikanth Rajagopal and Andrew VanderZaag. This is an open-access article distributed under the terms of the Creative Commons Attribution License (CC BY). The use, distribution or reproduction in other forums is permitted, provided the original author(s) and the copyright owner(s) are credited and that the original publication in this journal is cited, in accordance with accepted academic practice. No use, distribution or reproduction is permitted which does not comply with these terms.
*Correspondence: Andrew VanderZaag, YW5kcmV3LnZhbmRlcnphYWdAYWdyLmdjLmNh