 Naomi Kumi1*Caleb Mensah1Kwesi A. Quagraine2,3Trisha D. Patel4Frederick Otu-Larbi1
 Nana Agyemang Prempeh1Mariam Nguvava5Tiro Nkemelang4,6
 Babatunde J. Abiodun7,8
 Christopher Lennard7
 Mark G. New4
 Romaric C. Odoulami4*
- 1Department of Atmospheric and Climate Science, University of Energy and Natural Resources, Sunyani, Ghana
- 2NSF National Center for Atmospheric Research, Boulder, CO, United States
- 3Department of Physics, University of Cape Coast, Cape Coast, Ghana
- 4African Climate and Development Initiative (ACDI), University of Cape Town, Cape Town, South Africa
- 5Department of Geography and Environmental Studies, College of Natural and Applied Sciences, Sokoine University of Agriculture, Morogoro, Tanzania
- 6Botswana Institute for Technology Research and Innovation (BITRI), Gaborone, Botswana
- 7Climate System Analysis Group (CSAG), Environmental and Geographical Science Department, University of Cape Town, Cape Town, South Africa
- 8Nansen-Tutu Centre for Marine Environmental Research, Department of Oceanography, University of Cape Town, Cape Town, South Africa
Future climate projections indicate that Africa will experience significant increases in both mean and extreme temperature indices. These changes will be accompanied by notable shifts in precipitation patterns under a high-emission scenario (RCP8.5). Using climate simulations, this study assesses the potential impact of stratospheric aerosol injection (SAI) on projected mean and extreme temperature and precipitation across the continent. We analysed data from the Stratospheric Aerosol Geoengineering Large Ensemble (GLENS) project, which simulates a set of SAI experiments under RCP8.5 emission scenarios with SO2 injection into the tropical stratosphere at 22.8–25 km altitude (GLENS) and around 1 km above the tropopause (GLENS_low) and near the equator at around 20–25 km above ground (GLENS_eq). The results show that all SAI experiments (GLENS, GLENS_eq, and GLENS_low) exhibit substantial cooling effects, with GLENS_eq emerging as the most effective in reducing temperature extremes, particularly over Central and Southern Africa. However, despite successfully offsetting much of the RCP8.5-induced warming, the effectiveness of SAI varies across regions, leaving some regions, such as the Sahel and North Africa, with residual warming. In addition to its cooling effects, SAI could significantly alter precipitation patterns, introducing widespread drying and thereby reducing flood risks across the continent. While SAI could offset the projected increase in extreme precipitation under RCP8.5, it could simultaneously exacerbate drying trends over Central, Southern, and Northern Africa. These findings highlight critical trade-offs associated with SAI deployment, particularly for regions where agriculture and water resources depend heavily on rainfall, underscoring the need for regionally optimised geoengineering strategies that balance temperature moderation with hydrological stability. This study provides the first comparative analysis of tropical, equatorial, and low-altitude SAI impacts on the climate, revealing critical trade-offs for precipitation-dependent regions. The findings presented here are, however, specific to the SAI scenarios analysed (GLENS experiments), as a different SAI deployment scenario would lead to different conclusions.
1 Introduction
The urgency of addressing climate change has never been more critical, as global temperatures continue to rise, leading to more frequent and intense extreme weather events that threaten vulnerable regions, particularly in Africa (IPCC, 2023). Despite global efforts under the Paris Climate Agreement (PCA) to limit global warming to well below 2 °C above pre-industrial levels, progress has been slow, and emissions trajectories remain inconsistent with the PCA targets (IPCC, 2023). The current international climate policy landscape, particularly marked by the withdrawal of major economies, like the United States, from key climate agreements, has raised unprecedented concerns about achieving the PCA’s goals. As a result, the persistent struggle to meet global decarbonisation goals through reducing emissions has increased interest in climate intervention strategies such as solar radiation modification (SRM) with stratospheric aerosol injection (SAI) as a potential technique to counter some of the worst impacts of climate change by reducing the amount of incoming solar radiation absorbed at the earth’s surface (Caldeira et al., 2013; MacMartin et al., 2018).
SAI involves the injection of reflective aerosols into the stratosphere to prevent a small amount of incoming solar radiation from reaching the Earth’s surface, thereby reducing global temperatures (Kravitz et al., 2017). However, the potential of SRM approaches (SAI inclusive) is limited to modifying radiative forcing rather than addressing greenhouse gas (GHG) concentrations and could, therefore, induce new uncertainties and risks (Caldeira et al., 2013). This underscores the importance of research to understanding the risks and benefits associated with SAI and other climate intervention approaches before any use or non-use agreement can be reached (Institute of Medicine, National Academy of Sciences, and National Academy of Engineering, 1992, National Academies of Sciences, Engineering, and Medicine, 2021).
While global climate model (GCM) studies suggest that stratospheric injection of sulphate aerosols could reduce global surface air temperature, it could also have profound implications for regional climate, precipitation patterns, and stratospheric ozone chemistry by inducing ozone loss (Rasch et al., 2008; Tilmes et al., 2020; Irvine and Keith, 2020; Ji et al., 2018; Liu et al., 2022). The regional climate impacts of SAI have been widely studied, with concerns about its potential disruptions to monsoon systems. For instance, Robock et al. (2008) reported that SAI could disrupt African and Asian monsoon rainfall, potentially increasing food insecurity for billions of people in these regions. Similarly, Pinto et al. (2020) projected further reductions in rainfall over Southern Africa and West Africa by the end of the century under SAI scenarios. Given that many African countries remain heavily reliant on rainfed agriculture, reductions in seasonal rainfall could deepen food insecurity and strain rural livelihoods (FAO, IFAD and WFP, 2015; Niang et al., 2014). At the same time, sea level rise poses increasing risks to coastal infrastructure, with spatially variable impacts projected across regions like the Gulf of Guinea, East Africa, and the Mediterranean (Pajak et al., 2024). These layered vulnerabilities mean that even modest SAI-induced climate shifts could carry outsized risks or benefits for the continent.
SAI could counteract the RCP8.5-projected increase in West African Monsoon rainfall along the Guinean coast and the southern Sahel by significantly reducing summer precipitation, potentially making the region drier in the future (Da-Allada et al., 2020). Furthermore, an analysis of drought characteristics across Africa’s major river basins suggests that the impact of SAI on drought patterns would depend on the drought index considered. For example, using the Standardised Precipitation-Evapotranspiration Index (SPEI) and the Standardised Precipitation Index (SPI), Abiodun et al. (2021) found that SAI could reduce the projected frequency of SPEI-defined droughts due to SAI-induced decreases in temperature and atmospheric evaporative demand. However, SAI could also increase SPI-defined droughts due to its suppression of precipitation. Moreover, Abiodun et al. (2021) highlighted that these SAI-induced changes would narrow the gap between SPEI (upper limit) and SPI (lower limit) droughts, potentially limiting the effectiveness of drought management practices in reducing future drought frequency across Africa’s major river basins. This underscores the need for further research into SAI’s regional hydrological effects to assess its potential as a climate intervention strategy.
Previous studies suggest that SAI could alleviate heat stress on human health, agriculture, and vulnerable communities while also reducing crops’ vulnerability to extreme events. Additionally, under high greenhouse gas scenarios, SAI can maintain mean and extreme surface temperatures closer to historical levels across most regions in Africa, although its impact on precipitation remains uncertain and non-linear (Pinto et al., 2020; Patel et al., 2023).
Previous modelling studies that examined the influence of the location of the injection of aerosols (or their precursors) into the stratosphere on aerosol distribution and the climate suggest that higher injection altitudes are associated with increased aerosol lifetime (Irvine et al., 2016; Niemeier et al., 2011), higher radiative forcing (Niemeier and Schmidt, 2017), greater aerosol optical depth (AOD) per unit of injection and increased surface air temperature response per unit of AOD (MacMartin et al., 2017). Similarly, the latitude of aerosol release could substantially affect SAI outcomes. Injecting aerosols at the equator or in the tropics could be more efficient in achieving global aerosol distribution due to the Brewer-Dobson circulation, which transports aerosols poleward before most of them are removed (Irvine et al., 2016; Robock et al., 2008). On the other hand, aerosol release into the Arctic could induce less cooling than in the tropics due to the shorter aerosol lifetime due to prevailing stratospheric circulations, which are mainly poleward causing high latitude injections to result in aerosol distribution peaking near the poles (Robock et al., 2008). Additionally, the shorter aerosol lifetime is generally attributed to reduced upward background circulation near the poles, which justifies lower-altitude injections while modelling polar SAI (Duffey et al., 2025; Lee et al., 2023). Finally, due to the strong stratospheric zonal flows, any aerosol released into the stratosphere from a point source could be rapidly distributed zonally and slowly transported poleward (Irvine et al., 2016).
Despite growing research on the global climate effects of SAI, significant gaps remain in understanding its regional and local impacts, particularly for the regional climate response to injection strategies. Therefore, this study aims to evaluate the potential of different SAI strategies on mean and extreme temperatures and precipitation across Africa. Using data from the stratospheric aerosol Geoengineering Large Ensemble (GLENS) project, this study provides a comparative analysis of projected climate changes in three scenarios: a future without SAI, with SAI in response to the main feedback experiment (GLENS), and with alternative injection characteristics with a single injection point at the Equator (GLENS_eq) and four injection points in the tropics in the lower stratosphere (1 km above the tropopause; GLENS_low). In doing so, this study expands the geographic focus of SAI impact analysis to include under-researched regions such as North Africa’s Mediterranean zone, while also revisiting better-studied areas like West and Southern Africa to provide both complementary and contrasting insights. We focus on the late-century period (2075–2095), when climate signals are expected to be more pronounced, offering a useful lens into the potential scale and direction of SAI impacts under sustained high-emissions conditions. The following sections outline the data and methods used, key findings, and discuss their implications for Africa.
2 Data and methods
2.1 Data
This study uses data from the Stratospheric Sulphate Aerosol Geoengineering Large Ensemble (GLENS) project (Tilmes et al., 2018a). The GLENS project simulated stratospheric aerosol geoengineering scenarios using the Community Earth System Model (CESM1) with the Whole Atmosphere Climate Community Model (WACCM) as its atmospheric component [CESM1 (WACCM); Mills et al., 2017]. The CESM1 (WACCM) model was run at a spatial resolution of 0.9° latitude × 1.25° longitude, with 70 vertical levels from the surface up to 140 km (Tilmes et al., 2018a).
Here, we analyse the control and feedback experiments available in the GLENS Project datasets. Both control and feedback experiments were run using a high-end greenhouse gas (GHG) emission forcing (RCP8.5) as a reference. The control experiment comprises a set of twenty simulations covering the period 2010–2030 and is referred to as the control baseline (hereafter referred to as “BASE”). Of the twenty BASE simulations, only three are extended until the end of the 21st century and are called the control (“CTRL”). All three feedback experiments available in the GLENS Project are considered in this study. In the first feedback experiment (hereafter “GLENS”), gaseous sulphate in the form of sulphur dioxide (SO2) is injected at four locations in the tropical stratosphere at 15°N and 15°S at 25 km altitude and 30°N and 30°S at 22.8 km altitude, with each injection occurring in a single grid cell (Tilmes et al., 2018a; Kravitz et al., 2019). Each injection was performed in the model at a single grid cell along 180°E with the rate of injection being dynamically attuned to maintain (i) the global mean surface air temperature (T0), (ii) the inter-hemispheric surface air temperature gradient (T1), and (iii) the equator-to-pole surface air temperature gradient (T2) at the baseline (2010–2030 average) levels starting from 2020 until the end of the century with twenty simulations (Kravitz et al., 2017).
We address the size difference between BASE (2010–2030) with twenty simulated ensemble members and CTRL (post-2030) with only three simulated ensemble members by using the ensemble mean of the three post-2030 CTRL members. This allows us to have the same ensemble size (twenty), after calculating the difference between CTRL and BASE, and between GLENS and CTRL.
The remaining two feedback experiments available in the GLENS Project that were used in this study are the feedback_equator (hereafter “GLENS_eq”), in which SO2 is injected into the stratosphere at a single point at the Equator to control for one temperature target (T0). The final experiment, feedback_low (hereafter “GLENS_low”), has the same injection locations and temperature targets (T0, T1, and T2) as the GLENS simulation, while the injection altitude is in the lower stratosphere at 1 km above the tropopause. We used all three ensemble members available for GLENS_eq and GLENS_low, running from 2020 until the end of the century.
We analysed the BASE (2010–2030), which defines the SAI temperature targets; the future (2075–2095) under RCP8.5 forcing as simulated by the CTRL experiment; and the future (2075–2095) under RCP8.5 forcing and SAI as simulated by the GLENS, GLENS_eq, and GLENS_low experiments.
We then quantified how the characteristics of temperature and precipitation indices might change in the future, towards the end of the century (2075–2095) across Africa under (i) the RCP8.5 scenario without any SAI experiment relative to 2010–2030 or the baseline (CTRL minus BASE) and under (ii) RCP8.5 scenario with SAI experiments relative to the baseline (GLENS minus BASE, GLENS_eq minus BASE, and GLENS_low minus BASE), and (iii) the impact of SAI on GHG-induced warming under RCP8.5 scenario (GLENS minus CTRL, GLENS_eq minus CTRL, and GLENS_low minus CTRL).
2.2 Methods
We selected and analysed a set of climate indices, which describe moderate extremes (see Table 1 for more details) defined by the Expert Team on Climate Change Detection and Indices (ETCCDI; Alexander et al., 2006; Alexander and Herold, 2016; Zhang et al., 2011). We applied the R-based ClimPACT2 software (Alexander and Herold, 2016) to daily minimum and maximum temperatures and precipitation to compute these indices. Developed by the ETCCDI, ClimPACT2 software is widely used for calculating and analysing a large range of extreme climate indices in climate data. For percentile-based indices (TN10P, TX90P, WSDI, and R95P), the historical period (1990–2009) is used to calculate their corresponding thresholds. All mean and extreme temperature (TMM, TNN, TXX, TN10P, TX90P, and WSDI) and precipitation (CDD, PRCPTOT, R20MM, RX1DAY, RX5DAY, and R99P) indices were calculated using the daily minimum and maximum temperatures and precipitation over an African domain, which extends from 30°W to 65°E and 38°S to 38°N (Figure 1).
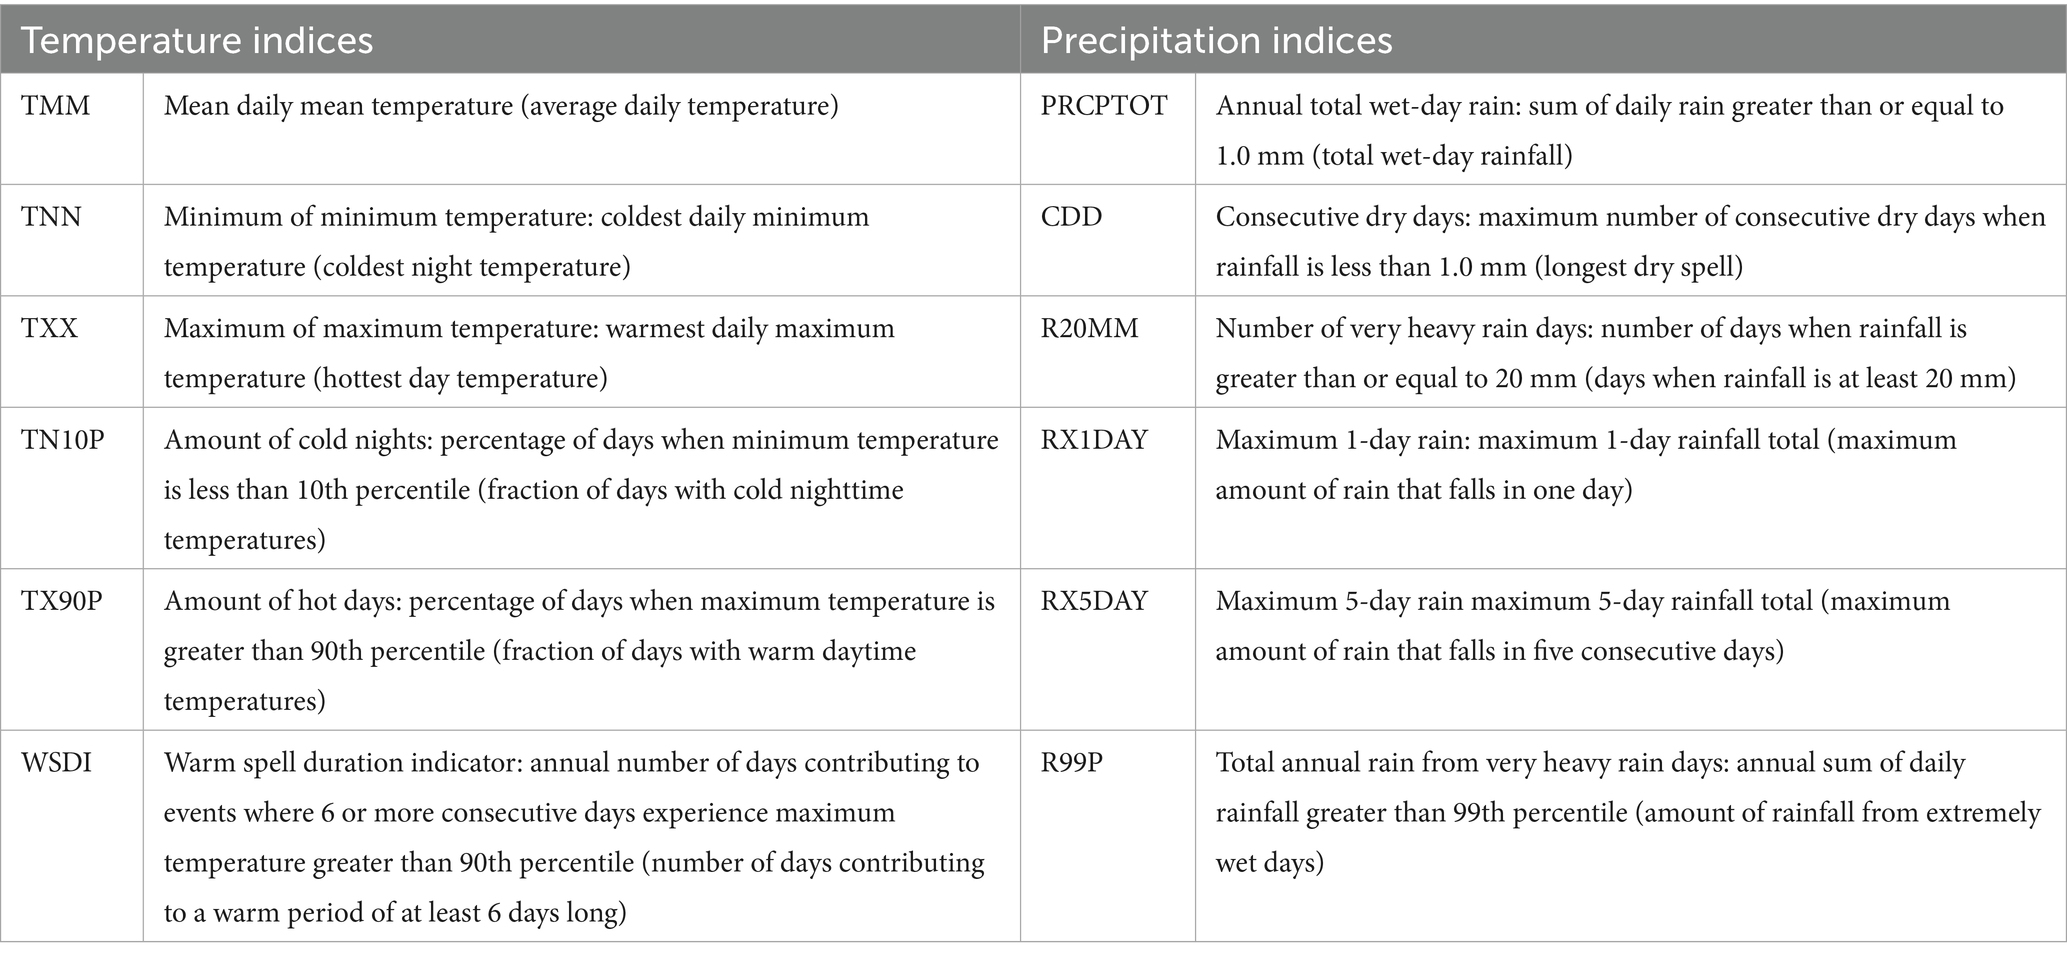
Table 1. A list of the selected ETCCDI mean and extreme temperature and precipitation indices analysed in this study.
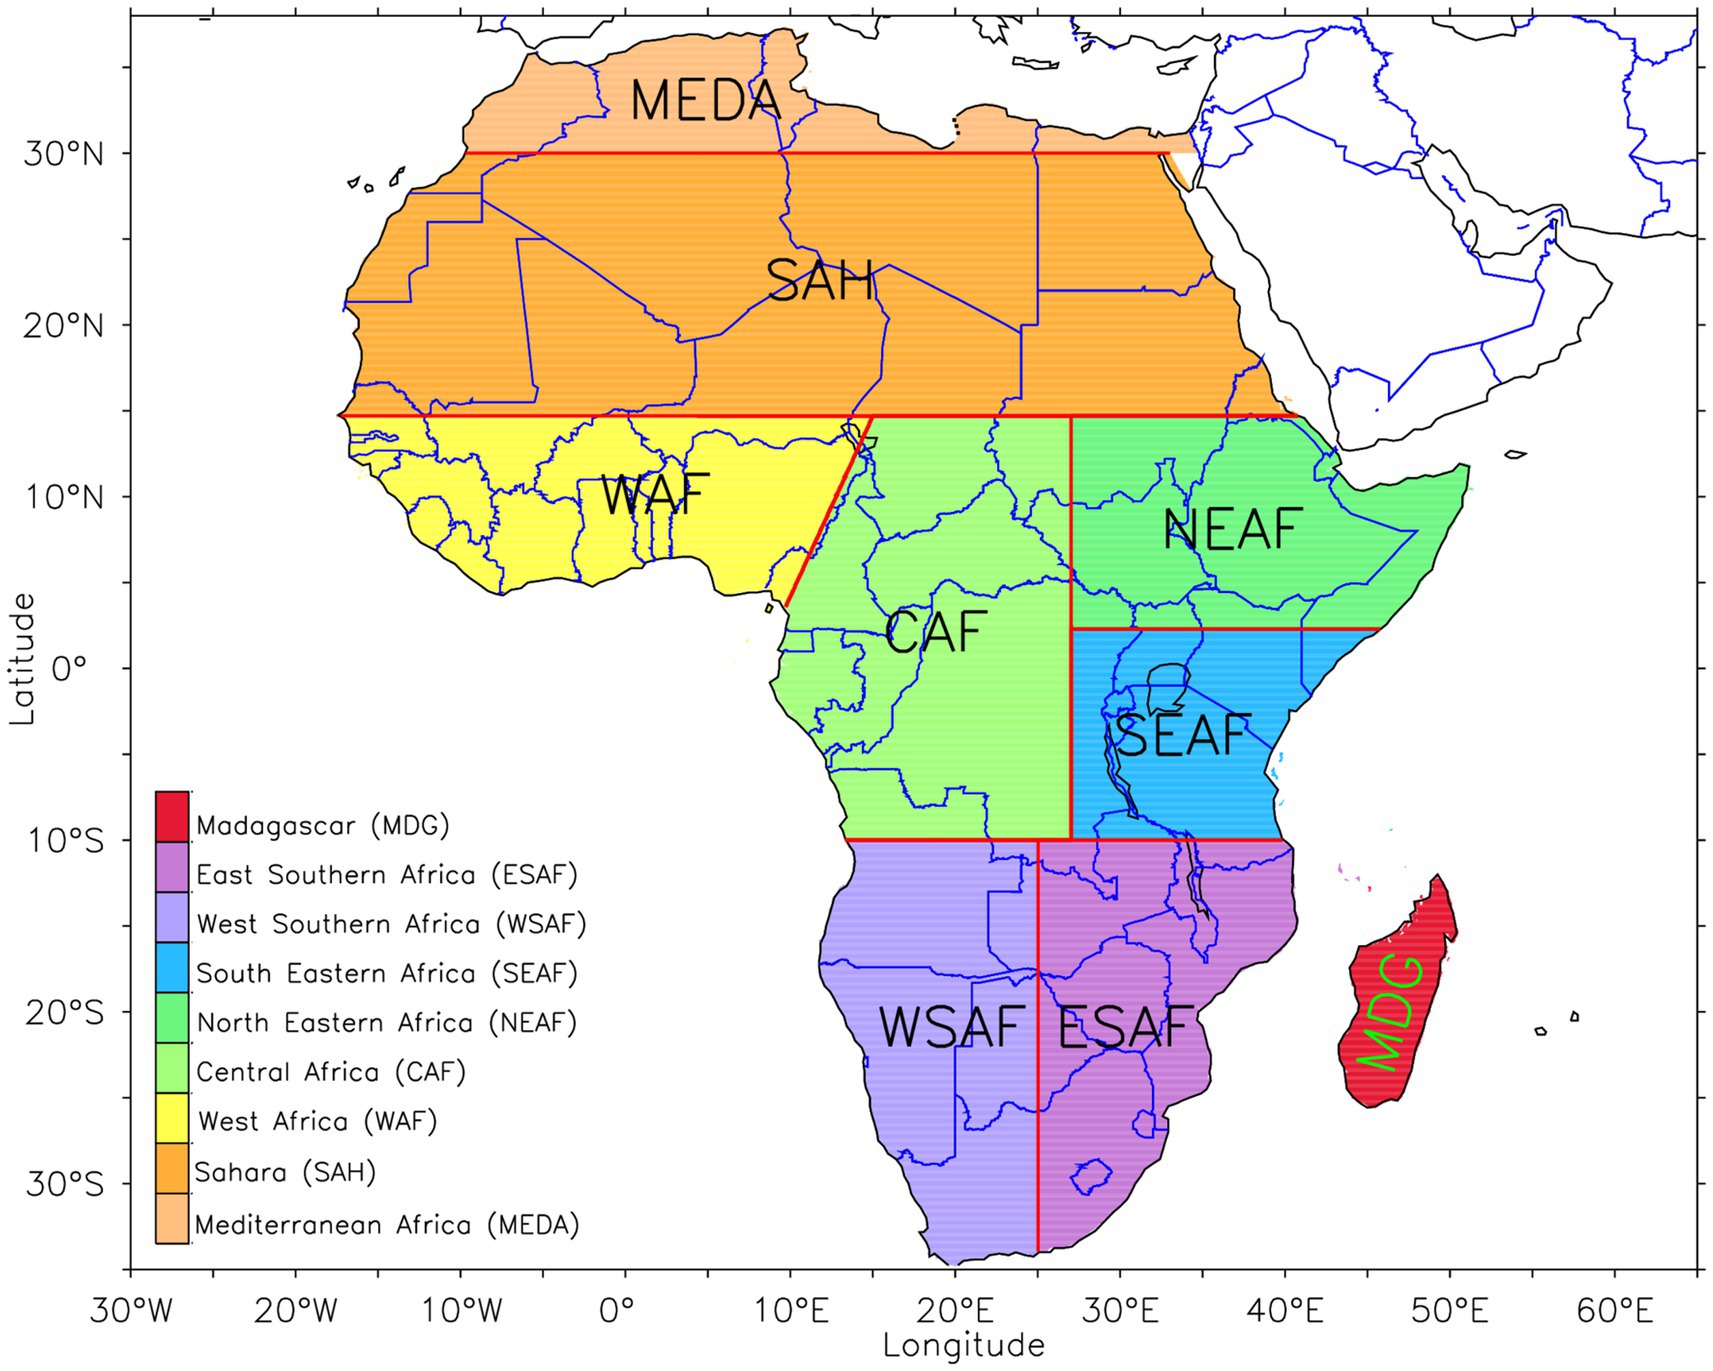
Figure 1. Africa’s domain showing the IPCC AR6 climate reference regions (red line) for Africa used in this Study: Mediterranean Africa (MEDA), Sahara (SAH), West Africa (WAF), Central Africa (CAF), North Eastern Africa (NEAF), South Eastern Africa (SEAF), West Southern Africa (WSAF), East Southern Africa (ESAF), and Madagascar (MAD).
We used the ensemble means to display the projected changes in the magnitude of extreme temperature and precipitation indices. We assessed the level of agreement in the projected changes by identifying all grid cells with at least 80% (16 over 20) of all ensemble members that agree on the sign or direction of the projected mean change. Based on Cheng et al. (2019), we derived the mean efficacy of SAI to offset the effects of increased GHGs (RCP8.5 impacts) using Equation 1 as follows:
When efficacy is less than −1, that means that SAI could offset the projected impacts of RCP8.5 relative to the baseline (BASE) beyond what is necessary, while an efficacy value greater than −1 indicates that SAI could exacerbate the projected impacts of RCP8.5 relative to the baseline (BASE). Overall, the efficacy shows how well SAI could compensate for the effect of elevated GHG (RCP8.5) relative to the baseline.
3 Results
3.1 Projected changes in mean and extreme temperatures and precipitation over Africa
3.1.1 Projected changes in mean and extreme temperatures
When efficacy is less than −1, that means that SAI could offset the projected impacts of RCP8.5 relative to the baseline (BASE) beyond what is necessary, while an efficacy value greater than −1 indicates that SAI could exacerbate the projected impacts of RCP8.5 relative to the baseline (BASE). Overall the efficacy shows how well SAI could compensate for the effect of elevated GHG (RCP8.5) relative to the baseline. Figures 2a–c, A-X depicts the projected changes in annual mean and extreme temperature indices across Africa under a high-emission scenario (RCP8.5) with and without SAI. The projected changes in annual mean and extreme temperature indices in the future (2075–2095) under the RCP8.5 scenario without SAI relative to the base (CTRL-BASE) show an increase in the frequency and magnitude of warm extremes while extreme cold temperatures are projected to decrease (Figures 2b,f,j,n,r,v). Notably, a more pronounced increase (+4 to +6 °C) in the annual coldest (TNN) and hottest (TXX) day temperatures is projected over northern and southern Africa compared to the western and central parts (up to 2 °C) of the continent (Figures 2f,j). Most parts of Africa are projected to experience about a 50% increase in the frequency of days with elevated diurnal temperatures (TX90P, Figure 2r). While extreme temperatures are projected to increase continent-wide, a substantial prolongation of extremely hot temperature events, as evidenced by an increase in the warm spell duration index (WSDI), is projected predominantly over northwestern, eastern, and parts of southern African sub-regions, as well as Madagascar. Despite the general warming projected across Africa and the strong level of agreement across the simulations on the projected warming, regions across the continent are projected to warm differently (Figure 2). These findings suggest that different areas across Africa may experience varying levels of warming, resulting in different levels of exposure and vulnerability to increased temperatures and associated extremes. These indicate a significant spatial heterogeneity in the projected spatial distribution of mean and extreme temperature indices across Africa (Ojara et al., 2021).
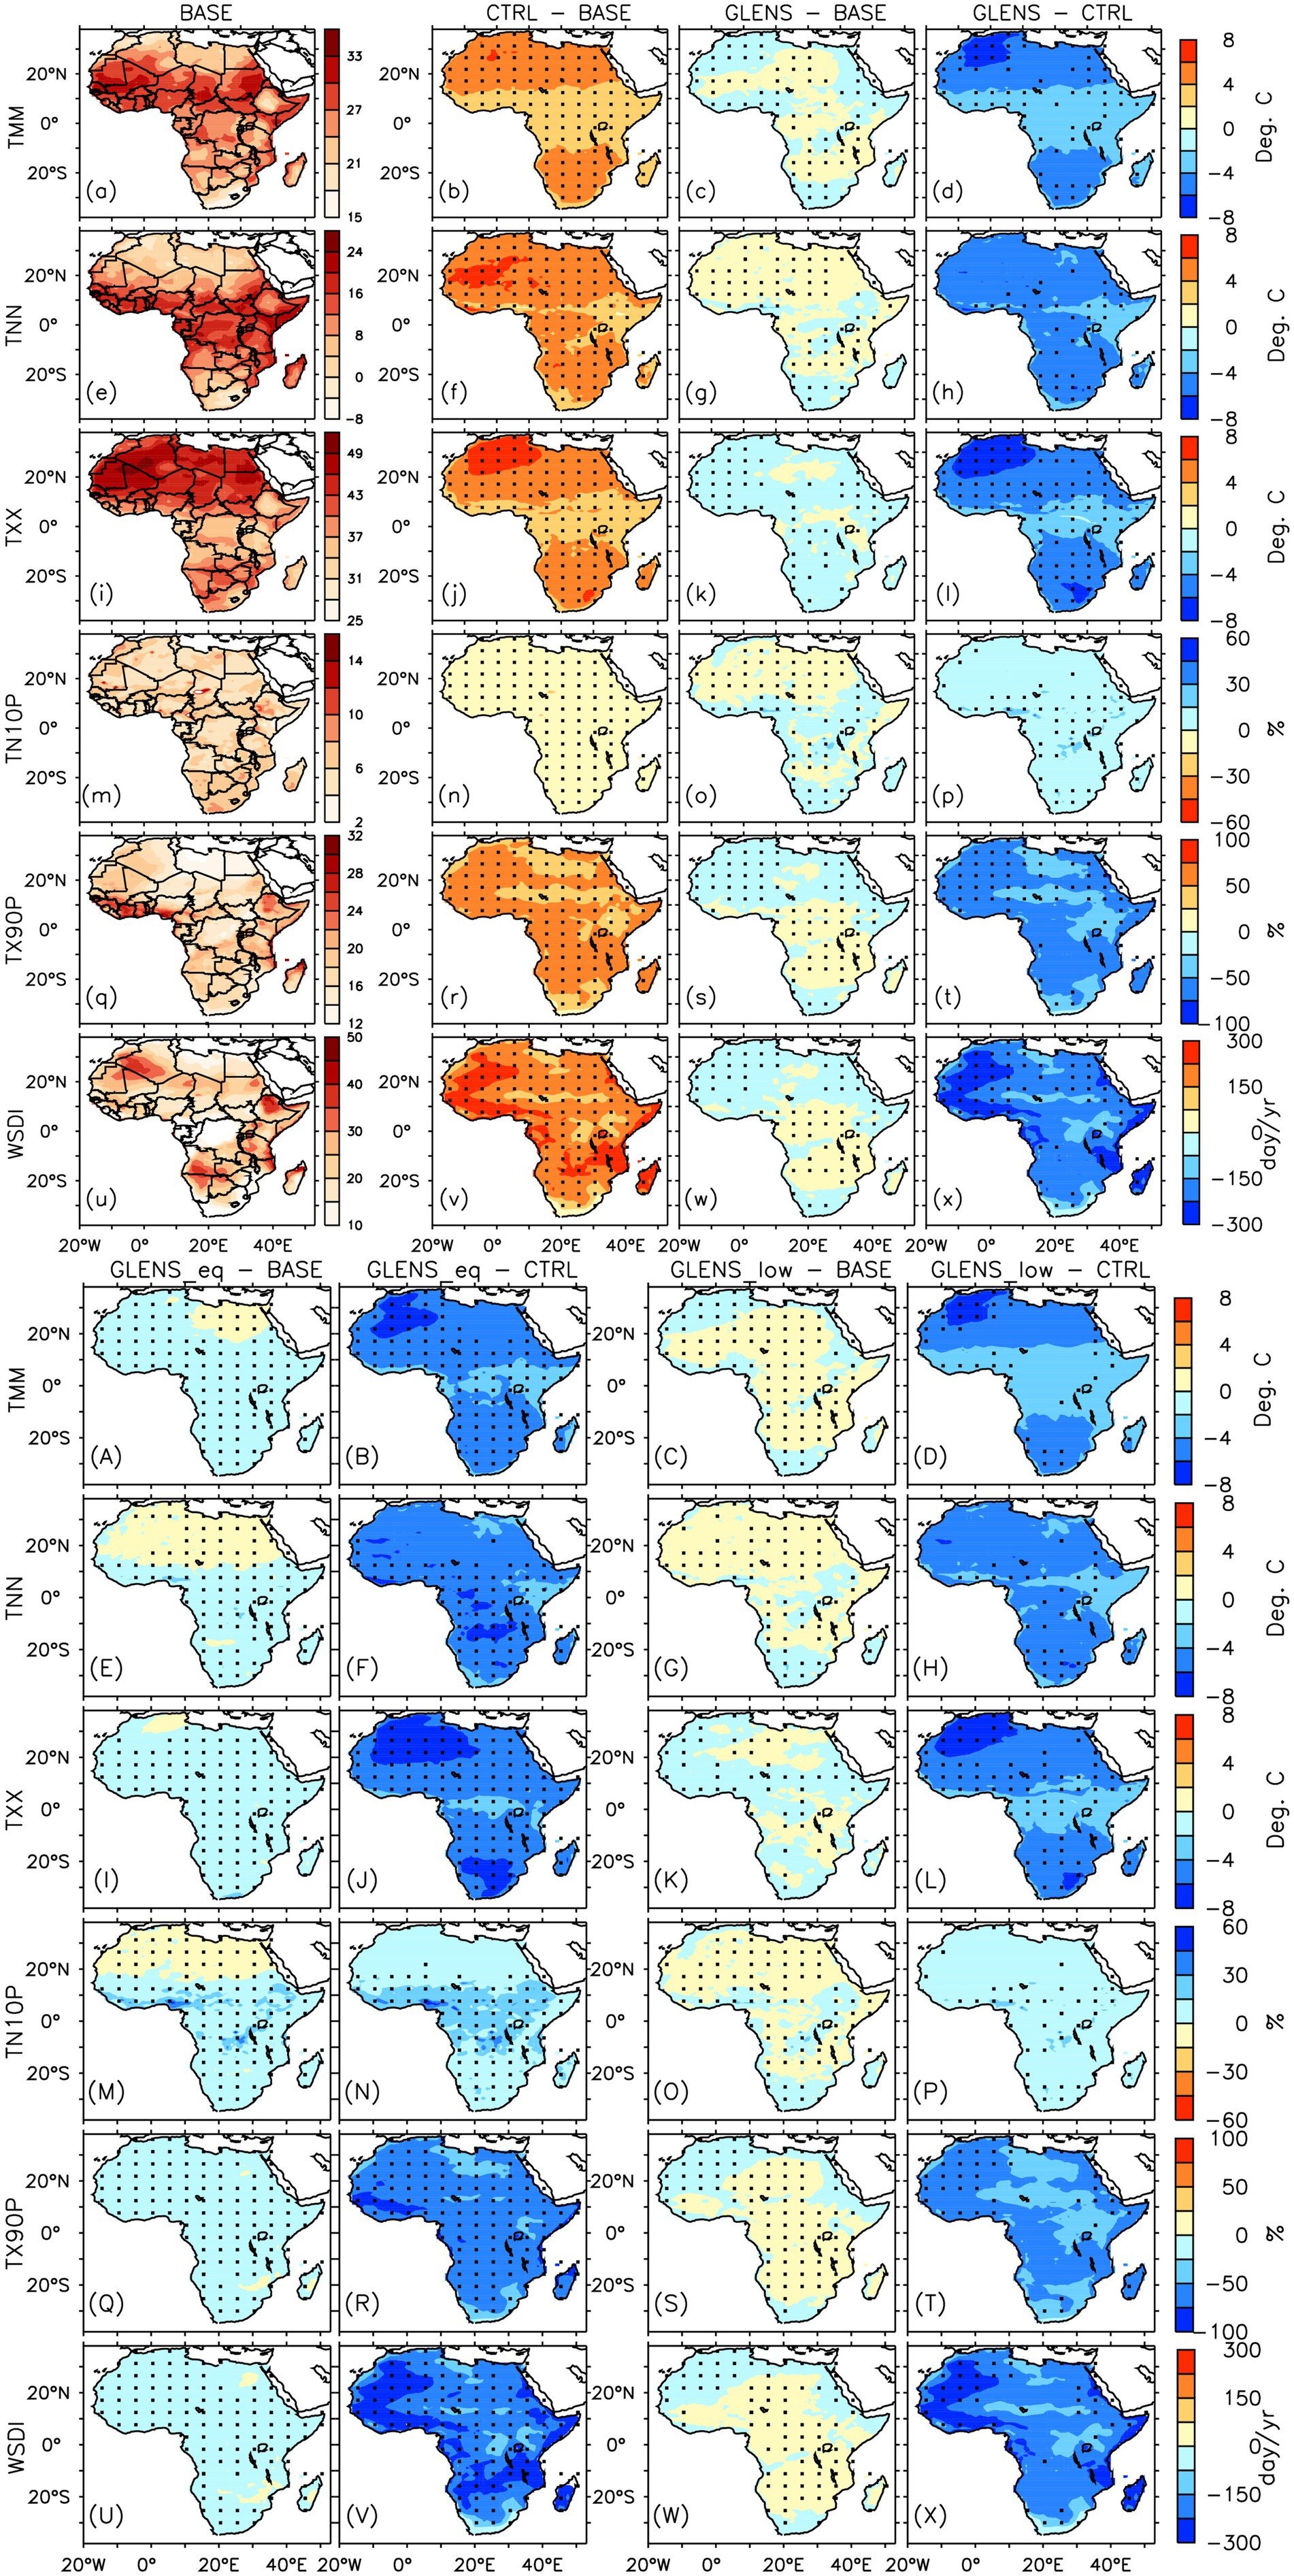
Figure 2. Mean annual spatial distribution of (a–x and A–X) mean and extreme temperature indices over Africa for the baseline period (or BASE: 2010–2030) and their projected changes in the future (2075-2095) under the RCP8.5 scenario without SAI (CTRL–BASE) and with SAI (GLENS – BASE, GLENS_eq–BASE, and GLENS_low–BASE). How each SAI experiment could influence the impacts of global warming on mean and extreme temperature indices in the future is represented in GLENS–CTRL, GLENS_eq–CTRL, and GLENS_low–CTRL. The points ‘.’ Indicate where at least 80% (16 out of 20 members) of the simulations used to calculate CTRL–BASE and GLENS – BASE, and all (3 out of 3 members) used in calculating GLENS_eq–BASE and GLENS_low–BASE, agree on the sign of the changes. On the other hand, the points ‘.’ On GLENS–CTRL, GLENS_eq–CTRL, and GLENS_low–CTRL indicate where SAI is over-effective in compensating for the influence of global warming relative to the baseline (BASE).
SAI could induce widespread cooling across Africa in the future (2075–2095) under all SAI scenarios (GLENS, GLENS_eq, and GLENS_low) relative to the baseline (BASE: 2010–2030), characterised by a notable decrease in hot temperature extremes and an increase in cold temperature extreme indices across most parts of the continent (Figure 2). Consequently, all SAI scenarios considered in this study are projected to cause a decrease in TMM, TNN, and TXX by up to −2 °C, TX90P by up to −25%, WSDI by up to −75 days/year, and an increase in TN10P between 15 and 30% across the continent relative to BASE. Although all SAI scenarios are projected to generally offset the RCP8.5-induced warming, extended regions across the continent could experience slight residual warming relative to the BASE. This indicates that the SAI approaches considered here could only partially offset (undercompensate) the RCP8.5-projected increase in TMM, TNN, TXX, TX90P, and WSDI and decrease in TN10P (Figure 2) as indicated by the spatial efficacy presented in Figure 3. GLENS is over-effective in offsetting the projected increase in TMM, TXX, TX90P, and WSDI over parts of Northern and Southern, East, and West Africa by reversing the projected increase under RCP8.5 as shown in Figures 2d,l,t,x, depicting the changes relative to CTRL with an SAI efficacy of about −2 (Figures 3a,g,m,p). Concurrently, despite the overarching cooling effect associated with this SAI deployment experiment, in parts of Central and Southern Africa, it could only partially offset (under-effective) the RCP8.5 projected increase in these indices, resulting in a slight increase (decrease) in hot (cold) extreme indices (Figures 2, 3). Similar results are reported under the lower stratospheric SO2 injection (GLENS_low), which shows limited effectiveness in offsetting the projected warming under RCP8.5 over wider regions across the continent (Figures 2, 3). On the other hand, the equatorial injection of SO2 (GLENS_eq) could be the most effective experiment in offsetting the projected warming under RCP8.5. The GLENS_eq experiment could offset beyond necessary (over-effectiveness) the RCP8.5 increase in hot and decrease in cold temperature extremes over Africa, except over parts of the Sahel and north Africa for TNN and TN10P and localised areas in north Africa for TMM and TXX where it could be under-effective (Figures 2, 3). However, the GLENS_eq projected overcooling could result from the design of this scenario, which required more SO2 injection to achieve a single temperature target (T0, global mean temperature) than GLENS (Kravitz et al., 2019).
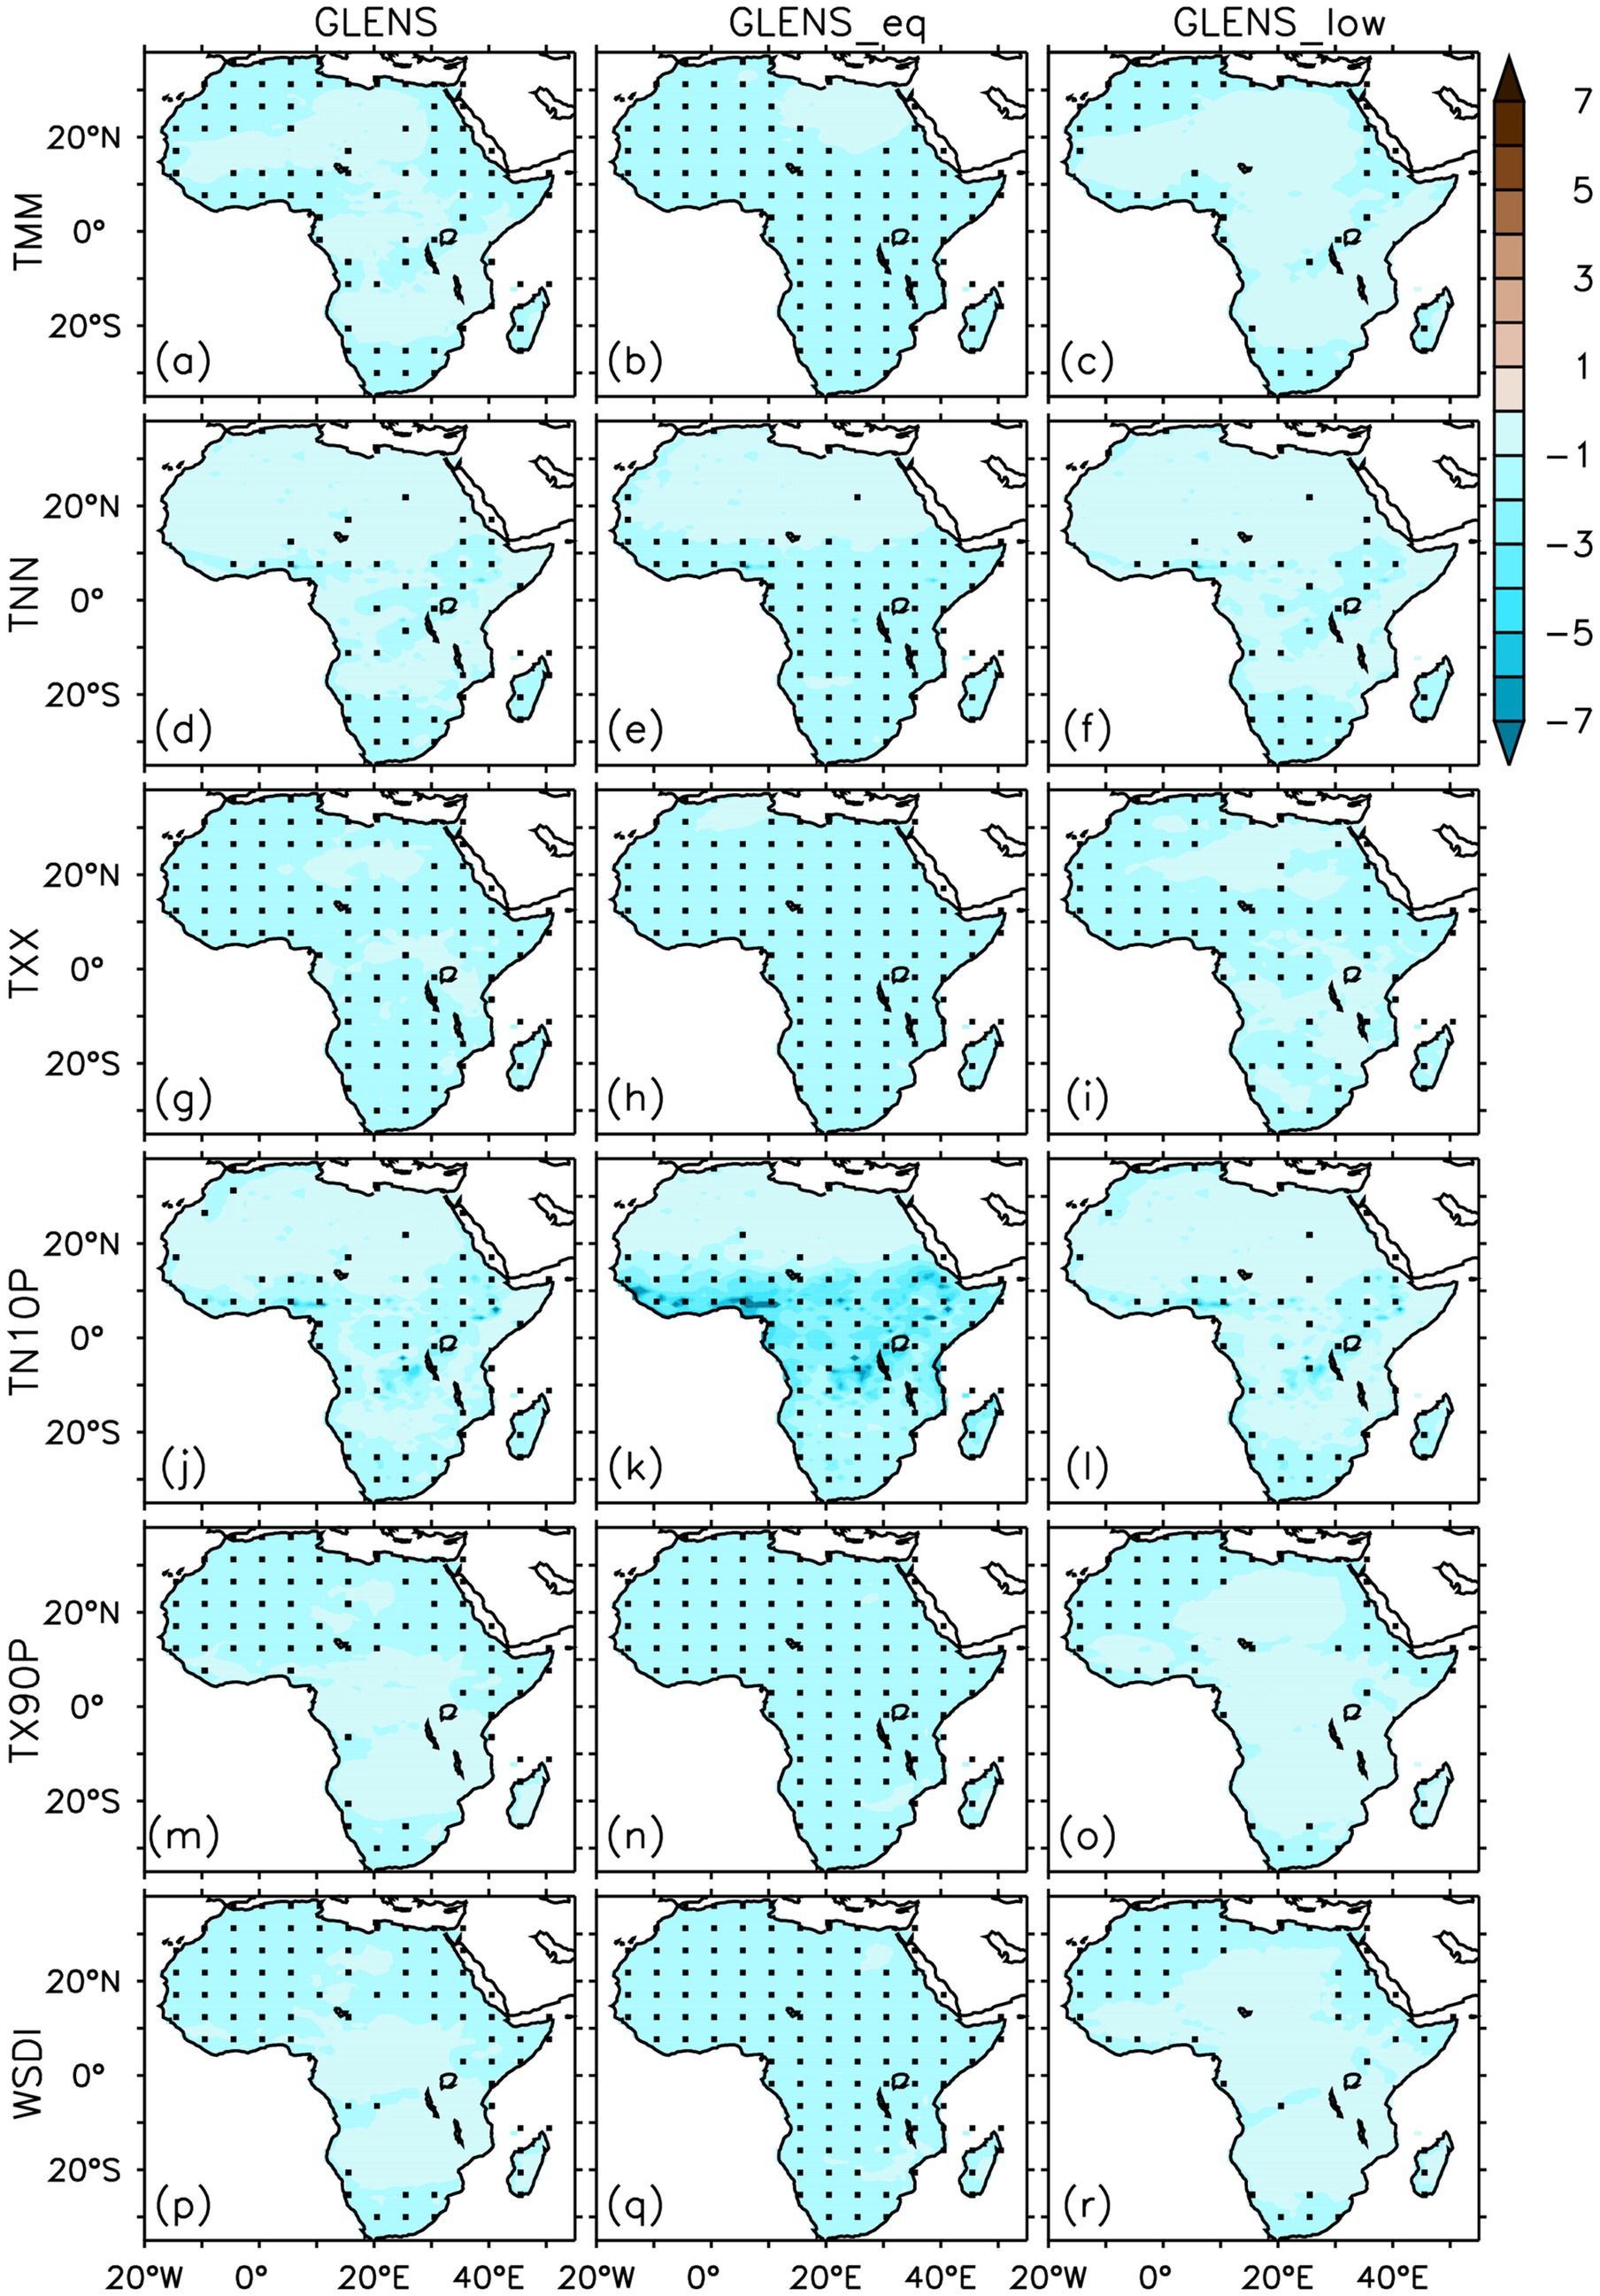
Figure 3. Spatial distribution of (a-r) mean efficacy of all SAI experiments (GLENS, GLENS_eq, and GLENS_low) to compensate for the influence of global warming relative to the baseline (BASE) over Africa for mean and extreme temperature indices. The points ‘.’ indicate the mean efficacy value is less than or equal to -1, characterising grid points where SAI is effective or over-effective.
3.1.2 Projected changes in mean and extreme precipitation
Figures 4b,f,j,n,r,v presents the projected future (2075–2095) changes in extreme precipitation indices under a high-emission scenario (RCP8.5) relative to the baseline (BASE: 2010–2030). Under RCP8.5, all extreme precipitation indices are projected to increase over most of West, Central, and East Africa, and decrease over Southern and North Africa, as well as parts of the Sahel. These precipitation indices (except CDD) are projected to increase the most over East Africa, by over 600 mm year−1 for PRCPTOT, 15 days year−1 for R20MM, 30 mm day−1 for RX1DAY, 45 mm 5-day−1 for RX5DAY, and 250 mm year−1 for R99P. Consecutive dry days (CDD) are projected to decrease across Africa in line with an increase in precipitation indices. The highest decline in CDD is projected over the Sahel, extending from 20°N to 30°N. At the same time, parts of Southern Africa, Mediterranean Africa, and Madagascar could experience increased CDD (Figure 4B), which is consistent with the projected decrease in precipitation and associated extremes over these regions (Figure 5). This finding aligns with the results of Engelbrecht et al. (2024), who reported increased drying projected over parts of Southern Africa under global warming.
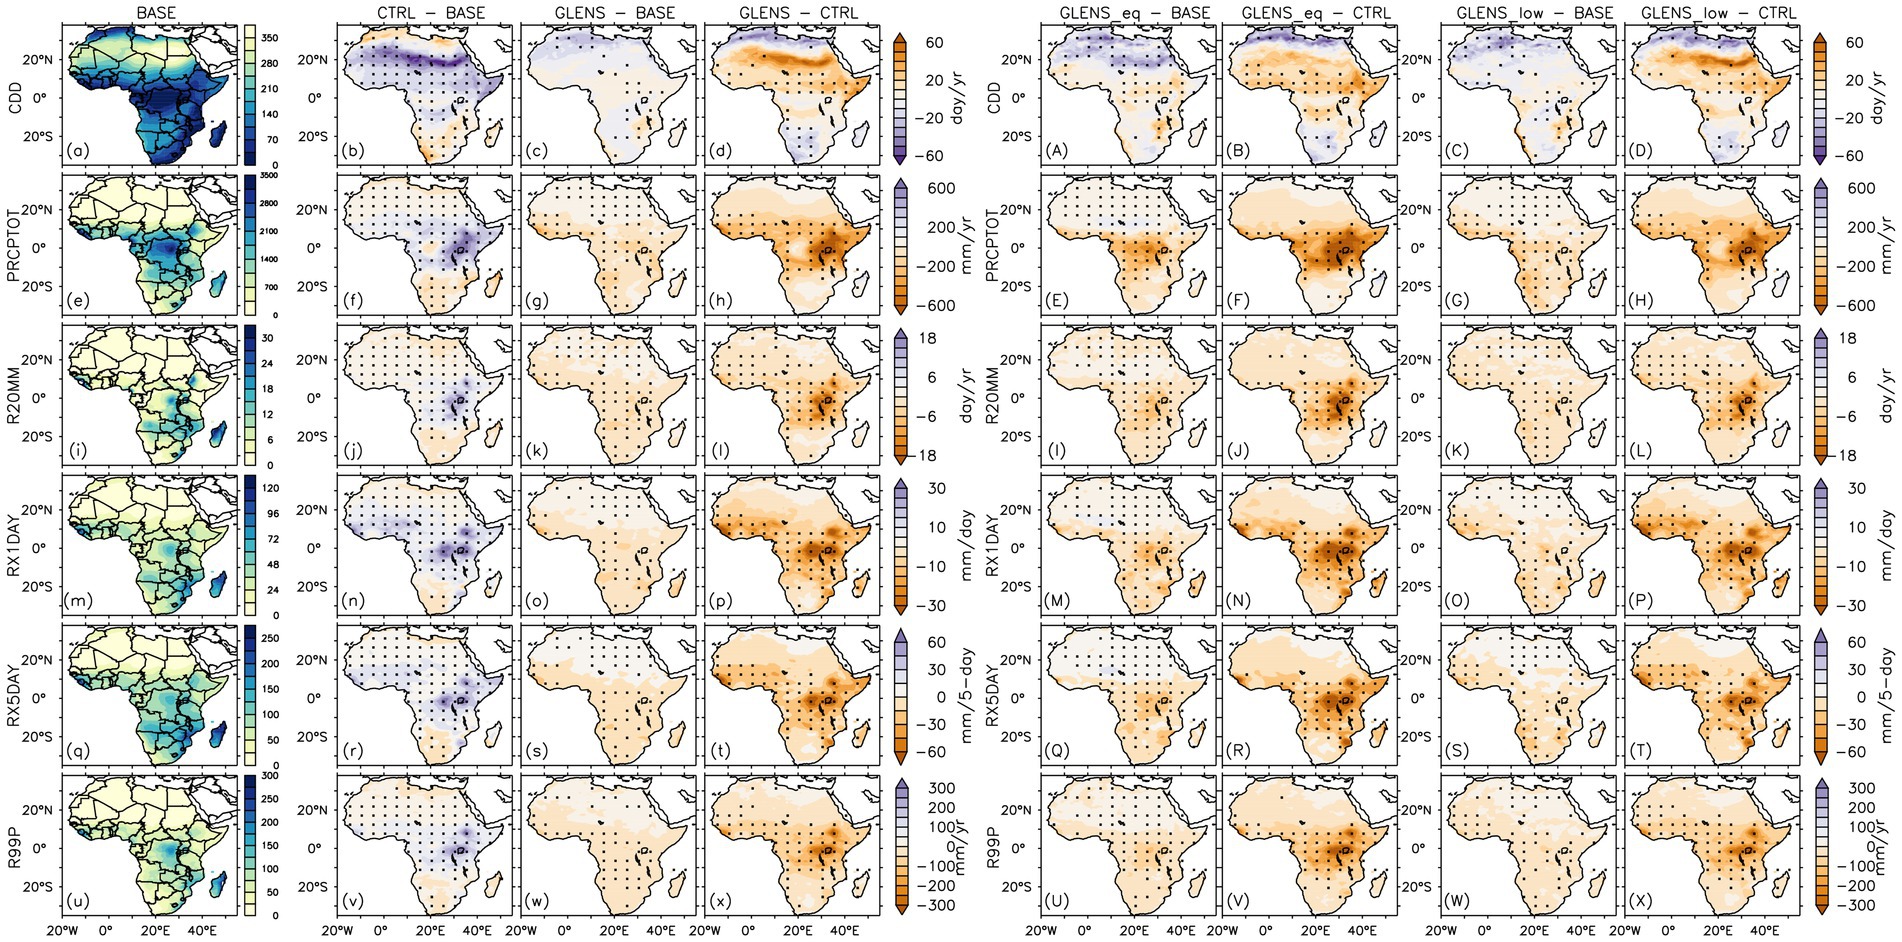
Figure 4. Mean annual spatial distribution of (a-x and A-X) mean and extreme precipitation indices over Africa for the baseline period (or BASE: 2010 -2030) and their projected changes in the future (2075–2095) under the RCP8.5 scenario without SAI (CTRL–BASE) and with SAI (GLENS – BASE, GLENS_eq–BASE, and GLENS_low–BASE). How each SAI experiment could influence the impacts of global warming on mean and extreme temperature indices in the future is represented in GLENS–CTRL, GLENS_eq–CTRL, and GLENS_low–CTRL. The points `.’ Indicate where at least 80% (16 out of 20 members) of the simulations used to calculate CTRL–BASE and GLENS – BASE, and all (3 out of 3 members) used in calculating GLENS_eq–BASE and GLENS_low -BASE, agree on the sign of the changes. On the other hand, the points`.’ On GLENS–CTRL, GLENS_eq–CTRL, and GLENS_low–CTRL indicate where SAI is over-effective in compensating for the influence of global warming relative to the baseline (BASE).
Figures 4c,d,g,h,k,l,o,p,s,t,w,x, A–X show the influence of SAI on the projected changes in extreme precipitation indices. The patterns suggest that all SAI experiments (GLENS, GLENS_eq, and GLENS_low) could induce more drying across the continent in the future (2075–2095) by offsetting the projected increase and exacerbating the projected decrease in precipitation across the continent under RCP8.5. There is a strong consensus across the simulations regarding the projected drying across the continent (Figure 4). The projected SAI-induced drying is characterised by an exacerbated decrease in precipitation indices (except CDD) over parts of Southern and North Africa and Madagascar and by the reversal of the projected increase in these indices over most of West, Central, and East Africa. In these regions, SAI could overcompensate the projected increase under RCP8.5 by decreasing PRCPTOT by up to −600 mm year−1, R20MM by up to −15 day year−1, RX1DAY by up to −30 mm day−1, RX5DAY by up to—45 mm 5-day−1, and R99P by up to 250 mm year−1 (Figures 4, 5). The potential of SAI to offset the projected increase in precipitation is more substantial over regions projected to experience the largest precipitation increase under RCP8.5 (Figure 4). The projected SAI efficacy suggests that SAI experiments tend to be generally over-effective in offsetting the projected increase in precipitation indices over the region extending from 15°N to 15°S, but under-effective in influencing the projected changes in precipitation indices over the Sahel and most parts of Southern Africa (Figures 4, 5).
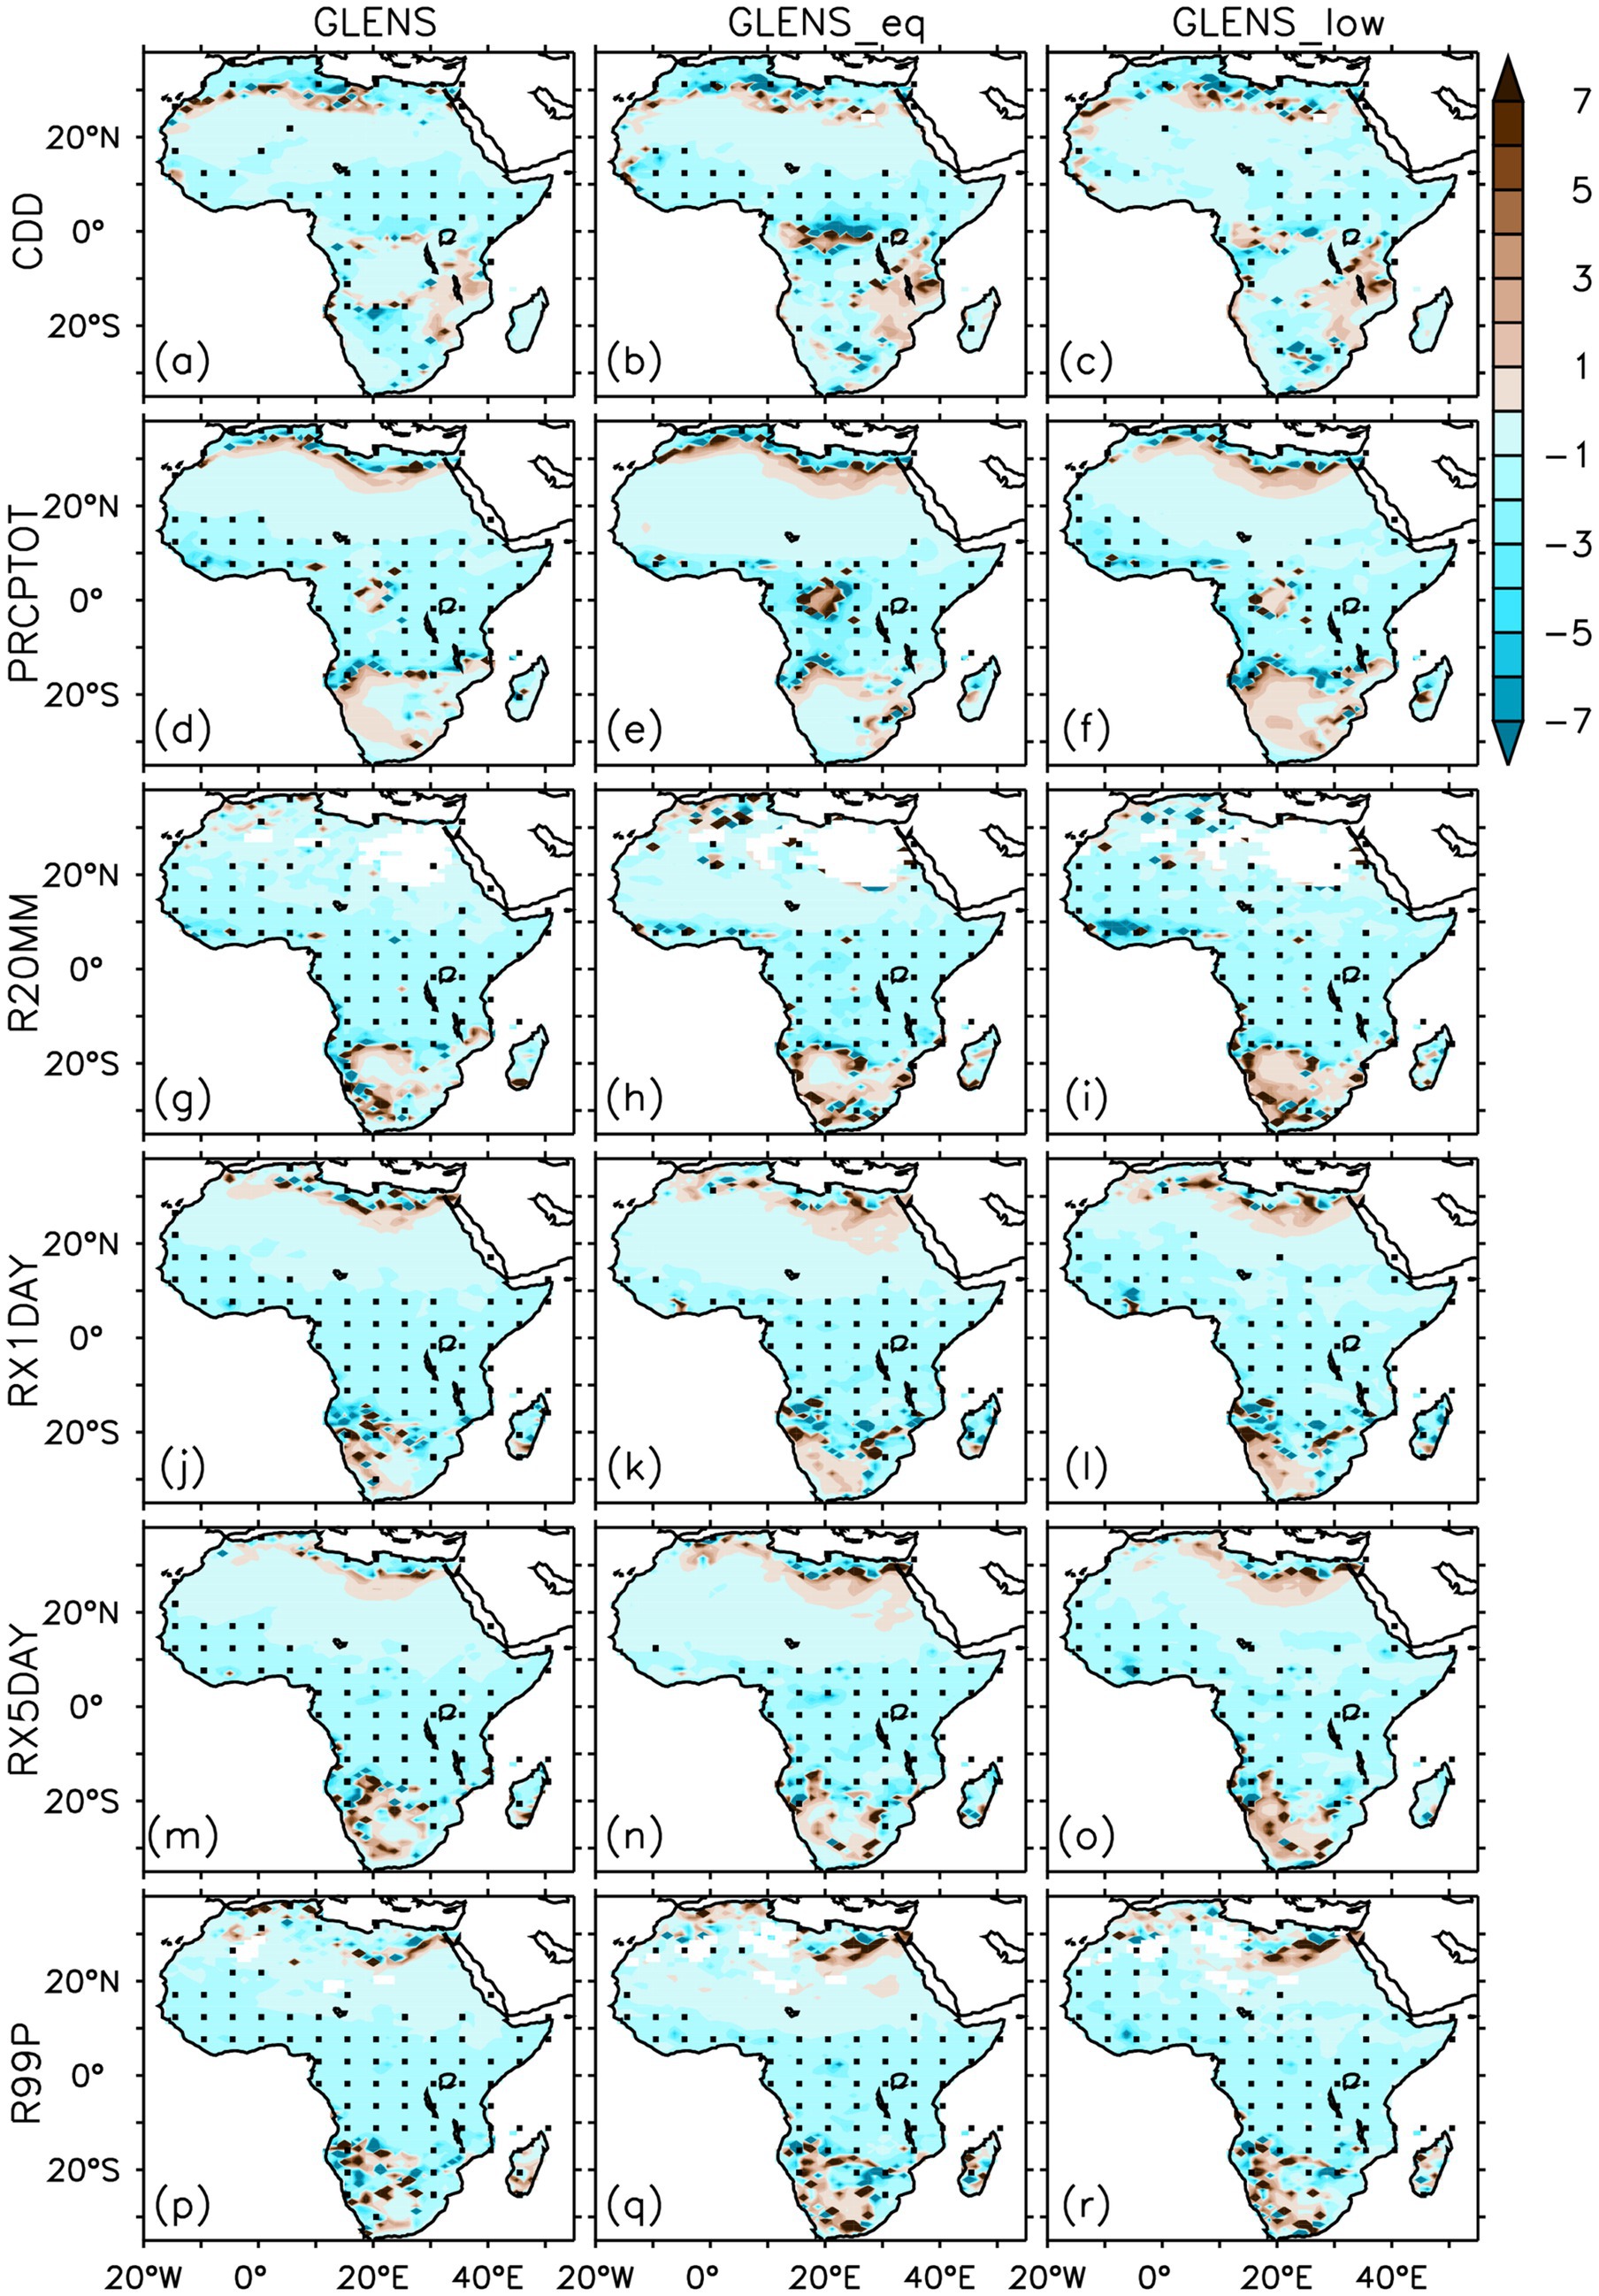
Figure 5. Spatial distribution of (a-r) mean efficacy of all SAI experiments (GLENS, GLENS_eq, and GLENS_low) to compensate for the influence of global warming relative to the baseline (BASE) over Africa for mean and extreme precipitation indices. The points ‘.’ Indicate the mean efficacy value as less than or equal to −1, characterising grid points where SAI is effective or over-effective.
3.2 Projected changes in mean and extreme temperature and precipitation over the climatic zones and countries across Africa
3.2.1 Projected changes in mean and extreme temperatures
The projected changes in mean and extreme temperature indices across Africa’s climatic zones (Figure 1) and countries are presented in Figures 4, 5, respectively. Under the high-end emission scenario (RCP8.5), all climatic zones (Figure 6) and countries (Figure 7) across Africa are projected to experience warming. This projected warming is characterised by an increase in mean temperature and hot extreme indices—between 2 and 6 °C increase in TMM, TNN, and TXX, 30–75% increase in TX90P, and 150–280 days/year for WSDI — and a decrease in the cold extreme index of about 10% for TN10P (Figures 6, 7). Mediterranean Africa (MEDA) and the Sahel (SAH) are projected to warm the most, with the projected increase in TMM, TNN, and TXX exceeding 5 °C in most cases. Similarly, Madagascar and the Sahel are projected to experience the warmest conditions across the continent. Under RCP8.5 Madagascar could experience a rise in extreme temperature event characterised by the highest increase in TX90P (up to 70%) and WSDI (up to 280 days/year), while the Sahel and countries across the Sahel could experience the hottest TMM and TNN (up to 6 °C; Figures 6, 7). On the other hand, TN10P could decrease by about 10% across all climatic zones and countries across the continent. Likewise, all African countries are projected to consistently warm under RCP8.5, although at varying degrees of warming relative to the baseline (BASE), with projected increases in TMM, TNN, TXX, TX90P, and WSDI and decreases in TN10P (Figure 7).
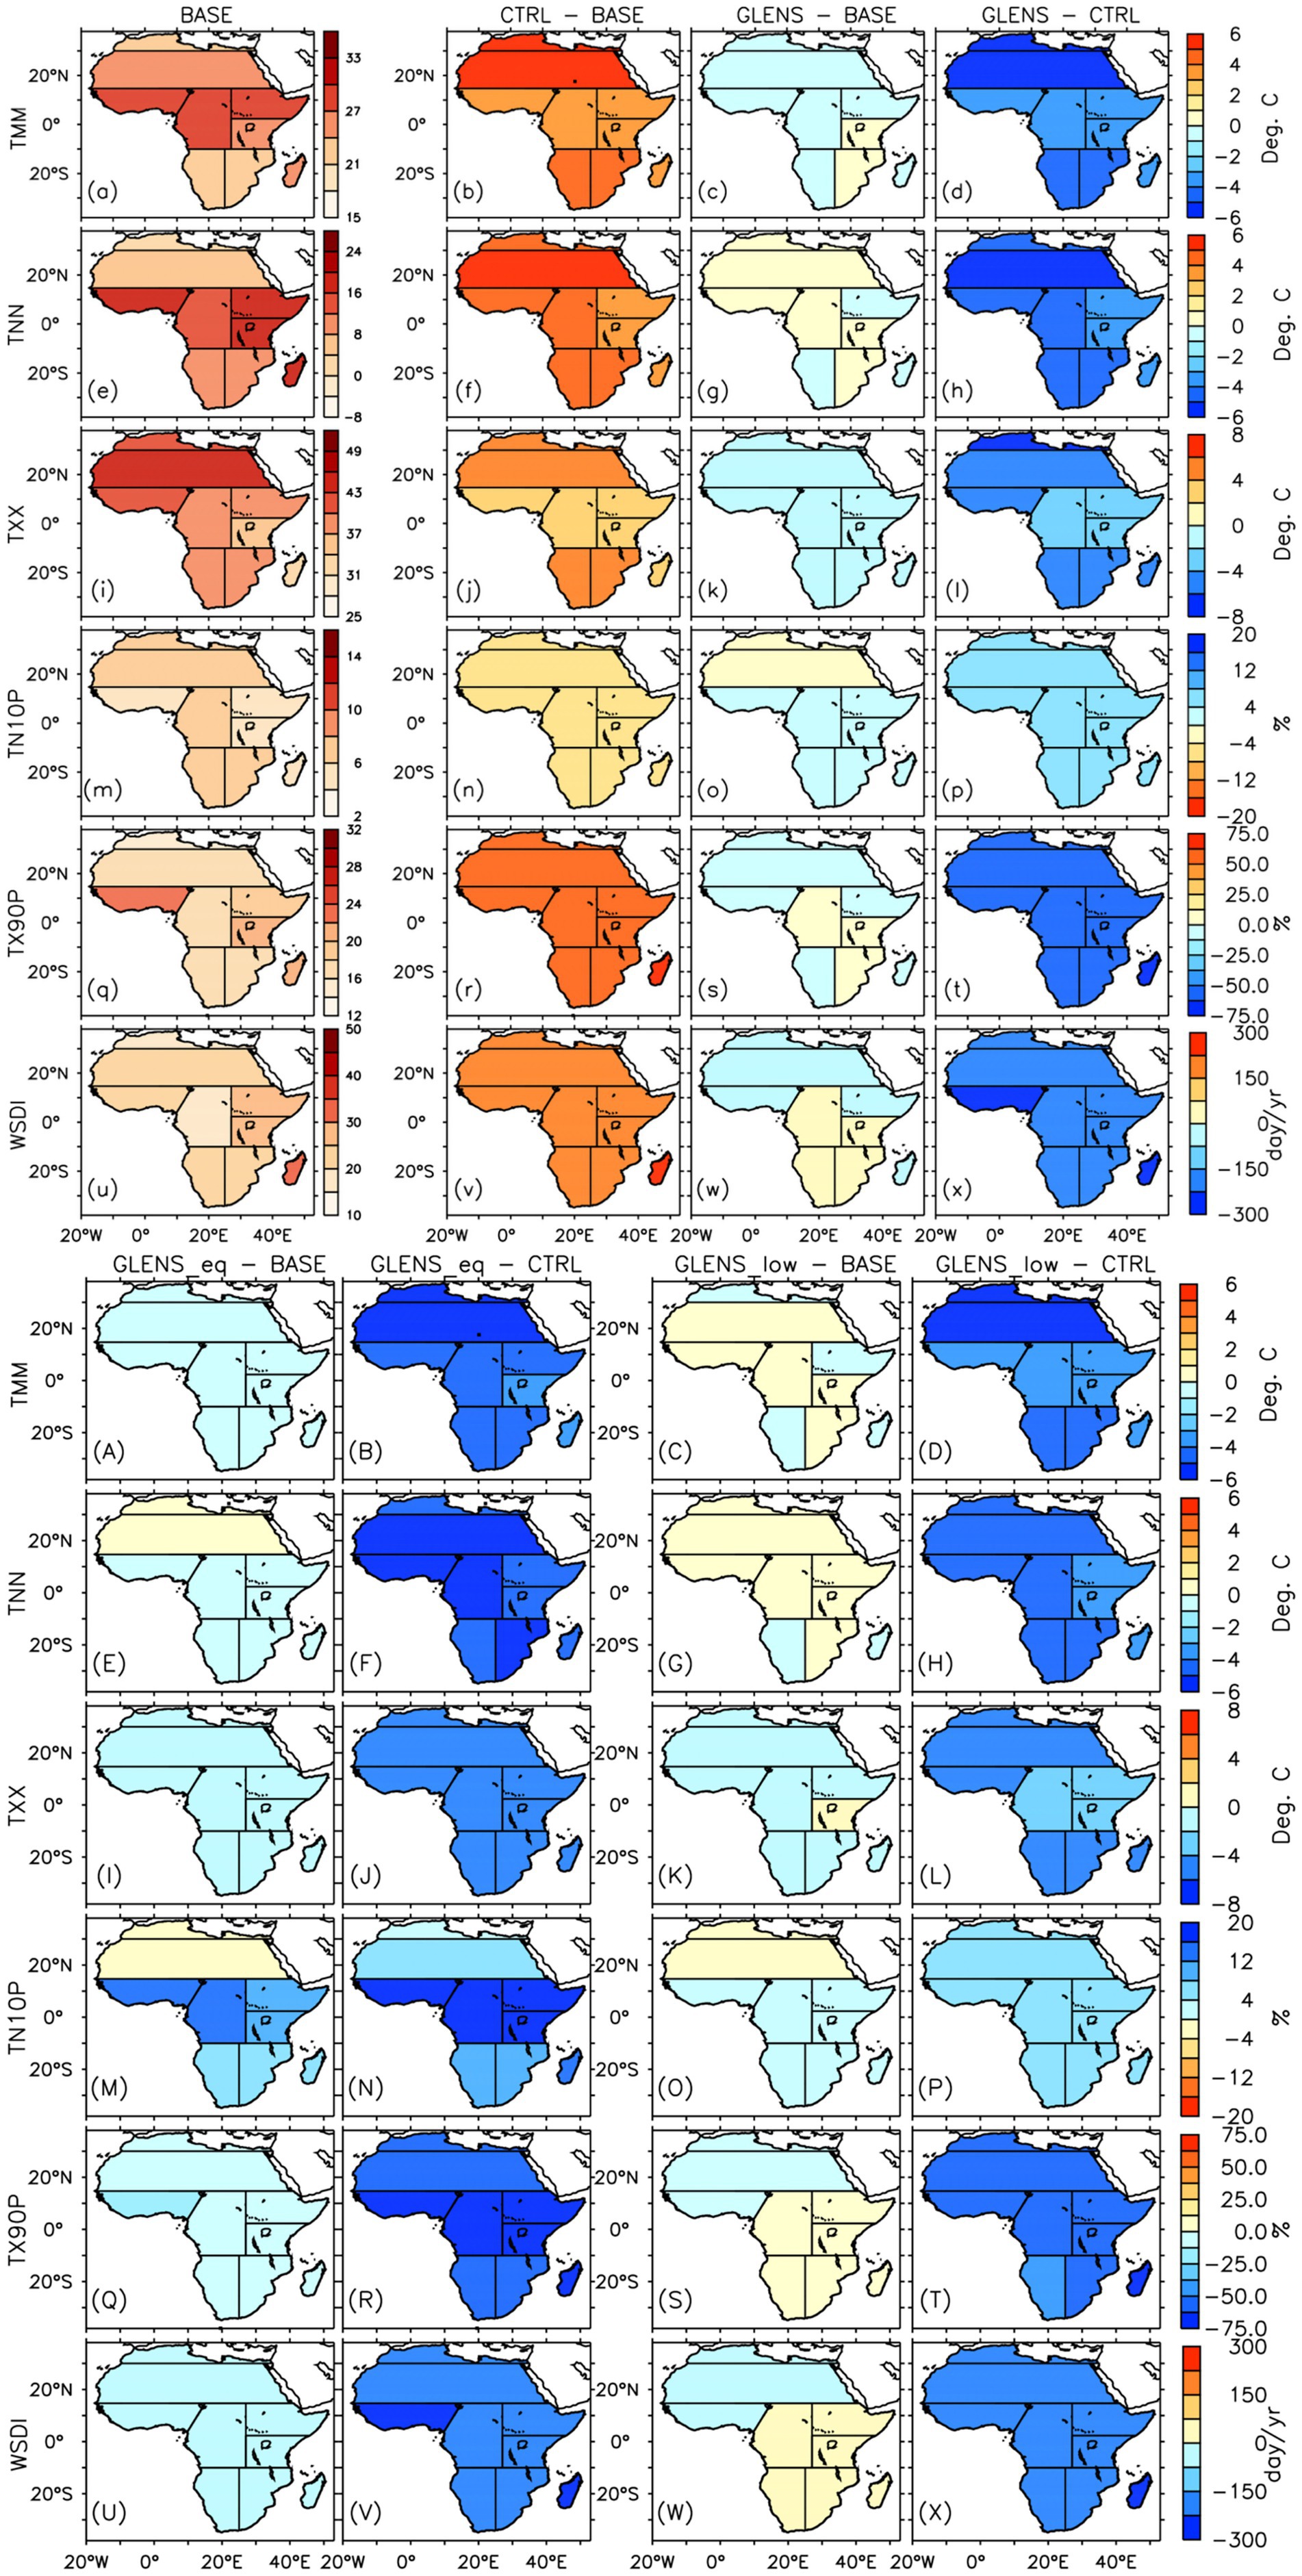
Figure 6. Mean annual of mean and extreme temperature indices over Africa’s climatic (AR6) zones for the baseline period (or BASE: 2010–2030) and their projected changes in the future (2075–2095) under the RCP8.5 scenario without SAI (CTRL–BASE) and with SAI (GLENS–BASE, GLENS_eq–BASE, and GLENS_low–BASE). GLENS–CTRL, GLENS_eq–CTRL, and GLENS_low–CTRL show how each SAI experiment could influence the impacts of global warming on mean and extreme temperature indices over Africa’s climatic zones.
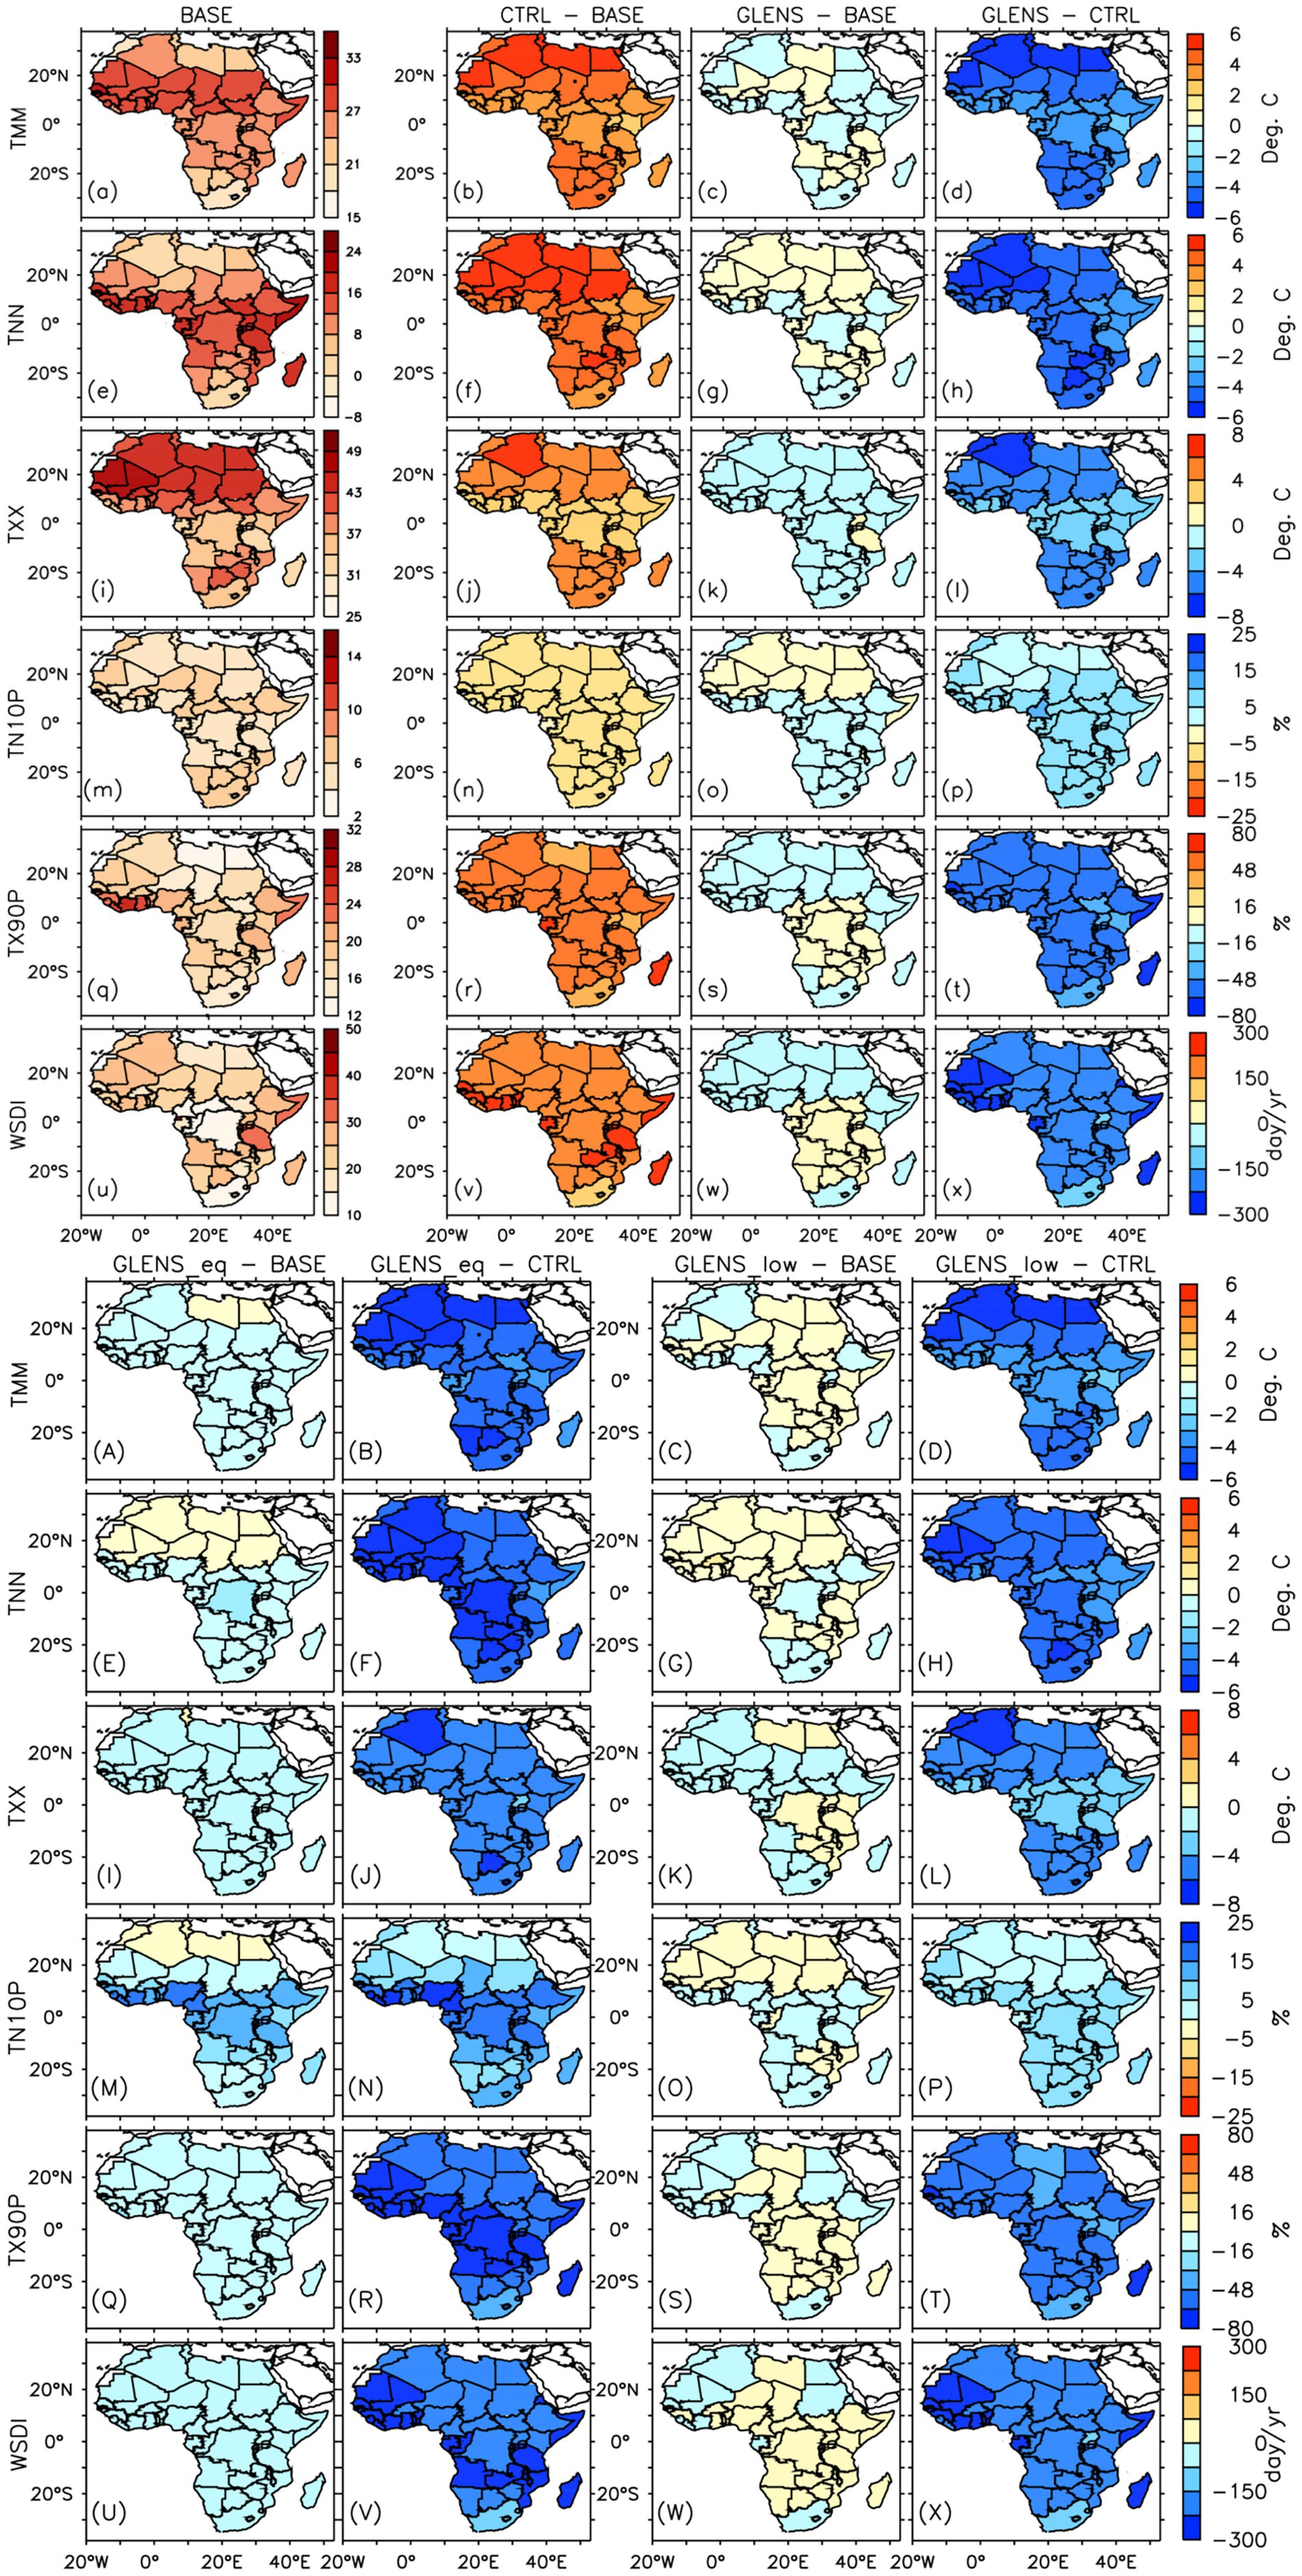
Figure 7. Mean annual of mean and extreme temperature indices across African countries for the baseline period (or BASE: 2010–2030) and their projected changes in the future (2075–2095) under the RCP8.5 scenario without SAI (CTRL–BASE) and with SAI (GLENS–BASE, GLENS_eq–BASE, and GLENS_low–BASE). GLENS–CTRL, GLENS_eq–CTRL, and GLENS_low–CTRL show how each SAI experiment could influence the impacts of global warming on mean and extreme temperature indices over countries in Africa.
The projected changes in mean and extreme temperatures over the climatic zones and countries in Africa show a similar pattern under all SAI scenarios (Figures 6, 7). All SAI experiments tend to offset the RCP8.5-induced warming across all climatic zones and countries across Africa, with GLENS_eq projected to be the most effective in offsetting the warming across most climatic zones and countries (Figures 7, 8). GLENS_eq shows a more consistent effectiveness (mostly over-effective) across most climatic zones and countries on the continent, except in the MEDA and SAH regions, as well as in countries within those regions, where it was under-effective in offsetting the projected warming in TNN and TN10P (Figures 8e, k, E, K). GLENS_eq was, however, under-effective (efficacy > − 1) over Libya and Egypt for TMM (Figure 8B). In contrast, the regional efficacy indicates that GLENS-eq may be over-effective over MEDA and SAH (Figures 8b,B). The GLENS experiment’s effectiveness shows some similarities with GLENS_eq, although GLENS was under-effective over more regions and countries across the continents for all indices except for TXX (Figure 8). On the other hand, of all SAI experiments, GLENSlow was the least effective in compensating for the projected warming over more regions and countries across the continent. Overall, all SAI experiments are ineffective in fully compensating for the RCP8.5-projected increase in TNN and TN10P over MEDA and SAH (Figures 6, 8a–r). Similar results are projected for all North African countries for TNN and TN10P (Figures 7g,h,o,p,E–H,M–P, 8D–F, J–L).
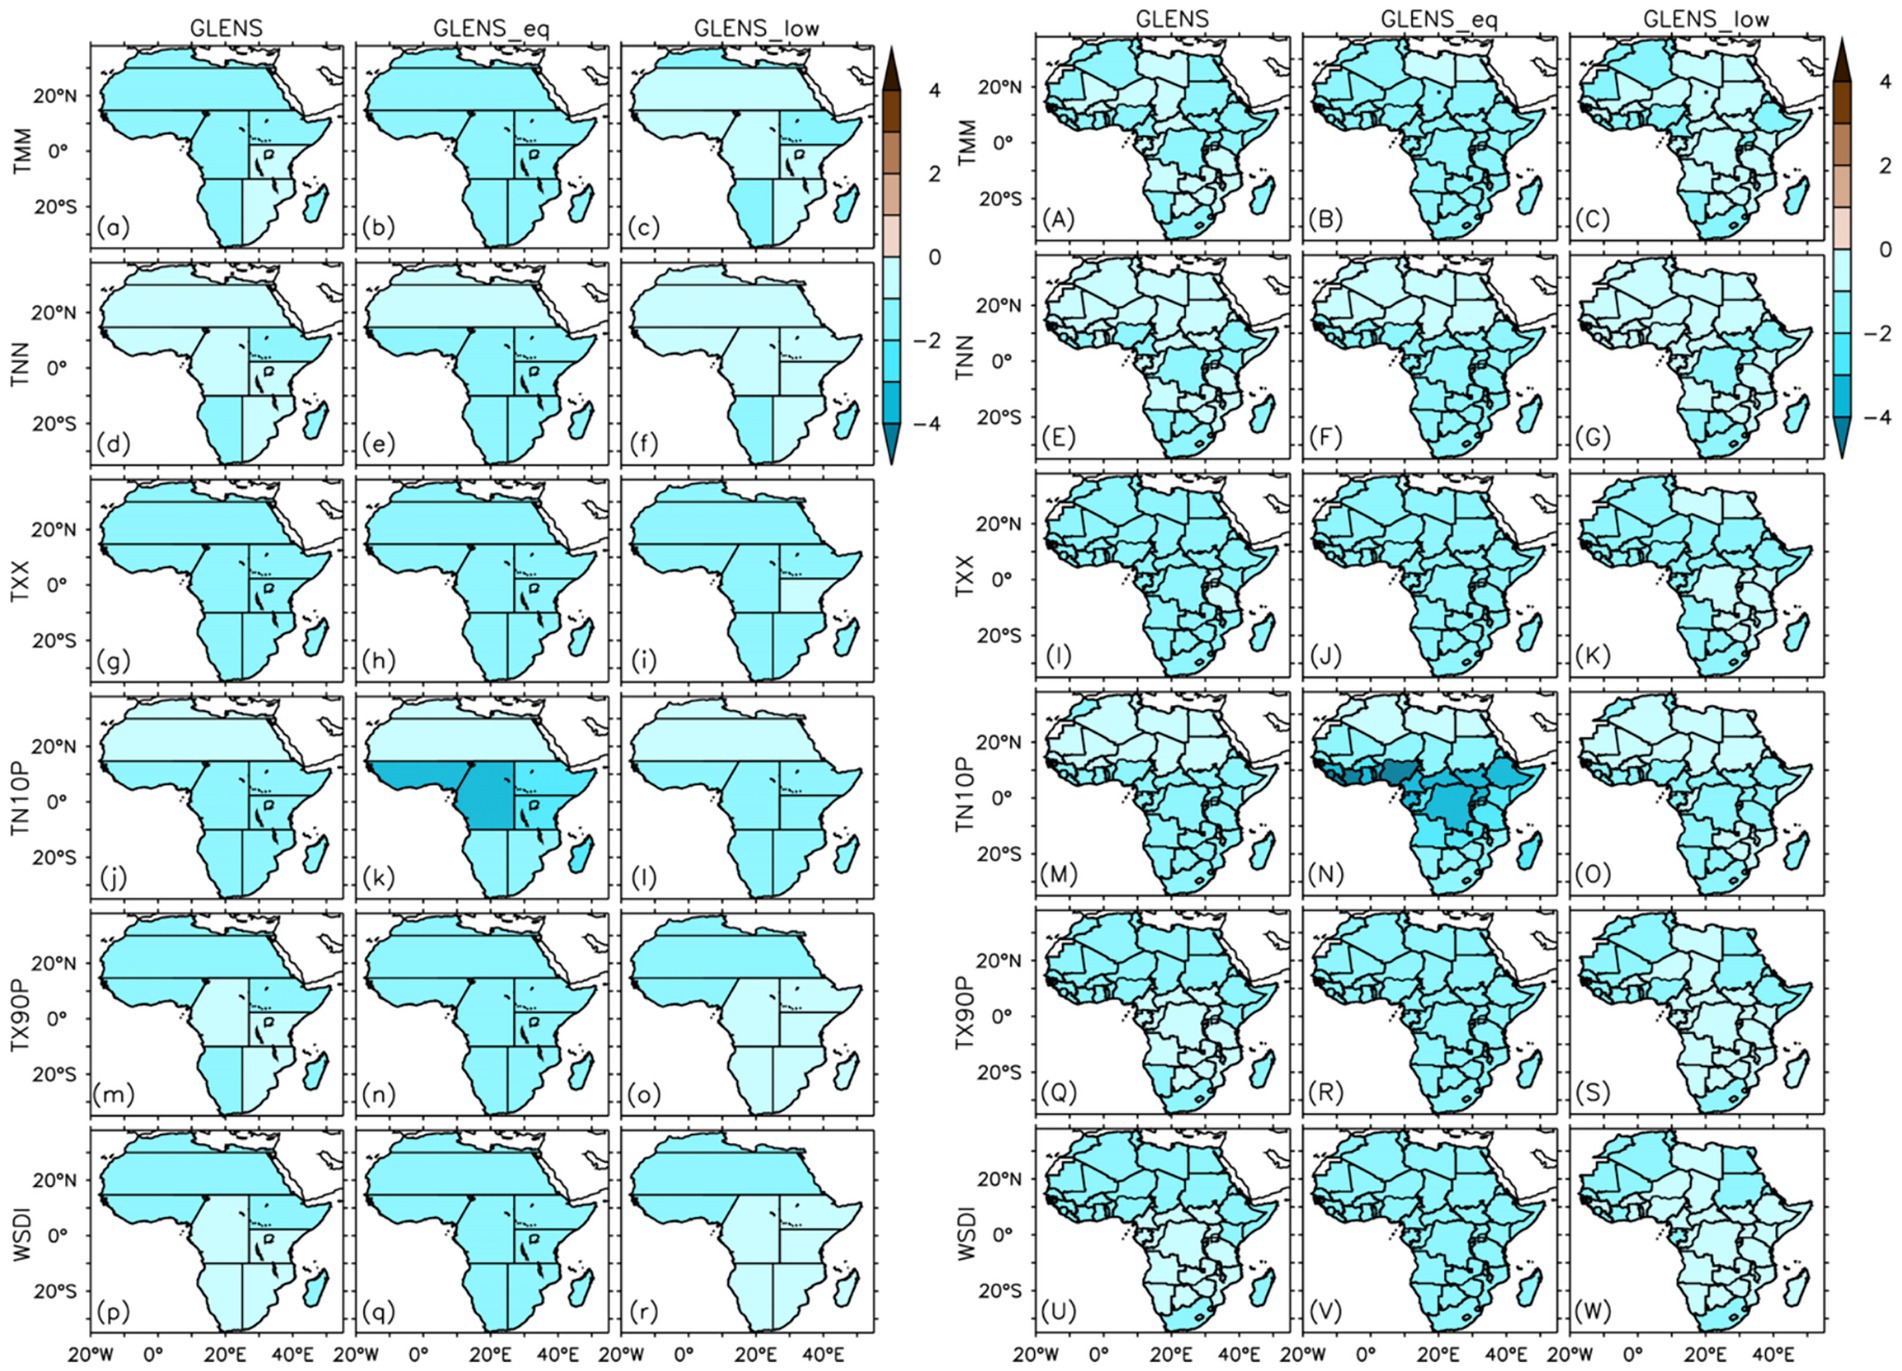
Figure 8. Mean efficacy of SAI experiments to compensate for the influence of global warming relative to the baseline (BASE) over (a–r) Africa’s climatic zones and (A–R) African countries for mean and extreme temperature indices.
3.2.2 Projected changes in mean and extreme precipitation
Figures 9, 10 display the projected changes in mean and extreme precipitation indices over the climate zones and countries in Africa. All precipitation indices (except CDD) are projected to increase across most climatic zones under RCP8.5 (Figures 9b,f,j,n,r,v). These projected increases could reach 300 mm/year for PRCPTOT, 10 days/year for R20MM, 18 mm/year for RX1DAY, 30 mm/5-day for RX5DAY, and 120 mm/year for R99P. However, MDG could experience a decrease of about −150 mm/year in PRCPTOT, −2 mm/day in R20MM, and −20 mm/year in R99P. A slight decrease in PRCPTOT (about −50 mm/year) is also projected over MEDA and WSAF, and in R99P (about −20 mm/year) over MEDA under RCP8.5 (Figure 9F). In contrast to most precipitation indices, CDD is projected to decrease by up to −24 days/year over SAH and NEAF and up to −12 days/year over WAF and −16 days/year over CAF and SEAF, while it is projected to increase over MEDA (12 days/year), WSAF and ESAF (4 days/year), and MDG (8 days/year).
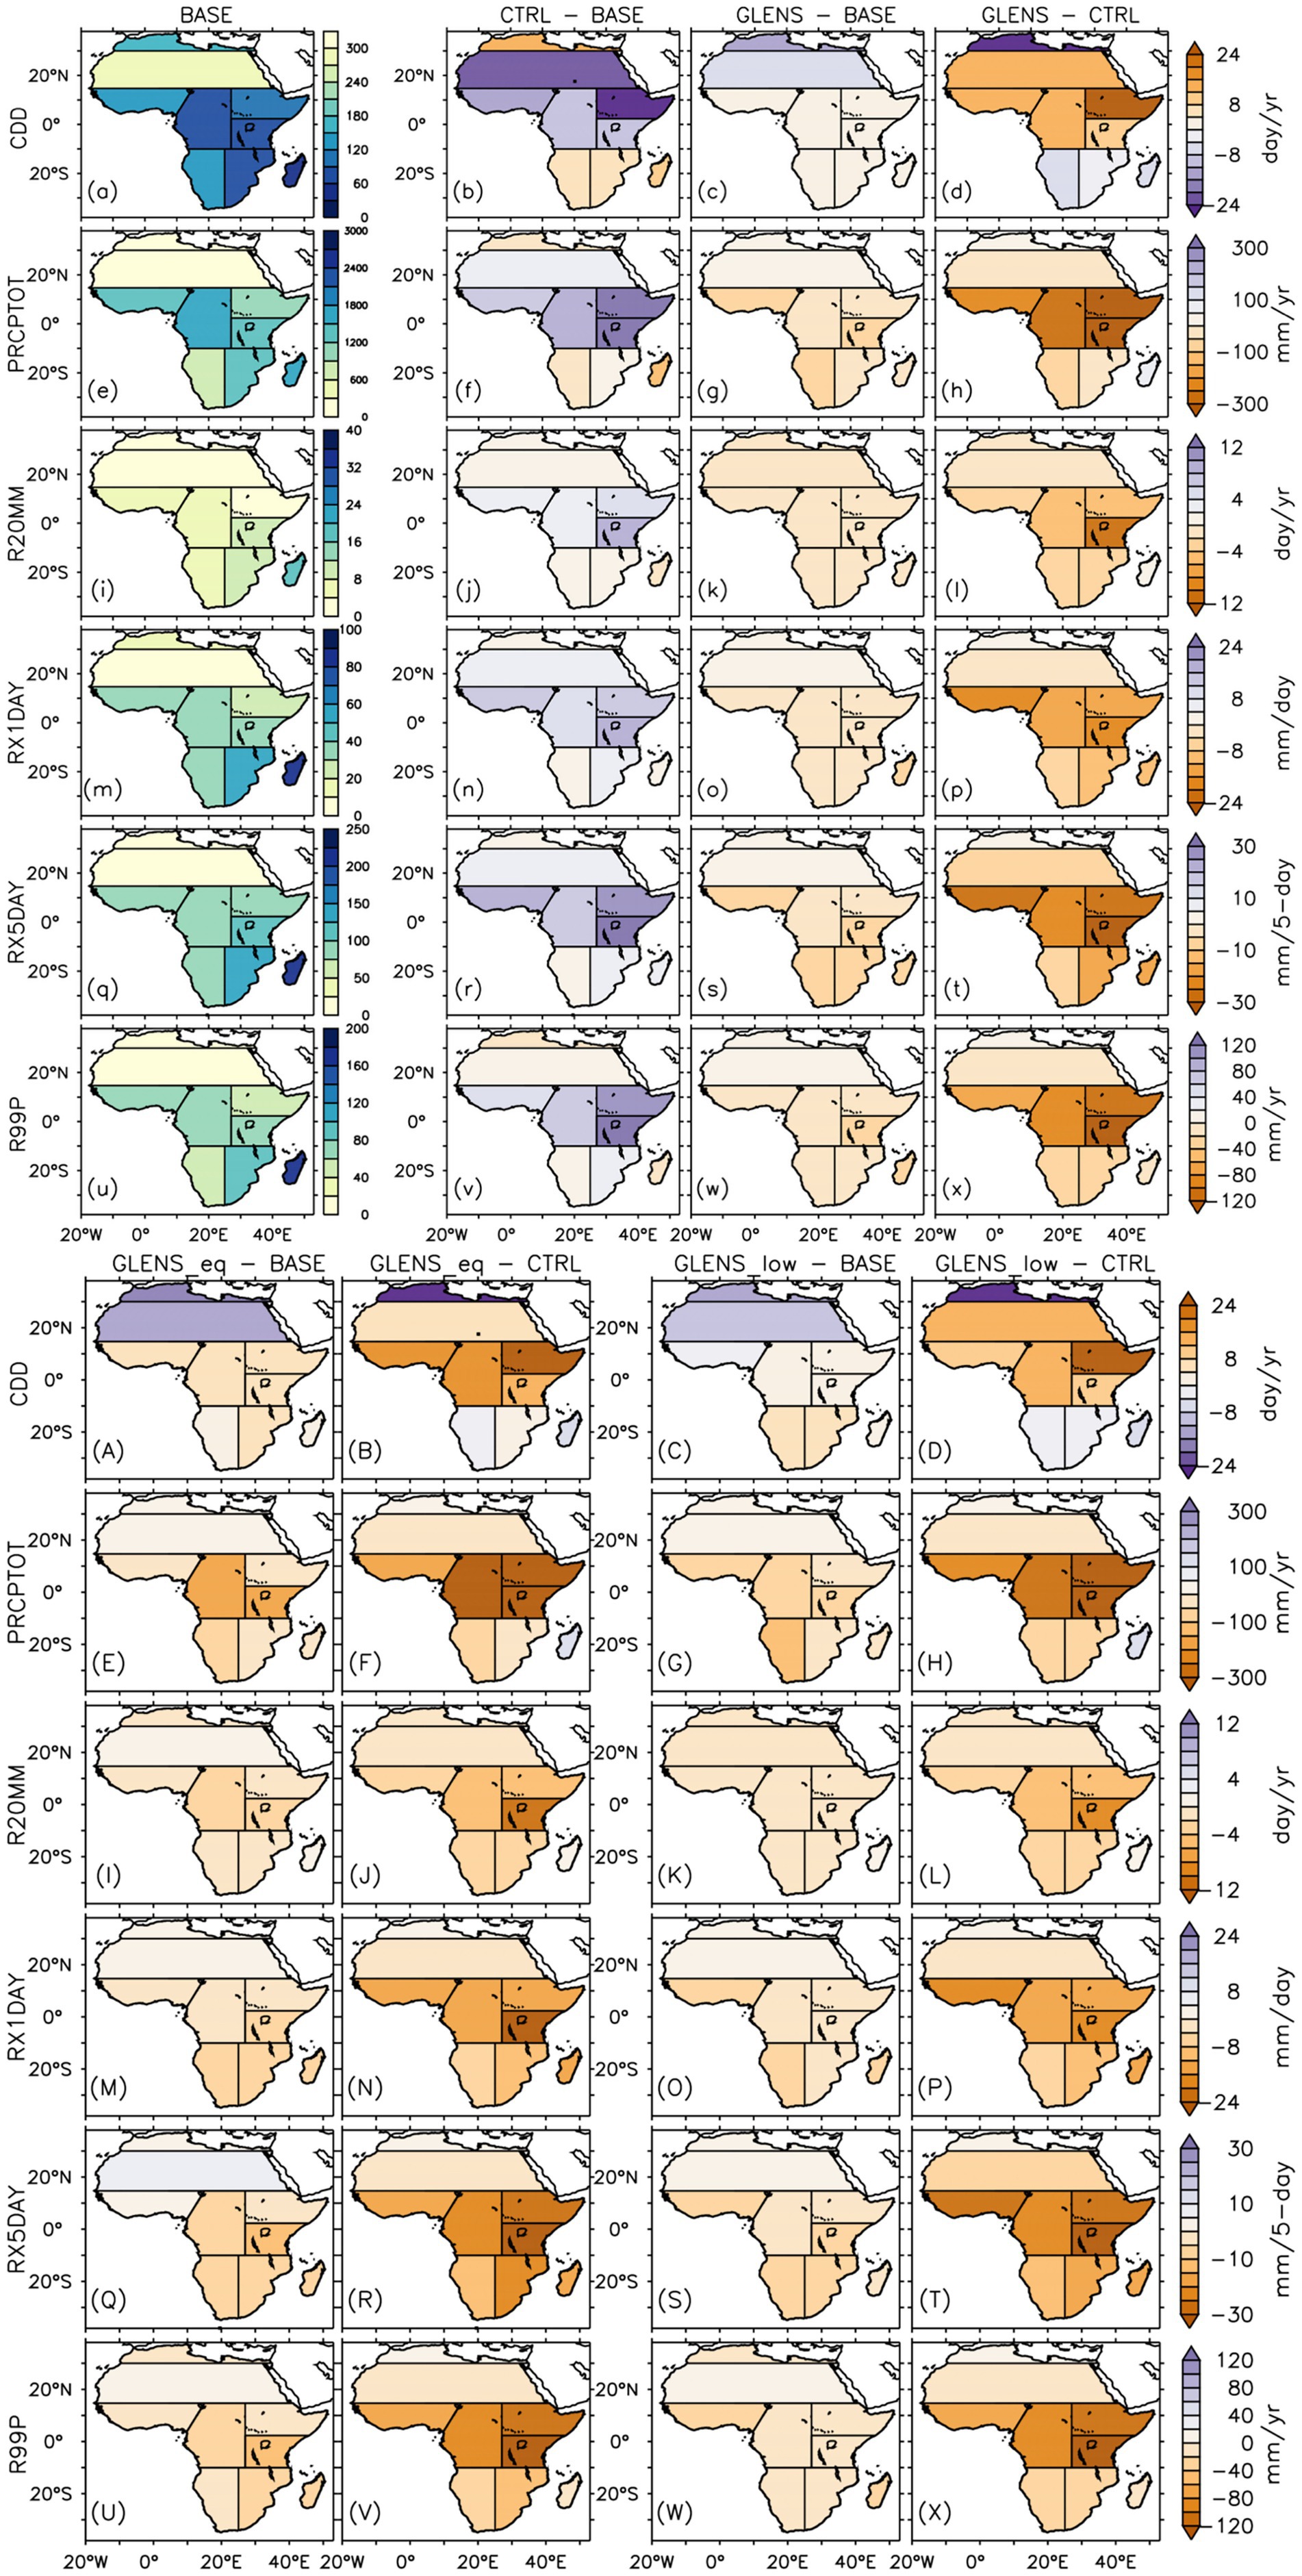
Figure 9. Mean annual of mean and extreme precipiation indices over Africa’s climatic (AR6) zones for the baseline period (or BASE: 2010–2030) and their projected changes in the future (2075–2095) under the RCP8.5 scenario without SAI (CTRL–BASE) and with SAI (GLENS–BASE, GLENS_eq–BASE, and GLENS_low–BASE). GLENS–CTRL, GLENS_eq–CTRL, and GLENS_low–CTRL show how each SAI experiment could influence the impacts of global warming on mean and extreme precipitation indices over Africa’s climatic zones.
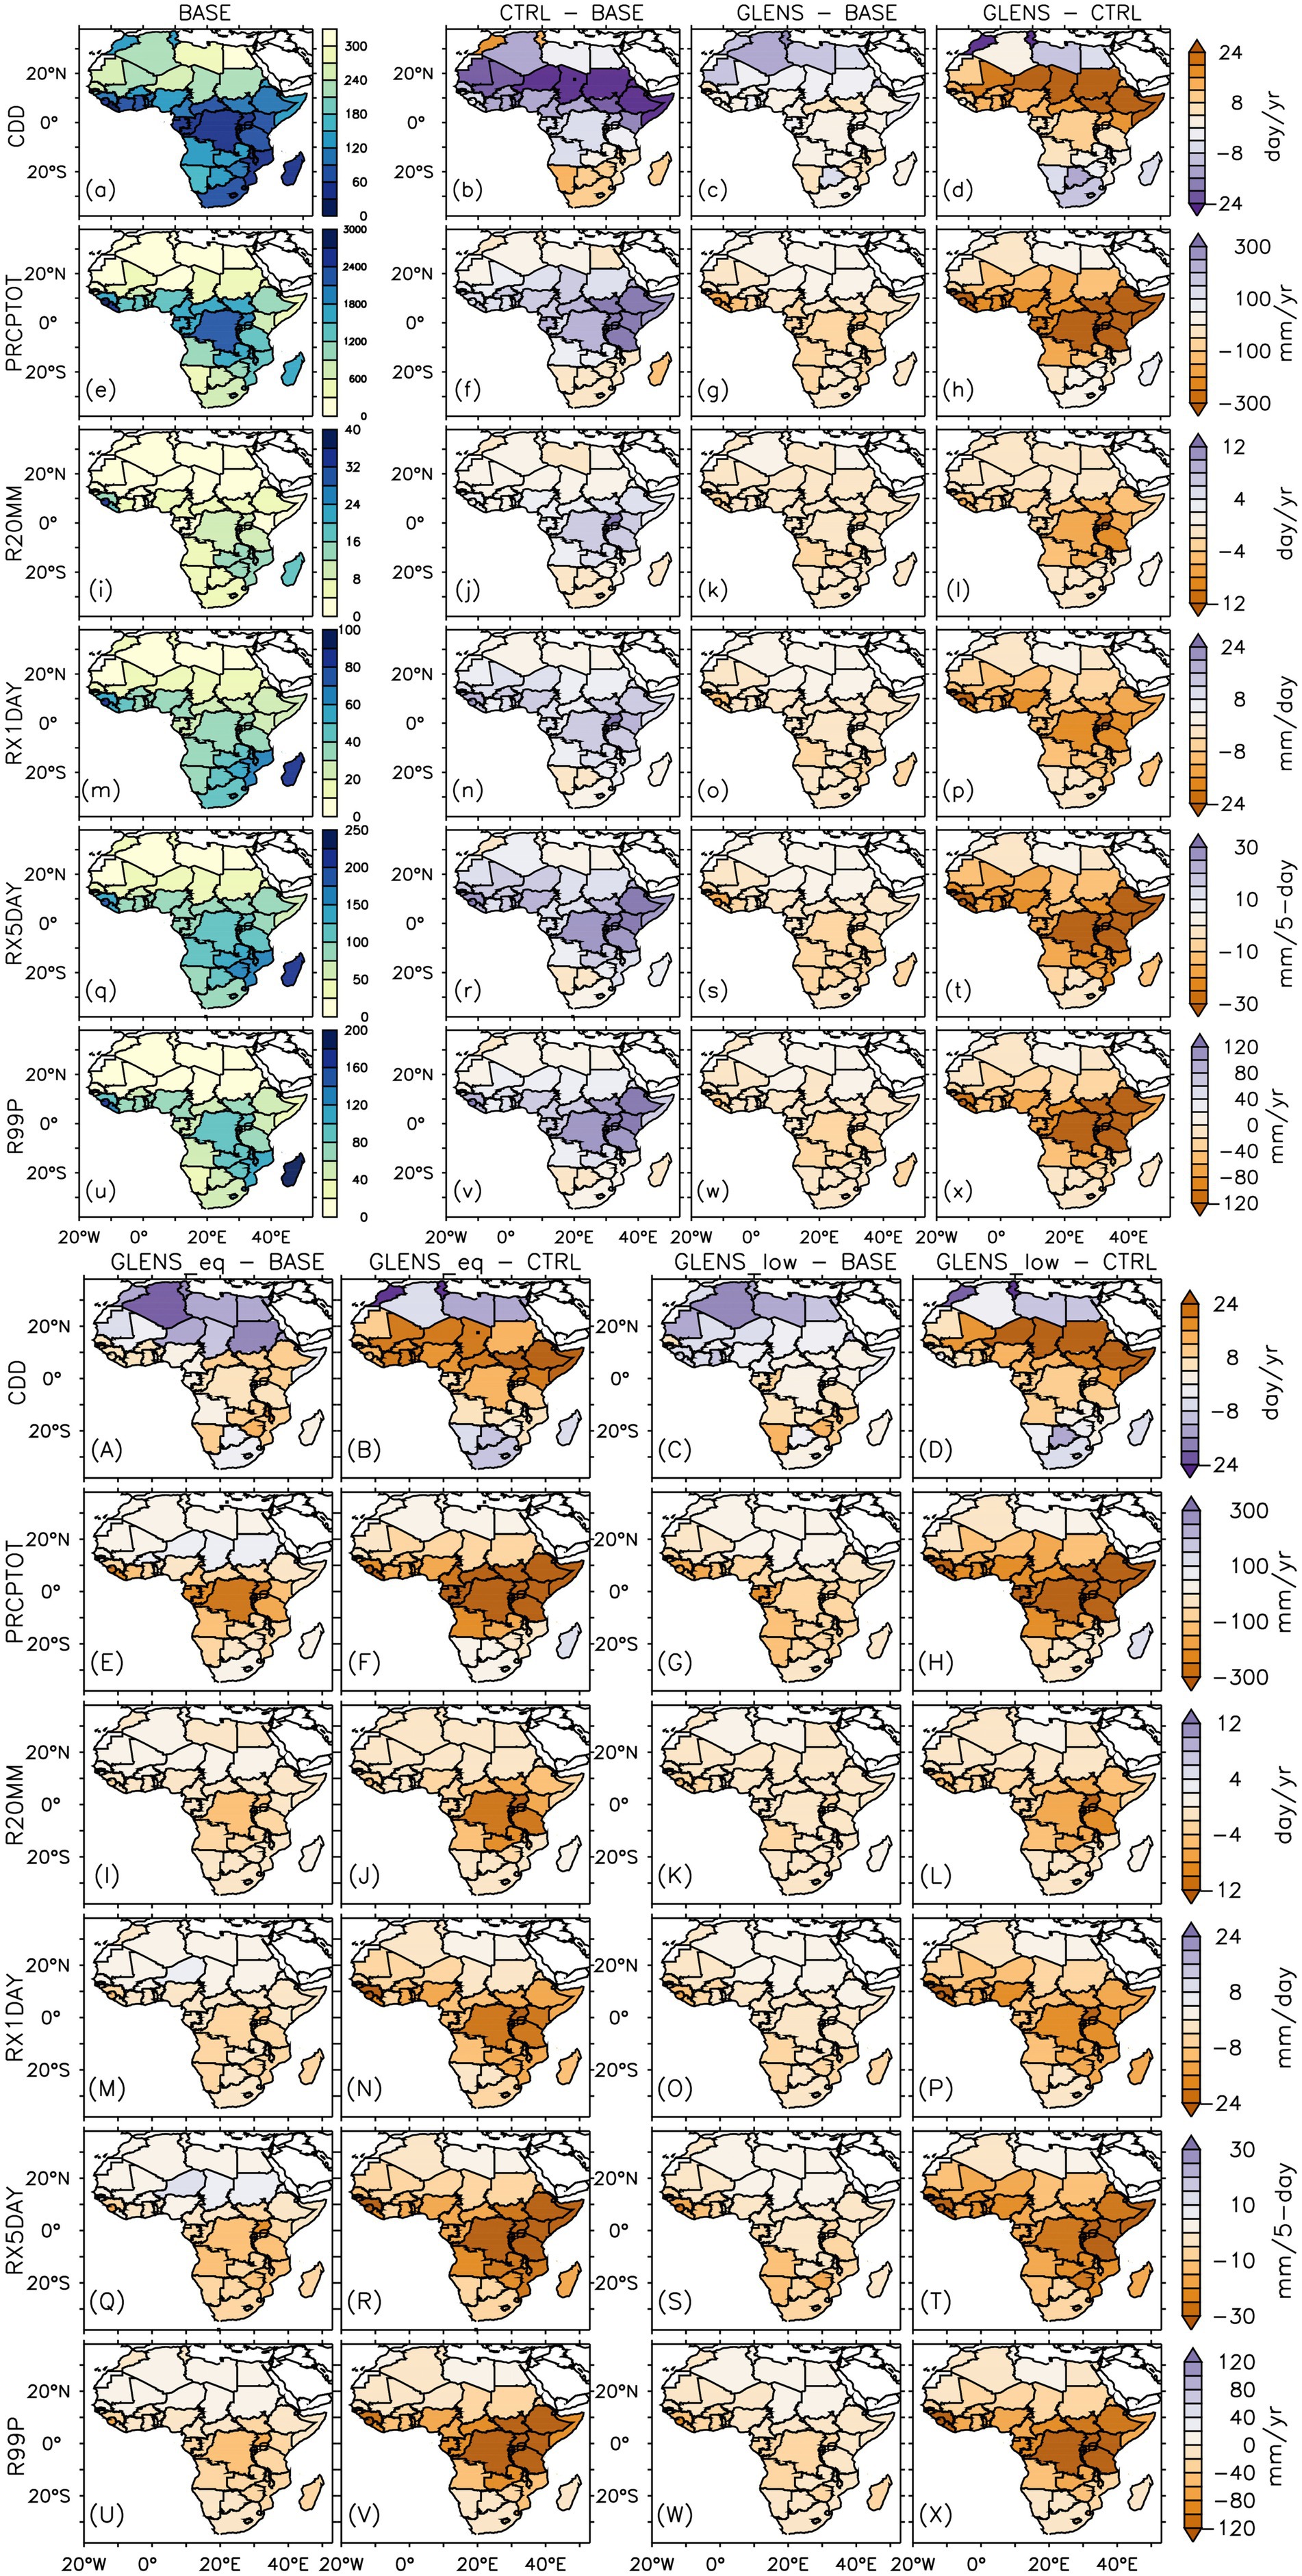
Figure 10. Mean annual of mean and extreme precipitation indices across African countries for the baseline period (or BASE: 2010–2030) and their projected changes in the future (2075–2095) under the RCP8.5 scenario without SAI (CTRL–BASE) and with SAI (GLENS–BASE, GLENS_eq–BASE, and GLENS_low–BASE). GLENS–CTRL, GLENS_eq–CTRL, and GLENS_low–CTRL show how each SAI experiment could influence the impacts of global warming on mean and extreme precipitation indices over countries in Africa.
Regardless of the stratospheric aerosol injection characteristics, all SAI experiments could potentially induce future drying while alleviating flood risk at the same time across the continent. This SAI-induced drying is characterised by a reversal in the RCP8.5-projected increase and an exacerbation of the RCP8.5-projected decrease in mean and extreme precipitation indices across the climatic zones (Figure 6). For instance, over WAF, CAF, NEAF, CEAF, and ESAF, all SAI are projected to overcompensate the RCP8.5-projected increase in PRCPTOT, R20MM, RX1DAY, RX5DAY, and R99P (Figure 6). Similar results are projected over WSAF for R20MM, RX1DAY, RX5DAY, and R99P and over MDG for RX1DAY and RX5DAY. On the other hand, the RCP8.5-projected decrease in PRCPTOT over WSAF and in PRCPTOT, R20MM, and R99P over MDG could be exacerbated under all SAI experiments considered in this study (Figure 9). However, MEDA could experience slightly wetter conditions as all SAI experiments are projected to overcompensate the RCP8.5-induced decrease in PRCPTOT. These findings are consistent with the projected changes in CDD over most regions. For instance, SAI could reverse the RCP8.5-projected increase (decrease) in CDD over MEDA (WAF, CAF, NEAF, and SEAF) and exacerbate the increase in CDD over WSAF and MDG (Figures 9b–d, A–D). Similar changes are projected over most countries across Africa (Figures 9, 10). However, for precipitation indices, the regional SAI efficacy is not linearly related to the country-scale SAI efficacy as for temperature indices (Figures 8, 11).
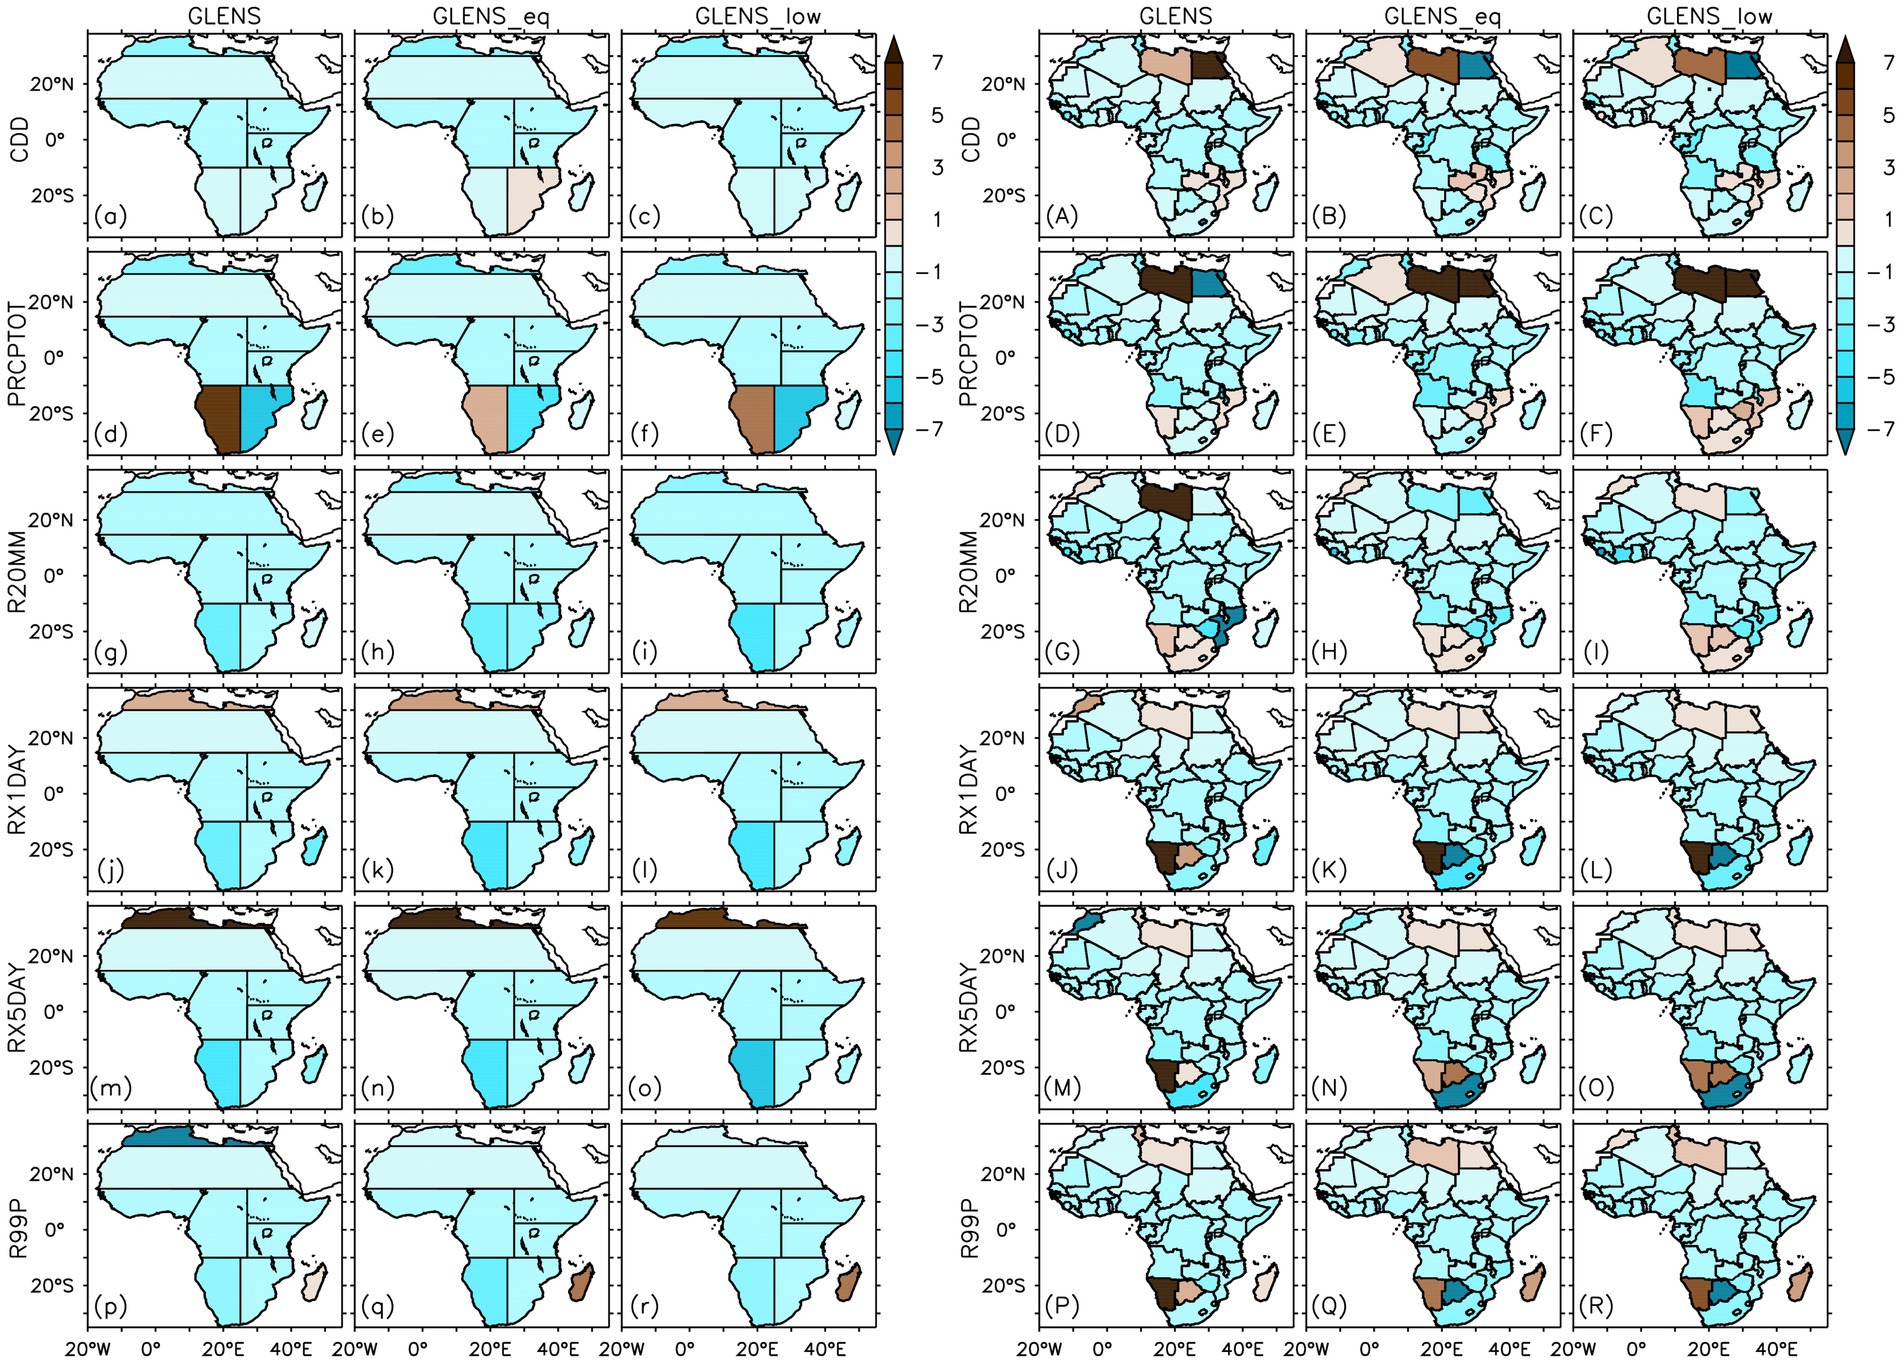
Figure 11. Mean efficacy of SAI experiments to compensate for the influence of global warming relative to the baseline (BASE) over (a–r) Africa’s climatic zones and (A–R) African countries for mean and extreme precipitation indices.
4 Discussions and conclusions
All SAI experiments considered in this study demonstrate the potential to offset most of the projected warming across Africa under the RCP8.5 scenario. The results suggest that the GLENS_eq experiment could be the most effective, while the GLENS_low experiment could be the least effective in cooling the continent. Although the greater cooling potential in GLENS and GLENS_eq could be partly attributed to their higher SO₂ injection altitudes (~20–25 km above ground) relative to GLENS_low, where injections occur approximately 1 km above the tropopause, variations in injection magnitude, latitudinal placement, and the spatial distribution of aerosols could have also contributed substantially to the differences in the cooling effectiveness across the experiments. Higher injection altitudes have been shown to extend the lifetime of aerosols in the stratosphere, resulting in a more sustained cooling effect compared to lower injection altitudes (Irvine et al., 2016; Tilmes et al., 2018b; Patel et al., 2023). Additionally, injecting SO2 at a single point at the equator tends to overcool tropical Africa, particularly Central and Southern Africa, compared to multiple injection points in the tropics and subtropics (GLENS and GLENS_low). This finding aligns with previous studies that demonstrate that equatorial injections facilitate a better meridional distribution of aerosols, thereby ensuring a more homogeneous radiative forcing impact (Bednarz et al., 2023). It is also worth noting that another possible explanation for the low effectiveness of GLENS and GLENS_low over the tropics and subtropics is the disproportionality in the amount of SO2 injected at each location (see Tilmes et al., 2018b). While the highest load of SO2 was injected at 30°N and 30°S, much less was injected at 15°N and nearly nothing at 15°S, which are the closest locations to the equator, making GLENS and GLENS_low less effective in cooling regions around 15°N and 15°S. Finally, a more substantial cooling impact caused by GLENS_eq could also be associated with using a single SO2 injection location at the equator, which would require a higher amount of SO2 to achieve the desired temperature target (Kravitz et al., 2019; Patel et al., 2023). While GLENS_eq achieves near-complete offsetting (over-effective) of projected warming in many areas, it remains under-effective over parts of the Sahel (SAH) and North Africa (MEDA) for cold extreme indices (TNN and TN10P; Figures 3e,k, 8e,k, E,K) and in localised regions in North Africa for mean temperature (TMM; Figures 3b, 8B) and hottest day temperature (TXX, Figure 3h). These findings suggest that even with optimised injection strategies, some residual warming may persist in certain regions due to complex atmospheric and radiative interactions (Niemeier et al., 2011; Niemeier and Timmreck, 2015).
On the other hand, SAI, in the conditions of this study, could offset the RCP8.5-projected increase in mean and extreme precipitation across the continent, causing drier climatic conditions while also alleviating floods in most parts of Africa in the future. While all SAI experiments could influence projected patterns of precipitation, they generally tend to overcompensate for the projected wetting under RCP8.5, resulting in drying relative to the baseline. This projected influence of SAI on precipitation extremes could also reduce flood risks across the continent, while the associated drying could further increase the vulnerability of a region primarily dependent on rain-fed agriculture, exposing millions of people to an increased risk of food insecurity. Similarly, Robock et al. (2008) reported that SAI with SO2 injections into the tropical and Arctic stratosphere could lead to decreased precipitation in the African and Asian monsoon regions, affecting water and food supplies for billions of people. Using the GLENS experiment, Da-Allada et al. (2020) reported that SAI could reverse the RCP8.5-projected increase in West African summer monsoon rainfall along the Guinea coast. Despite the agreement across all three SAI experiments on SAI influence on precipitation, GLENS_eq is projected to have the most substantial influence on precipitation by causing the largest decrease in mean and extreme precipitation over Africa’s climatic zones.
The more substantial cooling and drying potential from GLENS_eq could also come from the amount of SO2 injected at a single point into the equatorial stratosphere to achieve a single temperature target (T0: global mean surface air temperature). Kravitz et al. (2019) reported that to achieve the same temperature target T0, GLENS_eq would require more SO2 injection than GLENS and GLENS_low, making it less effective regarding global average cooling per unit of SO2 injected.
In summary, the findings from this study provide critical insights into the projected impact of stratospheric aerosol injection locations and altitudes on Africa’s climate under the high-emission future scenario RCP8.5. While all SAI experiments demonstrate the potential to offset significant warming associated with RCP8.5, their effectiveness in moderating temperatures varies spatially and regionally, with GLENS_eq appearing most effective in cooling the continent. However, this comes with significant trade-offs. The equatorial injection strategy is associated with the overcooling of the tropics (Tilmes et al., 2018b; Visioni et al., 2020), potential southward shifts of the Intertropical Convergence Zone (ITCZ) (Kravitz et al., 2019), and the suppression of monsoonal precipitation, especially over West Africa and the Sahel (Da-Allada et al., 2020). Additionally, equatorial injection offers limited flexibility in tuning regional climates, which may exacerbate precipitation extremes in some areas while excessively dampening them in others (MacMartin et al., 2017; Visioni et al., 2020). Consequently, all SAI scenarios could introduce substantial changes to the hydrological cycle, characterised by widespread drying, suppression of extreme precipitation, and reduced flood risks across Africa and its climatic zones, which underscores the complex trade-offs between temperature stabilisation and water-related climate risks.
Data availability statement
Publicly available datasets were analyzed in this study. The study analysed the stratospheric aerosol Geoengineering Large Ensemble (GLENS) project dataset, available from the Earth System Grid at: http://www.cesm.ucar.edu/projects/community-projects/GLENS/.
Author contributions
NK: Conceptualization, Writing – review & editing, Writing – original draft, Methodology, Formal analysis. CM: Writing – review & editing. KQ: Methodology, Supervision, Writing – review & editing, Funding acquisition. TP: Writing – review & editing. FO-L: Writing – review & editing. NP: Writing – review & editing. MNg: Writing – review & editing. TN: Writing – review & editing. BA: Writing – review & editing, Supervision. CL: Funding acquisition, Supervision, Writing – review & editing. MNe: Supervision, Writing – review & editing. RO: Conceptualisation, Data curation, Formal analysis, Funding acquisition, Methodology, Supervision, Visualisation, Writing – review & editing.
Funding
The author(s) declare that financial support was received for the research and/or publication of this article. This work was supported by a grant from the Simons Foundation, under award ID SFI-MPS-SRM-00004531. Further support was received from the (i) DEGREES Modelling Fund (DMF) of the DEGREES Initiative with contract number 4500439188, (ii) Carnegie Corporation of New York under the Grant G-21-58838, (iii) National Research Foundation of South Africa, and (iv) NSF National Center for Atmospheric Research, a major facility sponsored by the National Science Foundation under Cooperative Agreement No. 1755088.
Conflict of interest
The authors declare that the research was conducted in the absence of any commercial or financial relationships that could be construed as a potential conflict of interest.
Generative AI statement
The authors declare that no Gen AI was used in the creation of this manuscript.
Any alternative text (alt text) provided alongside figures in this article has been generated by Frontiers with the support of artificial intelligence and reasonable efforts have been made to ensure accuracy, including review by the authors wherever possible. If you identify any issues, please contact us.
Publisher’s note
All claims expressed in this article are solely those of the authors and do not necessarily represent those of their affiliated organizations, or those of the publisher, the editors and the reviewers. Any product that may be evaluated in this article, or claim that may be made by its manufacturer, is not guaranteed or endorsed by the publisher.
References
Abiodun, B. J., Odoulami, R. C., Sawadogo, W., Oloniyo, O. A., Abatan, A. A., New, M., et al. (2021). Potential impacts of stratospheric aerosol injection on drought risk managements over major river basins in Africa. Clim. Chang. 169, 1–19. doi: 10.1007/s10584-021-03268-w
Alexander, L., and Herold, N. (2016). ClimPACT2: Indices and Software. A document prepared on behalf of The Commission for Climatology (CCl) Expert Team on Sector-Specific Climate Indices (ET-SCI). World Climate Programme, World Climate Service Programme. Available online at: https://epic.awi.de/id/eprint/49274/1/ClimPACTv2_manual.pdf (Accessed September 11, 2025).
Alexander, L. V., Zhang, X., Peterson, T. C., Caesar, J., Gleason, B., Klein Tank, A. M. G., et al. (2006). Global observed changes in daily climate extremes of temperature and precipitation. J. Geophys. Res. 111:D05109. doi: 10.1029/2005JD006290
Bednarz, E. M., Butler, A. H., Visioni, D., Zhang, Y., Kravitz, B., and MacMartin, D. G. (2023). Injection strategy–a driver of atmospheric circulation and ozone response to stratospheric aerosol geoengineering. Atmos. Chem. Phys. 23, 13665–13684. doi: 10.5194/acp-23-13665-2023
Caldeira, K., Bala, G., and Cao, L. (2013). The science of geoengineering. Annu. Rev. Earth Planet. Sci. 41, 231–256. doi: 10.1146/annurev-earth-042711-105548
Cheng, W., MacMartin, D. G., Dagon, K., Kravitz, B., Tilmes, S., Richter, J. H., et al. (2019). Soil Moisture and Other Hydrological Changes in a Stratospheric Aerosol Geoengineering Large Ensemble. Geophys. Res. Atmos. 124, 12773–12793. doi: 10.1029/2018JD030237
Da-Allada, C. Y., Baloïtcha, E., Alamou, E. A., Awo, F. M., Bonou, F., Pomalegni, Y., et al. (2020). Changes in west African summer monsoon precipitation under stratospheric aerosol geoengineering. Earths Future 8:e2020EF001595. doi: 10.1029/2020EF001595
Duffey, A., Henry, M., Smith, W., Tsamados, M., and Irvine, P. J. (2025). Low-altitude high-latitude stratospheric aerosol injection is feasible with existing aircraft. Earths Future 13:e2024EF005567. doi: 10.1029/2024EF005567
Engelbrecht, F. A., Steinkopf, J., Padavatan, J., and Midgley, G. F. (2024). “Projections of future climate change in southern Africa and the potential for regional tipping points” in Sustainability of southern African ecosystems under global change. Ecological studies. eds. von Maltitz, G.P., Midgley, G.F., Veitch, J., Brummer, C., Rotter, R.P., Viehberg, F.A. et al. vol. 248 (Cham: Springer). doi: 10.1007/978-3-031-10948-5_7
FAO, IFAD and WFP (2015). The state of food insecurity in the world 2015. Meeting the 2015 international hunger targets: taking stock of uneven progress. Rome: FAO.
Institute of Medicine, National Academy of Sciences, and National Academy of Engineering (1992). Policy Implications of Greenhouse Warming: Mitigation, Adaptation, and the Science Base. Washington, DC: The National Academies Press. doi: 10.17226/1605
IPCC (2023). Sections. In: Climate Change 2023: Synthesis Report. Contribution of Working Groups I, II and III to the Sixth Assessment Report of the Intergovernmental Panel on Climate Change. Core Writing TeamH. Lee and J. Romero (eds.). Geneva, Switzerland: IPCC. 35–115. doi: 10.59327/IPCC/AR6-9789291691647
Irvine, P. J., and Keith, D. W. (2020). Halving warming with stratospheric aerosol geoengineering moderates policy-relevant climate hazards. Environ. Res. Lett. 15:044011. doi: 10.1088/1748-9326/ab76de
Irvine, P. J., Kravitz, B., Lawrence, M. G., and Muri, H. (2016). An overview of the Earth system science of solar geoengineering. WIREs Climate Change. 7, 815–833. doi: 10.1002/wcc.423
Ji, D., Fang, S., Curry, C. L., Kashimura, H., Watanabe, S., Cole, J. N., et al. (2018). Extreme temperature and precipitation response to solar dimming and stratospheric aerosol geoengineering. Atmos. Chem. Phys. 18, 10133–10156. doi: 10.5194/acp-18-10133-2018
Kravitz, B., MacMartin, D. G., Mills, M. J., Richter, J. H., Tilmes, S., Lamarque, J. F., et al. (2017). First simulations of designing stratospheric sulfate aerosol geoengineering to meet multiple simultaneous climate objectives. J. Geophys. Res. Atmos. 122, 12–616. doi: 10.1002/2017JD026874
Kravitz, B., MacMartin, D. G., Tilmes, S., Richter, J. H., Mills, M. J., Cheng, W., et al. (2019). Comparing surface and stratospheric impacts of geoengineering with different SO2 injection strategies. J. Geophys. Res. Atmos. 124, 7900–7918. doi: 10.1029/2019JD030329
Lee, W. R., MacMartin, D. G., Visioni, D., Kravitz, B., Chen, Y., Moore, J. C., et al. (2023). High-latitude stratospheric aerosol injection to preserve the Arctic. Earths Future 11:e2022EF003052. doi: 10.1029/2022EF003052
Liu, Z., Lang, X., and Jiang, D. (2022). Impact of stratospheric aerosol intervention geoengineering on surface air temperature in China: a surface energy budget perspective. Atmos. Chem. Phys. Discuss. 2021, 1–29. doi: 10.5194/acp-22-7667-2022
MacMartin, D. G., Kravitz, B., Tilmes, S., Richter, J. H., Mills, M. J., Lamarque, J., et al. (2017). The climate response to stratospheric aerosol geoengineering can be tailored using multiple injection locations. J. Geophys. Res. Atmos. 122, 12574–12590. doi: 10.1002/2017JD026868
MacMartin, D. G., Ricke, K. L., and Keith, D. W. (2018). Solar geoengineering as part of an overall strategy for meeting the 1.5°C Paris target. Philosophical Transactions of the Royal Society A: Mathematical, Physical and Engineering Sciences. 2119:376. doi: 10.1098/RSTA.2016.0454
Mills, M. J., Richter, J. H., Tilmes, S., Kravitz, B., MacMartin, D. G., Glanville, A. A., et al. (2017). Radiative and chemical response to interactive stratospheric sulfate aerosols in fully coupled CESM1(WACCM). J. Geophys. Res. Atmos. 122, 13061–13078. doi: 10.1002/2017JD027006
National Academies of Sciences, Engineering, and Medicine (2021). Reflecting Sunlight: Recommendations for Solar Geoengineering Research and Research Governance. Washington, DC: The National Academies Press. doi: 10.17226/25762
Niang, I., Ruppel, O. C., Abdrabo, M. A., Essel, A., Lennard, C., Padgham, J., et al. (2014). “Climate change 2014: impacts, adaptation, and vulnerability. Part B: regional aspects” in Contribution of working group II to the fifth assessment report of the intergovernmental panel on climate change. eds. V. R. Barros, C. B. Field, D. J. Dokken, M. D. Mastrandrea, K. J. Mach, and T. E. Bilir, et al. (Cambridge, United Kingdom and New York, NY, USA: Cambridge University Press), 1199–1265. (Africa)
Niemeier, U., and Schmidt, H. (2017). Changing transport processes in the stratosphere by radiative heating of sulfate aerosols. Atmos. Chem. Phys. 17, 14871–14886. doi: 10.5194/acp-17-14871-2017
Niemeier, U., Schmidt, H., and Timmreck, C. (2011). The dependency of geoengineered sulfate aerosol on the emission strategy. Atmos. Sci. Lett. 12, 189–194. doi: 10.1002/asl.304
Niemeier, U., and Timmreck, C. (2015). What is the limit of climate engineering by stratospheric injection of SO2? Atmos. Chem. Phys. 15, 9129–9141. doi: 10.5194/acp-15-9129-2015
Ojara, M. A., Yunsheng, L., Babaousmail, H., and Wasswa, P. (2021). Trends and zonal variability of extreme rainfall events over East Africa during 1960–2017. Nat. Hazards 109, 33–61. doi: 10.1007/s11069-021-04824-4
Pajak, K., Idzikowska, M., and Kowalczyk, K. (2024). Sea level variability assessment along the African coast. Sustainability 16:5661. doi: 10.3390/su16135661
Patel, T. D., Odoulami, R. C., Pinto, I., Egbebiyi, T. S., Lennard, C., Abiodun, B. J., et al. (2023). Potential impact of stratospheric aerosol geoengineering on projected temperature and precipitation extremes in South Africa. Environmental Research: Climate. 2:035004. doi: 10.1088/2752-5295/acdaec
Pinto, I., Jack, C., Lennard, C., Tilmes, S., and Odoulami, R. C. (2020). Africa’s climate response to solar radiation management with stratospheric aerosol. Geophys. Res. Lett. 47:e2019GL086047. doi: 10.1029/2019GL086047
Rasch, P. J., Tilmes, S., Turco, R. P., Robock, A., Oman, L., Chen, C. C., et al. (2008). An overview of geoengineering of climate using stratospheric sulphate aerosols. Philos. Trans. A Math. Phys. Eng. Sci. 366, 4007–4037. doi: 10.1098/RSTA.2008.0131
Robock, A., Oman, L., and Stenchikov, G. L. (2008). Regional climate responses to geoengineering with tropical and Arctic SO2 injections. J. Geophys. Res. 113:D16101. doi: 10.1029/2008JD010050
Tilmes, S., MacMartin, D. G., Lenaerts, J. T., Van Kampenhout, L., Muntjewerf, L., Xia, L., et al. (2020). Reaching 1.5 and 2.0 °C global surface temperature targets using stratospheric aerosol geoengineering. Earth Syst. Dynam. 11, 579–601. doi: 10.5194/esd-11-579-2020
Tilmes, S., Richter, J. H., Kravitz, B., MacMartin, D. G., Mills, M. J., Simpson, I. R., et al. (2018a). CESM1(WACCM) stratospheric aerosol geoengineering large ensemble project. Bull. Am. Meteorol. Soc. 99, 2361–2371. doi: 10.1175/BAMS-D-17-0267.1
Tilmes, S., Richter, J. H., Mills, M. J., Kravitz, B., MacMartin, D. G., Garcia, R. R., et al. (2018b). Effects of different stratospheric SO2 injection altitudes on stratospheric chemistry and dynamics. J. Geophys. Res. Atmos. 123, 4654–4673. doi: 10.1002/2017JD028146
Visioni, D., MacMartin, D. G., Kravitz, B., Lee, W., Simpson, I. R., and Richter, J. H. (2020). Reduced poleward transport due to stratospheric heating under stratospheric aerosols geoengineering. Geophys. Res. Lett. 47:e2020GL089470. doi: 10.1029/2020GL089470
Keywords: climate extremes, climate change, climate intervention, solar geoengineering, stratospheric aerosol geoengineering, precipitation, temperature, climate model
Citation: Kumi N, Mensah C, Quagraine KA, Patel TD, Otu-Larbi F, Prempeh NA, Nguvava M, Nkemelang T, Abiodun BJ, Lennard C, New MG and Odoulami RC (2025) Africa’s regional and local climate response to stratospheric aerosol injection characteristics. Front. Clim. 7:1599405. doi: 10.3389/fclim.2025.1599405
Edited by:
Wen Zhou, Fudan University, ChinaReviewed by:
Frédéric Bonou, University of Abomey-Calavi, BeninAlistair Duffey, University College London, United Kingdom
Copyright © 2025 Kumi, Mensah, Quagraine, Patel, Otu-Larbi, Prempeh, Nguvava, Nkemelang, Abiodun, Lennard, New and Odoulami. This is an open-access article distributed under the terms of the Creative Commons Attribution License (CC BY). The use, distribution or reproduction in other forums is permitted, provided the original author(s) and the copyright owner(s) are credited and that the original publication in this journal is cited, in accordance with accepted academic practice. No use, distribution or reproduction is permitted which does not comply with these terms.
*Correspondence: Naomi Kumi, bmFvbWkua3VtaUB1ZW5yLmVkdS5naA==; Romaric C. Odoulami, cm9tYXJpYy5vZG91bGFtaUB1Y3QuYWMuemE=