 Amy L. McBride1*
 Kirstine Skov2*
 Peter Wade2Joey Betz2,3
 Amanda Stubbs2Tzara Bierowiec2Talal Albahri2Giulia Cazzagon2Chieh-Jhen Chen2Amy Frew2Matthew Healey2Ifeoma Idam4Lucy Jones2Mike E. Kelland5Jim Mann2
 David Manning6Callum Mitchell2
 Melissa J. Murphy7Anežka Radkova8Marta-Villa de toro Sanchez9Utku Solpuker10
 Yit Arn Teh6Rosalie Tostevin2Will Turner2Jez Wardman11Morven Wilkie2XinRan Liu2
- 1Independent Researcher, Freiburg-im-Breisgau, Germany
- 2UNDO Carbon Ltd., London, United Kingdom
- 3Department of Physics, University College London, London, United Kingdom
- 43Keel, Long Hanborough, United Kingdom
- 5Weathering Industries Ltd., Sheffield, United Kingdom
- 6School of Natural and Environmental Sciences, Newcastle University, Newcastle upon Tyne, United Kingdom
- 7Mel Murphy Geochemistry, Copenhagen, Denmark
- 8Independent Researcher, Cambridge, United Kingdom
- 9Institute of Earth Sciences, University of Lausanne, Lausanne, Switzerland
- 10Independent Researcher, Lyon, France
- 11Independent Researcher, Kirriemuir, United Kingdom
Enhanced weathering (EW) is cited as a promising carbon dioxide removal (CDR) strategy, and is being rapidly commercialized. Rigorous monitoring, reporting and verification (MRV) are essential to ensure carbon claims are accurate and carbon credits are not mis-sold. MRV protocols incorporate multiple approaches, including soil and porewater sampling. This paper calculates potential CDR (pCDR) from porewater (direct pCDR), via an alkalinity estimation calculated from charge balance, and from soil samples (inferred pCDR), via the accumulation of exchangeable cations on soil exchange sites. These pCDR estimations are then compared to the maximum theoretical CDR potential. The data were collected from a 1.5 year field trial, situated in south-east Scotland. Crushed basalt was surface-applied to plots at rates of 0 (control), 23, 78 and 126 t ha−1. Application rates were increased relative to common agricultural spreading practices (78 and 126 t ha−1) to increase the chances of detecting a signal. To calculate direct pCDR from porewater, ion concentrations of porewater samples extracted from a depth of 5 and 10 cm were integrated with precipitation surplus to estimate the flux of cations leaching from each depth over c. 2 week periods, as water budgets allowed. Ordinary least squares model results identified a significant effect of treatment as an explanatory variable for potential CDR, both at 5 and 10 cm depth. Direct pCDR ranging from 0.33 to 0.53 tCO2 ha−1 after c. 1.5 years of weathering was calculated in the 5 cm depth treatment in the 78 and 126 t ha−1 application treatment relative to the control. The model prediction interval was overlapping between the control and the 23 t ha−1 treatment at 5 cm depth, as well as for all the treatments in the 10 cm treatments when evaluated relative to the control. Carbonate precipitation was also assessed, but remained below the detection limit (0.1 wt.% inorganic carbon). Inferred pCDR calculated from 30 cm-deep soil samples were not significant, possibly as a result of experimental design and sampling density. Overall, when direct pCDR is normalized to mass of rock applied and duration of weathering (e.g., mass-time-normalized-pCDR), the values fall within the mid-range of values published from other field studies.
1 Introduction
Gigaton-scale durable carbon dioxide removal (CDR) is required, alongside rapid reductions in greenhouse gas emissions, in all scenarios that limit warming to 1.5°C above pre-industrial temperatures (Mignone et al., 2024). Currently, conventional CDR (e.g., afforestation and wetland restoration) removes 2.1 GtCO2 yr.−1, but by 2050, a CDR scale-up of c.7.2 GtCO2 yr.−1 is required to meet these targets (Smith et al., 2024). ‘Novel’ CDR [e.g., biochar, bioenergy with carbon capture and storage and enhanced weathering (EW)] is expected to account for c.3.4 GtCO2 yr.−1 of this additional CDR by 2050, but currently, contributes only 0.0013% to global CDR efforts (Smith et al., 2024). When comparing CDR pathways, durability is an important consideration, to prevent re-release of CO2, with research showing that durability extending beyond 1,000-years is required to stabilize global temperatures (Hasemer et al., 2024).
One promising novel CDR technology is EW, which aims to accelerate the weathering of silicate (and carbonate) minerals—a natural CDR process that already removes c.1 Gt CO2 yr.−1 globally (Berner and Berner, 2012). This weathering mechanism involves silicate minerals dissolving into solution by hydrolysis, where water or protons attack the metal–oxygen–silicon bonds (M–O–Si) of metal silicates in aqueous environments. The process releases cations (Ca2+, Mg2+, Na+ and K+) into solution with concomitant production of neutral silicic acid (H₄SiO₄ or Si(OH)₄) and a conjugate base of the acid that provided the protons (typically H₂CO₃ → HCO₃−, or H₂O → OH−; White and Brantley, 2003). The carbon capture mechanism involves the natural dissolution of CO2 produced via soil respiration into water, forming carbonic acid (H2CO3). The reaction of the carbonic acid with the metal silicate converts the carbonic acid into dissolved bicarbonate (HCO3−). In this way, cations released from the rock (via rock weathering) are charge balanced by bicarbonate (removing carbon from the atmosphere) during transport to the ocean through hydrological and natural geochemical systems, where the transformed carbon can remain stable for c.100,000 years (Renforth and Henderson, 2017). Part of the transformed carbon (currently c.13%) is re-released once reaching the ocean due to ocean carbonate buffering (Renforth and Henderson, 2017). Where substantial inorganic carbon, Ca2+ and high pH (typically > 8.5) are present, carbonate minerals may also precipitate in soils and sequester carbon in a solid phase instead (Jorat et al., 2022). During the precipitation of carbonate, the efficacy of CDR is halved to one mole of carbon per mole of divalent cation.
Rocks containing relatively high concentrations of Mg2+ and Ca2+, such as mafic and ultramafic rocks [c.8–54 wt.% CaO + MgO (Renforth, 2012)] are more favorable for EW due to their higher CDR potential (Renforth, 2012) and faster dissolution kinetics (Wolff-Boenisch et al., 2006; Heřmanská et al., 2022). Several methods have been proposed to accelerate natural rock weathering (Hartmann et al., 2013). One such method involves the application of crushed Ca- and Mg-rich silicate rocks onto croplands (e.g., Beerling et al., 2018, 2020; Kantola et al., 2017). Rock weathering is accelerated because of (1) increased surface area of crushed rock (either freshly crushed or available as a by-product, whereby no carbon penalty for crushing is required relative to outcrop), (2) distribution of crushed rock into soils, which can increase their wetted reactive surface area, reduce dissolution-limiting saturation effects and thus increase their weathering rate and (3) increased pCO2 concentrations—which are between 3-to-10-fold higher in soils compared to atmospheric concentrations (Nan et al., 2016; Dietzen and Rosing, 2023).
There are four key reasons why EW in agricultural soils is considered a highly promising CDR pathway: (1) utilization of existing land, (2) resource abundance, (3) compatibility with existing technologies, and (4) agronomic co-benefits. Firstly, nearly 11% of the Earth’s surface is dedicated to agriculture, so there is minimal land use change required to deploy EW (Beerling et al., 2018). Secondly, there is an abundance of suitable crushed rock, with over 3 billion tons produced annually (Renforth et al., 2011). Mafic rocks also comprise c. 5.2% of Earth’s land surface (Amiotte Suchet et al., 2003), forming large reserves of uncrushed rocks that could be mined as necessary. Thirdly, the infrastructure and technology required to facilitate the spreading of crushed rock already exists from the liming and fertilizer industry, obviating the need for further technological development (Beerling et al., 2018). Finally, EW does not compete with land used for food production, and instead, works alongside existing agricultural practices, potentially providing co-benefits such as increased soil pH and higher crop yields (e.g., Beerling et al., 2024; Skov et al., 2024; Kelland et al., 2020). The latter incentivizes the application of crushed silicate rocks to farmers whose land could be used for enhanced weathering operations.
These four reasons contribute to the attractiveness of EW as a CDR technology. Model simulations which integrate proxies for rock weathering, as well as land, climate and infrastructure data, have shown that EW could contribute substantially (between 0.5 and 2 Gt CO2 yr.−1) to global CDR targets (Beerling et al., 2020). As a result of these predictions and other modeling studies (Kelland et al., 2020; Lewis et al., 2021; Kantzas et al., 2022), as well as experimental data (Haque et al., 2020; Kelland et al., 2020; Amann et al., 2022; Larkin et al., 2022; McDermott et al., 2024), over 20 start-ups focused on EW have been founded (CDR.fyi, 2025). Many of these companies conduct rock-spreading operations and have raised over $46 million USD in equity investment (CDR.fyi via personal communication).
While EW has a high potential, there are several challenges associated with proving that CDR via EW has occurred. These challenges arise from: (1) operating in an open system where the removed carbon is stored in a different location (i.e., the marine environment) from where it was initially removed from the atmosphere (i.e., agricultural soils), (2) complexity associated with biogeochemical processes from source to sink (e.g., degassing downstream, seasonal carbonate precipitation) and (3) difficulty resolving small signals against high background variability (Schulte et al., 2024). Despite these challenges, it remains imperative that robust Monitoring, Reporting and Verification (MRV) of EW is in place to ensure the credibility of carbon credits sold and to build trust in the CDR market (Smith et al., 2024).
The theoretical maximum CDR potential of a given rock can be estimated based on analyses of concentrations of metal oxides (CaO, MgO, Na2O, K2O) and non-metal oxides (SO3, P2O5) of feedstocks (Renforth, 2012, 2019). However, these estimates currently bear no relation to field weathering rates and can thus only be used for feedstock comparisons. For durable CDR via EW to occur, bicarbonate charge balanced by cations must either be: (1) in transit to ocean storage or (2) precipitated as inorganic carbon in soils. To estimate the transit of bicarbonate to the ocean, liquid samples are required to be analyzed for both cations and a suite of other anions. Bicarbonate can also be determined through the measurement of any two of: pH, alkalinity, or dissolved inorganic carbon (Hasemer et al., 2024). Soil samples can be analyzed to identify precipitated inorganic carbon in the top layer, though seasonal precipitation/redissolution may occur (e.g., Jorat et al., 2022).
Indeed, the most recent methodologies published by crediting registries require that the CDR via increased bicarbonate flux is quantified from either: (1) soil porewater taken at or below the base of the near field zone (NFZ; i.e., the zone where weathering processes directly affect atmospheric CO2 concentrations) or (2) determined via a mass balance approach where CDR is assumed to be the balance between rock weathering and all other sinks for cations in an agricultural environment within the NFZ: plant uptake, storage on soil cation exchange sites, carbonate precipitation and strong acid weathering (Sutherland et al., 2024). Both methods are labor intensive and require large numbers of analytical samples. In the future, once large datasets have been collated, it may be possible to reduce the number of measurements (and thus cost of EW MRV) through simplified sample measurements or geochemical modeling.
A wealth of meso-scale experimental data exists, but few EW field trials have had their results published to date (McDermott et al., 2024). Field trials have quantified CDR via EW using: (1) soil leachate or porewater sampling (Deng et al., 2024; McDermott et al., 2024), (2) riverine sampling (Taylor et al., 2021; Larkin et al., 2022), (3) soil mass balance approaches (e.g., Beerling et al., 2024; Dietzen and Rosing, 2023) and (4) via carbonate precipitation (Haque et al., 2020). Riverine sampling allows the direct quantification of CDR. However, to quantify the additional bicarbonate flux (CDR), it is necessary to identify suitable control and treatment catchments along agricultural fields, which can be challenging, and the background noise is often too high to detect the relatively small signal from individual trials. Soil mass balance approaches integrated with additional sinks are more operationally feasible, but only infer CDR, while bicarbonate that is either measured or calculated using porewater collected at or below the base of the NFZ is a direct measure of CDR, but only captures a specific point in space and time.
Hydrological information is required to convert porewater concentration data into a flux of CDR. Leachate volumes can be quantified in mesoscale experiments because leachate is directly collected into a separate vessel. Implementing leachate collection vessels in fields to record leachate weight is costly. Therefore, several studies have used monthly or annual climatic data to assume water flux (e.g., McDermott et al., 2024). Annual data may, however, exaggerate fluxes in drier, hotter months and underestimate contributions in wetter, colder months (e.g., Warken et al., 2024).
This paper compares several methods described for calculating CDR using a 1.5 year long porewater time series as well as soil samples taken from a 28-month period from an EW field trial located in Scotland, United Kingdom. Data from two potential CDR calculation methods, using (1) soil porewater chemistry from 5 and 10 cm (collected c. 2-weekly porewater) integrated with daily precipitation surplus data and (2) exchangeable cations from 0 to 30 cm depth. Additional CDR was calculated by subtracting a control treatment from (1) 23, (2) 78 and (3) 126 t ha−1 treatment plots. The 23 t ha−1 treatment relates to current EW practices, while the 78 and 126 t ha−1 were implemented to test how the signal varied with application density. These data are compared with the maximum theoretical CDR determinations using the Epot equation (Renforth, 2019) to gain an insight into the differences in CDR estimations. Both methods are referred to as ‘potential CDR’ because: (1) porewater was not sampled below the NFZ and (2) the accumulation of cations on exchange sites (ExPot) are not currently charge balancing bicarbonates. However, pCDR calculated from porewater is referred to as ‘direct pCDR’ and ExPot is referred to as ‘inferred pCDR’.
2 Methods
2.1 Field location and experimental design
The field site is located on The Future Forest Company-managed Estate, Dumyat, near Stirling, Scotland (56.14930789 N; −3.89292692 W), and is referred to as Dumyat throughout this paper (Figure 1). The site is a grassland pasture, which is periodically used for grazing cattle and sheep from late summer to early autumn. The site is situated on a flat area of land at the bottom of a hillslope (field site gradient = 2°). The site is underlain with historic drainpipes running in the North–South direction. During the field trial, no fertilizer was applied to the field site.
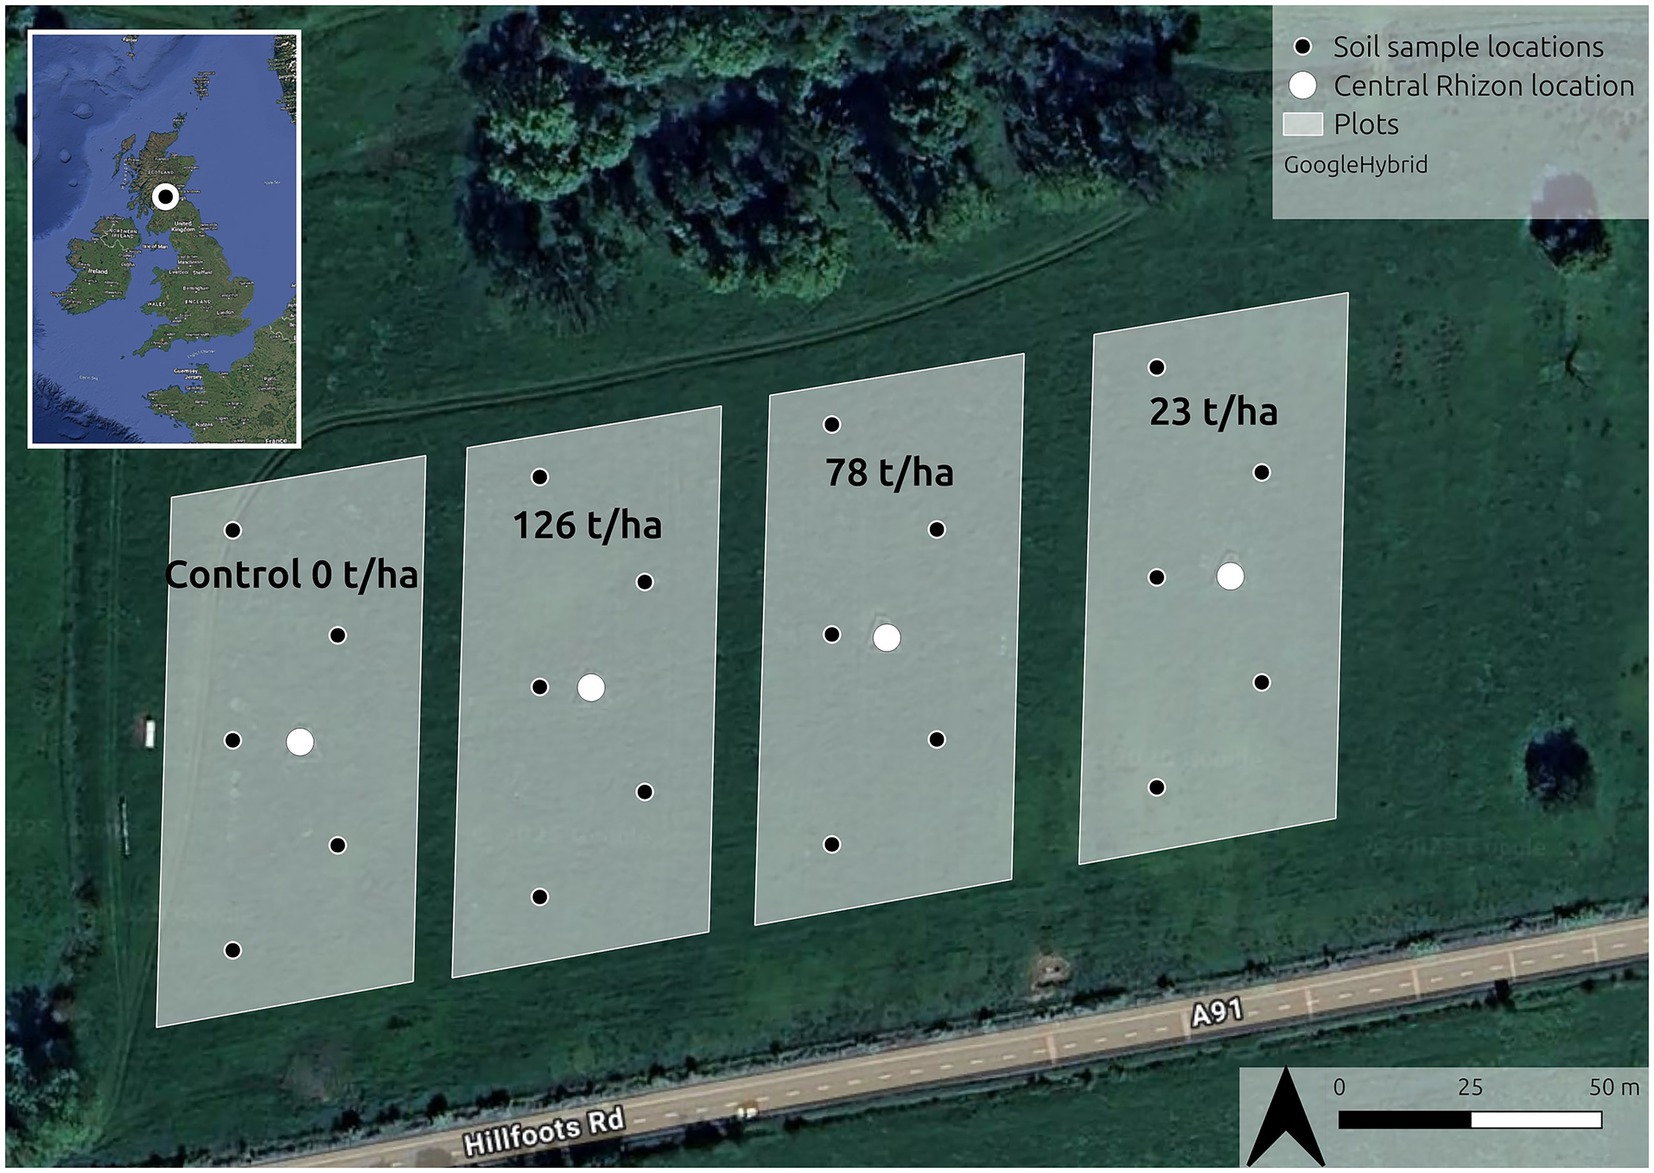
Figure 1. Overview of field trial layout with four c. half hectare plots. White circles indicate the location of the central soil pits in which rhizon samplers are installed in three separate pits. Black/white circles indicate the location of the soil samples. Background image and inset map image are GoogleHybrid with the WHS-84 coordinate reference system.
The climate of the site is characterized as temperate oceanic, according to the Köppen-Geiger classification scheme (Beck et al., 2018). Directly before the experiment began, the 10-year average annual temperature was 10.1°C and the average daily precipitation-evapotranspiration (P-ET) was 1.6 mm. During the course of the experiment, the average daily P-ET was 2.8 mm and annual average temperature was 8.2°C. The seasonality in the observed P-ET over the duration of the experiment can be found in Figure 2.
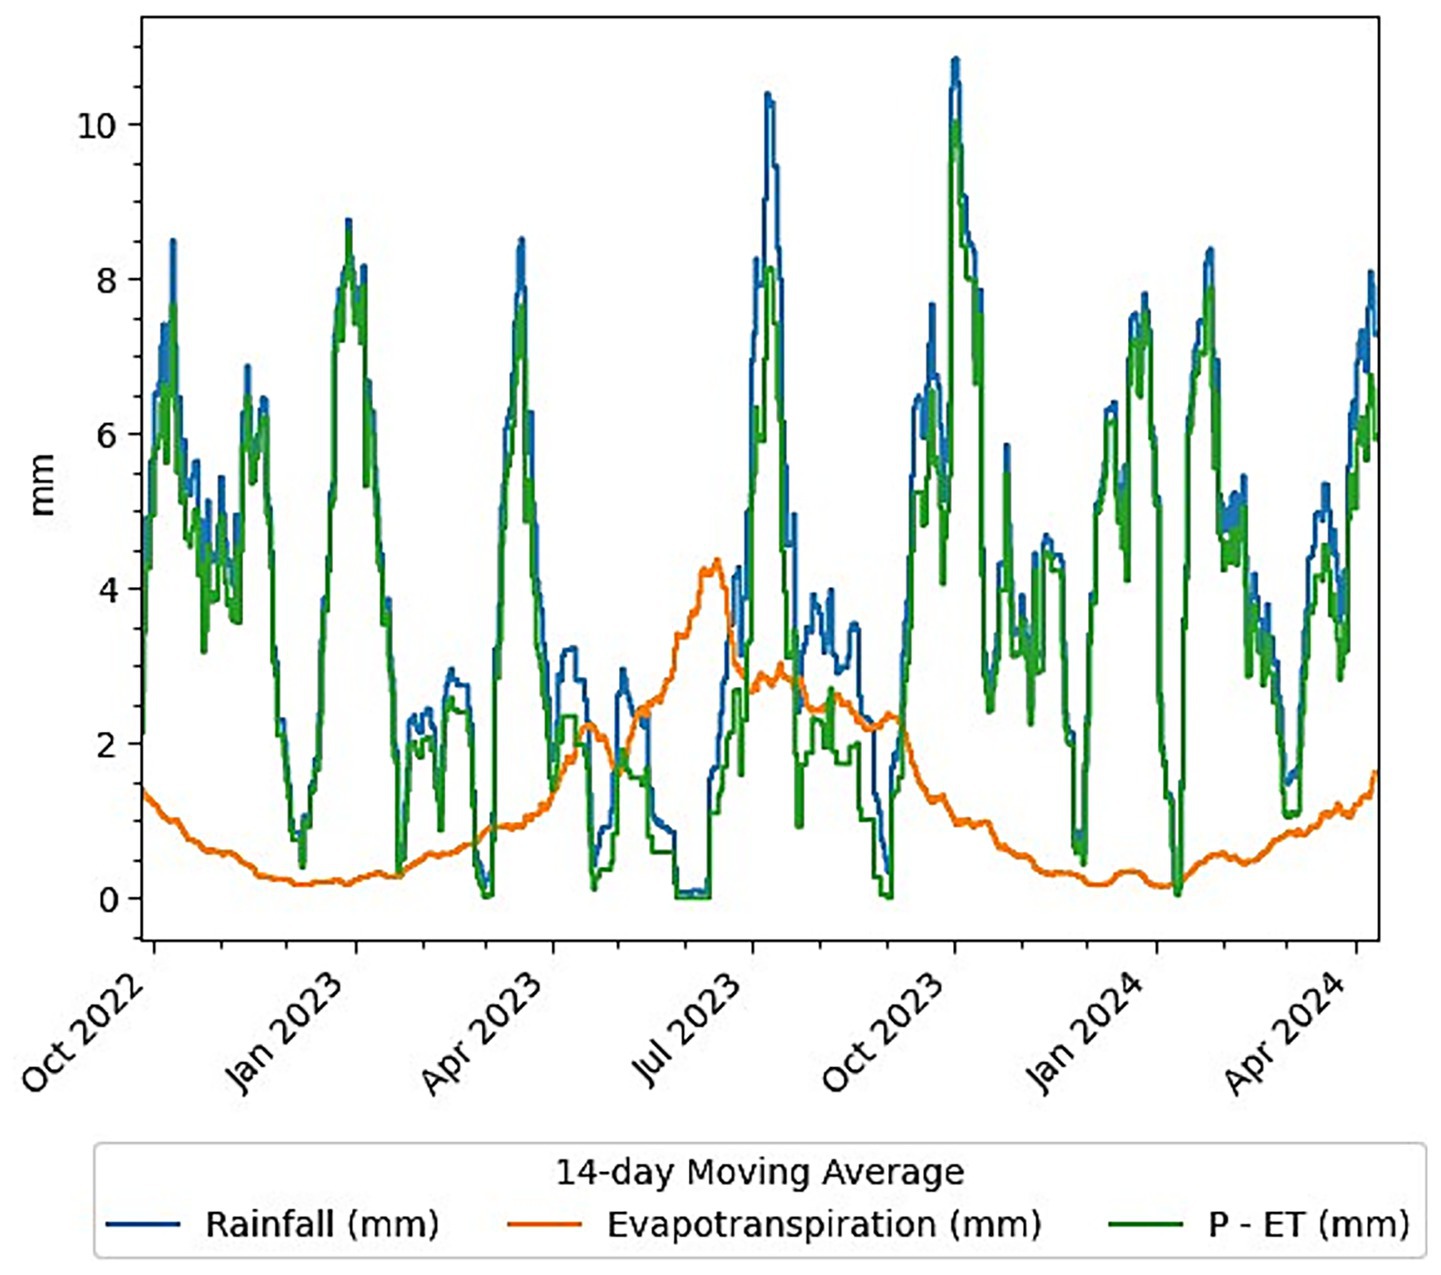
Figure 2. Precipitation and evapotranspiration data from Dumyat during the porewater data series (20th September 2022–18th April 2024), taken from Open-Meteo (2025).
Four experimental plots, each 48 × 100 m in size were set up in September 2022. Between the plots a buffer of 12 m was established, corresponding to the width of one pass with the agricultural lime spreader that was used for basalt deployment. Each plot was amended to a different basalt application rate (0, 23, 78 and 126 tons ha−1, see Figure 1). Within each plot a central area was established, and three sets of soil porewater macro-rhizon samplers (pore size of the membrane = 0.12–0.18 μm) were installed to the North, East and West of this central point via soil pits at 5 and 10 cm depth. The soil pits in which the rhizons were placed were 3 m from a central point, with straight-line distances of 5.2 m between the pits. The rhizons were fenced off using wooden fencing to prevent equipment damage from livestock and wildlife.
The basalt application was surface-applied in two stages. The majority of the plot was spread using a commercial lime spreader on the 20th September 2022. The central fenced off area was spread using a hand sieve on the 27th September 2022 to ensure an even spreading distribution across the area where porewater extraction was conducted.
2.2 Soil baseline results
Baseline soil samples were collected on the 19th September 2022 (1 day before basalt spreading) using an Ejkelkamp ‘Edelman’ auger (⌀ = 4 cm) and a sample depth of 30 cm. Soil samples were taken in the larger plots where basalt was spread using a commercial spreader at the locations indicated in Figure 1. The soil samples were taken in a W-pattern across each plot and georeferenced using a Trimble dGPS. Larger soil clumps were removed with a cloth between sampling events if needed. Before each sample the auger flight was prepared by taking a disposable sample directly adjacent to the sample point, to avoid contamination between samples. Samples were collected using plastic bags. The sampling depth was measured with a ruler until 30 cm depth was reached. Once collected, all samples were dried at < 40°C, sieved to < 2 mm and stored in plastic containers until analysis.
Both baseline and monitoring soil samples were sent for analysis to the United Kingdom Accreditation Service (UKAS) tested and ISO accredited (ISO/IEC 17025:2017) lab NRM—part of Cawood Scientific Limited. Baseline soil samples were analyzed for soil texture, cation exchange capacity and major exchangeable cations, and soil inorganic and organic carbon. Soil pH was determined in UNDO’s in-house lab and bulk density measurements were determined at the UK Biochar Research Center (University of Edinburgh). The analysis methods are described in Supplementary material S4. Analysis of the baseline soil samples showed a very uniform soil texture across the entire field, classified as a silty clay loam according to the USDA soil taxonomy. Mean and standard deviation for soil organic carbon content, and exchangeable calcium, magnesium, potassium and sodium, as well as soil pH and bulk density in three different depths are reported in Table 1. Baseline soil samples were also analyzed for soil inorganic carbon, but all samples were below detection (<0.1 wt.%). Differences in baseline variables across the four plots were evaluated using an ANOVA. There were no differences between the four plots, except for exchangeable calcium and magnesium (p < 0.05). A Tukey’s HSD post-hoc test revealed that the significant differences were present between the control vs. 23 t ha−1, control vs. 126 t ha−1 plots for calcium and control vs. 23 t ha−1 for magnesium. Model requirements of normality and homoscedasticity were tested using Shapiro–Wilk and White’s Lagrange multiplier test, respectively. All variables met model requirements except exchangeable magnesium which showed slight heteroscedasticity (p = 0.03), indicating that differences should be considered cautiously. The statistical comparison was carried out using Python (version 3.9) and the package Statsmodels (version 0.14.4; Seabold and Perktold, 2010).
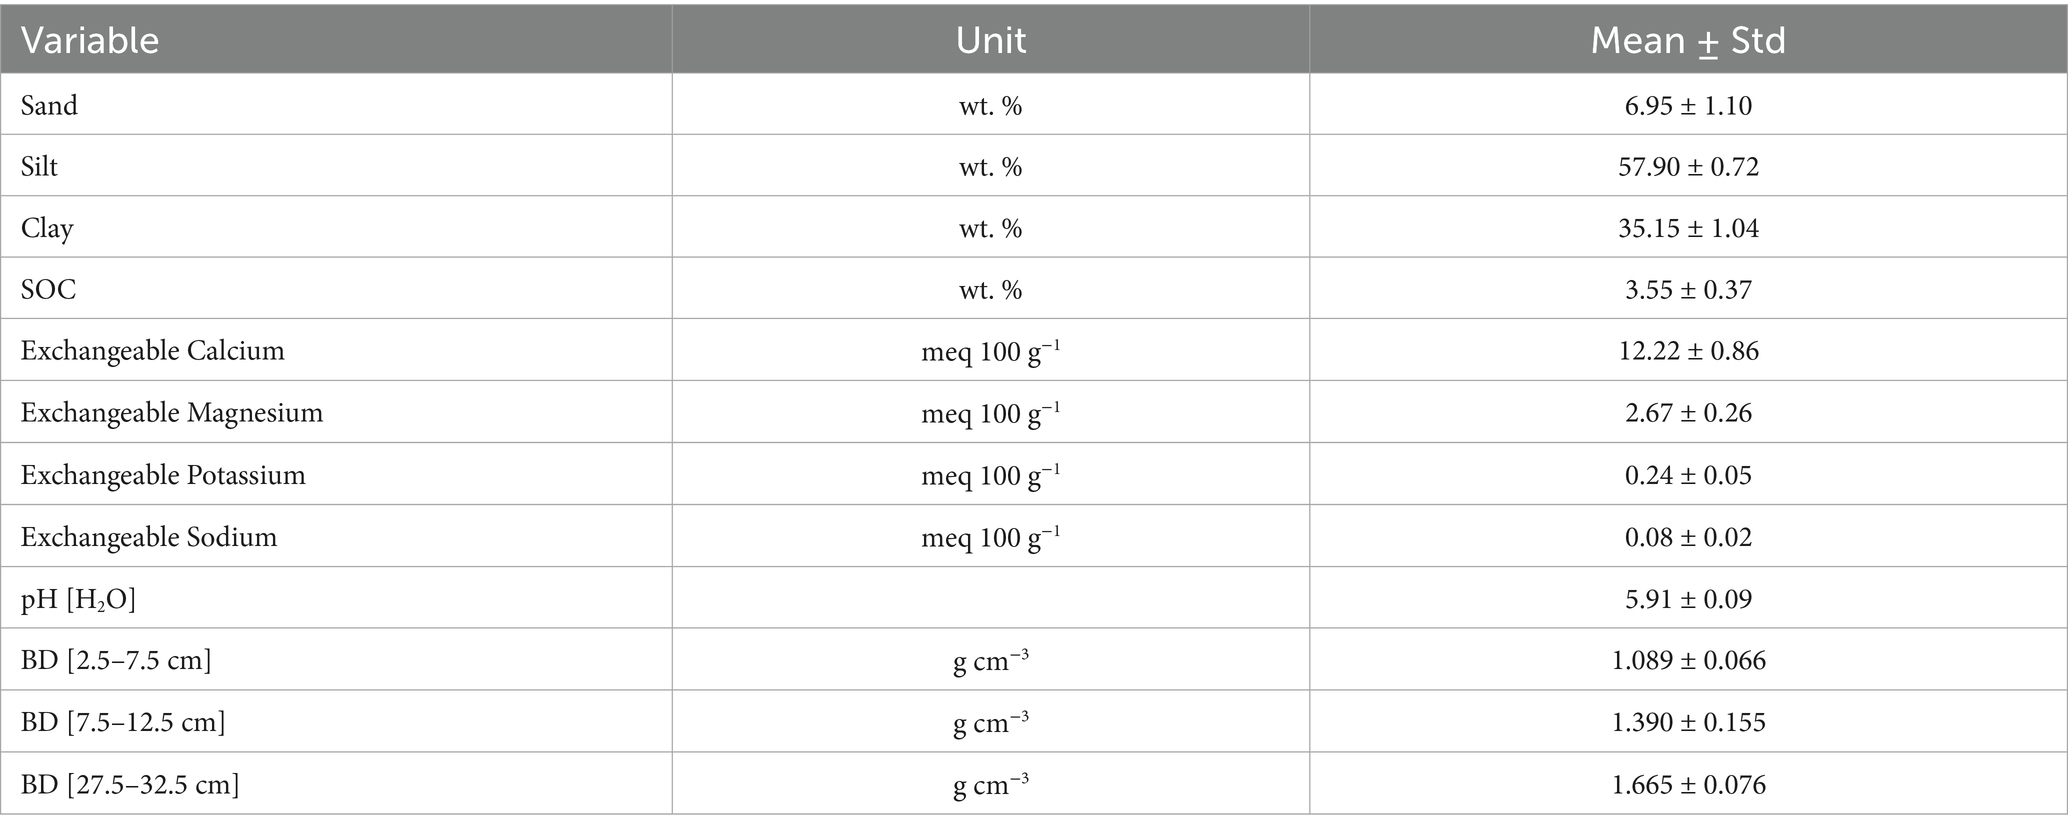
Table 1. Mean and standard deviation of baseline soil sample results for soil texture (sand, silt, clay), soil organic carbon content (SOC), exchangeable calcium, magnesium, potassium and sodium, soil pH determined on a 1:2.5 ratio of soil and deionized water, bulk density (BD) in three different depths (5, 10 and 30 cm).
2.3 Feedstock
For each of the treated fields, basalt from the Hillend quarry was applied. The quarry is situated in Airdrie, Ayrshire (55.88552 N; −3.88448 W) and is owned by Tillicoultry Quarries Ltd.
Eight kilograms of rock was taken from a quarry stockpile on the 10th August 2022. The mineralogy of the sample (using quantitative X-ray diffraction, XRD), chemistry (using X-ray fluorescence, XRF), particle size distribution (using laser diffraction analysis), and specific surface area (SSA; using 5-point Brunauer–Emmett–Teller (BET) methodology N2-adsorption analysis) were analyzed. Detailed methods for the mineralogical, chemical and SSA characterization referred to in this paper can be found in Skov et al., (2024) and Supplementary material S1 in this paper.
The samples contained 69.9 wt.% fast weathering minerals, when compared to mineral groupings from Lewis et al. (2021) (Table 2). The crushed basalt had a BET SSA of 0.917 m2g−1, and the D50 particle size was 1,006 μm. The particle size and whole-rock chemistry are described in the Supplementary Figure S1 and Supplementary Tables S1, S2, respectively.
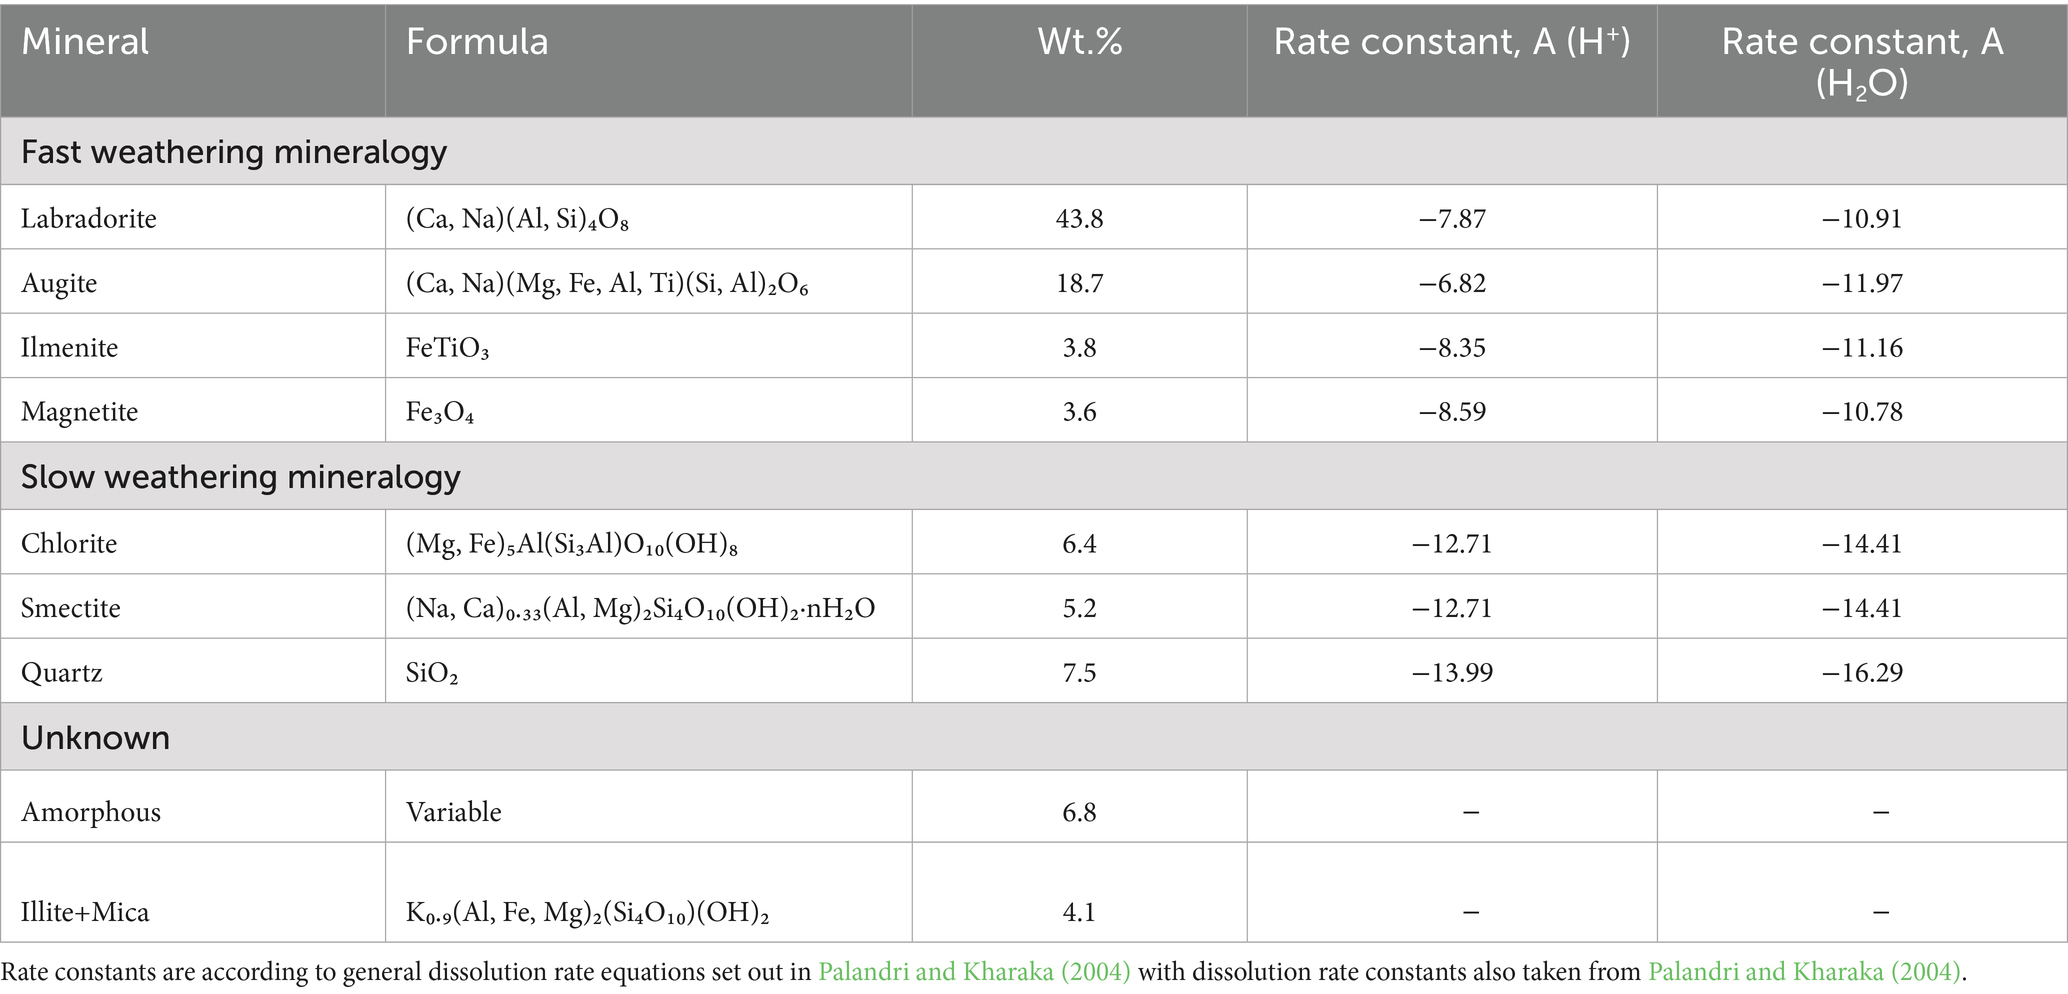
Table 2. Measured rock mineralogy, accompanied by log-dissolution rate constants for the acidic (H+) and neutral (H2O) dissolution rate mechanisms at 25°C.
2.4 Porewater extraction and measurement
The first porewater samples were collected from the rhizon samplers installed at the site on the 15th October 2022 (23 days after the basalt was applied to the fenced-off areas). Porewater samples were collected c. every 2 weeks (between 10 and 18 days) when soil saturation levels were sufficient for porewater extraction. Porewater was extracted using a vacuum that was set and left for 48 h (for the first 170 days, until 7th March 2023) or 24 h (for the last 410 days, from 21st March 2023 to 18th April 2024) to allow water to filter into a 30 mL plastic syringe.
After collection, the porewater samples were poured into clean, 50 mL polypropylene conical flasks and c. 3 mL of the solution was pipetted into a 15 mL falcon centrifuge tube and stored in a refrigerator before submission for Inductively Coupled Plasma Mass Spectrometry (ICP-MS) and ion chromatography (IC) analysis at Nottingham University. The ICP-MS and IC analysis methods can be found in Supplementary material S2, S3, respectively. pH was measured using an OMNIS Advanced Titrator with Magnetic Stirrer.
2.5 Soil monitoring sampling
Soil monitoring samples were collected from the same locations as the baseline soil samples, using dGPS to relocate the sampling points shown in Figure 1. The monitoring samples were analyzed for exchangeable cations, soil inorganic carbon, as well as soil pH, following the same procedure as for the baseline soil samples (Section 2.2; Supplementary material S4).
Baseline samples (Section 2.2) were taken the day before basalt application on the 19th September 2022. The following three monitoring samples were taken 4, 7 and 10 months after basalt application, whereas the last monitoring samples were taken in January 2025, one and half year after the previous monitoring sample and 28 months since the experiment began.
Additionally, on one singular sampling event, five composite samples each comprising 20 subsamples were taken in the control and 126 t ha−1 plots. The samples were taken to a depth of 10 cm and subject to ammonium acetate extractions to calculate inferred pCDR from exchangeable cations only (Section 2.6.2) by Weathering Industries Ltd.
2.6 Calculations of CDR
2.6.1 Maximum theoretical CDR (Epot equation)
The maximum theoretical CDR provides the maximum potential for CDR based on the oxide chemistry of the rock, given an infinite time window for weathering to occur (based entirely on thermodynamics and devoid of any consideration of kinetics). For this study, the maximum theoretical CDR was calculated using the Epot equation (Renforth, 2019) and additionally the value by the application density. The Epot value provides a CDR estimate on a per unit weight basis (e.g., mass of CO2 removed per mass of rock applied). This equation (Equation 1) considers the wt.% of various oxides (CaO, MgO, K2O, Na2O, P2O5 and SO3) measured via XRF analysis (Supplementary Table S1).
Where: is the molar mass of CO2 (44.01 g mole−1), M(oxide) and %(oxide) are the molecular masses and wt.% of each of the oxides given in the equation. The coefficients α, β, ε, θ, γ, δ relate to the potential of each oxide to remove CO2 from the atmosphere. At mildly acidic and circumneutral pH—α = 1, β = 1, ε = 1, θ = 1, γ = −1, δ = −1.5 (Renforth, 2019). ω accounts for the outgassing of CO2 via carbonate buffering in the ocean, based on the charge of the ion, as described in Renforth and Henderson (2017). For the purposes of this study, no outgassing is assumed throughout the document until it is discussed in Section 4.4. Therefore, for the purposes of the initial results provided, ω = 2 to account for the two bicarbonates which are balanced by either one divalent cation or two monovalent cations. AppD refers to the application rate of rock per unit area, which in this case is, tons rock per ha. The resulting value, Epot, in this instance is provided as tons of maximum CDR ha−1.
2.6.2 Potential CDR from exchangeable cations
Cations adsorbed to soil exchange sites were used to calculate inferred pCDR (referred to as ExPot) using the following Equation 2:
Where Mg2+, Ca2+, Na+ and K+ relate to the respective exchangeable moles (in mol kg−1) soil, BD is the bulk density (in kg m−3), D equals the depth (in m). For this study, an average BD of 1,380 kg m−3 across the 30 cm depth is assumed, based on bulk density measurements. The 1,000,000 converts grams to tons, and the 10,000 converts from m2 to ha.
Inferred pCDR was calculated by subtracting the control values (natural weathering) from the basalt amended values. This represents the ExPot values at a given time point, which may change seasonally (Dietzen and Rosing, 2023).
2.6.3 Potential CDR via pore water flux
The direct pCDR flux was calculated from porewater chemistry (as described in Section 2.1 and 2.4) and precipitation and evapotranspiration data. Evapotranspiration data (ET) was subtracted from the precipitation data (P) to calculate an assumed water flux being transported through the soil column (P-ET). For this calculation, the daily precipitation and reference evapotranspiration data at a resolution of 25 km was obtained from OpenMeteo, an open-source historical weather dataset which uses interpolation of neighboring weather stations to estimate weather conditions at any point on earth (Open-Meteo, 2025). Between any two porewater sampling time points, daily P-ET (in mm) was summed and converted to L ha−1. During dry periods where ET exceeded P (i.e., P-ET = 0), it is assumed that there was no movement of fluid through the column, and therefore, no direct pCDR.
The concentration of bicarbonate at each sampling event was estimated by balancing the equivalents of Ca, Mg, Na and K with bicarbonate according to Equation 3 (McDermott et al., 2024):
Where the elements in the equation are expressed in mol L−1. During the study period, no PO4 was detected, and Br was not measured—so both were omitted from the equation.
To obtain the flux of bicarbonate, the estimated bicarbonate concentration (mol HCO3− L−1) was multiplied by the accumulated P-ET in the interim period between sampling events over one ha (L ha−1) to obtain an area-normalized concentration of bicarbonate (mol HCO3− ha−1) at a given measurement point. It is assumed that the bicarbonate calculated from one measurement point to the next has been transported beyond the measurement point (e.g., 5 or 10 cm depth). The results were then cumulated, to obtain a cumulative flux after a given number of weathering days. The cumulative flux was then converted to tons CO2 ha−1 by multiplying the results by 4.401x10⁻⁵ mol ton−1, thus accounting for the molecular mass of CO2 (44.01 g mol−1) and conversion between grams and tons.
The cumulative bicarbonate flux from the control results (representing natural carbon removal via weathering, not additional carbon removal) was subtracted from the bicarbonate fluxes of each basalt amended treatment to obtain a time-integrated direct pCDR estimate for the project period. For statistical analysis, the cumulated direct pCDR value after 576 days (18th April 2024) was used.
2.7 Statistical analysis
The cumulated bicarbonate flux between treatment plots relative to the control in both depths (5 and 10 cm) was evaluated statistically at the end of the porewater timeseries, after 576 days (c. 1.5 years). The overall effect of basalt amendment on the cumulated bicarbonate flux, estimated from porewater samples, was evaluated using an Ordinary Least Squares model (OLS) with treatment as a continuous explanatory variable. In order to evaluate the relative differences between the plots/treatments, the prediction interval around the linear models were inspected. The estimated inferred pCDR from exchangeable cations, ExPot and soil pH was evaluated using a GLM with a gaussian distribution family and treatment and sampling date as interacting, categorical variables. To account for inter-plot variability the mean ExPot and soil pH in the baseline samples, the baseline was subtracted at each monitoring sampling event. The model assumptions were evaluated using Shapiro–Wilk (for normality) and White’s Lagrange multiplier test (for homoscedasticity). Statistical analyses were carried out using Python (version 3.9) and the package Statsmodels (version 0.14.4, Seabold and Perktold, 2010).
3 Results
3.1 Porewater chemistry and flux data
The raw porewater concentration data for calcium, magnesium, sodium and potassium, as well as pH and electrical conductivity (EC) from both extraction depths are shown in Figure 3. Data for iron, barium, strontium, chloride, nitrate, sulfate and fluoride are plotted in Supplementary Figure S2. Porewater pH varies between 3.6 and 7.6 (Figures 3A,G), and EC between 2.3 to 304.9 μS m−1 (Figures 3B,H), respectively. The cation concentrations were ranked in descending order according to their magnitude as follows: calcium > sodium > magnesium > potassium.
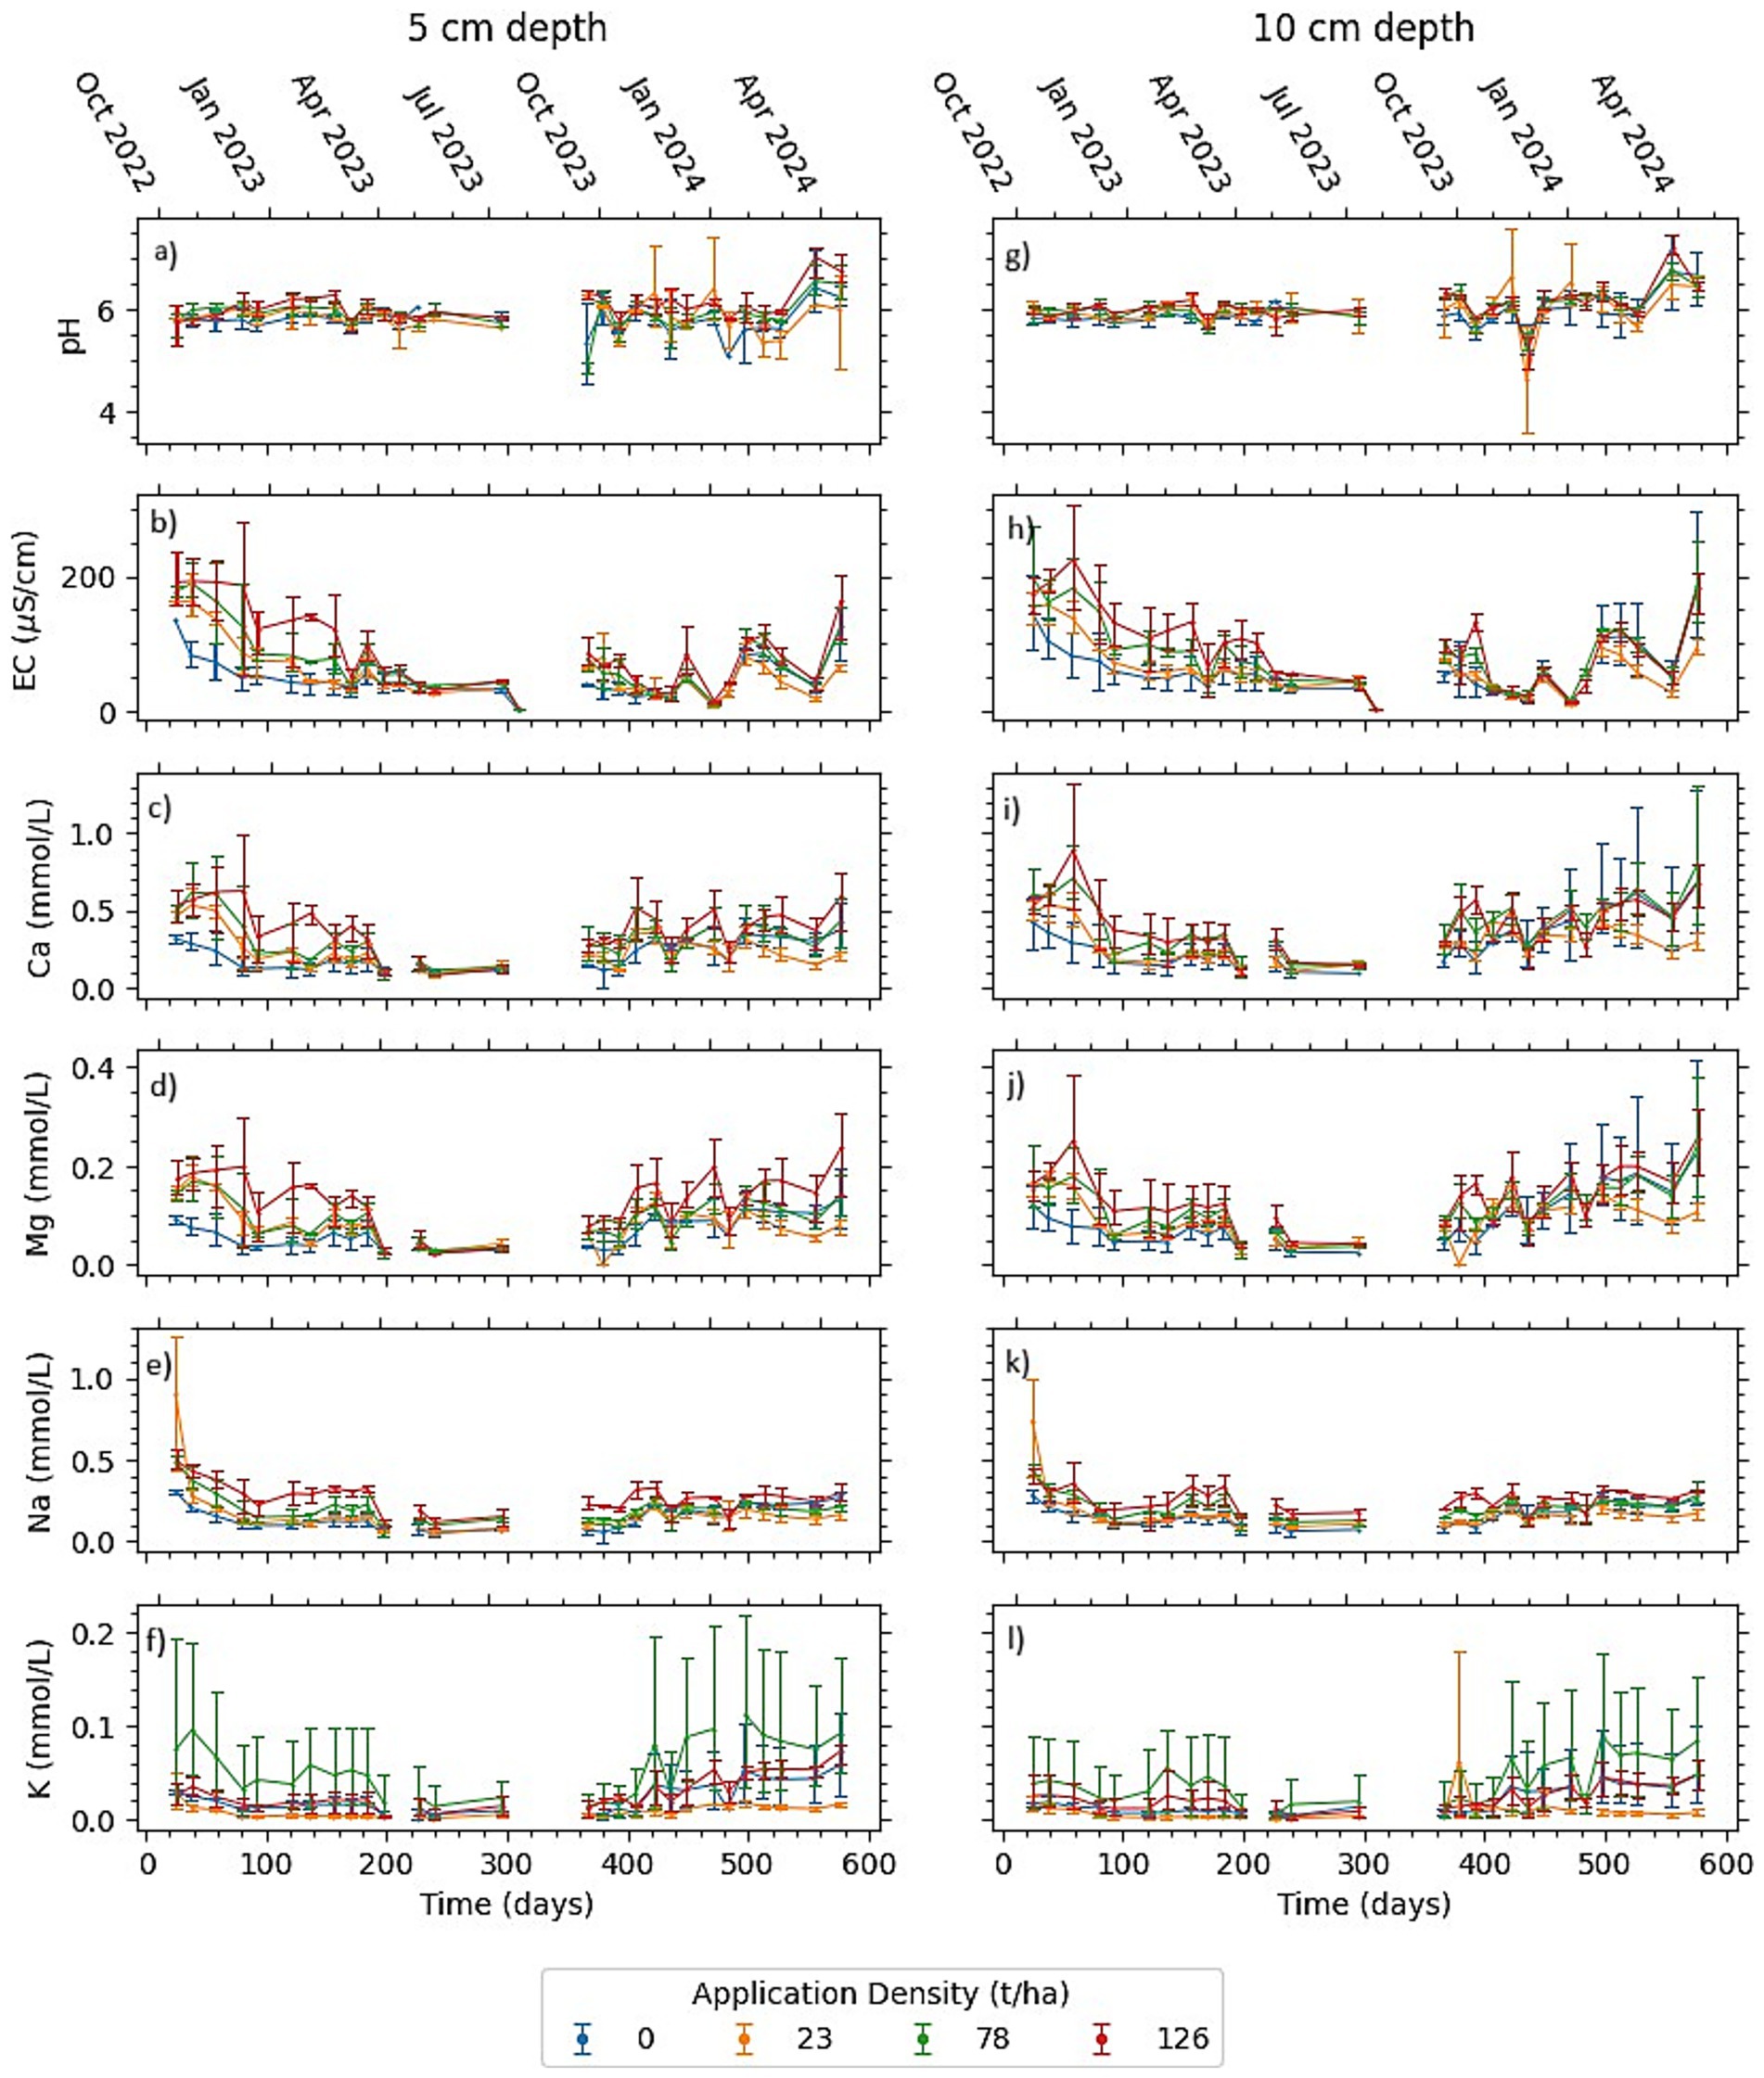
Figure 3. Porewater chemistry throughout the experimental duration at 5 cm depth (a–f) and 10 cm depth (g–l). Points represent mean values, and error bars represent minimum and maximum values (n = 3) for each sampling event.
Largely, higher calcium, magnesium and sodium concentrations were identified in basalt amended treatments (e.g., 126 > 78 > 23 > 0 t ha−1). This trend is also evident in the magnesium and sodium time series, relative to calcium (Figures 3C–E,I), indicating weathering. Calcium concentration is often more variable in soils (Dietzen and Rosing, 2023), which could explain the greater variance in the measured calcium concentrations in the pore water. EC data also broadly follows the same trend of values in the plots that received basalt amendment (Figures 3B,H), indicating a measurable contribution of ions introduced by basalt weathering to the ionic strength of pore water solutions. Potassium concentrations are consistently higher and more variable at any given time point in the 78 t ha−1 treatment relative to all the other treatments (Figures 3F,L). Variation in the 78 t ha−1 treatment was most likely the result of the natural and unexplained variability of one rhizon. Variability in K concentrations were not identified in baseline soil samples (Section 2.2).
The pH data are highly variable, with no discernible trends (Figures 3A,G), suggesting the involvement of pH buffering reactions involving cation exchange (Weil and Brady, 2016), organic matter (Stevenson, 1995), surface complexation (Dzombak and Morel, 1991) and microbial and root respiration (Paul, 2013).
The results of porewater concentration data converted into bicarbonate flux are presented in Figure 4. Data from the control plot indicate that natural bicarbonate fluxes vary between 0.438 ± 0.09 and 0.656 ± 0.321 tCO2 ha−1 in the 5 and 10 cm samples over the duration of the porewater time-series.
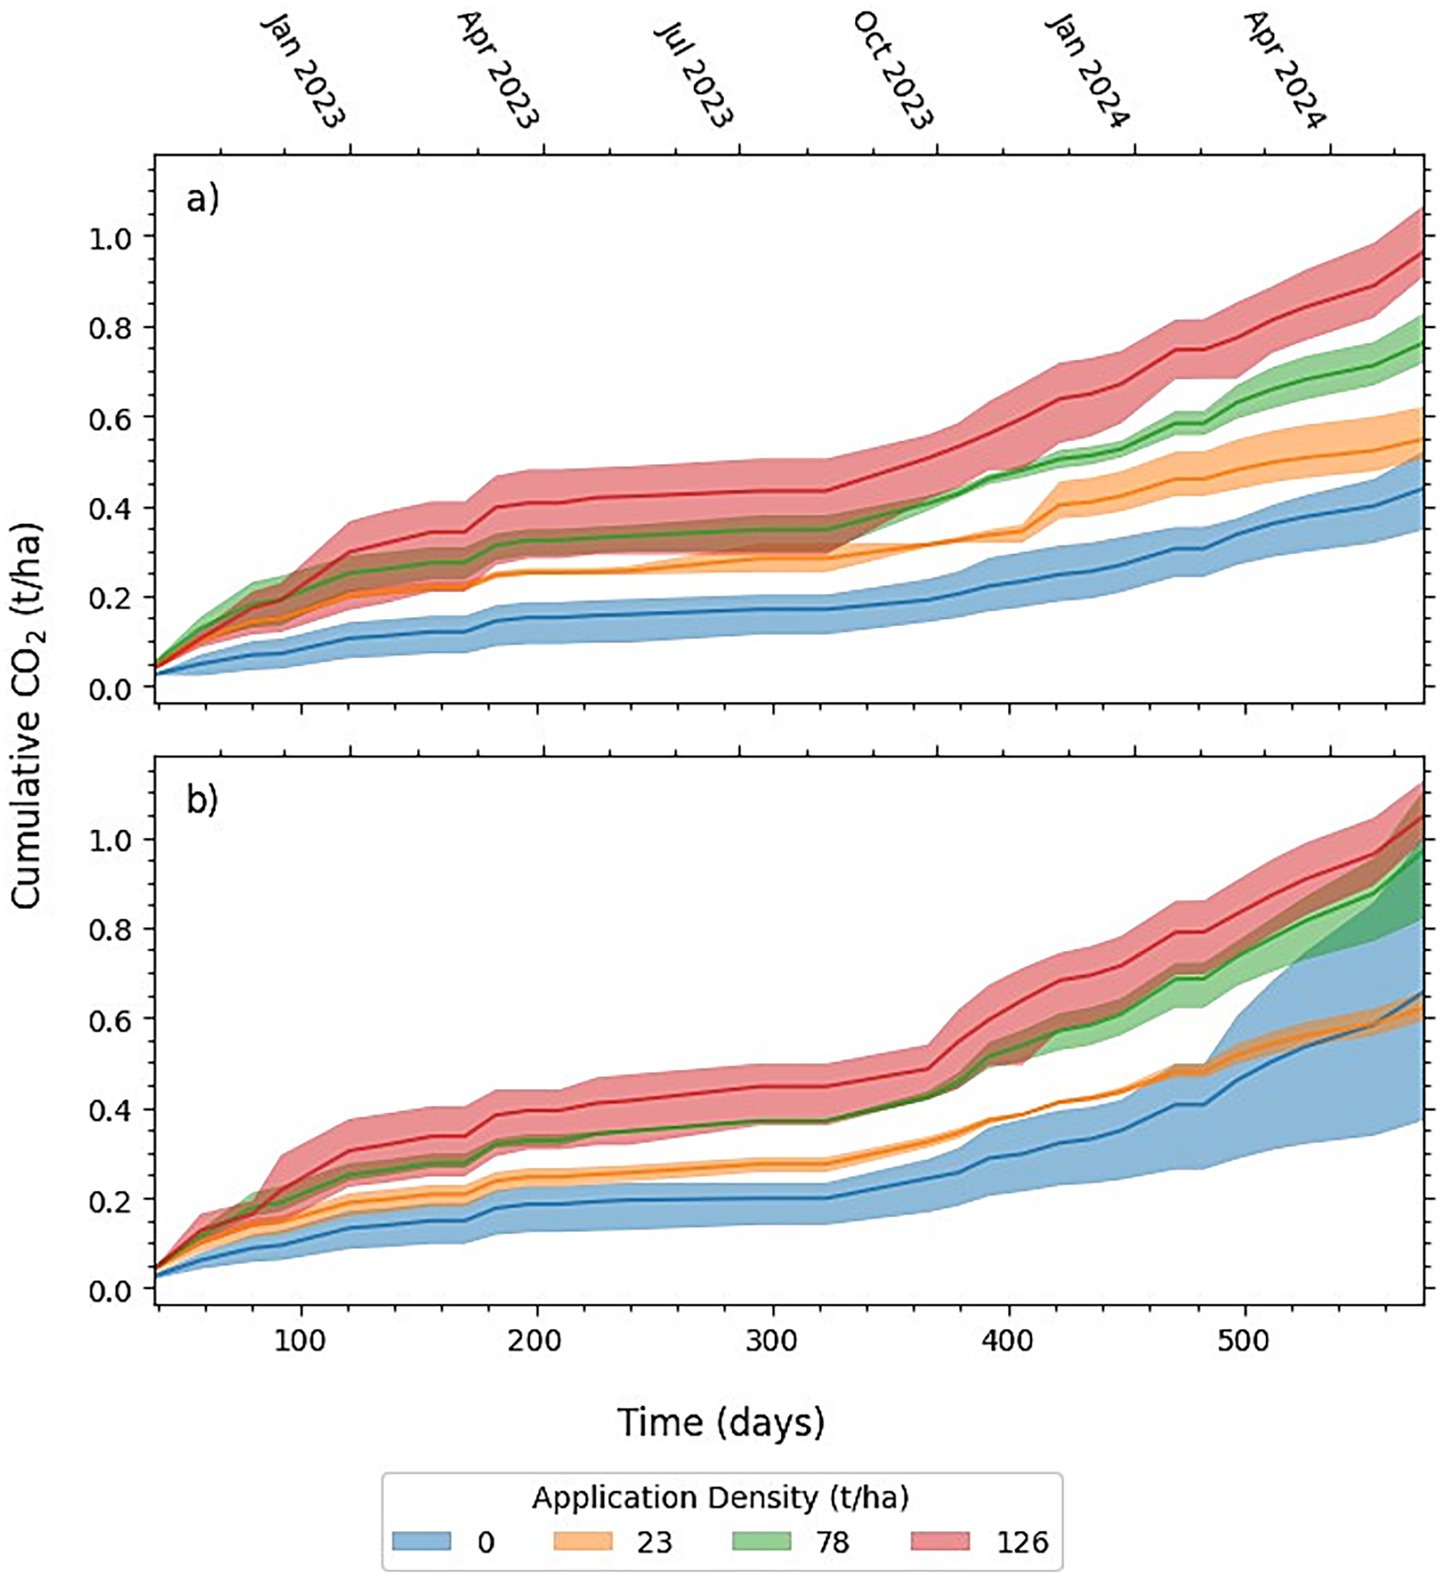
Figure 4. Cumulative direct potential CO2 removal (direct pCDR), estimated using the charge balance equation described in Equation 3 from depths of 5 cm (a) and 10 cm (b). Data from 0 t ha−1 represents non-additional CDR from background weathering.
After 576 days of rock weathering, a strong overall dependency of basalt amendment on the cumulated bicarbonate flux was found at both 5 and 10 cm depth (p < 0.005 in the OLS). The two models showed that the treatment accounted for a very large part of the variability in the cumulated bicarbonate flux, with R-square values of 0.91 and 0.56, for the 5 and 10 cm depth, respectively. The statistical models met model assumptions.
The prediction intervals between the control and the two high applications (78 and 126 t ha−1) did not overlap in the porewater time series from 5 cm depth (Table 3). Despite the significant overall effect of basalt treatment on the cumulated bicarbonate flux in 10 cm, the prediction intervals for the control group overlapped with the prediction intervals for the treatments, indicating no statistical difference due to the variability in the control data (Table 3). When comparing the control to the basalt amended treatments in treatments where prediction intervals did not overlap, the mean difference±std. varied between 0.33 ± 0.11 and 0.53 ± 0.13 tCO2 ha−1 (Table 3) as direct pCDR.
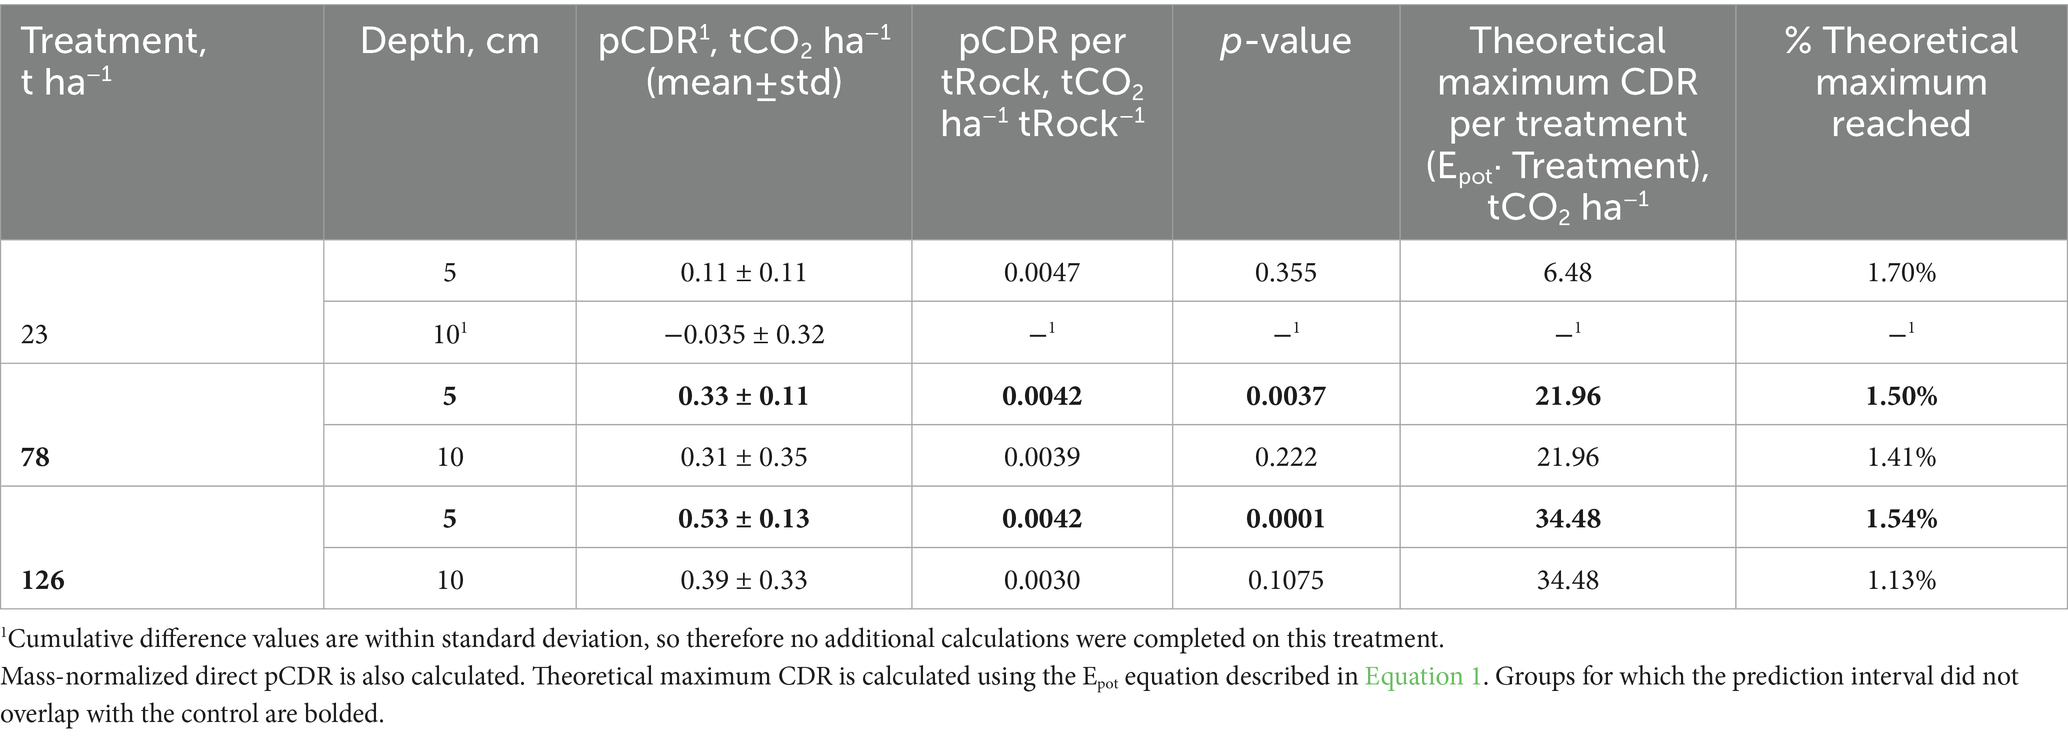
Table 3. Direct potential carbon dioxide removal (pCDR) from the 5 cm depth samples after 576 days, as calculated by subtracting the control from basalt amended treatments.
3.2 Soil chemistry
Major exchangeable cations (calcium, magnesium, sodium and potassium) and soil pH were determined on soil samples taken to a depth of 30 cm across the four plots (Figure 1) at five time points during this experiment. The sum of the major exchangeable cations is shown in Figure 5. The results indicate that there is high variability both within and between the plots. The variability appears to be the greatest in the spring and summer samples from 2023. Both the baseline and the samples from January 2025 were also analyzed for soil inorganic carbon, to track the precipitation of carbonates, but all results were below the detection limit (0.1 wt.% inorganic carbon). Observing no precipitated inorganic carbon indicates that under the conditions observed in this experiment, that direct pCDR occurred only through the generation of bicarbonate. This was expected, given the pH conditions were below pH 7 (Figures 3, 5).
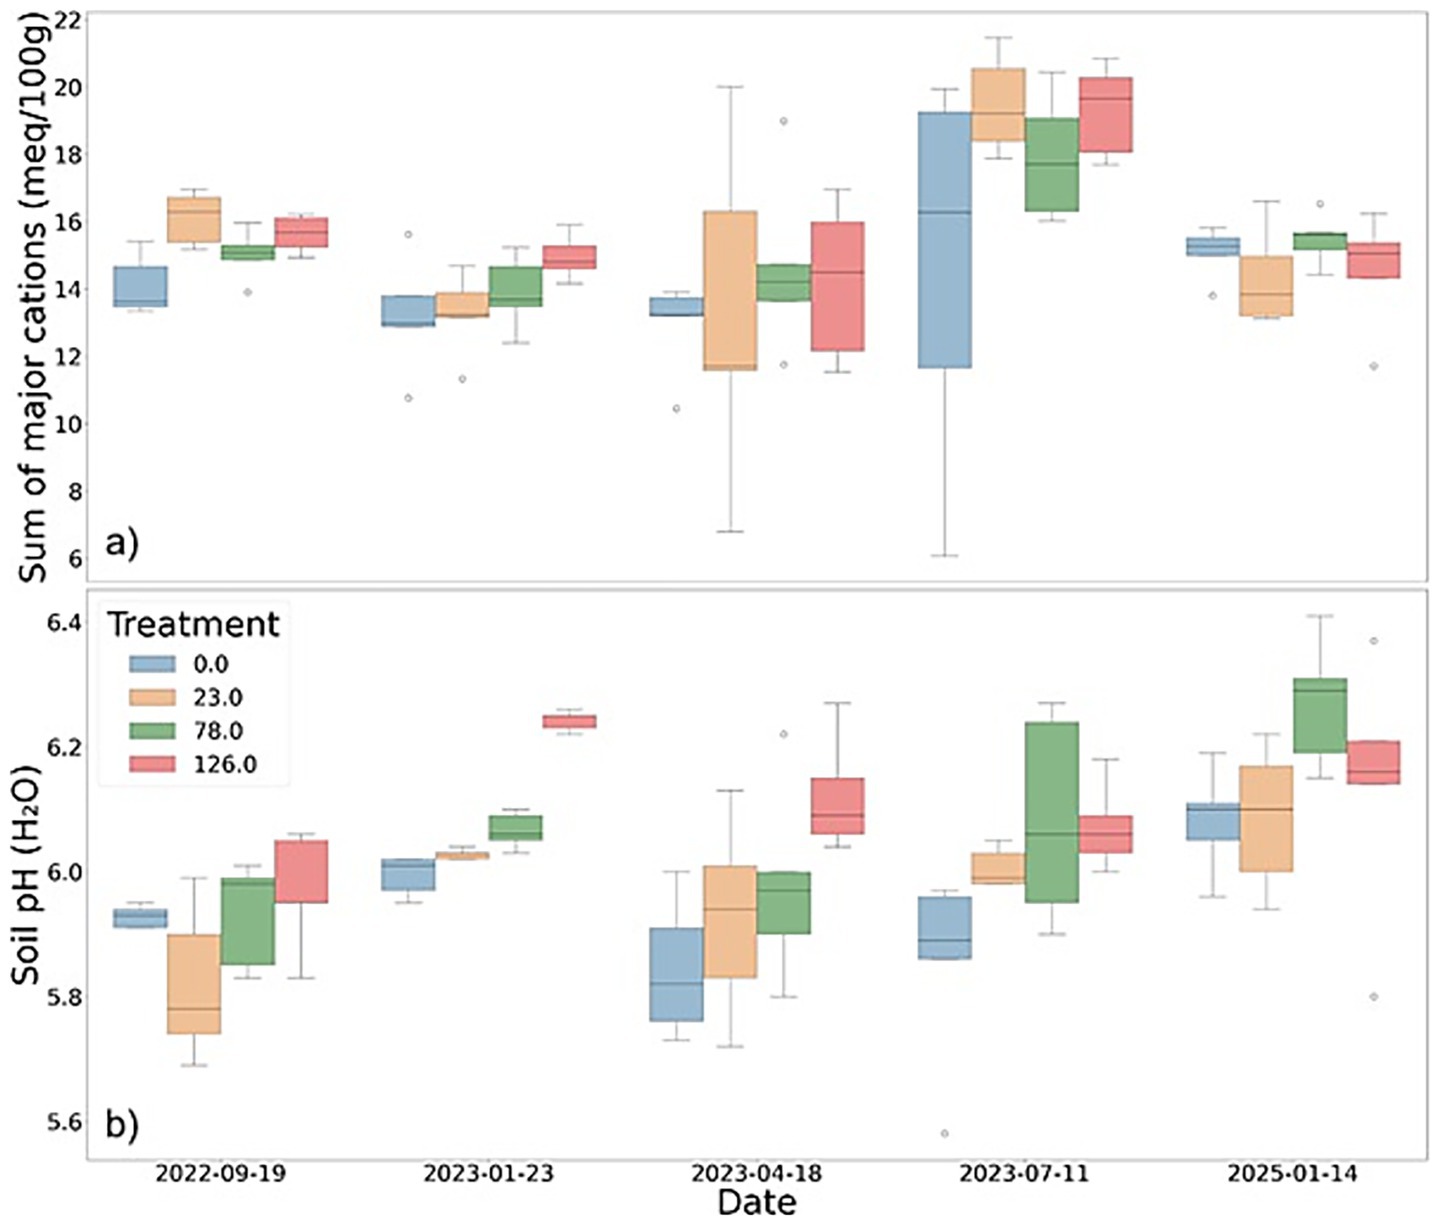
Figure 5. Sum of major cations (calcium, magnesium, potassium and sodium) in meq 100 g−1 in each plot and for each soil sampling event (a) pH (determined on a 1:2.5 ratio of soil to H2O; (b).
Contrary to Figure 5, data from the single time point (July 2023) between control and 126 t ha−1 when ExPot was calculated on composite samples from a 0–10 cm depth identified statistically significant increases in ExPot in the 126 t ha−1 treatment relative to the control. Significantly higher concentrations of calcium and sodium in the high application plot (p < 0.05, ANOVA) and marginally higher magnesium, as well as marginally lower potassium (Supplementary Figure S3). Overall, this led to a statistically significant inferred pCDR of 1.909 tCO2 ha−1 (Supplementary Figure S3).
While the soil pH was significantly higher than the control in the highest application plot (126 t ha−1) on the 23rd January 2023 (after c. 4 months) and 18th April 2023 (after c. 7 months), as well as for 23 and 78 t ha−1 on the 11th July 2023 (after c. 10 months, 126 t ha−1 was only marginally significant, p = 0.065; Supplementary Table S2), no significantly higher ExPot is observed in any of the time points measured in this study between the control and any treatment (Supplementary Table S3). This suggests that the exchange pool represents a large pool of retained metal ions, by comparison with the metal concentrations in porewaters. In this scenario large relative changes in porewater concentrations would be accompanied by small relative changes in exchanger loadings.
4 Discussion
4.1 Overall experimental drawbacks
A key limitation to the experimental design in this study is the absence of plot replication; there was only one plot per treatment. A range of experimental designs for EW studies have been published previously, including paired catchments (control and amended; e.g. Larkin et al., 2022; Taylor et al., 2021), strip designs (e.g., Holden et al., 2024), split field designs (e.g., McDermott et al., 2024) and randomized block designs (e.g., Deng et al., 2024; Stubbs et al., 2025). These experimental designs are typically more statistically robust than the experimental design used to generate data in this study and as such the differences identified in this study should be evaluated with caution.
The experimental design presented in this study was initially designed to investigate whether pH and EC sensors could be used to fill the temporal gaps between porewater sampling events. Hence, the rhizon samplers were installed in soil pits in close proximity with the soil sensors with the aim of identifying empirical relationships between soil sensor data and porewater sample results. A key advantage of sensor-based measurements is that they would generate continuous data, rather than at discrete time intervals, which could be used to extrapolate direct pCDR using precipitation surplus (P-ET) data, as presented here. This is discussed in detail in Section 4.2. Due to the cost of sensor installation and the requirement for a central data logger for each 10 sensor pairs of pH and EC sensors, it was not financially feasible to install sensors across replicated plots. Unfortunately, the acquisition of soil sensor data was terminated due to vandalism at the experimental site.
Suitable porewater baseline samples would require multi-year sampling to account for both seasonal and inter-year variability. However, obtaining initial porewater samples before the rock was applied would have been useful for ensuring the soil had re-equilibrated following rhizon installation and for confirming whether, for a short period before the experiment took place, that the plots were statistically similar to each other. There were significant differences in the baseline soil samples for exchangeable calcium and magnesium as these were the only two variables which were significantly different in the baseline samples. However, the mean±std. for exchangeable calcium and magnesium varied by only 7 and 10% between the baseline samples.
4.2 Porewater data
Direct pCDR from cumulative porewater was significantly explained by the application of basalt in both 5 and 10 cm depth (OLS r2 = 0.912 and r2 = 0.56 for 5 and 10 cm, respectively), at the end of the 1.5 year long porewater time series. Where the prediction intervals for treatments did not overlap with the control in the 5 cm sampling depth (78 and 126 t ha−1), linearity is observed between the tons of rock applied and percentages of CDR (Table 3) with mass-normalized-pCDR of 0.0042 tCO2 ha−1 tRock−1.
The results also indicate that direct pCDR observed in the porewater accounts for only a small amount of the maximum theoretical CDR calculated through the Epot equation—between 1.1 and 1.7%. These low percentages may indicate low weathering rates. In this experiment, the feedstock was not amended into the soil profile, but was surface-applied on the grassland and therefore was not exposed to the higher pCO2 observed in soil profiles (e.g., Nan et al., 2016). Moreover, the feedstock applied in this study was coarse grained with a D50 of 1,006 μm (e.g., Supplementary Figure S1). The theoretical maximum CDR does not take rock dissolution kinetics into account. Rock dissolution rates are influenced by the amendment’s specific surface area (which in turn is influenced by particle size and mineralogy; Lewis et al., 2021) and mineralogy (e.g., structural location of the cations), while Epot values only use whole rock chemistry. These results confirm that it is not appropriate to use Epot values to predict CDR in agricultural EW studies over annual timescales. It is not possible to test at what time scale an Epot value is appropriate for, however, the value could be useful for comparing feedstock to select appropriate rock sources (Clarkson et al., 2024).
Given that the study duration is 1.5 years, the statistically significant CDR observed, ranging between 0.33 and 0.53 tCO2 ha−1 over c.1.5 years of weathering, as well as the linearity observed, may evolve over longer timeframes. Initial weathering rates tend to be higher due to the dissolution of finer particles and higher SSA asperities (e.g., Power et al., 2025). However, the detection of weathering signals may experience a time lag, as cations can initially be absorbed onto exchange sites, with a greater fraction of the weathering products remaining in pore water after several years (Kanzaki et al., 2024). The results presented in this study, therefore, should be considered as site- and time-specific. Additionally, the application of 78 or 126 t ha−1 of rock amendment, where significant CDR is observed, are not operationally applied to agricultural land.
There are some limitations to using a porewater time series alone for direct pCDR estimations, and the results presented in this paper most likely represent the minimum direct pCDR over the measurement period. While the determination of the soil porewater concentration of bicarbonate at a particular point in time is the most direct measure of the instantaneous pCDR reservoir in the topsoil (Clarkson et al., 2024), using these measurements for temporal extrapolation have limitations including: (1) seasonal variability, (2) limited sampling duration and frequency and (3) practical limitations. Seasonal variability in both the water flux through the soil (i.e., the transport of CDR products to the groundwater; Figure 2) and porewater concentrations (Figure 3) were observed in this study, with Δbicarbonate varying by c. 2 orders of magnitude between time points over the year (Figure 4). This implies that the timing of porewater sampling in relation to rain events is pivotal to avoid missing a signal. Time series analysis has shown strong correlation (r2 = 0.57, p = 0.0014) between rainfall averaged over a 10-day period prior to sampling and porewater cation concentrations (Betz et al., 2025). As the porewater sampling takes place over c. 24 to 48 h approximately every 2 weeks (in periods of sufficient soil moisture to extract porewater), the sampling period represents <14% of the total time integrated.
Additionally, the first porewater samples were taken 25 days after the rock application, due to insufficient soil moisture for porewater collection. Between the time of rock application and the first measurement, the fields were subjected to a total water flux (P-ET) of 106 mm. Weathering rates may decrease over time, and the results could be skewed by missing this initial weathering signal (Power et al., 2025). Therefore direct pCDR may have been underestimated.
Even if the sampling timing is based on analysis of the relationship between rain events and porewater concentration (Betz et al., 2025), the logistical challenge in collecting soil porewater is primarily governed by the availability of sufficient water yield. A potential solution for the latter utilizes centrifugation of soil samples (e.g., Jones et al., 2025). Integrating different instrumentation, such as passive wick drainage flux meters (as implemented in Holden et al., 2024) or hydrologically isolated plots which both collect water continuously may avoid these issues. Soil porewater extraction is notoriously known to be labor-intense with no guarantee of porewater yield, as samplers may lose vacuum or be ineffective at low moisture levels, leading to insufficient volumes of sample obtained for chemical analysis. The macro rhizons used in this study to collect porewater are also considered consumable, with an expected lifespan from the manufacturers stated as 6 months. Dry summers and cold winters affected the longevity of the rhizons in this study, but replacement is carried out with minimal disturbance.
Despite these drawbacks in the experimental data, the method to calculate flux based on daily, rather than monthly or annual, precipitation surplus data (P-ET), is likely to provide a more accurate indication of direct pCDR due to seasonality (e.g., Figure 2). Furthermore, as stated above, correlation data between rainfall averaged over 10-day periods also suggests that monthly P-ET values may not be sufficient when integrating precipitation surplus and concentration data to obtain direct pCDR estimates. This method could be improved in future iterations by incorporating soil hydrology into flux calculations.
4.3 Soil data
Overall, no statistically significant changes were observed in the ExPot (Supplementary Table S3), which is likely a result of the experimental set-up and sampling design. The concentration of exchangeable cations in the soil samples taken in the treated plots was not significantly higher than in the control in any of the monitoring sample events (Figures 5, 6; Supplementary Table S3). This is despite soil pH readings appearing different for the highest application rate on several occasions (Figure 5; Supplementary Table S2). Several potential reasons for the lack of differences in the inferred pCDR stored on the soil exchangers have been identified, including: (1) inherent soil variability, (2) spreading heterogeneity, (3) sampling frequency and (4) basalt application strategy. The variability in exchangeable cations observed in this study suggests that compositing of multiple samples into one may be useful in decreasing within treatment sample variability. Further, the size of the baseline ExPot reservoir is large compared to direct pCDR measured from pore water (c. 1 order of magnitude), and so natural variation within soil could readily exceed the signal from any accumulated cations due to the EW process. The soil samples were taken within the greater plot boundaries where basalt was applied using a commercial lime spreader. Due to the inherent variability in spreading rate when using commercial equipment, it is likely that differences between the plots may have been discernible had the sampling density been higher. Additionally, the accumulation and flushing of inferred pCDR on exchangeable cations is likely to be time sensitive (Dietzen and Rosing, 2023), so infrequent sampling may have missed the accumulation peak before flushing.
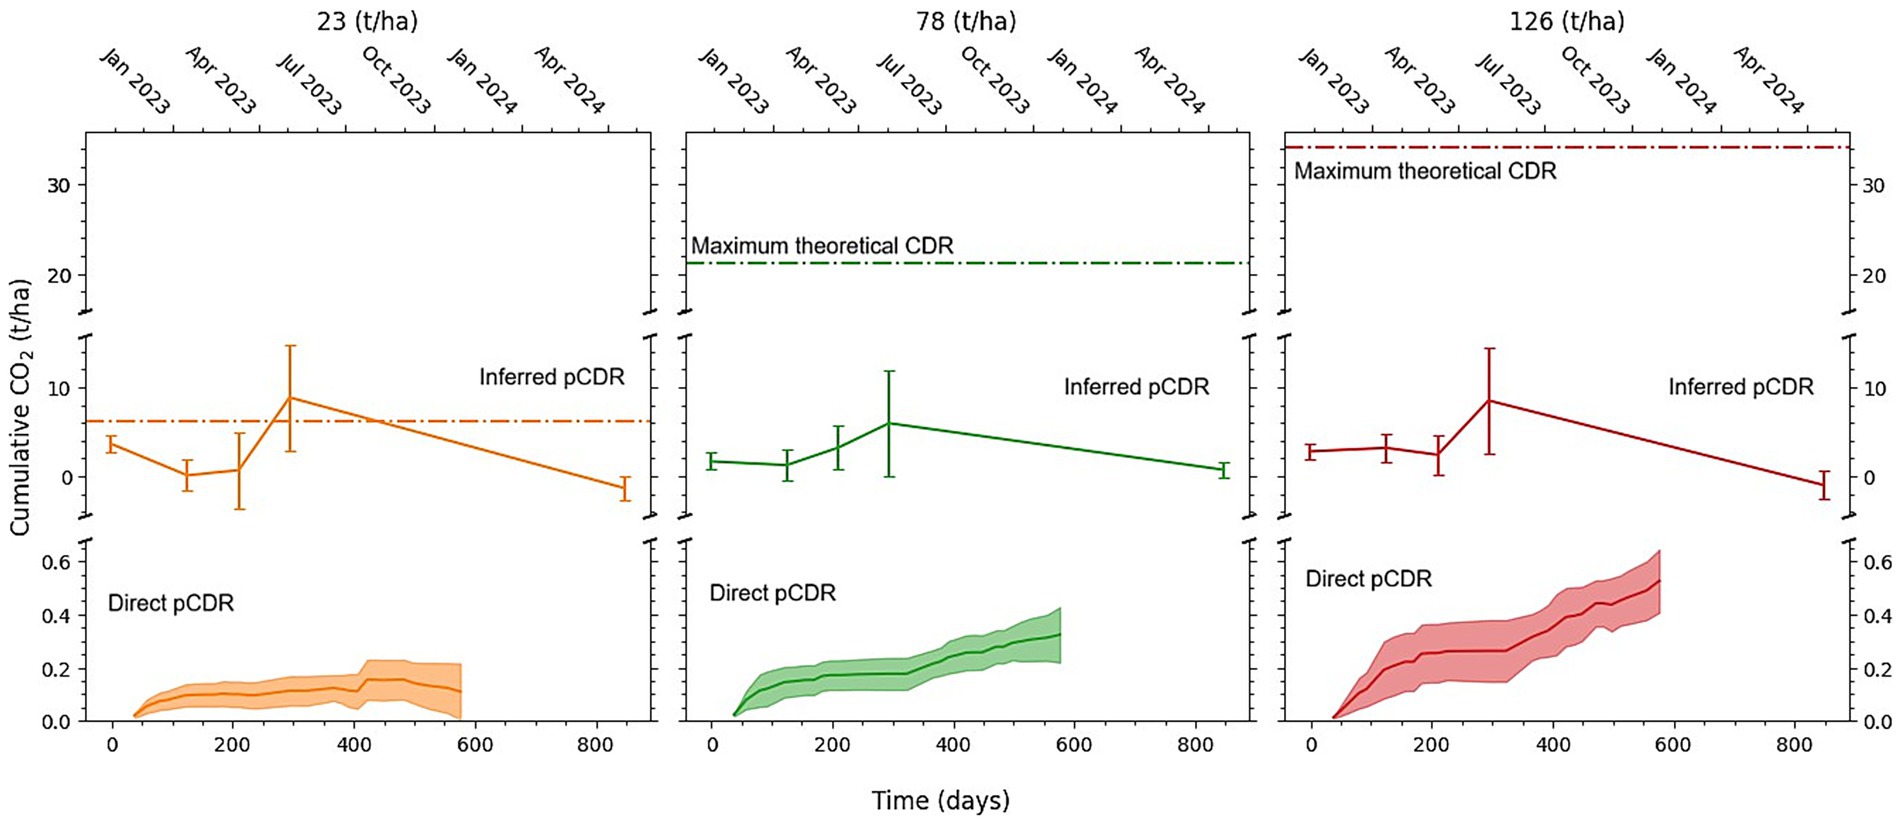
Figure 6. Comparison of potential CO2 removal (pCDR) for the different basalt amended controls (23, 78 and 126 t ha−1) with the control subtracted from the treatment, using three different methods: porewater flux (direct pCDR, cumulative curve with error envelope), exchangeable cations (inferred pCDR), point measurement with error bars and maximum theoretical CDR (dashed line), to assess pCDR. Porewater was collected from 5 cm depth, while exchangeable cations came from soil data collected from the 0–30 cm depth.
The 30 cm sampling depth may have diluted any top soil differences, as evidenced from the singular time point tested in July 2023, where five composite samples each comprising 20 subsamples were taken to a depth of 10 cm from the control and 126 t ha−1 plots, respectively. These values identified an ExPot inferred pCDR of 1.909 tCO2 ha−1 (Supplementary Figure S3), without accounting for the deduction factors which are briefly discussed in Section 4.4.
4.4 CDR deductions
The direct pCDR values presented so far assume that all the pCDR calculated in the porewater will remain in solution. However, outgassing from riverine (i.e., equilibration of soil water into riverine water; Zhang et al., 2022, 2025; Harrington et al., 2023) and oceanic outgassing (due to carbonate buffering; Renforth and Henderson, 2017) can reduce CDR efficacy by 22% (Table 4). Riverine losses and ocean losses are likely to be highly dependent on catchment/environmental conditions (Zhang et al., 2022; Harrington et al., 2023), however, a factor of 5% is applied in this study based on results from Zhang et al. (2025). Oceanic carbonate buffering will reduce the CDR efficacy by 13–17% (Renforth and Henderson, 2017), depending on ocean temperature, salinity and atmospheric CO2 concentrations.
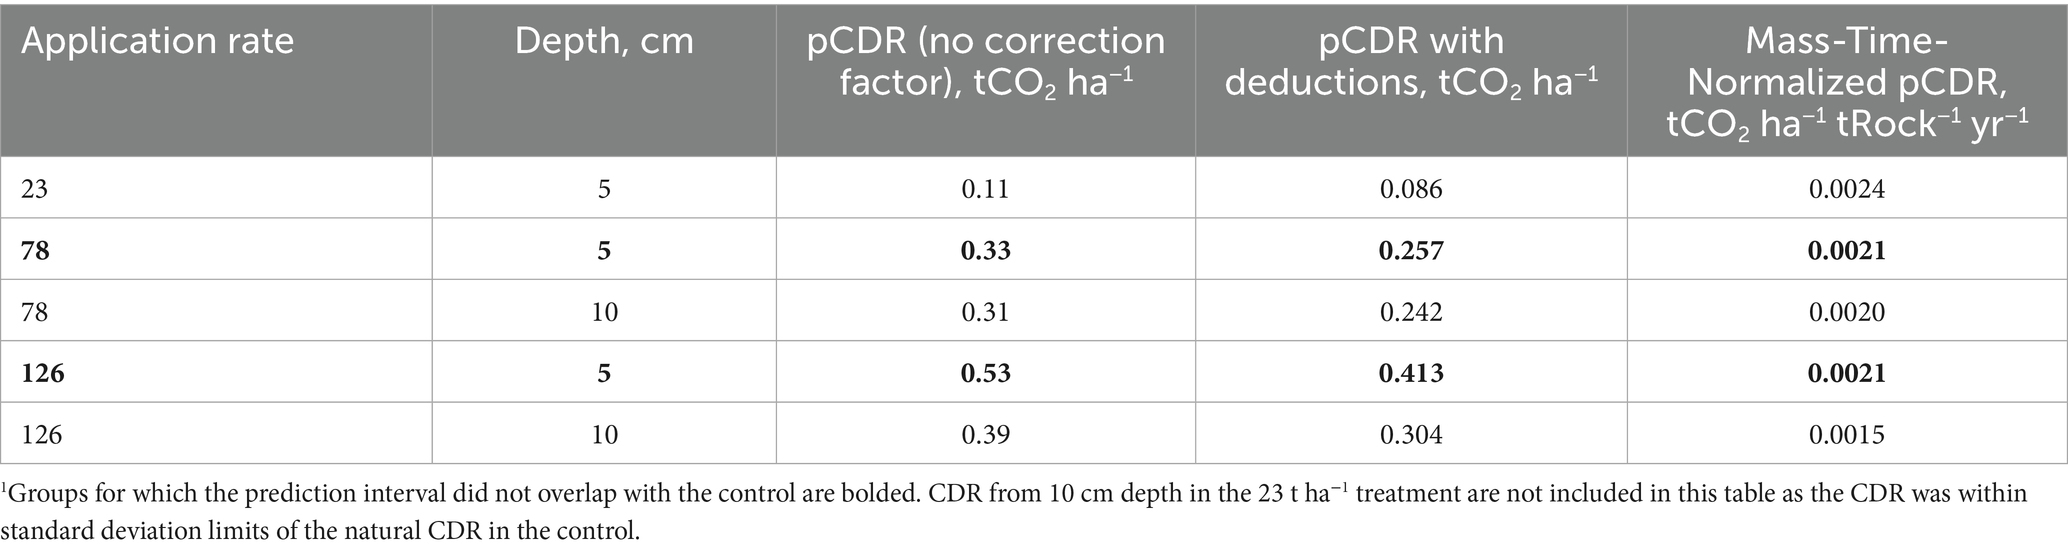
Table 4. Direct potential carbon dioxide removal (pCDR) with a 22% deduction, as described in Section 4.4 applied.
Strong acid weathering is already excluded when calculating alkalinity by charge balance via Equation 3, but to calculate the net CDR from porewater data, additional deductions need to be taken for plant uptake. Plant uptake could have occurred in this trial because grass species typically root down to 10 cm depth (Schenk and Jackson, 2002), and therefore the cations measured during this study (particularly K), could be taken up by plants. However, the site was intermittently grazed and no grass cuttings were taken during the duration of the trial to confirm this. Moreover, grazing did not occur directly above the porewater rhizon samplers, as the central parts of the plots were fenced off. Hence any uptake of cations in the grass would be returned to the soil at senescence and therefore grass yields and chemistry were not determined. In addition to appropriate deductions for losses and leakages, a full life cycle analysis of all emissions associated with activities during the project lifetime would also have to be conducted to calculate net CDR (e.g., Puro, 2024; Sutherland et al., 2024).
4.5 CDR comparisons with other field studies
The estimated direct pCDR, based on porewater data in this study (0.257–0.413 tCO2 ha−1 after deductions, Table 4), sits within the range of published data (0.025–0.55 tCO2 ha−1; Table 5) from previous EW studies that used aqueous sampling to deduce CDR (Kukla et al., 2024). However, there are challenges when comparing different EW studies due to the variety of climatic, soil and rock conditions used in field trials data. Given that a linear relationship between application rate and direct pCDR was observed in this study, inter-study CDR comparisons are discussed after being normalized per ton of rock applied and per year (tCO2 ha−1 tRock−1 yr.−1 and referred to as mass-time-normalized). Caution should be taken when interpreting mass-time-normalized CDR (or pCDR) or extrapolating further than simple comparisons; linear relationships are not always observed in enhanced weathering studies (Rijnders et al., 2024) and only three data points are used to interpret this trend, and only two of these were significant. Additionally, within the published studies cited in Table 5, several were subject to repeat basalt applications. Where measurements are taken at depths below 1 m depth (e.g., well below the NFZ), CDR is referred to as CDR while above 30 cm depth follows the same nomenclature as the results provided in this study and is referred to as direct pCDR.
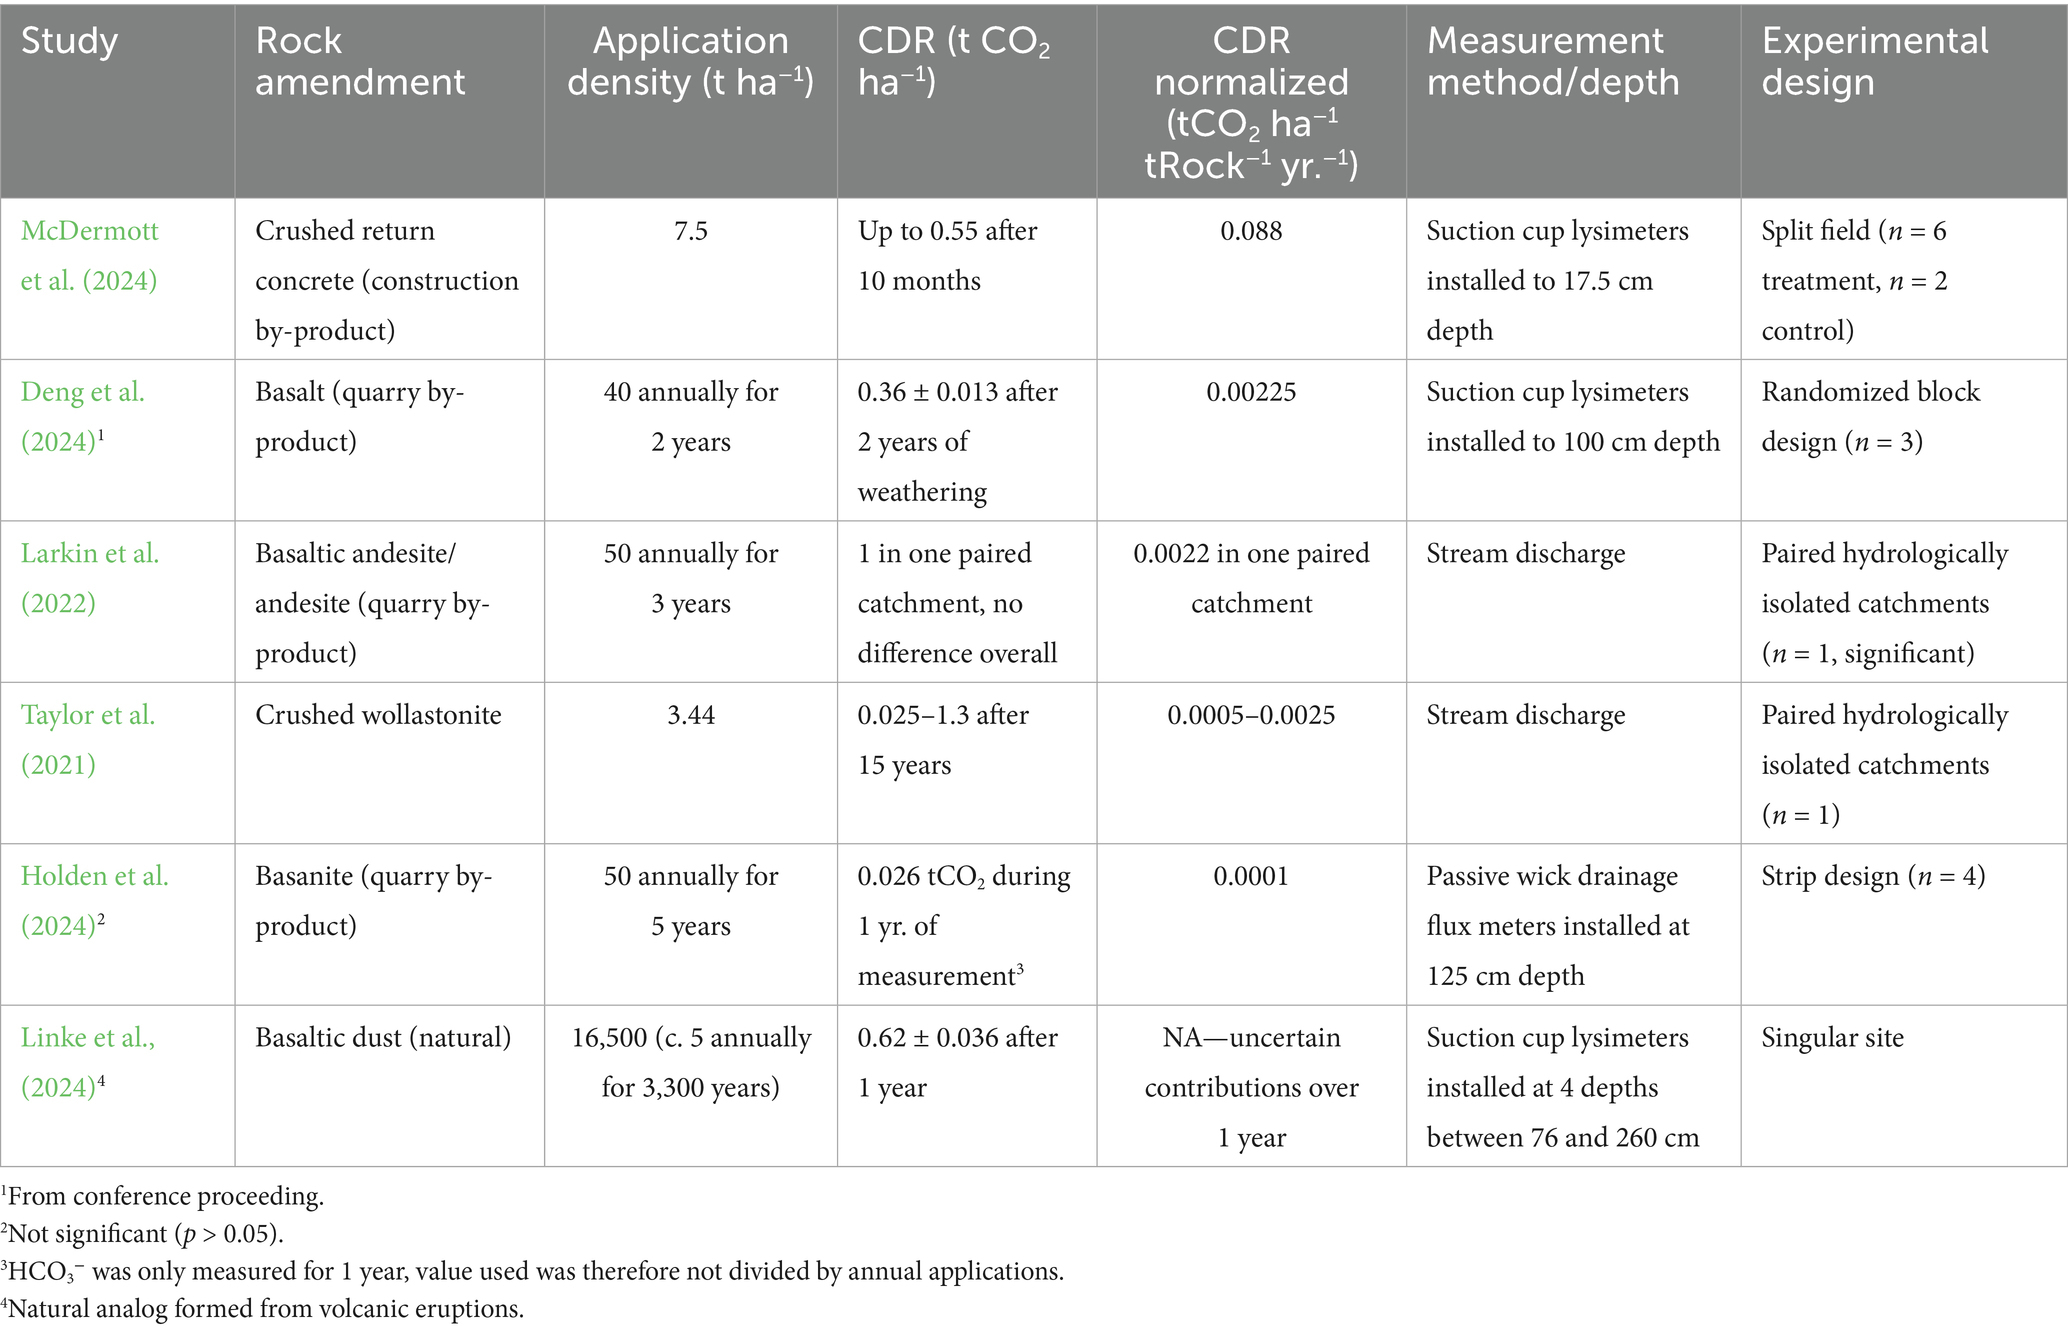
Table 5. Comparison of different field studies quantifying carbon dioxide removal (CDR).
Both McDermott et al. (2024) and Deng et al. (2024) use P-ET to calculate direct pCDR/CDR fluxes, while Holden et al. (2024) use passive wick drainage flux lysimeters. High mass-time-normalized direct pCDR (up to 0.088 tCO2 ha−1 tRock−1 yr.−1) of c.1–4 orders of magnitude higher than other studies listed in Table 5 were observed in McDermott et al. (2024). The fast dissolution kinetics of calcite, c. five orders of magnitude faster than the labradorite which comprise 43.8 wt.% of the material used in this study, likely explains why the mass-time-normalized direct pCDR was higher. Deng et al. (2024) observed a similar amount of mass-time-normalized CDR (0.0023 tCO2 ha−1 tRock−1 yr.−1) to the direct pCDR study (0.0021 tCO2 ha−1 tRock−1 yr.−1, including deductions). There are similarities in the soil used in this study compared with Deng et al. (2024) (pH = 6.6; soil texture = silty loam/silty clay loam) and rock amendment used (basalt, with a p80 of 1,050 μm). However, leachate samples were collected from 1 m depth—up to 20 times deeper than the porewater extraction depth presented in this study. In Holden et al. (2024), non-carbonic acid weathering was reported to drive over 98% of weathering and therefore, coupled with deep flux meter installation, low and statistically insignificant (p = 0.082) bicarbonate fluxes were observed.
Both Taylor et al. (2021) and Larkin et al. (2022) utilized river discharge to determine CDR. Firstly, 3 years of annual applications of 50 t ha−1 of basaltic andesite, CDR determined from alkalinity in river discharge was unresolvable in two out of three paired catchments when comparing control to amended paired catchments (Larkin et al., 2022). However, the paired catchment which showed c.1 tCO2 ha−1, converts to mass-time-normalized CDR of 0.022 tCO2 ha−1 tRock−1 yr.−1 which is of a similar order of magnitude as observed in Deng et al. (2024). After applying a lower rate application (3.44 t ha−1) of wollastonite amendment to a catchment which was monitored for 15 years, modest mass-time-normalized CDR of between 0.0005–0.0025 tCO2 ha−1 tRock−1 yr.−1 was observed.
River transport is quicker than groundwater transport (Dingman, 2002) so once the charge-balanced bicarbonate is transported into rivers, and after the initial outgassing and assuming that no more outgassing will occur along a river course, weathering products could reach the ocean quickly. However, it can take time for weathering products to be transported to rivers, and weathering products may remain in groundwater for millennia. Many of the CDR/pCDR data used in this study are taken at depths greater than 1 m which is considerably deeper than the near field zone as currently defined in methodologies (e.g., Sutherland et al., 2024; Puro, 2024; Mills et al., 2024). At deeper depths, outgassing, and the potential for plant uptake may not be such an issue. Even so, more research is needed to identify the time point under different hydrological conditions where dissolved and charge balanced bicarbonate is at low risk of outgassing, or outgassing during throughflow until the water table is constrained.
Aqueous phase measurements from studies compared in this section are typically one order of magnitude lower than ‘natural’ pCDR measurements derived from soil- and mass- balance-based approaches. Mass-time-normalized soil-based calculations report values of inferred pCDR of 0.013 tCO2 ha−1 tRock−1 yr.−1 when four annual applications of 50 t ha−1 basalt (e.g., 200 t ha−1 at the time of measurement) were applied to maize-soy rotations in the Midwest United States (Beerling et al., 2024). Tropical ERW measurements reported by InPlanet during their carbon credit verification by Isometric obtained mass-time-normalized inferred pCDR values of 0.055 tCO2 ha−1 tRock−1 yr.−1 when applying 10.6 t ha−1 of basalt and measuring after 1 year (Isometric HQ Ltd, 2025).
The time-mass-normalized direct pCDR reported in this study (0.0021 tCO2 ha−1 tRock−1 yr.−1, including deductions) is within the midrange of time-mass-normalized results reported in Table 5 (0.001–0.088 tCO2 ha−1 tRock−1 yr.−1). The study took place in temperate climates, using relatively slow weathering feedstocks (e.g., basalt). Other feedstocks, such as wollastonite, and regions with warm, wet summers, would likely lead to faster weathering rates, as per common consensus on dissolution kinetic laws (e.g., Palandri and Kharaka, 2004). However, slower weathering feedstocks could be significant over decadal (e.g., 20-year) timescales and this study suggests that while detecting signals in slow weathering materials can be challenging, particularly at lower application densities, it is achievable via high-frequency and/or time integrated measurements.
5 Conclusion
Integrating daily P-ET fluxes with measured porewater concentrations at 5 and 10 cm depth over 1.5 years of weathering showed that direct pCDR increased linearly with application density of crushed basalt. Direct pCDR of up to 0.53 tCO2 ha−1 was observed when 126 t ha−1 basalt was applied to grassland soils, when no deductions are applied. This meant the equivalent of 4.2 kgCO2 tRock−1 ha−1 (0.0042 tCO2 ha−1 tRock−1) were potentially removed following 1.5 years of weathering. These values are c. 2 orders of magnitude lower than the theoretical maximum CDR—confirming that maximum theoretical CDR is not a useful indicator of CDR over short timescales but can serve as a useful tool to compare the potential of different feedstocks. Although direct pCDR measured from porewater sampling is the most direct measure of CDR via EW, discontinuous sampling methods could underestimate pCDR. However, slower weathering feedstocks could be significant over decadal (e.g., 20-year) timescales though extended time-series of EW studies would be required to investigate this. The results presented in this study represent data after 1.5 years of weathering, where the faster weathering particles and minerals are likely to have preferentially dissolved, and both CDR rates and trends may be differ over longer durations. Finally, data presented in this study suggests that detecting signals in slow weathering materials can be challenging, particularly at lower application densities, but aided by high-frequency and/or time integrated measurements.
Data availability statement
The raw data supporting the conclusions of this article will be made available by the authors, without undue reservation.
Author contributions
ALM: Writing – review & editing, Investigation, Supervision, Writing – original draft, Conceptualization, Data curation, Project administration, Methodology. KS: Investigation, Data curation, Writing – original draft, Conceptualization, Writing – review & editing, Project administration, Formal analysis, Visualization, Methodology. PW: Formal analysis, Writing – review & editing. JB: Software, Writing – review & editing, Formal analysis, Visualization, Methodology. AS: Writing – review & editing. TB: Writing – review & editing, Project administration. TA: Writing – review & editing. GC: Data curation, Writing – review & editing. C-JC: Project administration, Writing – review & editing, Investigation. AF: Writing – review & editing, Investigation, Data curation. MH: Writing – review & editing. II: Writing – review & editing, Investigation, Conceptualization, Methodology. LJ: Investigation, Writing – review & editing. MK: Investigation, Writing – review & editing, Formal analysis, Methodology. JM: Writing – review & editing, Funding acquisition. DM: Writing – review & editing. CM: Writing – review & editing, Investigation. MM: Methodology, Writing – review & editing, Conceptualization. AR: Writing – review & editing, Investigation. M-VS: Formal analysis, Writing – review & editing. US: Investigation, Writing – review & editing. YT: Writing – review & editing. RT: Writing – review & editing. WT: Writing – review & editing. JW: Investigation, Writing – review & editing. MW: Investigation, Writing – review & editing. XL: Conceptualization, Project administration, Writing – review & editing.
Funding
The author(s) declare that no financial support was received for the research and/or publication of this article.
Conflict of interest
KS, PW, AS, TB, TA, GC, C-J C, AF, MH, LJ, CM, AR, US, RT, WT, JW, MW and XL all currently work or have recently worked (i.e. within the last 6 months) at UNDO Carbon Ltd. MEK and ALM are independent consultants for UNDO Carbon Ltd. JM is the founder and CEO of UNDO Carbon Ltd. DM is part of UNDO Carbon Ltd’s scientific advisory board. ALM and MJ M hold minority share options in UNDO Carbon Ltd. This does not alter our adherence to Frontiers policies on sharing data and materials within this study.
The remaining authors declare that the research was conducted in the absence of any commercial or financial relationships that could be construed as a potential conflict of interest.
Generative AI statement
The author(s) declare that no Gen AI was used in the creation of this manuscript.
Publisher’s note
All claims expressed in this article are solely those of the authors and do not necessarily represent those of their affiliated organizations, or those of the publisher, the editors and the reviewers. Any product that may be evaluated in this article, or claim that may be made by its manufacturer, is not guaranteed or endorsed by the publisher.
Supplementary material
The Supplementary material for this article can be found online at: https://www.frontiersin.org/articles/10.3389/fclim.2025.1606574/full#supplementary-material.
References
Amann, T., Hartmann, J., Hellmann, R., Pedrosa, E. T., and Malik, A. (2022). Enhanced weathering potentials—the role of in situ CO2 and grain size distribution. Front. Climate 4, 1–21. doi: 10.3389/fclim.2022.929268
Amiotte Suchet, P., Probst, J.-L., and Ludwig, W. (2003). Worldwide distribution of continental rock lithology: implications for the atmospheric/soil CO2 uptake by continental weathering and alkalinity river transport to the oceans. Glob. Biogeochem. Cycles 17, 1–14. doi: 10.1029/2002GB001891
Beck, H. E., Zimmermann, N. E., McVicar, T. R., Vergopolan, N., Berg, A., and Wood, E. F. (2018). Present and future Köppen-Geiger climate classification maps at 1-km resolution. Sci Data 5:180214. doi: 10.1038/sdata.2018.214
Beerling, D. J., Epihov, D. Z., Kantola, I. B., Masters, M. D., Reershemius, T., Planavsky, N. J., et al. (2024). Enhanced weathering in the US Corn Belt delivers carbon removal with agronomic benefits. Proc. Natl. Acad. Sci. 121:e2319436121. doi: 10.1073/pnas.2319436121
Beerling, D. J., Kantzas, E. P., Lomas, M. R., Wade, P., Eufrasio, R. M., Renforth, P., et al. (2020). Potential for large-scale CO2 removal via enhanced rock weathering with croplands. Nature 583, 242–248. doi: 10.1038/s41586-020-2448-9
Beerling, D. J., Leake, J. R., Long, S. P., Scholes, J. D., Ton, J., Nelson, P. N., et al. (2018). Farming with crops and rocks to address global climate, food and soil security. Nat Plants 4, 138–147. doi: 10.1038/s41477-018-0108-y
Betz, J., Albahri, T., Cazzagon, G., Healey, M., Radkova, A., Solpuker, U., et al. (2025). Cation release dynamics in basalt-amended soils: implications for enhanced rock Weathering. ESS Open Archive. doi: 10.22541/essoar.173939581.19736603/v1
Brunner, C., Hausfather, Z., and Knutti, R. (2024). Durability of carbon dioxide removal is critical for Paris climate goals. Commun Earth Environ 5:645. doi: 10.1038/s43247-024-01808-7
CDR.fyi (2025). Carbon Removal Map. Available online at: https://www.cdr.fyi/carbon-removal-map (Accessed April 4, 2025).
Clarkson, M. O., Larkin, C. S., Swoboda, P., Reershemius, T., Suhrhoff, T. J., Maesano, C. N., et al. (2024). A review of measurement for quantification of carbon dioxide removal by enhanced weathering in soil. Front Clim, 6. doi: 10.3389/fclim.2024.1345224
Deng, F., James, R. H., Dunham, S., Hernandez, J., Herbin, C., Carter, J., et al. (2024). “Quantifying carbon dioxide removal via enhanced rock weathering at an arable cropland field trial in the UK.” in 2024 Goldschmidt conference, (Goldschmidt).
Dietzen, C., and Rosing, M. T. (2023). Quantification of CO2 uptake by enhanced weathering of silicate minerals applied to acidic soils. Int. J. Greenhouse Gas Control 125:103872. doi: 10.1016/j.ijggc.2023.103872
Dzombak, D. A., and Morel, F. M. M. (1991). Surface complexation modeling: Hydrous ferric oxide. John Wiley and Sons.
Haque, F., Santos, R. M., and Chiang, Y. W. (2020). CO2 sequestration by wollastonite-amended agricultural soils – an Ontario field study. Int. J. Greenhouse Gas Control 97:103017. doi: 10.1016/j.ijggc.2020.103017
Harrington, K. J., Hilton, R. G., and Henderson, G. M. (2023). Implications of the riverine response to enhanced Weathering for CO2 removal in the UK. Appl. Geochem. 152:105643. doi: 10.1016/j.apgeochem.2023.105643
Hartmann, J., West, A. J., Renforth, P., Köhler, P., De La Rocha, C. L., Wolf-Gladrow, D. A., et al. (2013). Enhanced chemical weathering as a geoengineering strategy to reduce atmospheric carbon dioxide, supply nutrients, and mitigate ocean acidification. Rev. Geophys. 51, 113–149. doi: 10.1002/rog.20004
Hasemer, H., Borevitz, J., and Buss, W. (2024). Measuring enhanced weathering: inorganic carbon-based approaches may be required to complement cation-based approaches. Front. Climate 6, 1–21. doi: 10.3389/fclim.2024.1352825
Heřmanská, M., Voigt, M. J., Marieni, C., Declercq, J., and Oelkers, E. H. (2022). A comprehensive and internally consistent mineral dissolution rate database: part I: primary silicate minerals and glasses. Chem. Geol. 597:120807. doi: 10.1016/j.chemgeo.2022.120807
Holden, F. J., Davies, K., Bird, M. I., Hume, R., Green, H., Beerling, D. J., et al. (2024). In-field carbon dioxide removal via weathering of crushed basalt applied to acidic tropical agricultural soil. Sci. Total Environ. 955:176568. doi: 10.1016/j.scitotenv.2024.176568
Isometric HQ Ltd. (2025). 235.53 tCO₂e removal by InPlanet. Available online at: https://registry.isometric.com/removal/rmv_1J854R4NN1S05AYQ?tab=calculation-view (Accessed April 4, 2025).
Jones, G., Zhang, Z., Clayton, K., Lancastle, L., and Paschalis, A., (2025). Utilizing soil centrifugation for accurate estimates of carbon dioxide removal via enhanced rock weathering. Research Square. doi: 10.21203/rs.3.rs-6271461/v1
Jorat, M. E., Kraavi, K. E., and Manning, D. A. C. (2022). Removal of atmospheric CO2 by engineered soils in infrastructure projects. J. Environ. Manag. 314:115016. doi: 10.1016/j.jenvman.2022.115016
Kantola, I. B., Masters, M. D., Beerling, D. J., Long, S. P., and DeLucia, E. H. (2017). Potential of global croplands and bioenergy crops for climate change mitigation through deployment for enhanced weathering. Biol. Lett. 13:20160714. doi: 10.1098/rsbl.2016.0714
Kantzas, E. P., Val Martin, M., Lomas, M. R., Eufrasio, R. M., Renforth, P., Lewis, A. L., et al. (2022). Substantial carbon drawdown potential from enhanced rock weathering in the United Kingdom. Nat. Geosci. 15, 382–389. doi: 10.1038/s41561-022-00925-2
Kanzaki, Y., Planavsky, N., Zhang, S., Jordan, J., Suhroff, T. J., and Reinhard, C. T. (2024). Soil cation storage as a key control on the timescales of carbon dioxide removal through enhanced weathering. Earths Future. 20, 1–11. doi: 10.1088/1748-9326/ade0d5
Kelland, M. E., Wade, P. W., Lewis, A. L., Taylor, L. L., Sarkar, B., Andrews, M. G., et al. (2020). Increased yield and CO2 sequestration potential with the C4 cereal Sorghum bicolor cultivated in basaltic rock dust-amended agricultural soil. Glob. Chang. Biol. 26, 3658–3676. doi: 10.1111/gcb.15089
Kukla, T., Tuhrhoff, T. J., Loeffler, S., Martin, K., and Chay, F. (2024). Does enhanced weathering work? We’re still learning. Carbon Plan. Available at: https://carbonplan.org/research/enhanced-weathering-fluxes (Accessed April 2, 2025).
Larkin, C. S., Andrews, M. G., Pearce, C. R., Yeong, K. L., Beerling, D. J., Bellamy, J., et al. (2022). Quantification of CO2 removal in a large-scale enhanced weathering field trial on an oil palm plantation in Sabah, Malaysia. Front. Climate 4, 1–20. doi: 10.3389/fclim.2022.959229
Lewis, A. L., Sarkar, B., Wade, P., Kemp, S. J., Hodson, M. E., Taylor, L. L., et al. (2021). Effects of mineralogy, chemistry and physical properties of basalts on carbon capture potential and plant-nutrient element release via enhanced weathering. Appl. Geochem. 132:105023. doi: 10.1016/j.apgeochem.2021.105023
Linke, T., Oelkers, E. H., Möckel, S. C., and Gislason, S. R. (2024). Direct evidence of CO2 drawdown through enhanced weathering in soils. Geochem. Persp. Let., 30, 712.
McDermott, F., Bryson, M., Magee, R., and van Acken, D. (2024). Enhanced weathering for CO2 removal using carbonate-rich crushed returned concrete; a pilot study from SE Ireland. Appl. Geochem. 169:106056. doi: 10.1016/j.apgeochem.2024.106056
Mignone, B. K., Clarke, L., Edmonds, J. A., Gurgel, A., Herzog, H. J., Johnson, J. X., et al. (2024). Drivers and implications of alternative routes to fuels decarbonization in net-zero energy systems. Nat. Commun. 15:3938. doi: 10.1038/s41467-024-47059-0
Mills, J. V., Sanchez, J., Olagaray, N. Y., Wang, H., and Tune, A. K. (2024). Foundations for Carbon Dioxide Removal Quantification in ERW Deployments.
Nan, W., Yue, S., Li, S., Huang, H., and Shen, Y. (2016). The factors related to carbon dioxide effluxes and production in the soil profiles of rain-fed maize fields. Agric. Ecosyst. Environ. 216, 177–187. doi: 10.1016/j.agee.2015.09.032
Open-Meteo (2025). Open-Meteo Features. Available online at: https://open-meteo.com/en/features. (Accessed April 04, 2025).
Palandri, J. L., and Kharaka, Y. K. (2004). A compilation of rate parameters of water-mineral Interctions kinetics for application to geochemical modeling. California, US: Menlo Park.
Power, I. M., Hatten, V. N. J., Guo, M., Schaffer, Z. R., Rausis, K., and Klyn-Hesselink, H. (2025). Are enhanced rock weathering rates overestimated? A few geochemical and mineralogical pitfalls. Front. Climate 6:747. doi: 10.3389/fclim.2024.1510747
Renforth, P. (2012). The potential of enhanced weathering in the UK. Int. J. Greenhouse Gas Control 10, 229–243. doi: 10.1016/j.ijggc.2012.06.011
Renforth, P. (2019). The negative emission potential of alkaline materials. Nat. Commun. 10:1401. doi: 10.1038/s41467-019-09475-5
Renforth, P., and Henderson, G. (2017). Assessing Ocean alkalinity for carbon sequestration. Rev. Geophys. 55, 636–674. doi: 10.1002/2016RG000533
Renforth, P., Washbourne, C.-L., Taylder, J., and Manning, D. A. C. (2011). Silicate production and availability for mineral carbonation. Environ. Sci. Technol. 45, 2035–2041. doi: 10.1021/es103241w
Rijnders, J., Vienne, A., and Vicca, S. (2024). Effects of basalt, concrete fines, and steel slag on maize growth and heavy metal accumulation in an enhanced weathering experiment. EGUsphere 2024, 1–34. doi: 10.5194/egusphere-2024-3022
Schenk, H. J., and Jackson, R. B. (2002). Rooting depths, lateral root spreads and below-ground/above-ground allometries of plants in water-limited ecosystems. J. Ecol. 90, 480–494. doi: 10.1046/j.1365-2745.2002.00682.x
Schulte, I., Burke, J., Arcusa, S., Mercer, L., and Hondeborg, D. (2024). “Monitoring, reporting and verification” in The state of carbon dioxide removal. ed. S. M. Smith. 2nd ed.
Seabold, S., and Perktold, J. (2010). “Statsmodels: econometric and statistical modeling with python.” in Proceedings of the 9th Python in Science Conference., (Austin), 10–80.
Skov, K., Wardman, J., Healey, M., McBride, A., Bierowiec, T., Cooper, J., et al. (2024). Initial agronomic benefits of enhanced weathering using basalt: a study of spring oat in a temperate climate. PLoS One 19:e0295031. doi: 10.1371/journal.pone.0295031
Smith, S. M., Geden, O., Gidden, M. J., Lamb, W. F., Nemet, G. F., Minx, J. C., et al. (2024). The state of carbon dioxide removal. 2nd Edn.
Stubbs, A., Tostevin, R., Skov, K., Couillard, Z., Wisteard, L., Dejordy, D., et al. (2025). Evaluating Total Cation Accounting (TCA) as an MRV Approach for Enhanced Rock Weathering - Insights from a trial in Ontario, Canada. Goldschmidt.
Sutherland, K., Holme, E., Savage, R., Gill, S., and Matlin-Wainer, M. (2024). Enhanced Weathering in Agriculture v1.0. Isometric HQ. Avaiable at: https://registry.isometric.com/protocol/enhanced-weathering-agriculture#summary
Taylor, L. L., Driscoll, C. T., Groffman, P. M., Rau, G. H., Blum, J. D., and Beerling, D. J. (2021). Increased carbon capture by a silicate-treated forested watershed affected by acid deposition. Biogeosciences 18, 169–188. doi: 10.5194/bg-18-169-2021
Warken, S. F., Riechelmann, D. F. C., Fohlmeister, J., Schröder-Ritzrau, A., Frank, N., Scholz, D., et al. (2024). Dynamic processes determine precipitation variability in eastern Central Europe since the last glacial maximum. Commun Earth Environ 5:694. doi: 10.1038/s43247-024-01876-9
White, A. F., and Brantley, S. L. (2003). The effect of time on the weathering of silicate minerals: why do weathering rates differ in the laboratory and field? Chem. Geol. 202, 479–506. doi: 10.1016/j.chemgeo.2003.03.001
Wolff-Boenisch, D., Gislason, S. R., and Oelkers, E. H. (2006). The effect of crystallinity on dissolution rates and CO2 consumption capacity of silicates. Geochim. Cosmochim. Acta 70, 858–870. doi: 10.1016/j.gca.2005.10.016
Zhang, S., Planavsky, N. J., Katchinoff, J., Raymond, P. A., Kanzaki, Y., Reershemius, T., et al. (2022). River chemistry constraints on the carbon capture potential of surficial enhanced rock weathering. Limnol. Oceanogr. 67, S148–S157. doi: 10.1002/lno.12244
Keywords: enhanced weathering, MRV, porewater, CDR, field trial
Citation: McBride AL, Skov K, Wade P, Betz J, Stubbs A, Bierowiec T, Albahri T, Cazzagon G, Chen C-J, Frew A, Healey M, Idam I, Jones L, Kelland ME, Mann J, Manning D, Mitchell C, Murphy MJ, Radkova A, Sanchez M-Vdt, Solpuker U, Teh YA, Tostevin R, Turner W, Wardman J, Wilkie M and Liu X (2025) Quantifying potential carbon dioxide removal via enhanced weathering using porewater from a field trial in Scotland. Front. Clim. 7:1606574. doi: 10.3389/fclim.2025.1606574
Edited by:
Yiwen Pan, Zhejiang University, ChinaReviewed by:
Edson Campanhola Bortoluzzi, The University of Passo Fundo, BrazilFatima Haque, University of Guelph, Canada
Copyright © 2025 McBride, Skov, Wade, Betz, Stubbs, Bierowiec, Albahri, Cazzagon, Chen, Frew, Healey, Idam, Jones, Kelland, Mann, Manning, Mitchell, Murphy, Radkova, Sanchez, Solpuker, Teh, Tostevin, Turner, Wardman, Wilkie and Liu. This is an open-access article distributed under the terms of the Creative Commons Attribution License (CC BY). The use, distribution or reproduction in other forums is permitted, provided the original author(s) and the copyright owner(s) are credited and that the original publication in this journal is cited, in accordance with accepted academic practice. No use, distribution or reproduction is permitted which does not comply with these terms.
*Correspondence: Amy L. McBride, YWxtY2JyaWRlMTQzQGdtYWlsLmNvbQ==; Kirstine Skov, a2lyc3RpbmUuc2tvdkB1bi1kby5jb20=