 Yanming Sun
 Jiale Liu
 Qingli Li2
- 1School of Transportation, Shandong University of Science and Technology, Qingdao, China
- 2International Cooperation Center of National Development and Reform Commission, Beijing, China
Enhancing transportation total-factor carbon productivity constitutes a critical initiative for high-quality economic development across Chinese provinces. Based on panel data from 30 Chinese provinces spanning 2007–2022, this study comprehensively employs the Super-Efficiency Slack-Based Measure (SBM) model, non-parametric kernel density estimation, standard deviational ellipse, and global Moran's I index to analyze the spatiotemporal evolution characteristics of Total Factor Carbon Productivity in Transportation (TFCP-T) across provinces. Finally, a spatial Durbin model is utilized to empirically investigate influencing factors. Key findings include: (1) China's provincial TFCP-T exhibits an overall fluctuating upward trend, yet reveals a distinct spatiotemporal differentiation pattern characterized by “high efficiency and intensification in the eastern region versus gradient lag in the central and western regions.” (2) Significant spatial positive correlation and club convergence effects exist in China's transportation green total factor productivity, with western provinces facing risks of low-level lock-in. (3) Economic development level, openness to foreign trade, environmental protection intensity, and industrial structure upgrading positively promote TFCP-T, while consumption level and informatization level exert significant inhibitory effects. These results provide critical policy insights for enhancing transportation carbon productivity and fostering regional coordinated development in China.
1 Introduction
Transportation, serving as a foundational and pioneering industry for national economic development and the “arterial network” of urban operations, directly influences resource allocation efficiency within socioeconomic systems. However, this sector faces dual challenges: as the second-largest carbon emission source following industry, it must simultaneously address sustained growth in freight demand amid energy structure uncertainties and resolve policy adaptation dilemmas arising from regional development imbalances. China exhibits pronounced economic gradients across provinces, with coastal eastern and inland regions forming a tiered distribution pattern in urbanization levels, industrial structures, and transportation network density. Such multidimensional heterogeneity necessitates carbon reduction policies grounded in precise identification of geographical spatial characteristics.
Against this backdrop, Total Factor Carbon Productivity in Transportation (TFCP-T)—a critical metric evaluating output efficiency per unit carbon emission during economic growth—comprehensively reflects synergistic effects of technological progress and resource allocation optimization on low-carbon transitions. Consequently, measuring transportation TFCP-T, clarifying its spatiotemporal evolution, and exploring spatial differentiation characteristics at provincial and regional levels hold significant implications for formulating tailored transportation carbon policies and advancing emission reduction goals.
Current research on carbon efficiency measurement has yielded substantial achievements. The concept of carbon efficiency was pioneered by Kaya and Yokobori (1997), who defined it as the ratio of carbon emissions to GDP. This spurred scholarly interest, leading to carbon efficiency assessments across sectors and regions to evaluate carbon reduction target attainment. Existing literature primarily adopts two approaches: single-factor carbon efficiency and multi-factor carbon efficiency. Single-factor metrics typically consider the impact of individual elements (e.g., economic or energy indicators) on total emissions (Wei et al., 2012; Aldy, 2006) but fail to differentiate input factors or account for other production influences. Carbon efficiency, shaped jointly by economic development and energy consumption, inherently embodies “total factor” characteristics. Total Factor Carbon Productivity in Transportation (TFCP-T) integrates capital, labor, energy, and technology inputs to quantify economic output per unit carbon emission. Its core innovation lies in incorporating carbon emissions as environmental costs into traditional total factor productivity frameworks, reflecting low-carbon economic efficiency of transport systems. Enhancing TFCP-T not only reduces carbon intensity per output unit but also drives economic restructuring and green technology diffusion, providing robust technical and managerial foundations for achieving dual-carbon goals.
Studies on Total Factor Carbon Productivity (TFCP) (Chang et al., 2024; Hasanov et al., 2024) have been conducted from diverse perspectives through meticulous analysis by scholars. Methodologically, Data Envelopment Analysis (DEA) (Wu and Wang, 2025), its Malmquist index extensions (He et al., 2024), and Stochastic Frontier Analysis constitute commonly employed measurement approaches. A significant advancement was made by Tone (2001) who introduced slack variables into DEA's objective function, establishing the Slack-Based Measure (SBM) model that incorporates undesirable outputs, which has since become the mainstream paradigm for efficiency research. Building on this, Wang et al. (2025a) utilized the Super-Efficiency SBM model to quantify carbon efficiency in China's coastal logistics industry, while Lee and Ogata (2025) applied the same framework to analyze green total factor productivity across OECD nations. Thematically, research trajectories have evolved from initial empirical TFCP investigations (Pan et al., 2022) toward deeper explorations of spatial correlations (Cui et al., 2024; Tan and Zhou, 2025), spatiotemporal convergence (Gu et al., 2023), and other sophisticated dimensions. These studies span multiple spatial scales, encompassing national (Wang et al., 2022b), provincial (Chen and Yao, 2024a), and city-level (Kong et al., 2024) analyses. Furthermore, within unified analytical frameworks, scholars have examined the impacts of various determinants including industrial intellectualization (Wang et al., 2022a), environmental regulation (Zhang et al., 2024) new infrastructure development (Liu et al., 2024b), digital economy (Chen and Yao, 2024b; Wang et al., 2025b), renewable energy (Su et al., 2023), and green innovation (Jiang et al., 2024; Liu et al., 2024a) on TFCP dynamics.
In summary, while existing research achievements are substantial, three primary limitations warrant further expansion: First, although TFCP serves as a crucial metric for assessing output efficiency per unit carbon emission during economic growth, few scholars have systematically explored improvement pathways from a spatiotemporally integrated perspective. Current studies struggle to capture evolutionary trajectories of regional disparities and spatial interaction effects, compromising the validity of findings. Second, scholars investigating TFCP frequently overlook spatial spillover effects arising from cross-regional industrial restructuring and factor mobility on adjacent regions' TFCP, particularly demonstrating a lack of targeted analysis accounting for intrinsic characteristics of the transportation sector. Third, existing literature predominantly concentrates on TFCP in industrial and agricultural contexts, with few scholarly efforts dedicated to in-depth examinations of carbon efficiency within the transportation industry.
Building on this foundation, this study integrates panel data from 30 Chinese provinces (2007–2022) to measure changes in transportation TFCP-T using the Super-Efficiency SBM model. We further synthesize kernel density estimation with the Standard Deviational Ellipse (SDE) to characterize agglomeration features and trace migration trajectories of the spatial centroid. Concurrently, global Moran's I indices and Moran scatterplots are employed to quantify spatial autocorrelation in TFCP-T and corroborate the identified agglomeration patterns.
2 Research design
2.1 Research methods
2.1.1 Super-efficiency SBM model incorporating undesirable outputs
The standard SBM model accounts for slack adjustments but overlooks undesirable outputs. The super-efficiency SBM model incorporating undesirable outputs overcomes the limitation where efficient DMUs all score 1 and become incomparable, enabling further evaluation and ranking of efficient DMUs. This study employs the super-efficiency SBM model to measure TFCP-T. The formulation for the super-efficiency SBM model with undesirable outputs is specified as follows (Tone and Sahoo, 2004):
Where xik, yrk, and buk espectively denote the i-th input factor, r-th desirable output, and u-th undesirable output for the k-th DMU; , and represent slack variables for input factors, desirable outputs, and undesirable outputs respectively; and λj is the weight vector for input-output combinations of the j-th DMU.
2.1.2 Nonparametric kernel density estimation
Kernel density estimation is a nonparametric method used to estimate the probability density of a random variable, allowing for the visualization of its distribution trends over time through graphical representation. Its formula is as follows:
where n represents the sample size (30 provinces and municipalities in this study), h is the bandwidth of density estimation, which controls the smoothness of the estimate, and K is the kernel function. A larger bandwidth results in a smoother estimate but may introduce greater bias.
2.1.3 Moran's index
Global spatial autocorrelation is employed to determine the spatial dependence of China's TFCP-T. This study utilizes the global Moran's I index to evaluate the overall spatial linkages or degree of differentiation in TFCP-T across regions. The computational formula is specified as follows:
In the above equations, s2 denotes the variance of the study variable, wij constitutes the spatial weight matrix, this article uses spatial distance matrix for analysis, xi and xj represent TFCP-T values for provinces i and j respectively, n indicates the number of provinces under study, and signifies the mean TFCP-T across all provinces within the research scope. The Moran's I index ranges from [–1, 1], where smaller absolute values indicate weaker spatial dependence of the studied phenomenon, while larger absolute values denote stronger spatial autocorrelation. Specifically, positive values confirm the presence of statistically significant spatial positive correlation.
2.1.4 Standard Deviation Ellipse
The Standard Deviation Ellipse (SDE) is a commonly used spatial statistical analysis method for quantitatively describing the distribution characteristics and directional trends of geographical data. By constructing an elliptical distribution range, this method reflects the spatial centroid, principal axis orientation, and dispersion degree of the data. The calculation of the standard deviation ellipse is based on the geometric mean center and coordinate distribution characteristics of the data. Following the study by Zhang et al. (2022), this paper employs this method to quantitatively interpret the evolutionary patterns of Total Factor Carbon Productivity in Transportation (TFCP-T) across China.
Equations 5–9 represent the calculation formulas for the weighted mean center (Xω, Yω), directional angle θ, standard deviation along the X-axis σx, standard deviation along the Y-axis σy, and ellipse area respectively. The symbol ωi denotes the spatial weight of element i, where ai and bi represent the spatial coordinates of the study object. xi and yi represent the deviations of the spatial coordinates of the study object from the mean center, while σx and σy denote the standard deviations.
2.1.5 Spatial econometric models
Compared with traditional CCR regression approaches, spatial econometric models account for the spatial dependence and spatial interaction effects inherent in sample data. Among spatial econometric frameworks applicable to cross-sectional data, spatial regression models with spatial coefficients primarily include the Spatial Lag Model (SLM), Spatial Error Model (SEM), and Spatial Durbin Model (SDM).
The Spatial Lag Model (SLM) parallels autoregressive models in time series analysis. This model focuses on examining whether spillover effects exist for regional variables—specifically, whether changes in a given variable within one region directly influence variables in neighboring regions. The fundamental expression of the Spatial Lag Model (SLM) is given by:
Where Y represents the dependent variable, X denotes explanatory variables, α is the constant term, W signifies the spatial weight matrix, this article uses spatial distance matrix for analysis, β corresponds to regression coefficients, ρ indicates the spatial lag coefficient for the dependent variable Y, and θ constitutes the random disturbance term following an independent distribution. The Spatial Error Model (SEM) characterizes spatial disturbance correlation and global correlation, explicitly incorporating higher-order effects of spatial influence. This model introduces a spatial error term into the econometric equation to examine how external shocks affect the dependent variable in both neighboring regions and the local area—impacts that exhibit spatial decay yet demonstrate temporal persistence. The fundamental formulation of the Spatial Error Model (SEM) is expressed as:
Where λ represents the spatial error coefficient quantifying the magnitude of influence, and ε denotes the random disturbance term; all other variables retain their previously defined meanings.
The Spatial Durbin Model (SDM) generalizes both the Spatial Error Model (SEM) and Spatial Lag Model (SLM). It can be derived through restructuring and extensions of SEM and SLM frameworks by incorporating specific conditional constraints. The fundamental expression of the Spatial Durbin Model (SDM) is given by:
Where λ constitutes a parameter vector, with all other variables retaining their previously defined meanings.
2.2 Indicator selection and data sources
2.2.1 Indicator selection
In the TFCP-T calculation process, input decision-making units (DMUs), input vectors, and desirable/undesirable outputs are defined, with specific input indicators specified as follows: (1) Energy input: Raw coal, gasoline, kerosene, diesel, fuel oil, and natural gas are converted using energy conversion coefficients from the 2006 IPCC Guidelines for National Greenhouse Gas Inventories (Table 1). Electricity inputs employ regional grid average CO2 emission coefficients (Table 2) to convert consumption into standard coal equivalent, aggregated as total energy input (Li et al., 2019). (2) Capital input: Fixed-asset investment in transportation infrastructure serves as capital input, calculated using the perpetual inventory method. (3) Labor input: Urban employment in the transportation sector is designated as labor input.
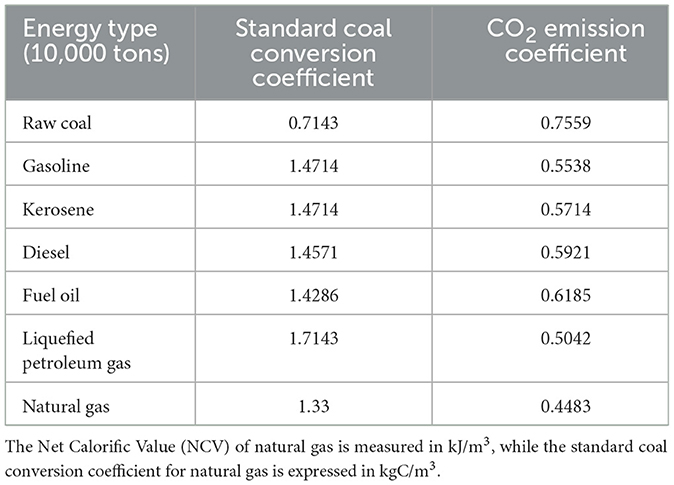
Table 1. Standard coal conversion and CO2 emission coefficients.
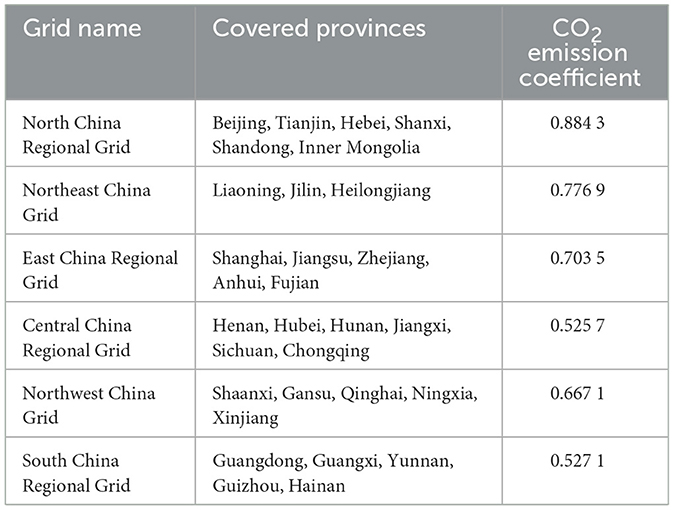
Table 2. Regional grid average CO2 emission coefficients.
Output indicators encompass both desirable and undesirable outputs. The value-added of the transportation sector serves as the desirable output reflecting transport benefits, while total carbon emissions constitute the undesirable output. Carbon emissions are calculated according to Equation 13 as follows:
Where Eti denotes the total consumption of the t-th energy type in year i for the transportation sector, i indicates the corresponding year, and CEFi represents the carbon emission coefficient.
2.2.2 Data sources
Tibet, Hong Kong, Macao, and Taiwan were excluded from the study due to incomplete statistical records. The analysis focuses on 30 provincial-level administrative units in mainland China (2007–2022), stratified into four geographic regions per China's official regional classification:national, eastern, central, and western China. Transportation energy consumption data were standardized into metric tons of standard coal equivalents (tce) using conversion coefficients prescribed in China's national standard GB/T 2589–2020 (Sun et al., 2024), energy types including raw coal, gasoline, diesel, and natural gas. Data were rigorously sourced from: China Statistical Yearbook, China Transportation Yearbook, China Energy Statistical Yearbook, China Environmental Yearbook, and the National Bureau of Statistics database.
3 Result and analysis
3.1 Spatiotemporal evolution characteristics of TFCP-T
By conducting kernel density estimation of nationwide Total Factor Carbon Productivity in Transportation (TFCP-T), the temporal agglomeration intensity at each time point is manifested by the peak height of the distribution, corresponding to its kernel density value as illustrated in Figure 1.
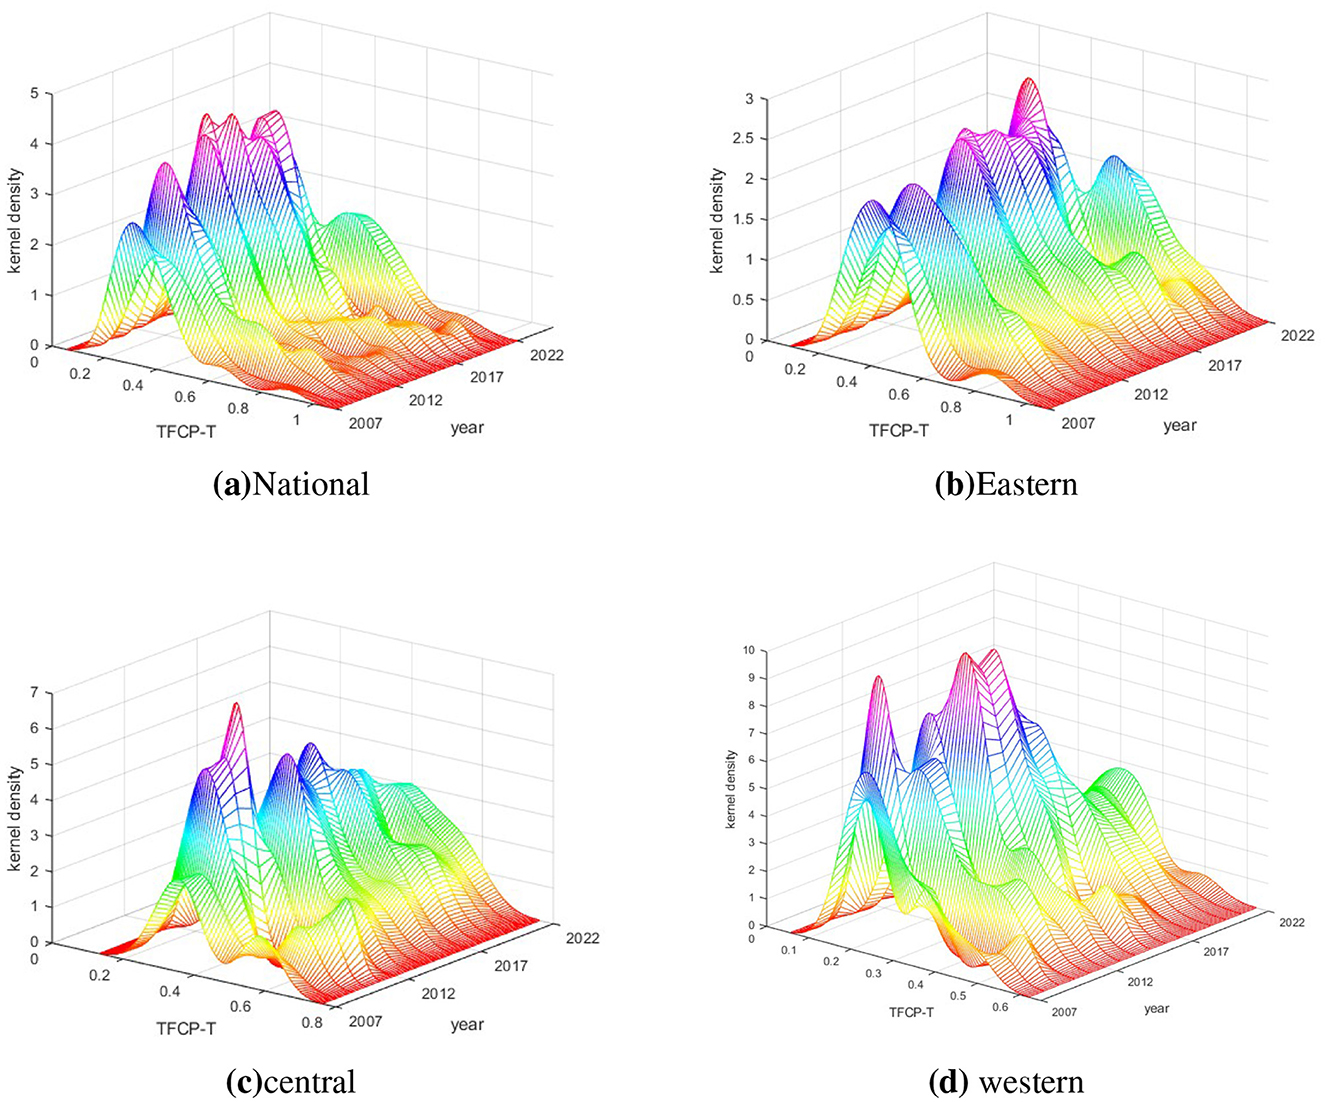
Figure 1. Kernel density estimation of transportation TFCP-T across Chinese regions. (a) National. (b) Eastern. (c) Central. (d) Western.
National Trend: The distribution centroid demonstrates a pronounced rightward shift over time, indicating overall improvement in carbon emission efficiency. The left-skewed tail reveals significant contraction of low-value zones post-2012, though a truncated right tail persists, suggesting divergent paces of technological transition across regions.
Eastern Region: Centroid stability within the 0.7–0.8 interval (2010–2022) confirms high-equilibrium carbon efficiency. Near-elimination of tail characteristics reflects regional developmental homogeneity. Persistently compressed peak width since 2015 demonstrates pioneering achievement in intensive emission reduction, with minimal intra-regional disparity.
Central Region: Centroid stagnation at TFCP-T = 0.3–0.6 (2007–2022) reveals plateaued efficiency, while the 2022 leftward peak migration implies weakening growth momentum. Bidirectional tail expansion highlights intensified intra-provincial divergence. Anomalous evolution from unimodal to broad bimodal distribution (2022) signals emerging fragmentation between high/low-efficiency clusters.
Western Region: Centroid anchoring in low-value zones and marginal rightward drift post-2017 reflect delayed transitions. The cliff-like left tail exposes developmental bottlenecks in inefficient areas. Sustained bimodal structure with widening inter-peak distance (2022) indicates aggravated internal polarization, where high-efficiency clusters failed to propel comprehensive upgrading.
3.2 Spatial evolution characteristics of TFCP-T
Transportation Total Factor Carbon Productivity (TFCP-T), as a key metric for assessing provincial green low-carbon transition progress, reflects each province's capability to enhance transportation efficiency while reducing carbon emissions. Using ArcGIS software combined with the natural breaks classification method, we categorized the data into four tiers to analyze TFCP-T spatial patterns across the years 2007, 2012, 2017, and 2022. These four time nodes span a 15-year period with 5-year intervals, balancing trend smoothness and policy inflection point detection while mitigating interference from annual fluctuations. This approach enables identification of spatial distribution patterns for provincial TFCP-T across distinct temporal phases.Key evolutionary regularities were identified as mapped in Figure 2.
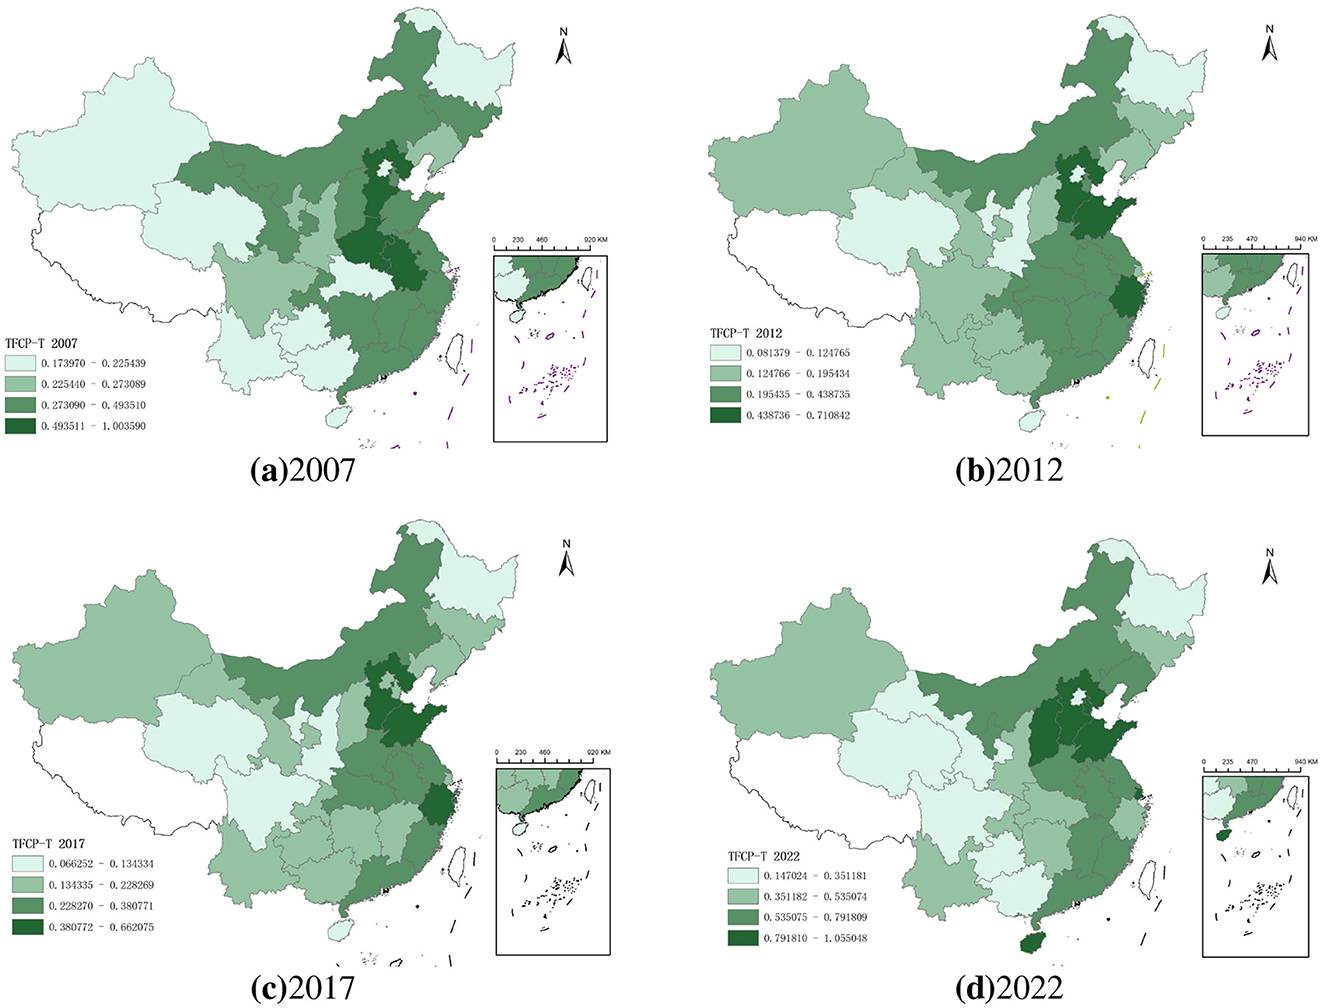
Figure 2. TFCP-T in 2007, 2012, 2017, and 2022. (a) 2007. (b)2012. (c) 2017. (d) 2022.
Employing ArcGIS software with the Natural Breaks method, China's provincial transportation carbon efficiency is classified into four tiers: high-efficiency zones, relatively high-efficiency zones, medium-efficiency zones, and low-efficiency zones. Analysis of spatial distribution maps across the four periods reveals evolutionary patterns: in 2007, a “central high, peripheral low” configuration emerged with high-value zones concentrated in the Central Plains and coastal core provinces; by 2012, localized spatial restructuring occurred where eastern coastal provinces maintained efficiency leadership while inland regions experienced downgrading; the 2017 transition marked a pivotal shift as high-value zones intensely agglomerated in eastern urban clusters like the Yangtze River Delta and Pearl River Delta, with the northeast region descending into medium-low efficiency zones for the first time, establishing a “coastal protrusion and inland collapse” distribution; by 2022, intensified spatial polarization manifested with eastern high-efficiency zones exceeding the 1.0 threshold while western provinces like Ningxia and Gansu showed marginal improvements yet remained constrained within medium-low efficiency bands, forming a “eastern leapfrogging versus central-western gradient lag” carbon efficiency pattern. To further analyze spatiotemporal changes in national TFCP-T and their geographical distribution characteristics, this study employs the centroid-standard deviational ellipse (SDE) analytical model, focusing on 2007 and 2022 to examine migration trajectories of the spatial centroid and dispersion trends across provinces as depicted in Figure 3.
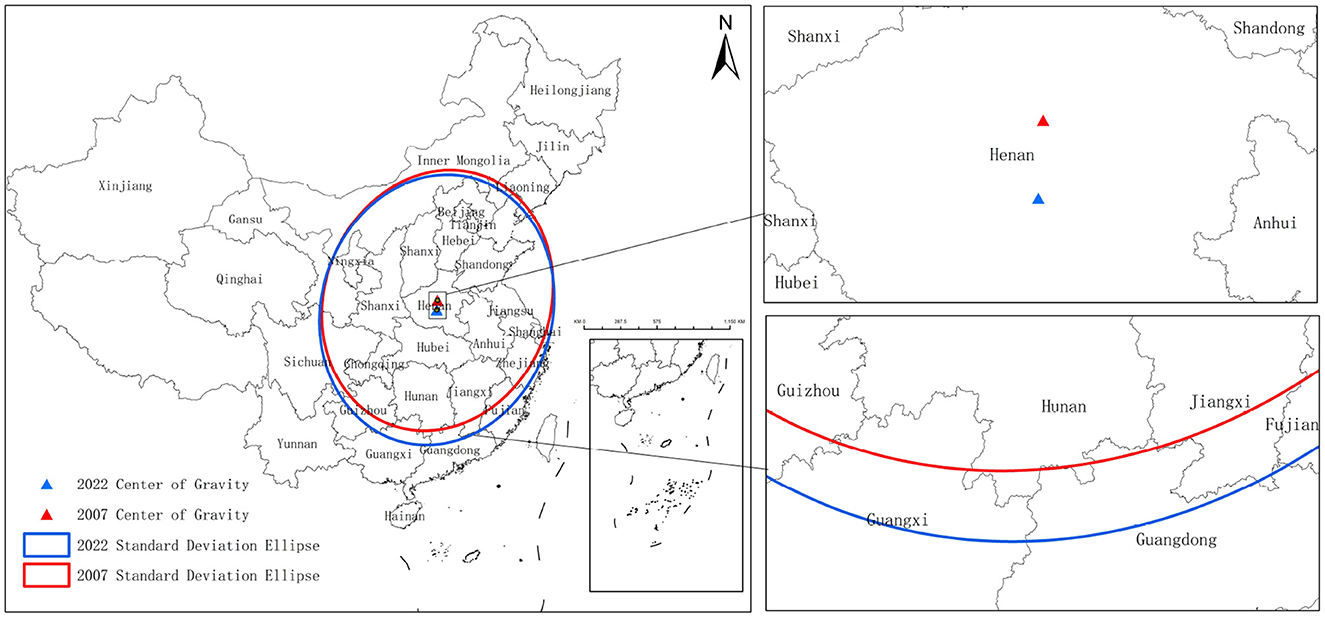
Figure 3. Distribution direction and migration path of TFCP-T in 2007 and 2022.
According to the centroid trajectory coordinates, China's TFCP-T centroid migrated within the longitudinal range of 113.452°E–113.333°E and latitudinal range of 34.2103°N–33.5648°N during 2007–2022. The migration trajectory demonstrates a net southwest displacement of 72.93 km, comprising a 0.119° westward shift in the east-west dimension and 0.6455° southward movement in the north-south dimension, indicating significantly enhanced contributions to TFCP-T improvement from western and southern regions.
According to Table 3, the standard deviation along the X-axis increased from 887.393 km to 910.5705 km, while the Y-axis standard deviation expanded from 1,044.6021 km to 1,073.9351 km, confirming continuous spatial dispersion along the dominant northeast-southwest (NE-SW) axial direction. The synchronous expansion of both axes—with increments of 23.177 km (X-axis) and 29.333 km (Y-axis)—exhibited greater magnitude in the north-south dimension than east-west, indicating north-south oriented dominance in dispersive expansion. The elliptical area expanded by 159,960 km2, evidencing significantly enhanced spatial heterogeneity of TFCP-T. The directional angle decreased from 21.77° to 16.26°, representing a 5.51° counterclockwise rotation, yet the persistent dominance of the NE-SW axial pattern demonstrates structural continuity in the spatial framework.
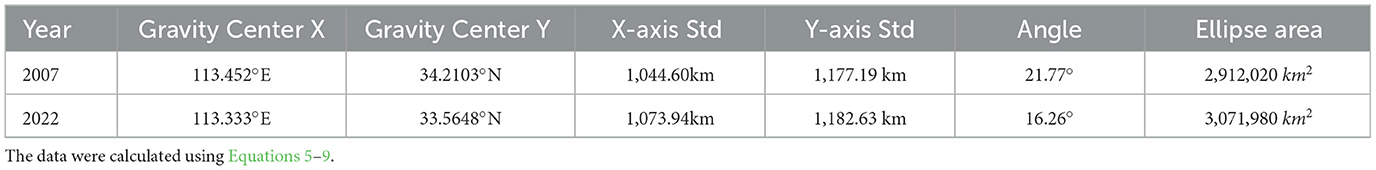
Table 3. Ellipse data from 2007 to 2020.
3.3 Spatial cluster analysis of TFCP-T
This study employs Moran's I for spatial autocorrelation analysis of provincial TFCP-T. Figure 4 revealing indices of 0.1301 in 2007 and 0.3394 in 2022 (P <1%), confirming positive spatial correlation with a pronounced upward trend. To precisely analyze spatiotemporal clustering patterns of transportation carbon efficiency, Moran scatterplots were generated using Stata software for 2007, 2012, 2017, and 2022 (Figure 4). The majority of provinces are concentrated in Quadrant I (high-high clusters) and Quadrant III (low-low clusters), accounting for 70%, 71%, 70%, and 83% of all 30 provinces respectively across the four periods. This demonstrates that TFCP-T predominantly exhibits “high-high” (HH) and “low-low” (LL) agglomeration patterns during 2007–2022, indicating significant spatial dependence among adjacent provinces. HH clusters are primarily distributed in Anhui, Shandong, Zhejiang, and neighboring provinces, where well-developed economic systems foster distinct spatial agglomeration; conversely, LL clusters concentrate in southwestern, northwestern, and northeastern regions—including Sichuan, Yunnan, Xinjiang, Gansu, and Heilongjiang—where underdeveloped transportation systems due to topographic constraints and economic disadvantages result in suppressed TFCP-T performance.
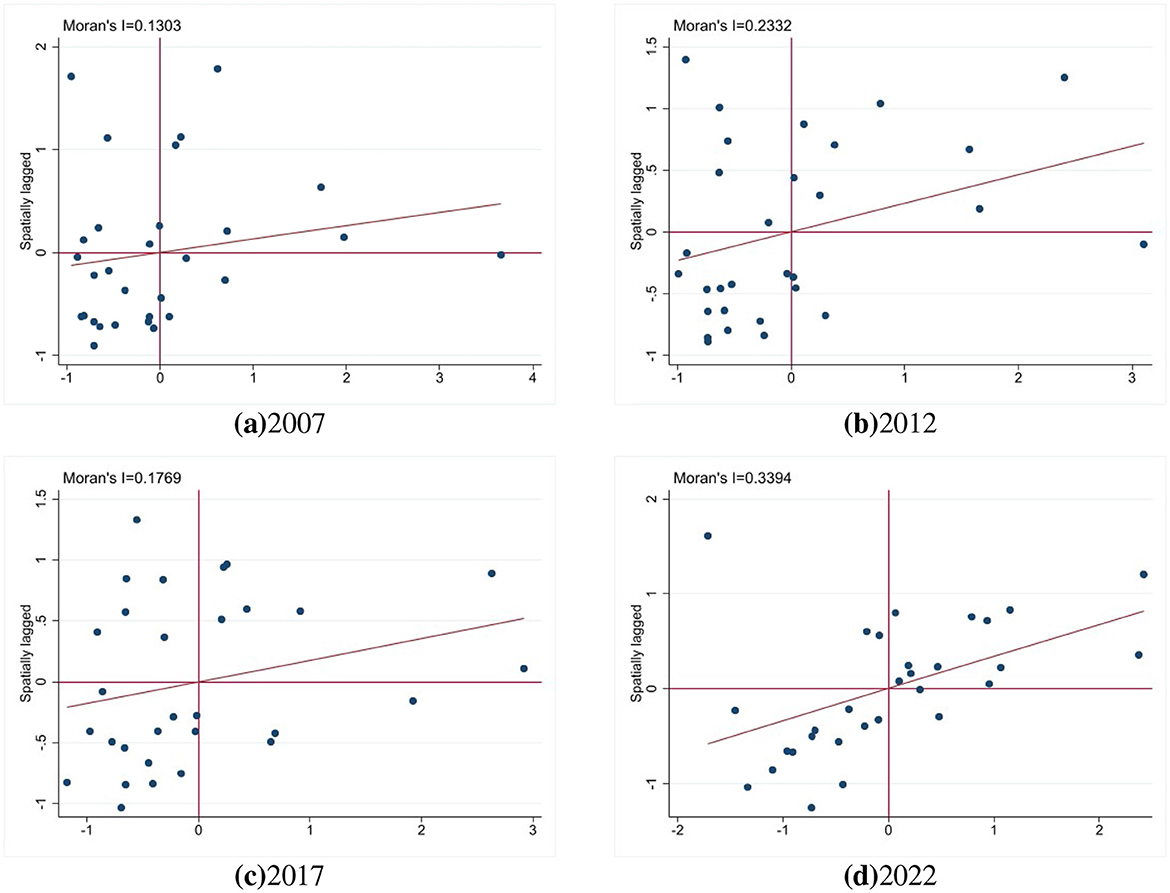
Figure 4. Moran's I scatter plot of TFCP-T. (a) 2007. (b) 2012. (c) 2017. (d) 2022.
3.4 Analysis of influencing factors
Based on the principle of objectivity, this study selects seven explanatory variables—economic development level, openness to foreign trade, government support intensity, environmental protection intensity, informatization level, industrial structure, and consumption level—with provincial TFCP-T as the dependent variable. This framework investigates the influence mechanisms of these determinants on TFCP-T. Specific measurement methods and variable notations are detailed in Table 4.
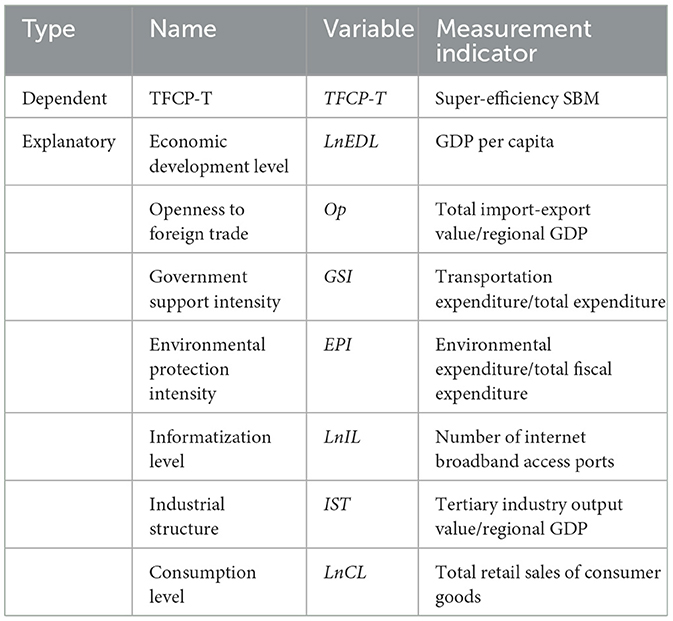
Table 4. Measurement indicators for TFCP-T influencing factors.
To enhance the accuracy of TFCP-T influencing factor analysis, Lagrange Multiplier (LM), Robust-LM, Wald, and Likelihood Ratio (LR) tests were conducted prior to selecting spatial econometric models. Table 5 indicate that under different spatial weight matrices, both LM and Robust-LM tests passed significance thresholds. Furthermore, Wald and LR tests rejected the null hypotheses of simplifying to Spatial Lag Model (SLM) and Spatial Error Model (SEM) at the 1% significance level. Consequently, the Spatial Durbin Model (SDM) is identified as the optimal specification for this study.
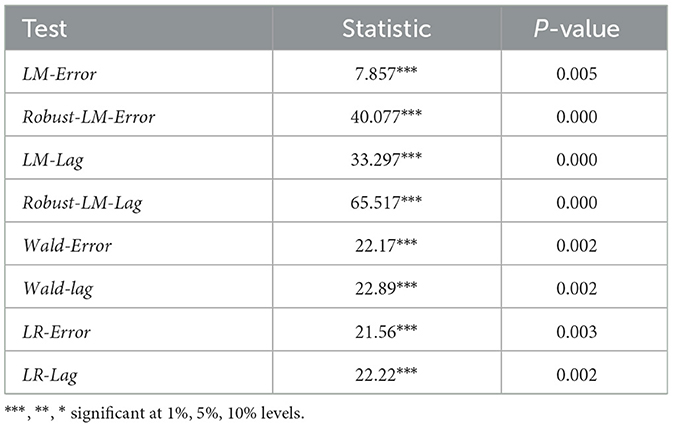
Table 5. Model specification test results.
Additionally, the Hausman test yielded a significantly positive statistic (13.57), rejecting the random effects specification. Consequently, fixed effects models are deemed more appropriate. Fixed effects specifications are categorized into three types: time fixed effects, spatial fixed effects, and two-way fixed effects. Regression analysis was performed to determine the optimal specification, with Table 6 indicating the superiority of individual fixed effects. Thus, this study adopts the spatial Durbin model with individual fixed effects.
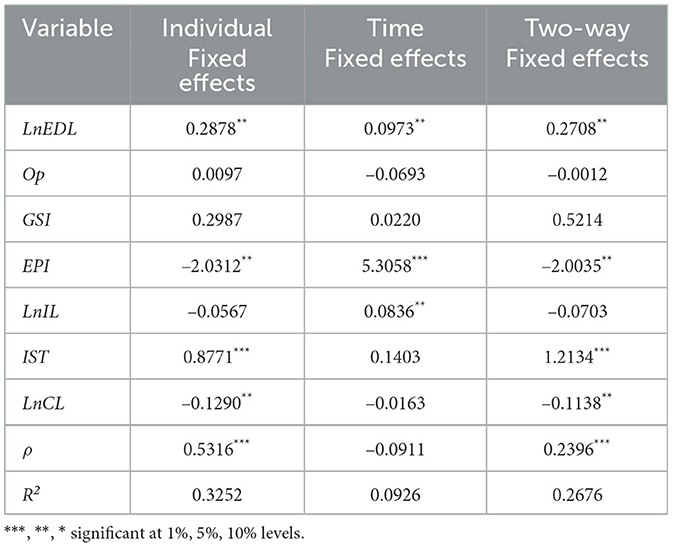
Table 6. Comparison of three fixed effects specifications.
From the regression results of the Spatial Durbin Model (SDM) with individual fixed effects presented below, variables including economic development level, environmental protection intensity, and industrial structure exert statistically significant impacts on TFCP-T. However, since SDM incorporates spatial lags of explanatory variables, the coefficient estimates cannot directly reflect causal mechanisms. Therefore, further effect decomposition is essential to quantify the precise influence pathways. The decomposition results are detailed in Table 7, where direct effects measure local explanatory variables' impact on the local dependent variable, while indirect effects capture neighboring regions' explanatory variables' influence on the local dependent variable.
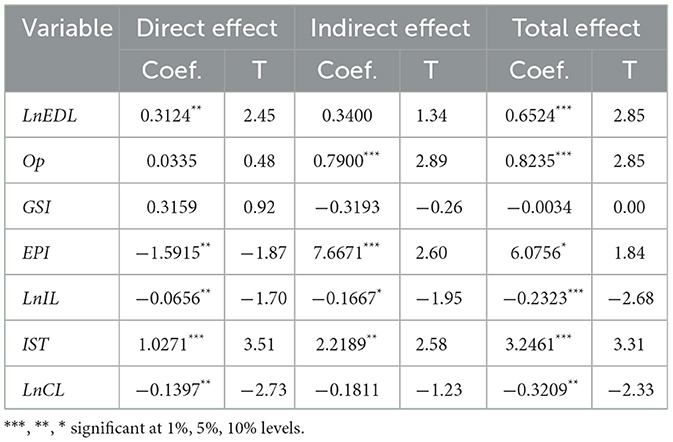
Table 7. Effect decomposition results of explanatory variables.
(1) Analysis of the direct effect of economic development level demonstrates a statistically significant positive impact on local TFCP-T with a coefficient of 0.3124, primarily achieved through two mechanisms: economic development generates ample capital for upgrading transportation infrastructure while simultaneously attracting talent inflows that drive green transportation technology innovation. However, the indirect effect coefficient of 0.3400 lacks statistical significance, indicating no measurable impact on local TFCP-T from neighboring regions' economic development—a phenomenon attributable to inter-provincial competition prevailing over collaborative development initiatives. Nevertheless, the total effect registers at 0.2987 with statistical significance at the 1% level, confirming that economic development collectively enhances TFCP-T across both local and adjacent regions despite the absence of significant spatial spillovers.
(2) Analysis of openness to foreign trade reveals a positive yet statistically insignificant direct effect on local TFCP-T, indicating limited influence primarily due to domestic demand-dominated market structures that diminish the impact of external demand fluctuations. However, significant spatial spillover effects and total effects confirm substantial cross-regional synergies. The positive coefficient direction suggests potential benefits through injecting dynamism into domestic markets, stimulating economic growth, and consequently expanding transportation demand despite local statistical non-significance.
(3) Government support intensity exhibits consistently insignificant effects across all dimensions—local, neighboring regions, and aggregate levels—revealing systematic ineffectiveness in enhancing TFCP-T. This pattern suggests fiscal allocations to transportation infrastructure fail to achieve precision targeting of critical operational bottlenecks, with explanatory factors including fragmented administrative oversight and misaligned funding priorities that collectively undermine policy efficacy.
(4) Environmental protection intensity exhibits a statistically significant negative direct effect on local TFCP-T, revealing substantial suppression primarily stemming from stringent low-carbon regulations imposed amid heightened governmental environmental concerns. Domestic enterprises' limited technological preparedness for green transportation solutions forces costly compliance investments, disproportionately reducing desirable outputs while minimally decreasing undesirable emissions, thereby diminishing comprehensive efficiency. Conversely, significant positive indirect and total effects indicate that neighboring regions' enhanced environmental efforts substantially elevate local TFCP-T. This counterintuitive spatial pattern likely arises from industrial relocation triggered by unbalanced regulatory policies in adjacent areas, redirecting transportation enterprises to comparatively lenient jurisdictions.
(5) Informatization level demonstrates consistently significant negative impacts across all effect dimensions, indicating that digital expansion measured by internet broadband access ports suppresses TFCP-T growth. While broadband proliferation accelerates e-commerce development and stimulates transportation demand, the sector's persistent reliance on extensive development paradigms disproportionately escalates energy consumption and environmental pollution. Consequently, marginal gains in desirable output are outweighed by amplified undesirable output increases, resulting in net efficiency deterioration.
(6) Industrial structure transformation exerts significantly positive effects across direct, indirect, and total dimensions, confirming that tertiary sector expansion substantially enhances both local and regional TFCP-T while generating robust spatial spillovers. This dual-benefit mechanism operates through: optimizing production-consumption coordination to elevate resource allocation efficiency; and reducing aggregate energy intensity and pollution emissions via relative contraction of secondary industry.
(7) Consumption level exerts a statistically significant negative direct effect on local TFCP-T, indicating substantial impediments to efficiency growth. This phenomenon arises from dual demand-side pressures: rising household consumption elevates requirements for transportation services, yet consumers' declining tolerance for traditional extensive transit modes compels massive investments in service quality upgrades. When such expenditures substantially exceed marginal revenue gains from consumption increases, net efficiency declines occur. Future projections suggest potential marginal benefit improvements under technological maturation. The statistically insignificant indirect effect confirms absent spatial spillovers to neighboring regions, while the significantly negative total effect persists system-wide.
To ensure empirical robustness, this study conducts sensitivity analysis by substituting the spatial distance matrix with a spatial adjacency matrix for regression re-estimation. Results presented in Table 8 demonstrate consistent effect directions and significance patterns across all variables, confirming the fundamental stability of our findings.
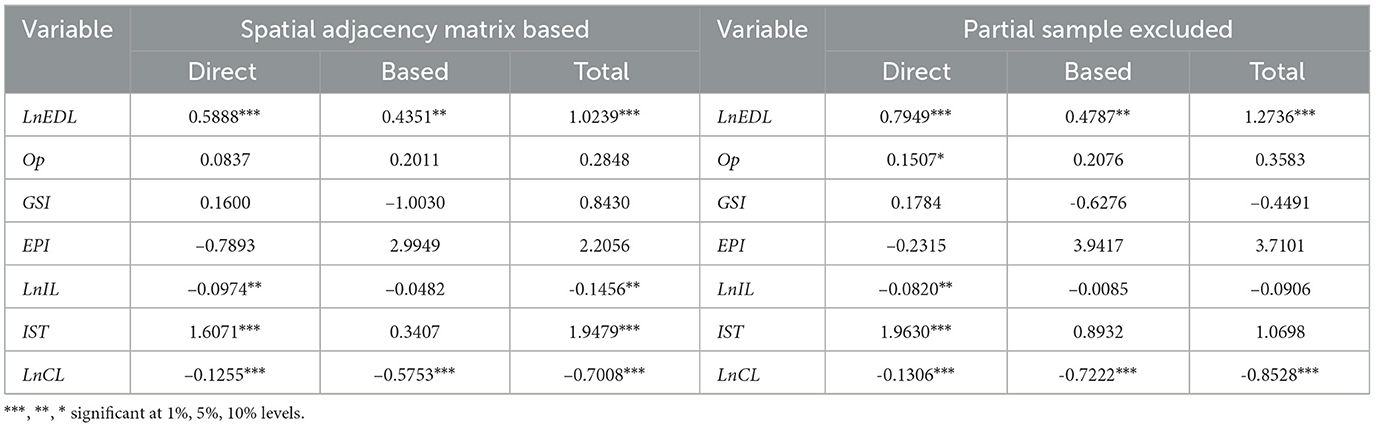
Table 8. Robust test.
4 Conclusions
Based on the spatiotemporal evolution and driving mechanism analysis of Transportation Total Factor Carbon Productivity (TFCP-T) across 30 Chinese provinces from 2007 to 2022, this study yields the following core findings:
(1) China's provincial TFCP-T exhibits an overall fluctuating upward trend, yet regional divergence is pronounced, forming a stepwise distribution pattern characterized by efficient intensification in the East and gradient lag in the Central and Western regions. Coastal provinces in the East have achieved stable high-value, unimodal concentration, leveraging advantages in technological intensification. Conversely, influenced by disparities in development foundations and policy adaptability, the Central and Western regions demonstrate intra-regional efficiency bipolarization (bimodal distribution) coexisting with overall regional lag. The consistent southwestward migration of the national TFCP-T centroid and the continuous expansion of spatial dispersion further corroborate the strengthening trend of regional heterogeneity.
(2) Green TFCP-T displays significant positive spatial correlation, with the dual characteristics of inter-provincial synergy and competition becoming increasingly prominent. High-value agglomeration zones and low-value agglomeration zones have solidified into a bipolar pattern of “coastal bulge and inland depression.” Efficient provinces are concentrated in eastern urban clusters like the Yangtze River Delta and Pearl River Delta, while inefficient areas cluster in the Southwest, Northwest, and Northeast regions. This distribution pattern exposes the structural contradictions of a technology diffusion gap in the East and lagging policy responses in the West, with the Western region particularly facing a systemic risk of low-level lock-in.
(3) The driving mechanism involves a complex interplay of local suppression and neighborhood promotion: Economic development level enhances local efficiency through capital accumulation and technological innovation, yet generates limited spillovers to neighboring regions; openness level, while exhibiting insignificant direct local impact, produces significant positive cross-regional spillovers via technology introduction and resource allocation optimization; industrial structure upgrading simultaneously drives local efficiency growth and coordinated development in neighboring regions by increasing the proportion of tertiary industry, demonstrating strong spatial spillover effects; environmental protection intensity suppresses local transportation output due to short-term policy costs, yet prompts enterprise relocation to neighboring regions and indirectly enhances surrounding efficiency; informationization level stimulates e-commerce logistics expansion, exacerbating carbon emission pressure both locally and in neighboring areas; rising consumption levels trigger excessive investment by transportation enterprises, significantly suppressing local efficiency without spatial spillovers; government support intensity fails to effectively translate into efficiency improvements locally or in adjacent regions due to lack of precision in fund allocation.
5 Recommendations
(1) Governments should actively adopt measures to eliminate inter-regional disparities, achieve resource sharing and mutual assistance in science and technology, fully leverage the achievements of regional integration strategies, and break down inter-regional barriers. Eastern regions should play a crucial leading and supporting role in national carbon reduction, fully utilize their economic, technological, and resource advantages to improve energy efficiency, while tilting capital, technology, and other factors toward the central and western regions to promote balanced development of transportation infrastructure across all regions.
(2) Provinces should promote the integrated development of high-end services and intelligent manufacturing, reduce digital transformation costs, encourage enterprises to incorporate data elements into core production processes, and guide traditional industries to move up the value chain toward R&D design and supply chain management. Relevant departments must consistently prioritize systematic industrial restructuring, increase investment in scientific and technological innovation, advance deep integration of AI, industrial internet, and green design technologies with transportation, manufacturing, and energy sectors, and steer market entities to build a modern industrial system characterized by “digital-driven, low-carbon circular” development, thereby comprehensively enhancing total factor carbon productivity.
6 Discussion
This study, based on provincial panel data revealing the spatio-temporal evolution patterns of transportation carbon productivity (TFCP-T), requires clarification of three underlying issues. (1) Industry-specific analysis is constrained by the objective limitation that provincial energy consumption data lack breakdowns for sub-sectors such as road, rail, and aviation, yet industrial structure (IST) upgrading serves as a policy adjustment proxy variable. Its significant efficiency-enhancing effect indicates that multimodal transport hub construction can indirectly improve carbon efficiency by optimizing transportation mode structures, necessitating future firm-level data to deepen sectoral heterogeneity analysis. (2) The essence of the policy adaptability gap in eastern regions manifests as diminishing marginal returns from technology diffusion and rising policy implementation costs: Figure 1 kernel density curves show decelerated peak efficiency growth in the east after 2015, coupled with local suppression from environmental regulations, rooted in the high innovation costs during mature economies' deep-water transformation phase, requiring cross-provincial carbon compensation mechanisms to share risks. (3) The rationality of methodological assumptions is ensured through model self-verification mechanisms: nonlinear characteristics of technology diffusion are empirically confirmed by kernel density bimodal distribution and club convergence phenomena, which challenge linear simplification assumptions; conclusions of spatial Durbin remaining consistent after altering spatial weight matrices, confirming that independence assumptions do not distort core spatio-temporal heterogeneity mechanisms. These discussions, operating within the provincial spatial econometric framework, provide actionable quantitative benchmarks for low-carbon transportation transition, with future work to deepen policy process analysis using micro-level data.
Data availability statement
The original contributions presented in the study are included in the article/supplementary material, further inquiries can be directed to the corresponding author.
Author contributions
YS: Methodology, Formal analysis, Project administration, Supervision, Conceptualization, Investigation, Resources, Writing – review & editing. JL: Formal analysis, Writing – original draft, Data curation, Software, Visualization. QL: Funding acquisition, Resources, Validation, Writing – review & editing.
Funding
The author(s) declare that financial support was received for the research and/or publication of this article. This study was funded by the Natural Science Foundation of Shandong Province (Grant No. ZR2021MG021) and the Youth Innovation Technology Project of Higher School in Shandong Province (Grant No.2021RW030).
Conflict of interest
The authors declare that the research was conducted in the absence of any commercial or financial relationships that could be construed as a potential conflict of interest.
Generative AI statement
The author(s) declare that no Gen AI was used in the creation of this manuscript.
Publisher's note
All claims expressed in this article are solely those of the authors and do not necessarily represent those of their affiliated organizations, or those of the publisher, the editors and the reviewers. Any product that may be evaluated in this article, or claim that may be made by its manufacturer, is not guaranteed or endorsed by the publisher.
References
Aldy, J. E. (2006). Per capita carbon dioxide emissions: convergence or divergence? Environ. Resour. Econ. 33, 533–555. doi: 10.1007/s10640-005-6160-x
Chang, X., Li, J., and Zheng, Q. (2024). Does new-type infrastructure improve total factor carbon productivity? experimental evidence from China. J. Clean. Prod. 460:142620. doi: 10.1016/j.jclepro.2024.142620
Chen, W., and Yao, L. (2024a). Evaluating the carbon total factor productivity of China: based on cobb-Douglas production function. Environ. Sci. Pollut. Res. 31, 13722–13738. doi: 10.1007/s11356-024-32070-1
Chen, W., and Yao, L. (2024b). The impact of digital economy on carbon total factor productivity: a spatial analysis of major urban agglomerations in China. J. Environ. Manage. 351:119765. doi: 10.1016/j.jenvman.2023.119765
Cui, Y., Zhong, C., Cao, J., Guo, M., and Zhang, M. (2024). Spatial effect of carbon neutrality target on high-quality economic development—channel analysis based on total factor productivity. PLoS ONE 19:e0295426. doi: 10.1371/journal.pone.0295426
Gu, Y., Qi, C., Liu, F., Lei, Q., and Ding, Y. (2023). Spatiotemporal evolution and spatial convergence analysis of total factor productivity of citrus in China. Agriculture 13:1258. doi: 10.3390/agriculture13061258
Hasanov, F. J., Sbia, R., Papadas, D., and Kostakis, I. (2024). The consumption-based carbon emissions effects of renewable energy and total factor productivity: the evidence from natural gas exporters. Energy Rep. 12, 5974–5989. doi: 10.1016/j.egyr.2024.11.054
He, W., Li, Y., Meng, X., Song, M., Ramsey, T. S., and An, M. (2024). Will green technological progress help industrial collaborative agglomeration increase regional carbon productivity: evidence from Yangtze river delta urban agglomerations. Environ. Dev. Sustain. 26, 26019–26046. doi: 10.1007/s10668-023-03716-w
Jiang, Y., Guo, Y., Bashir, M. F., and Shahbaz, M. (2024). Do renewable energy, environmental regulations and green innovation matter for China's zero carbon transition: evidence from green total factor productivity. J. Environ. Manage. 352:120030. doi: 10.1016/j.jenvman.2024.120030
Kaya, Y., and Yokobori, K. (1997). Environment, Energy, and Economy: Strategies for Sustainability. Tokyo: United Nations University Press.
Kong, L., Jin, X., Xu, Y., and Xu, K. (2024). The impact of China's total carbon emission control policy on low carbon total factor productivity. Ind. Innov. 32, 1–27. doi: 10.1080/13662716.2024.2388648
Lee, C., and Ogata, S. (2025). Analysis of green total factor energy efficiency in OECD countries based on a super-efficiency SBM-DEA model. Int. J. Econ. Energy Environ. 10, 31–45. doi: 10.11648/j.ijeee.20251002.12
Li, Y., Du, Q., Lu, X., Wu, J., and Han, X. (2019). Relationship between the development and co2 emissions of transport sector in China. Transport. Res. Part D: Trans. Environ. 74, 1–14. doi: 10.1016/j.trd.2019.07.011
Liu, X., He, Z., Deng, Z., and Poddar, S. (2024a). Analysis of spatiotemporal disparities and spatial spillover effect of a low-carbon economy in Chinese provinces under green technology innovation. Sustainability 16:9434. doi: 10.3390/su16219434
Liu, Y., Wang, Y., Yan, B., and Zhang, H. (2024b). The impact of new infrastructure development on urban total factor carbon productivity-empirical evidence based on Chinese cities. Front. Environ. Sci. 12:1432534. doi: 10.3389/fenvs.2024.1432534
Pan, W., Xie, T., Wang, Z., and Ma, L. (2022). Digital economy: an innovation driver for total factor productivity. J. Bus. Res. 139, 303–311. doi: 10.1016/j.jbusres.2021.09.061
Su, T., Chen, Y., and Lin, B. (2023). Uncovering the role of renewable energy innovation in China's low carbon transition: evidence from total-factor carbon productivity. Environ. Impact Assess. Rev. 101:107128. doi: 10.1016/j.eiar.2023.107128
Sun, Y., Chen, B., and Li, Q. (2024). Impact of urban form in the yangtze river delta of China on the spatiotemporal evolution of carbon emissions from transportation. Sustainability 16:9678. doi: 10.3390/su16229678
Tan, R., and Zhou, Z. (2025). Research on the impact of green investment on low-carbon economic development: based on the test of spatial spillover effect. Sustainability 17:2185. doi: 10.3390/su17052185
Tone, K. (2001). A slacks-based measure of efficiency in data envelopment analysis. Eur. J. Oper. Res. 130, 498–509. doi: 10.1016/S0377-2217(99)00407-5
Tone, K., and Sahoo, B. K. (2004). Degree of scale economies and congestion: a unified dea approach. Eur. J. Oper. Res. 158, 755–772. doi: 10.1016/S0377-2217(03)00370-9
Wang, B., Liu, M., and Gao, S. (2025a). Temporal-spatial evolution analysis of carbon emission efficiency in the logistics industry of coastal provinces in China based on the super-efficiency SBM model. Carbon Balance Manag. 20, 1–24. doi: 10.1186/s13021-025-00299-z
Wang, C., Ibrahim, H., Wu, F., and Chang, W. (2025b). Spatial and temporal evolution patterns and spatial spillover effects of carbon emissions in China in the context of digital economy. J. Environ. Manage. 373:123811. doi: 10.1016/j.jenvman.2024.123811
Wang, L., Wang, H., Cao, Z., He, Y., Dong, Z., and Wang, S. (2022a). Can industrial intellectualization reduce carbon emissions?—Empirical evidence from the perspective of carbon total factor productivity in China. Technol. Forecast. Soc. Change 184:121969. doi: 10.1016/j.techfore.2022.121969
Wang, Q., Li, L., and Li, R. (2022b). The asymmetric impact of renewable and non-renewable energy on total factor carbon productivity in 114 countries: do urbanization and income inequality matter? Energy Strat. Rev. 44:100942. doi: 10.1016/j.esr.2022.100942
Wei, C., Ni, J., and Du, L. (2012). Regional allocation of carbon dioxide abatement in China. China Econ. Rev. 23, 552–565. doi: 10.1016/j.chieco.2011.06.002
Wu, Z., and Wang, X. (2025). The impacts of smart city construction on carbon total factor productivity: empirical evidence from China. Clean Technol. Environ. Policy 27, 403–422. doi: 10.1007/s10098-024-02865-4
Zhang, S., Cheng, L., Ren, Y., and Yao, Y. (2024). Effects of carbon emission trading system on corporate green total factor productivity: does environmental regulation play a role of green blessing? Environ. Res. 248:118295. doi: 10.1016/j.envres.2024.118295
Keywords: total factor carbon productivity in transportation (TFCP-T), standard deviational ellipse (SDE), Moran's I, spatial Durbin, kernel density estimation
Citation: Sun Y, Liu J and Li Q (2025) Spatiotemporal dynamics and driving mechanisms of total factor carbon productivity in China's provincial transportation sector. Front. Clim. 7:1624297. doi: 10.3389/fclim.2025.1624297
Received: 07 May 2025; Accepted: 24 June 2025;
Published: 10 July 2025.
Edited by:
Sherif Goubran, American University in Cairo, EgyptReviewed by:
Ying Zhu, Xi'an University of Architecture and Technology, ChinaZhenyu Zhang, Nanjing University, China
Sandeep Poddar, Lincoln University College, Malaysia
Yaohui Liu, Shandong Jianzhu University, China
Copyright © 2025 Sun, Liu and Li. This is an open-access article distributed under the terms of the Creative Commons Attribution License (CC BY). The use, distribution or reproduction in other forums is permitted, provided the original author(s) and the copyright owner(s) are credited and that the original publication in this journal is cited, in accordance with accepted academic practice. No use, distribution or reproduction is permitted which does not comply with these terms.
*Correspondence: Yanming Sun, c2tkOTk0NDExQHNkdXN0LmVkdS5jbg==; c3VuMzMxMUAxMjYuY29t