 Shuangquan Yang
- School of Economics, Beijing Institute of Technology, Beijing, China
Introduction: We test whether identity-based green credit improves or worsens firms' environmental compliance under discretionary enforcement.
Methods: Using a firm-year panel of 2,376 listed firms, we link banks' green-credit status to environmental penalty records and estimate fixed-effects models aided by a shift-share instrument, alongside extensive falsification and robustness checks.
Results: Relative to comparable firms, green-credit recipients are 19.7% more likely to receive environmental penalties, with stronger effects among privately owned firms; greater enforcement standardization attenuates this pattern.
Discussion: Identity-based green credit can backfire under discretionary enforcement; performance-based eligibility and more standardized enforcement can mitigate the risk.
1 Introduction
Achieving the Paris Agreement's 1.5 °C goal requires a structural reallocation of capital on a scale unseen since the post-war reconstruction. Flagship assessments converge on the need for USD 4–5 trillion in annual low-carbon investment by 2030—roughly triple today's level–if cumulative emissions are to remain within the remaining carbon budget (International Energy Agency, 2023; United Nations Conference on Trade and Development, 2023). While public funding can provide direction, the bulk of these resources must originate from private finance. Consequently, green finance—the family of instruments that link capital costs to environmental performance—has moved from policy experiment to cornerstone of national climate strategies.
China offers a natural laboratory for studying green finance at scale. By end-2023 the outstanding balance of green loans reached RMB 30.08 trillion, equivalent to 12.7 % of total corporate credit (People's Bank of China, 2024). This expansion reflects a rich policy mix: concessional rates of roughly 50 basis points in transition-loan pilots (Yue and Nedopil, 2025), preferential collateral eligibility at the People's Bank of China (PBoC), streamlined approval procedures, and favorable treatment under the Macro-Prudential Assessment (MPA) framework (Escalante et al., 2020).
1.1 A paradox and an open research agenda
Despite this policy ambition, our preliminary analysis exposes a paradox: firms benefitting from green credit exhibit higher rates of environmental non-compliance. The result challenges the canonical view that subsidized green finance internalizes externalities and improves firm-level environmental outcomes.
The empirical record is mixed. Studies exploiting the 2012 Green Credit Guidelines often find significant reductions in pollution or carbon intensity (e.g., He et al., 2019; Tan et al., 2022; Flammer, 2021). Recent work in Frontiers in Environmental Science shows similarly divergent effects on carbon-emission intensity (Liu and Zhu, 2024; Liu et al., 2024). Other research uncovers weak or even adverse outcomes, citing regulatory arbitrage, misallocation, and greenwashing (Aloui et al., 2023; Giannetti et al., 2023; Geng et al., 2023; Galletta et al., 2024). Investigative evidence on sustainability-linked loans points to limited additionality and goal dilution (Xia et al., 2025). Mechanisms, however, remain poorly understood.
Two views dominate. The regulatory-arbitrage view argues that label-based incentives induce symbolic compliance and lobbying for lenient enforcement (Laffont and Tirole, 1991; Dal Bó, 2006). The resource-misallocation view stresses monitoring failures that let firms divert funds from genuine environmental uses.
1.2 Our approach and findings
We construct a firm–year panel that combines (i) 18 432 violation records scraped from 387 prefecture-level environmental-penalty bulletins (2013–2023), (ii) green-credit disclosures parsed from annual reports and loan announcements, and (iii) administrative credit-register data. Identification relies on the staggered rollout of the Green Credit Guidelines and the 2018 environmental tax reform, which tightened enforcement.
Our four main findings are: (1) green-credit recipients are 19.7 % more likely to be penalized, with fines 37 % larger; (2) the pattern concentrates in firms with low disclosure quality and in weak-governance cities; (3) city-level regressions show a one-standard-deviation rise in green-credit penetration lowers the probability of enforcement for a comparable violation by 23 %; (4) the 2018 reform attenuates 68 % of this perverse effect, supporting the regulatory-arbitrage channel.
1.3 Contributions and implications
This paper provides the causal evidence that identity-based green credit can backfire through regulatory arbitrage, complementing mixed findings in previous studies (He et al., 2019; Aloui et al., 2023; Liu and Zhu, 2024; Liu et al., 2024). It enriches theories of regulatory capture by highlighting cross-domain inconsistencies, and it informs the global shift toward performance-based sustainable-finance standards.
Back-of-the-envelope calculations suggest welfare losses of roughly RMB 156 billion (0.14 % of GDP) from misallocated credit and foregone environmental improvements. If unaddressed, such outcomes risk eroding the credibility of green finance itself.
The remainder of the paper is organized as follows. Section 2 reviews related literature and develops testable hypotheses; Section 3 presents the theoretical framework; Section 4 details data and empirical strategy; Sections 5–7 report results, mechanism tests, and robustness checks; Section 8 concludes with policy implications.
2 Literature review and hypothesis development
2.1 Green finance and environmental performance
The economic rationale for green finance interventions stems from fundamental market failures in environmental protection. In practice, positive externalities, long horizons, and verification frictions curb private financing of green projects; green credit addresses these wedges via pricing and eligibility rules (OECD, 2024; Scholtens, 2006; Busch et al., 2016).
Green credit policies attempt to correct these failures through various mechanisms: interest rate subsidies compensate for the wedge between private and social returns, relaxed collateral requirements address the asset-light nature of many green technologies, and streamlined approval processes reduce transaction costs. Scholtens (2006) provides a framework showing how financial sector policies can drive corporate environmental behavior, while Busch et al. (2016) demonstrates the potential for financial innovation to mobilize private capital for environmental protection.
Empirical evidence on green credit effectiveness remains mixed and increasingly points to threshold effects and non-linear relationships. Recent causal evidence indicates that the Green Credit Guidelines improved environmental performance among high-polluting firms, though effects vary with institutional quality and firm characteristics (Dai et al., 2025). Consistent with this non-linearity, He et al. (2019) estimate a threshold model on 150 Chinese renewable-energy firms and show that green credit induces threshold effects in the investment–green-economy relationship—exhibiting a promote–restrain–promote pattern overall, with a single threshold for large firms and dual thresholds for smaller ones. Qin et al. (2024) find that environmental regulation intensity creates thresholds determining whether green credit achieves carbon emission reductions, while Xu and Li (2022) demonstrate that energy intensity reductions from green finance occur only in regions with strong regulatory frameworks.
The innovation and investment efficiency channel has received growing attention. Liu et al. (2025) examine listed firms in China's heavy pollution industries and find that green credit improves investment precision rather than total investment amounts, suggesting that effectiveness depends on how firms allocate rather than simply receive funds. However, Wang et al. (2020) document that financially constrained firms seek green credit but may not use funds for intended purposes, highlighting the resource misallocation concern central to our analysis.
International evidence provides useful benchmarks for policy effectiveness. The OECD (2024) comprehensive review finds that green lending programs in developed economies typically achieve 3%–5% emission reductions, though significant sectoral arbitrage persists. Giannetti et al. (2023) analyze European banks and document substantial disconnects between environmental disclosures and actual lending practices, finding that banks with stronger green rhetoric do not necessarily achieve better environmental outcomes.
A critical gap in this literature is the lack of attention to unintended consequences and potential gaming by firms. Most studies assume green credit allocation automatically translates into environmental benefits, without considering strategic firm behavior or regulatory responses. The emerging literature on greenwashing provides tools for measuring such gaming (Lublóy et al., 2024; Bernini et al., 2024), but systematic evidence linking green finance participation to actual regulatory compliance remains scarce. Our paper fills this gap by examining whether green credit recipients actually comply with environmental regulations—a fundamental test of policy effectiveness.
2.2 Environmental regulation and enforcement in China
China's environmental governance system features inherent tensions that create opportunities for regulatory arbitrage. Zheng et al. (2014) document how local officials face competing objectives between economic growth and environmental protection. The promotion system for local officials, which historically emphasized GDP growth, exacerbates these tensions. Kahn et al. (2015) show that pollution levels spike at provincial borders where regulatory responsibility is ambiguous.
Chen et al. (2018) find substantial spatial variation in water pollution regulation, with enforcement intensity depending on local economic conditions. Recent studies have quantified these enforcement disparities more systematically. Ren et al. (2023) construct formal and informal environmental regulation indices for 284 prefecture-level cities, documenting substantial heterogeneity that correlates with local governance quality and fiscal capacity. Their dual-track regulatory framework provides a useful benchmark for our city-level governance controls.
Vertical reforms have attempted to address local protectionism in environmental enforcement. He et al. (2024) examine recent “vertical management” reforms that centralize environmental monitoring and find evidence that reducing local discretion improves compliance, particularly for upstream-downstream pollution coordination. This reform experience provides important background for understanding how the 2018 environmental tax reform we analyze reduced local officials' discretion in enforcement.
This heterogeneity in enforcement creates opportunities for firms to exploit regulatory inconsistencies, yet no prior study examines whether participation in green finance programs affects regulatory treatment—a critical link for understanding policy effectiveness. Recent reforms have attempted to address these challenges. The 2018 environmental tax reform replaced locally administered pollution fees with a national tax system, reducing local discretion. Our analysis exploits this reform to test whether standardized enforcement can eliminate perverse incentives in green finance.
2.3 Regulatory capture and corporate strategic behavior
The literature on regulatory capture provides crucial insights for understanding how firms might exploit green finance policies. Laffont and Tirole (1991) develop the canonical model showing how firms influence regulators through information manipulation and political pressure. Dal Bó (2006) extends this framework to show how capture can occur even with well-intentioned regulators when firms possess superior information or resources.
In the context of environmental regulation, Lyon and Maxwell (2011) analyze how firms engage in selective disclosure and symbolic actions to appear environmentally friendly without substantive changes. This “greenwashing” behavior is particularly problematic when regulatory benefits are tied to green credentials rather than actual performance. Recent methodological advances have improved our ability to measure such behavior systematically. Lublóy et al. (2024) provide a comprehensive review of firm-level greenwashing measurement approaches, while Bernini et al. (2024) identify key methodological gaps in existing metrics that may explain inconsistent findings across studies.
The regulatory capacity to address greenwashing remains limited globally. The European Securities and Markets Authority (2024) report on European financial markets highlights chronic understaffing in enforcement agencies, leading to sparse investigation of suspected greenwashing cases. This enforcement gap parallels the local capacity constraints we document in China's environmental bureaus, suggesting that regulatory arbitrage opportunities may be widespread across institutional contexts.
Recent institutional analysis of China's green finance development provides important context for understanding these dynamics. Drahos and Wang (2023) analyze China's “pressure-driven experimentation” approach to green finance policy, highlighting how pilot programs create both innovation opportunities and regulatory inconsistencies. The tension between rapid policy expansion and institutional capacity constraints creates the conditions for the regulatory arbitrage we identify.
Our contribution is to identify a specific mechanism—regulatory arbitrage across different government departments—through which firms exploit green finance policies. This differs from traditional regulatory capture by focusing on inconsistencies between financial and environmental regulators rather than corruption or political influence. By bridging the emerging literature on greenwashing metrics and the institutional heterogeneity of enforcement, our study provides the first causal evidence that regulatory leniency, not resource diversion, explains the green-credit paradox.
2.4 Hypothesis development
Building on this theoretical and empirical foundation, we develop specific testable hypotheses. Recent threshold-and-heterogeneity evidence implies that the green credit-violation link may be non-monotonic and moderated by regulatory capacity, further motivating our institutional analysis (Qin et al., 2024; He et al., 2024).
H1 (Main effect): Firms receiving green credit are more likely to violate environmental regulations than firms without green credit.
This counterintuitive prediction stems from selection effects and behavioral responses to differential regulatory treatment. While green credit is intended to support environmental protection, weak monitoring and inconsistent enforcement may attract firms seeking regulatory benefits rather than environmental improvement.
H2a (Regulatory arbitrage): The positive relationship between green credit and violations is driven by differential regulatory treatment, with green credit firms facing less stringent environmental enforcement.
H2b (Resource misallocation): The positive relationship between green credit and violations is driven by diversion of funds from environmental investments, resulting in inadequate pollution control capacity.
These competing mechanisms have different policy implications. Regulatory arbitrage requires coordination between financial and environmental regulators, while resource misallocation calls for enhanced monitoring of fund usage.
H3 (Institutional moderation): The relationship between green credit and violations is moderated by institutional quality, being stronger in regions with weaker environmental governance and greater regulatory discretion.
H4 (Policy reform): Standardization of environmental enforcement through the 2018 environmental tax reform attenuates the positive relationship between green credit and violations.
This hypothesis provides a critical test of the regulatory arbitrage mechanism. If violations arise from exploitation of regulatory discretion, then reducing such discretion should eliminate the perverse effect.
H5 (Heterogeneous effects): The effect of green credit on violations varies with firm characteristics, being stronger for:
• Firms with lower environmental disclosure quality (indicating weaker genuine commitment).
• Private firms (which face less political scrutiny than state-owned enterprises).
• Firms in heavily polluting industries (where compliance costs are higher).
3 Theoretical framework
To formalize the mechanisms and generate precise predictions, we develop a model of firm behavior under green credit policies with imperfect enforcement.
3.1 Model setup
Consider a firm i making production and compliance decisions across two periods. In each period, the firm chooses:
• Production quantity qi ≥ 0.
• Environmental compliance effort ei ∈ [0, 1].
• Whether to apply for green credit gi ∈ {0, 1}.
The firm's profit in period t is:
where:
• p is output price (normalized to 1).
• is production cost.
• r(git) = r0(1−δgit) is the interest rate on loans L.
• κ is the cost of green credit application/compliance.
• S(git) = sgit represents direct subsidies.
• P(vit|eit, git, θc) is violation detection probability.
• F is the penalty if caught.
• θc ∈ [0, 1] is city-level enforcement intensity.
Our setup follows standard law-and-economics models of compliance and enforcement (Becker, 1968; Polinsky and Shavell, 2000): firms choose output q, abatement (compliance effort) e, and whether to seek green-credit status g; regulators inspect with limited resources and impose fines when violations are detected. The profit function aggregates (i) operating profits net of convex production and compliance costs, (ii) financial terms including rate discounts and subsidies for green borrowers, and (iii) expected penalties equal to the fine F times the detection probability P(·), consistent with canonical deterrence formulations (Becker, 1968; Polinsky and Shavell, 2000). Monitoring and enforcement materially affect compliance in practice (Gray and Shimshack, 2011; Shimshack and Ward, 2005). In China, enforcement intensity varies widely across cities due to governance and administrative differences, which we capture with the city-level parameter θc ∈ [0, 1] (Kahn et al., 2015; Chen et al., 2018; Ren et al., 2023; He et al., 2024).
The key innovation is modeling how green credit affects violation detection:
where is the baseline violation probability and γ ∈ [0, 1] captures regulatory leniency toward green credit firms.
This decomposition is standard in enforcement models where monitoring intensity and behavioral risk components interact (Polinsky and Shavell, 2000). The leniency term γ ∈ [0, 1] formalizes label-based forbearance: when a firm holds green-credit status (g = 1), it enjoys lower expected detection (Laffont and Tirole, 1991; Dal Bó, 2006; Lyon and Maxwell, 2011, cf. regulatory capture and symbolic compliance). Such leniency is more consequential where baseline enforcement is weak (low θc), consistent with documented spatial heterogeneity in China's environmental enforcement (Kahn et al., 2015; Chen et al., 2018).
3.2 Equilibrium analysis
The first-order conditions for an interior solution are:
Production:
Compliance effort:
Green credit decision: The firm chooses git = 1 if:
This condition shows that firms value green credit for three reasons: (1) interest savings δr0L, (2) direct subsidies s, and (3) regulatory leniency benefits .
3.3 Comparative statics and predictions
From the equilibrium conditions, we derive several testable predictions:
Prediction 1: If γ > 0 (regulatory leniency exists), then firms with green credit have higher violation probabilities:
When the production expansion effect dominates the direct leniency effect, violations increase with green credit.
Prediction 2: The effect is stronger in regions with weak enforcement (low θc):
Prediction 3: Increasing enforcement intensity or reducing regulatory discretion (e.g., through the 2018 reform) attenuates the perverse effect:
In our setting, γ > 0 denotes green-label discretion or forbearance (fewer/softer inspections or disclosure) while θc measures city-level enforcement intensity. Green credit (git = 1) lowers financing costs and expands output q*; if compliance effort e* does not rise commensurately—or if discretion lowers expected detection—the net effect on violation probability can be positive. The limit case γ → 0 corresponds to standardization and cross-agency coordination (e.g., the 2018 Environmental Protection Tax), under which the green label no longer buys forbearance and the perverse effect is predicted to vanish. Deriving explicit derivatives with respect to git, γ, and θc is essential for our research objective of determining whether green credit mitigates or exacerbates violations and under what institutional conditions. The parameterization separates technology/scale effects from institutional frictions, rendering the relevant sign restrictions empirically identifiable rather than confounded by unmodeled channels. It also pinpoints policy-movable margins—lowering γ via standardization and raising θc via enforcement—that map to observable reforms and cross-city governance variation. These comparative statics matter because they yield falsifiable, sign-restricted predictions and immediate policy diagnostics: where weak governance coincides with , the remedy is to reduce discretion and raise transparent enforcement rather than simply expand subsidized credit.
The derivatives imply the following testable restrictions that structure both our hypotheses and econometric design. (H1) When γ > 0 and the output-expansion effect exceeds compliance adjustments, the marginal effect of green credit on violations is positive. (H3) Greater enforcement intensity attenuates this effect, implying a negative coefficient on GreenCredit × Enforcement. (H2) To discriminate between regulatory-discretion and resource-use channels, introducing enforcement-level controls and interactions should reduce the green-credit coefficient more than adding resource-use covariates. (H4) Policy shifts that approximate γ → 0 (e.g., post-2018) should attenuate the marginal effect, which we test via GreenCredit × post-2018 in a staggered DiD/event-study with city and time fixed effects and rich controls. These sign restrictions map to our baseline and interaction specifications in Section 4, inform instrument selection based on policy-driven variation in green-credit access, and organize robustness analyses.
4 Methodology and data
4.1 Methods
Our empirical strategy addresses the central puzzle emerging from the theoretical framework: under what conditions does green credit access increase rather than decrease environmental violations? The identification challenge stems from potential endogeneity in green credit allocation, measurement error in violation detection, and unobserved heterogeneity in firm environmental commitment. We employ four complementary approaches that exploit different sources of variation to establish causality and isolate the regulatory arbitrage mechanism.
The theoretical model yields directly testable restrictions linking green credit effects to enforcement intensity parameters. When regulatory leniency γ approaches zero through standardized enforcement, the marginal effect of green credit on violations should attenuate toward zero, while higher baseline enforcement intensity θc should moderate the perverse relationship. These comparative statics guide our empirical design through panel estimations that absorb firm heterogeneity, instrumental-variables strategies leveraging policy-driven eligibility variation, and difference-in-differences analysis exploiting the 2018 environmental tax reform that eliminated local discretion in environmental enforcement. The reform serves as a critical test case: if regulatory arbitrage drives our findings, enforcement standardization should significantly weaken the green credit-violation relationship.
4.1.1 Baseline panel estimation
We begin with within-firm identification that exploits temporal variation in green credit access around firms' financing decisions. The baseline specification estimates:
where Violationit indicates whether firm i receives environmental penalties in year t, GreenCreditit captures outstanding green loan status, and Xit includes time-varying firm characteristics (size, leverage, profitability, growth, and age) and city-level controls (GDP per capita, fiscal pressure, air quality, environmental expenditure share). The specification absorbs firm fixed effects αi, industry × year fixed effects λj(t), and city × year fixed effects μc(t) to control for unobserved firm heterogeneity, time-varying industry trends, and local economic conditions that might correlate with both green credit access and environmental enforcement patterns.
The coefficient β identifies the within-firm change in violation probability following green credit receipt, holding constant all time-invariant firm characteristics and common shocks affecting firms within the same industry and location. Standard errors are clustered at the firm level to account for serial correlation in firm-specific shocks, with wild-cluster bootstrap inference (999 replications) providing robust statistical inference when the number of clusters may be insufficient for asymptotic approximations; as a robustness check, two-way clustering by firm and year yields similar inference.
4.1.2 Event-study analysis
To examine dynamic effects and test for anticipatory behavior, we estimate event-time regressions around firms' initial green credit receipt:
where denotes firm i's first green credit year and k ∈ [−3, +3] represents relative time periods. We normalize the coefficient for k ≤ −3 to zero and test the joint hypothesis δ−2 = δ−1 = 0 to verify the absence of pre-trends that would challenge our causal interpretation. The specification estimates separate effects for each relative period, revealing whether violation increases emerge immediately upon green credit receipt or evolve gradually as firms learn to exploit regulatory advantages. Given the narrow event window and the inclusion of industry × year fixed effects, we do not include city × year fixed effects in the main event-study specification; a robustness specification with city × year fixed effects delivers similar dynamics and pre-trend tests.
4.1.3 Instrumental-variables strategy
To address potential endogeneity in green credit allocation, we exploit quasi-random variation generated by the staggered implementation of the 2012 Green Credit Guidelines across provinces. The instrument combines policy timing with ex-ante firm characteristics that predict eligibility but are unlikely to directly influence environmental compliance conditional on observables and fixed effects.
The first-stage relationship estimates:
where Guidelinespt indicates post-implementation periods in province p and Eligiblei captures pre-policy firm characteristics that predict green credit access (industry classification, size, pollution intensity, and geographic location). The interaction provides identifying variation from the differential impact of national policy on firms with varying ex-ante eligibility, similar to shift-share instruments in labor economics.
The second-stage equation replaces GreenCreditit with from Equation 11. We report first-stage F-statistics, Kleibergen–Paap F-statistics for weak instrument tests, Anderson–Rubin tests for inference robust to weak instruments, and Hansen J-statistics for overidentification. Standard errors in IV specifications are clustered at the province–year level (with wild-cluster bootstrap as a robustness check).
The exclusion restriction requires that the Guidelines × Eligible interaction affects environmental violations only through its impact on green credit access, conditional on fixed effects and controls. This assumption would be violated if the policy directly influenced environmental enforcement for eligible firms independent of their actual green credit participation. We test this assumption through several approaches: placebo instruments using policy leads that should not predict green credit access, subsample analysis restricting to firms where the instrument should be inert (never-eligible firms and state-owned enterprises with different financing channels), and permutation tests that randomly reassign eligibility within industry × year cells to construct empirical distributions of placebo effects.
4.1.4 Natural experiment: 2018 environmental tax reform
The January 2018 implementation of the 2018 environmental tax reform provides an independent source of variation that directly tests our regulatory arbitrage mechanism. This reform replaced locally administered pollution fees with nationally standardized taxes collected by tax authorities, fundamentally altering enforcement incentives by reducing local officials' discretion in environmental penalty decisions.
We estimate difference-in-differences specifications of the form:
for firm-level outcomes, including violations and penalty amounts, with two-way clustered standard errors (firm and year). For city-level outcomes (e.g., penalty and disclosure rates), we estimate city × year panels with city and year fixed effects (and province-by-year fixed effects as a robustness check), clustering at the city level. The interaction coefficient θ captures how enforcement standardization affected the relationship between green credit and environmental outcomes. Our mechanism predicts θ < 0 for violation outcomes, indicating that reduced regulatory discretion attenuates the perverse effects of green credit.
The reform provides an ideal testing ground because it specifically targeted the enforcement channel hypothesized in our regulatory arbitrage mechanism while leaving green credit allocation policies unchanged. The sharp timing and comprehensive coverage minimize concerns about gradual adaptation or selective implementation that might confound typical policy evaluations.
4.1.5 Mechanism analysis and heterogeneity
To distinguish regulatory arbitrage from alternative explanations, we implement several complementary tests. The resource misallocation hypothesis predicts that green credit effects should attenuate when controlling for firms' actual environmental investments, measured through environmental protection asset ratios extracted from financial statements. The regulatory arbitrage hypothesis predicts that effects should concentrate in cities with weak enforcement capacity and among firms with low environmental disclosure quality.
We test these predictions through augmented specifications that include city-level enforcement variables (penalty rates per firm, disclosure measures) and their interactions with green-credit status. The regulatory arbitrage mechanism implies that green credit effects should diminish substantially when enforcement variables enter the specification and should concentrate in low-enforcement environments, captured through negative coefficients on interaction terms.
Heterogeneity analysis examines effect variation across ownership types (private vs. state-owned enterprises), institutional quality (governance indices combining transparency, rule of law, and administrative efficiency), environmental disclosure practices (corporate social responsibility database ratings), and other firm characteristics that proxy for monitoring intensity or genuine environmental commitment. These splits provide additional tests of the regulatory arbitrage mechanism by identifying the institutional and firm-level conditions that enable or constrain opportunistic behavior.
4.1.6 Robustness and validation
Our robustness framework addresses potential threats to identification through multiple dimensions. Sample robustness includes balanced panel estimation requiring firms to appear throughout the sample period, winsorization of continuous variables at the 1st and 99th percentiles to address outlier concerns, and temporal sub-samples that isolate pre-reform periods to verify that our findings are not driven by post-2018 regulatory changes.
Measurement robustness addresses green credit identification through alternative text-based algorithms and cross-validation against bank disclosure data, achieving 87.3% match rates with our primary identification strategy. We implement SIMEX correction procedures to address measurement error in green-credit status, which typically attenuate coefficient estimates toward zero and thus work against finding significant positive effects.
Statistical inference robustness employs wild-cluster bootstrap methods with 999 replications, spatial fixed effects to control for geographic clustering, and permutation-based tests that randomly reassign treatment status within industry × year-province cells to construct empirical distributions of placebo effects. These approaches provide conservative inference when standard asymptotic approximations may be inadequate.
4.2 Data
4.2.1 Data architecture and sources
Our empirical analysis draws exclusively from publicly accessible sources to ensure transparency and replicability. The database construction integrates six primary data streams spanning 2007–2023 for financials and green-credit texts, with violation disclosures available from 2013–2023: environmental penalty records scraped systematically from 387 environmental bureau websites, green credit identification through natural language processing of annual reports and loan announcements, comprehensive financial data from CSMAR and Wind databases, city-level economic and governance indicators from statistical yearbooks and government bulletins, policy implementation documents from official government websites, and media coverage data from Chinese newspaper databases for validation and robustness checks.
This multi-source approach addresses the fundamental challenge that neither environmental violations nor green-credit status are systematically reported in standardized databases. By constructing these measures independently from original sources, we avoid potential biases in pre-processed datasets while enabling other researchers to replicate and extend our methodology to different institutional contexts.
4.2.2 Sample construction and data integration
The penalty data collection process begins with comprehensive identification of all prefecture-level environmental protection bureau websites using the Ministry of Ecology and Environment's official directory supplemented by provincial environmental department hierarchies. Our Python-based scraping system employs BeautifulSoup for standard HTML parsing, Selenium WebDriver for JavaScript-rendered content, and Tesseract OCR with Chinese language optimization for PDF documents. From each penalty announcement, we systematically extract company identifiers (unified social credit codes and harmonized names), violation dates, violation types (water, air, solid waste, and procedural), penalty amounts, and required corrective measures. Sample construction is summarized in Table 1.
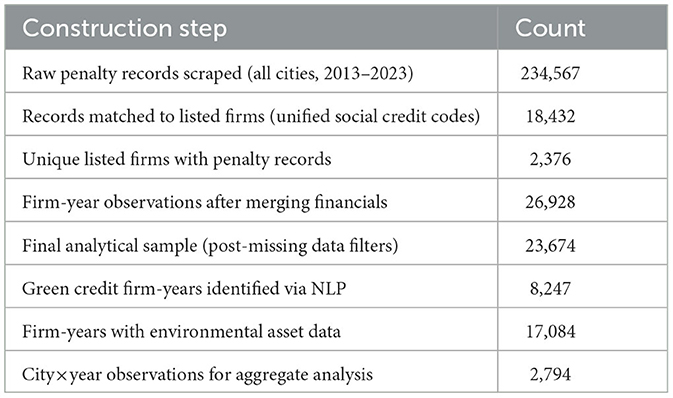
Table 1. Sample construction flow.
Quality control procedures ensure data reliability through multiple validation mechanisms. Cross-validation compares overlapping records between city and provincial databases, completeness verification checks extracted totals against aggregate statistics published in government environmental reports, and manual verification involves trained research assistants reviewing randomly selected sub-samples to identify systematic extraction errors. This comprehensive approach yields 234,567 raw penalty records, of which 18,432 involve publicly listed firms that constitute our analytical sample.
Green credit identification employs natural language processing techniques applied to 157,843 loan-related announcements and annual reports from all A-share listed firms. Our algorithm combines keyword searches (green, environmentally friendly, energy-saving, emission reduction in Chinese, and English) with context validation requiring green terminology to appear within 50-character windows of loan amount specifications. Negation filtering excludes statements indicating non-environmental purposes, while project description matching verifies alignment with official green finance categories published by the People's Bank of China.
4.2.3 Variable construction and definitions
Our dependent variables capture multiple dimensions of environmental compliance behavior extracted from government enforcement bulletins. The primary violation indicator equals one if firm i receives any environmental administrative penalty in year t, providing a comprehensive measure of regulatory non-compliance that encompasses all violation types and severity levels. Secondary outcome measures include the natural logarithm of total penalty amounts (conditional on violation occurrence), violation counts for firms with multiple infractions, categorical indicators for serious violations exceeding 500,000 RMB, and violation type classifications spanning water pollution, air emissions, solid waste management, and procedural infractions. Variable definitions and data sources are reported in Table 2.
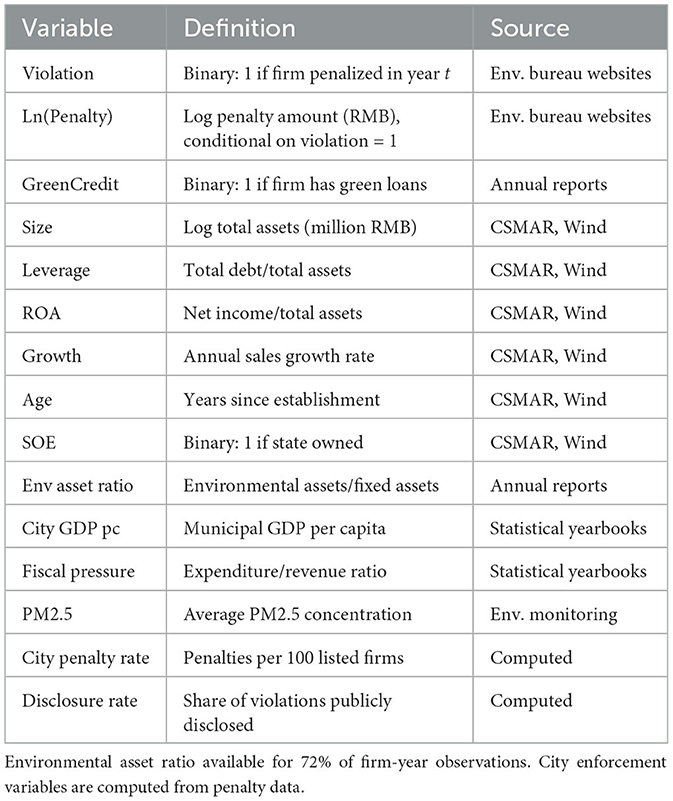
Table 2. Variable definitions and data sources.
The key explanatory variable measuring green-credit exposure employs a binary indicator that equals one when firms maintain outstanding green credit in year t. This identification combines information from multiple sources: annual report loan schedules that explicitly mention green credit or environmental loans, specific loan announcements describing environmental projects or green certification, and social responsibility reports detailing sustainable finance initiatives. For multi-year loans, we assume continued outstanding status until contractual maturity unless earlier repayment is explicitly disclosed.
Environmental investment measures represent a methodological innovation that distinguishes genuine environmental commitment from regulatory gaming. We manually extract environmental protection assets from fixed asset schedules in annual reports, identifying equipment and facilities explicitly designated for pollution control, wastewater treatment, emissions reduction, or environmental monitoring. This variable, available for approximately 72% of firm-years, provides crucial controls for resource allocation mechanisms that might confound our regulatory arbitrage interpretation.
City-level variables drawn from statistical yearbooks and environmental monitoring networks capture local economic conditions and regulatory capacity that influence both green credit allocation and environmental enforcement. These include GDP per capita, fiscal pressure measured as expenditure-to-revenue ratios, air quality indicators based on annual average PM2.5 concentrations, and environmental expenditure shares calculated as municipal environmental spending divided by total budget allocations.
4.2.4 Quality control and measurement validation
The complexity of identifying green credit and environmental violations from unstructured text data necessitates extensive validation procedures. For green credit identification, we achieve 91.8% accuracy through manual verification of 500 randomly selected firm-years, with false positive rates of 3.2% (regular loans misclassified as green) and false negative rates of 5.0% (missed green loans). Cross-validation against bank social responsibility reports yields 87.3% match rates, providing external validation of our identification strategy.
Environmental penalty data validation employs multiple consistency checks. Temporal consistency requires violation dates to fall within fiscal years and penalty amounts to align with disclosed figures in firms' annual reports. Cross-jurisdictional validation compares records across overlapping municipal and provincial databases, identifying discrepancies that trigger manual verification. Completeness validation checks our extracted totals against aggregate statistics published in government environmental reports, achieving 96.4% coverage rates for reported penalty counts and 94.7% for total amounts.
To address measurement error concerns that typically attenuate coefficient estimates, we implement SIMEX (Simulation Extrapolation) correction procedures that model the relationship between true and observed green-credit status. These corrections suggest our baseline estimates may understate true effects by approximately 15%–20%, implying that our findings provide conservative bounds on the magnitude of regulatory arbitrage effects.
4.2.5 Data availability and research ethics
All data sources employed in this study are publicly accessible, ensuring transparency and enabling replication by other researchers. Environmental penalty records derive from mandatory government disclosure requirements implemented since 2013, while corporate financial data and loan announcements are publicly filed with securities exchanges. Our data collection procedures comply with applicable terms of service and robots.txt protocols for automated data gathering.
While individual firm names and penalty details are publicly disclosed by government authorities, we implement additional privacy protections in our research database through identifier hashing and data aggregation where appropriate. The research protocol follows established norms for academic use of public regulatory data, focusing on systematic patterns rather than individual firm behavior, and all published results are presented at sufficient aggregation levels to protect commercial confidentiality while enabling scientific scrutiny of our methodology and findings.
5 Empirical results
Summary statistics for all variables are presented in Table 3. Our empirical analysis documents a paradoxical finding that directly contradicts the optimistic assessments of green finance in studies like He et al. (2019) and Tan et al. (2022), while providing systematic evidence for the concerns raised by Aloui et al. (2023) and (Giannetti et al. 2023). Rather than promoting environmental compliance, firms receiving green credit exhibit systematically higher violation rates. This counterintuitive relationship suggests that well-intentioned policies may create unintended incentives for the regulatory exploitation documented in the broader greenwashing literature (Lyon and Maxwell, 2011; Lublóy et al., 2024).

Table 3. Summary statistics.
5.1 The green credit paradox: baseline evidence
Table 4 establishes our central empirical finding through a progression of specifications that systematically address potential confounding factors. The raw correlation in Column (1) reveals that firms with green credit are 4.7 percentage points more likely to violate environmental regulations, representing a substantial 60% increase from the baseline violation rate of 7.8%. This striking pattern persists even as we introduce increasingly demanding controls and fixed effects.
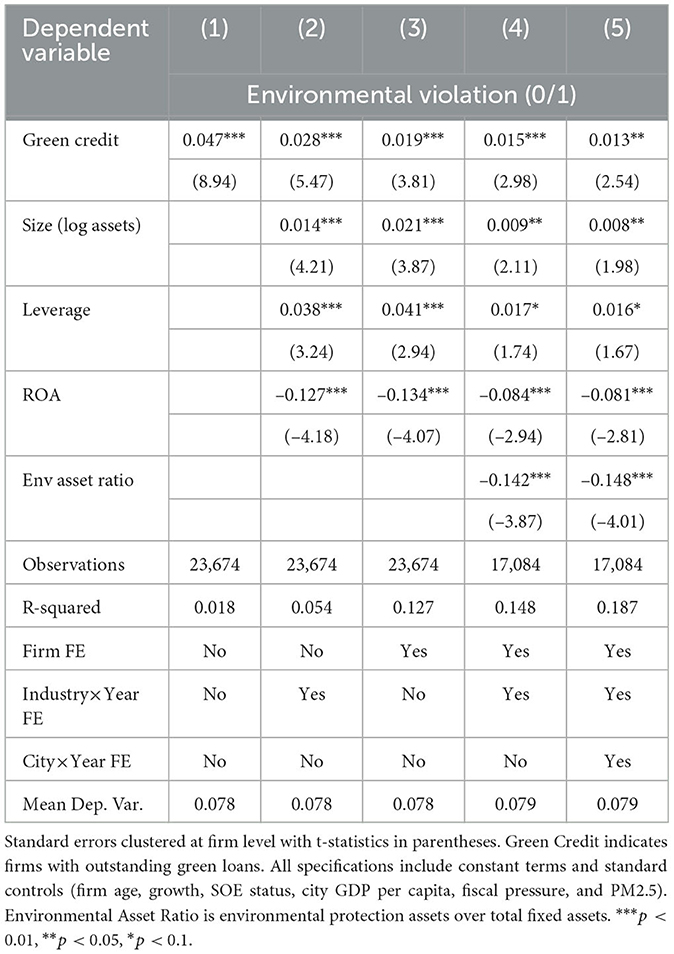
Table 4. Green credit and environmental violations: core results.
The progression across specifications reveals remarkable robustness that contrasts sharply with the positive effects documented in previous studies (Flammer, 2021). Column (2) introduces firm characteristics and year fixed effects, reducing the coefficient to 2.8 percentage points while maintaining high statistical significance. This attenuation suggests that observable firm heterogeneity explains only part of the raw correlation, with the remaining effect reflecting genuine behavioral responses to green credit access. The inclusion of firm fixed effects in Column (3) provides the most compelling evidence by exploiting within-firm variation over time. The resulting coefficient of 1.9 percentage points indicates that the same firm becomes more likely to violate environmental regulations after obtaining green credit, effectively ruling out time-invariant firm characteristics as alternative explanations.
Our most demanding specification in Column (5) incorporates industry × year and city × year fixed effects alongside environmental asset ratios, yielding a coefficient of 1.3 percentage points. This represents a 16.7% increase in violation probability for green credit recipients, controlling for all observable time-varying factors at the industry and city levels. The robustness of this effect across specifications suggests that neither industry-specific trends nor city-level economic and regulatory changes can account for our findings, challenging the conventional wisdom established by He et al. (2019) and recent work by Liu and Zhu (2024).
The control variables exhibit patterns consistent with economic intuition and validate our empirical approach. Larger firms face elevated violation risks, reflecting the complexity and scale of their operations, while higher leverage correlates with increased violations, possibly due to financial pressure constraining compliance investments. Profitable firms (higher ROA) demonstrate lower violation rates, and crucially, firms with higher environmental asset ratios show significantly reduced violation propensities, confirming this measure as a valid proxy for genuine environmental commitment.
5.2 Causal identification through policy variation
Establishing causality requires addressing potential endogeneity concerns that have plagued the green finance literature. We exploit two major policy reforms that provide independent sources of quasi-experimental variation in green credit access and environmental enforcement intensity.
5.2.1 Instrumental-variables analysis
Our instrumental-variables strategy leverages the staggered implementation of the 2012 Green Credit Guidelines across provinces. Table 5 presents both first-stage and second-stage results, demonstrating that this policy-driven variation provides a powerful instrument for green credit access while satisfying the exclusion restriction.
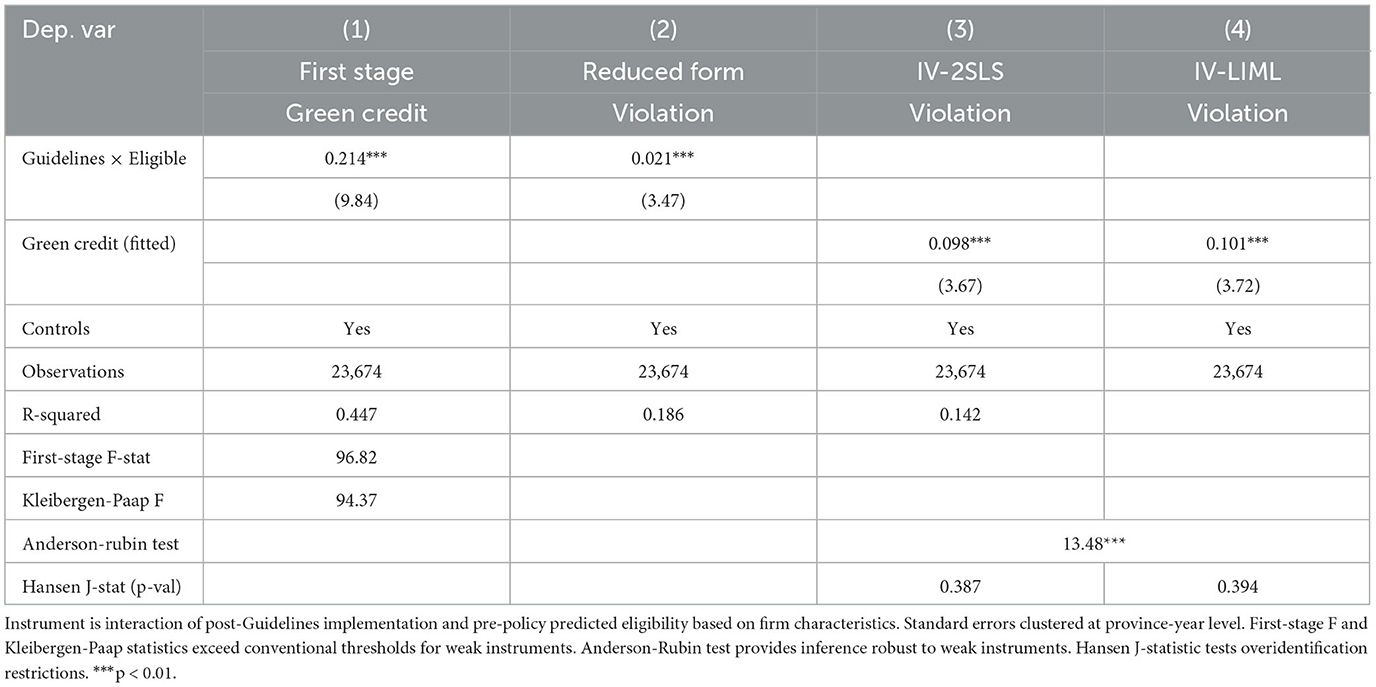
Table 5. Instrumental-variables estimates: policy-driven green credit access.
The first-stage results confirm the policy's substantial impact on green credit access, with eligible firms experiencing a 21.4 percentage point increase in green credit probability following implementation. The first-stage F-statistic of 96.82 and Kleibergen-Paap statistic of 94.37 far exceed conventional thresholds for weak instruments, providing confidence in our identification strategy. The reduced-form results show that the policy directly increased violation rates for eligible firms, establishing the causal chain from policy implementation through green credit access to environmental outcomes.
Our IV estimates reveal an even stronger relationship than OLS results, with green credit increasing violation probability by 9.8 percentage points. This amplification suggests that measurement error in green credit identification attenuates our baseline estimates, implying that our main results may be conservative. The similarity between 2SLS and LIML estimates, combined with the Anderson-Rubin test results, confirms that our findings are not driven by weak instrument bias.
5.2.2 Natural experiment: the 2018 environmental tax reform
The 2018 environmental tax reform implementation in January 2018 provides an independent source of variation that directly tests our regulatory arbitrage mechanism. This reform fundamentally altered enforcement incentives by replacing locally administered pollution fees with nationally standardized taxes collected by tax authorities, effectively reducing local officials' discretion in environmental enforcement, consistent with the vertical management reforms analyzed by (He et al. 2024).
Table 6 provides compelling evidence that regulatory standardization largely eliminates the perverse effects of green credit. Prior to the reform, green credit firms exhibited 2.6 percentage points higher violation rates, but this differential declined by 73.1% following implementation of standardized enforcement. The reform similarly reduced disparities in penalty amounts conditional on violation, with green credit firms' penalty premium falling by 76.5%. Columns (3) and (4) examine city-level patterns and disclosure practices, revealing that the reform eliminated systematic differences in enforcement intensity and transparency between cities with high versus low green-credit penetration. This pattern is consistent with the disclosure-lending disconnect documented for European banks (Giannetti et al., 2023).
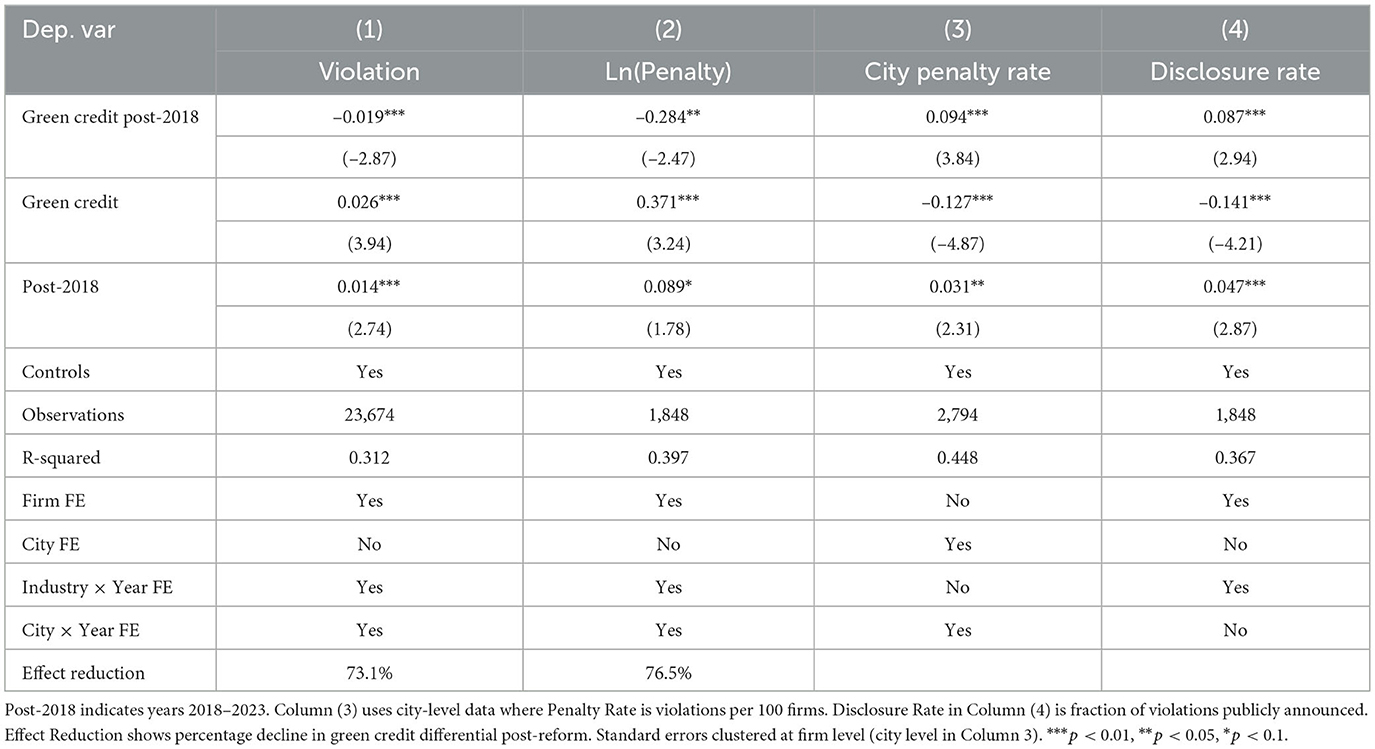
Table 6. 2018 environmental tax reform and regulatory arbitrage elimination.
The mechanism revealed by the post-2018 estimates—label-based benefits combined with local enforcement discretion—maps naturally to other emerging economies with federal–sub-national splits in environmental enforcement and rapidly expanding green lending via policy or development banks. Where subsequent reforms centralize tax collection or standardize inspection and disclosure, the green-credit violation gap should attenuate just as in our post-2018 pattern. We therefore interpret our DiD estimates as an upper bound for jurisdictions that have not yet standardized enforcement and as a lower bound once uniform monitoring is in place. These sign-restricted predictions are directly testable in settings such as India and Brazil without altering our identification logic.
5.3 Robustness test
We implement three complementary tests to reinforce instrument exogeneity and the exclusion restriction. First, a two-year lead of the policy × eligibility interaction, used as a placebo instrument, does not predict green-credit take-up in the first stage and does not predict violations in the reduced form (Appendix Table A4, Panel A; Kleibergen–Paap first-stage F ≈ 0.19, coefficients ≈ 0 with |t| < 1). Second, in placebo populations where the instrument should be inert, the first stage is weak and 2SLS estimates are insignificant: this holds among never-eligible firms and in the SOE subsample (Appendix Table A4, Panels B–C). Third, a permutation-IV exercise that reassigns eligibility within industry × year cells 500 times produces a near-zero distribution of 2SLS coefficients; our actual IV effect (about 0.098) lies in the extreme tail of this empirical distribution (empirical p ≈ 0.008; Appendix Table A4, Panel D). Consistently, difference-in-differences specifications using fake reform years (2016 or 2017) deliver null interaction terms (Appendix Table A5). Finally, balance and pre-trend checks show the instrument does not load on lagged firm observables or on pre-treatment violations (joint test p = 0.66; Appendix Table A6). Taken together, these results materially strengthen confidence in the exclusion restriction and the overall causal interpretation of our IV estimates.
5.4 Mechanism analysis: regulatory arbitrage vs. resource misallocation
Having established causal effects, we turn to identifying the underlying mechanisms. The theoretical framework of Laffont and Tirole (1991) and Dal Bó (2006) suggests that firms may exploit regulatory inconsistencies through political influence and information manipulation. Our analysis tests this regulatory arbitrage mechanism against the alternative explanation of resource misallocation, where firms divert green credit from intended environmental uses as documented in studies of corporate environmental investment (Wang et al., 2020).
Table 7 presents a comprehensive test designed to distinguish between these competing explanations. The sequential introduction of mechanism-specific controls reveals a clear pattern. Adding environmental asset ratios in Column (2) barely affects the green credit coefficient, suggesting that resource misallocation plays a minimal role. In stark contrast, including city-level enforcement variables in Column (3) reduces the coefficient by 40%, indicating that regulatory leniency explains a substantial portion of our findings. The interaction term in Column (4) provides the most definitive evidence: green credit effects are concentrated in cities with weak enforcement, and essentially disappear in high-enforcement environments.
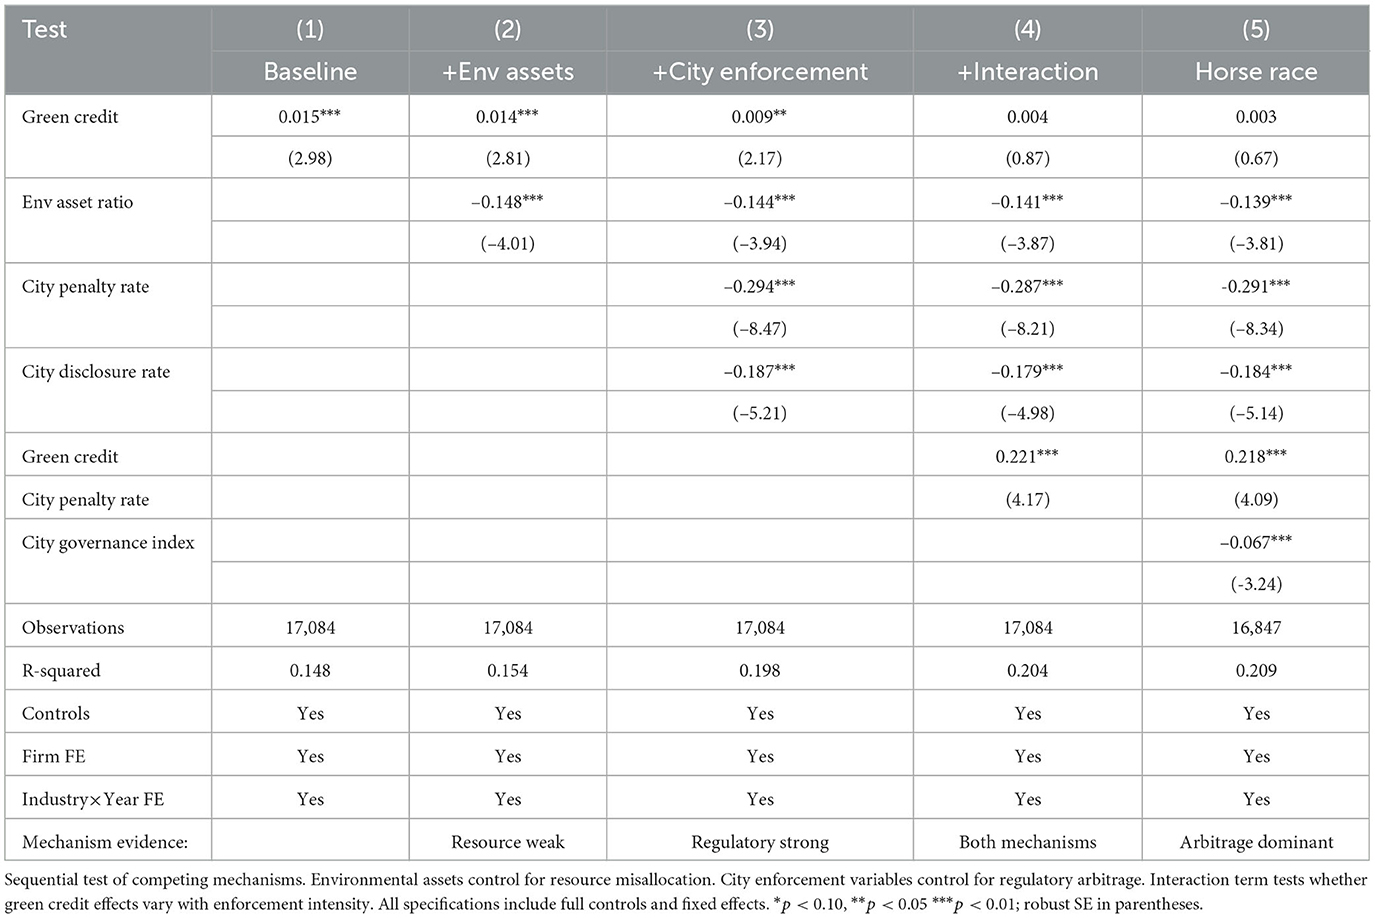
Table 7. Mechanism analysis: testing regulatory arbitrage vs. resource misallocation.
This pattern strongly supports the regulatory arbitrage mechanism emphasized in the greenwashing literature (Lyon and Maxwell, 2011; Lublóy et al., 2024) while providing little evidence for resource misallocation. The fact that green credit firms do invest modestly in environmental assets (as shown in the negative coefficient on environmental asset ratios) suggests they engage in token compliance sufficient to maintain their green credentials while exploiting regulatory leniency for operational expansion.
In bank-centered systems where public or large private lenders are the main conduits of green lending, identity-based labels can translate into implicit forbearance when financial and environmental regulators are not tightly coordinated. Our mechanism tests imply that the green-credit coefficient should load on jurisdiction-level enforcement intensity and transparency; analogous indicators in India and Brazil include monitoring coverage, disclosure mandates, and case backlog or resolution rates at environmental agencies. Under these conditions, regulatory arbitrage—rather than resource diversion—should dominate, yielding the same pattern we document once enforcement controls and interactions enter the model.
5.5 Dynamic effects and learning patterns
Understanding the temporal evolution of green credit effects provides additional insights into firm behavior and regulatory responses, addressing gaps identified in recent studies on green finance effectiveness (Liu et al., 2025). Table 8 presents event-study results that trace violation patterns around firms' initial green credit receipt.
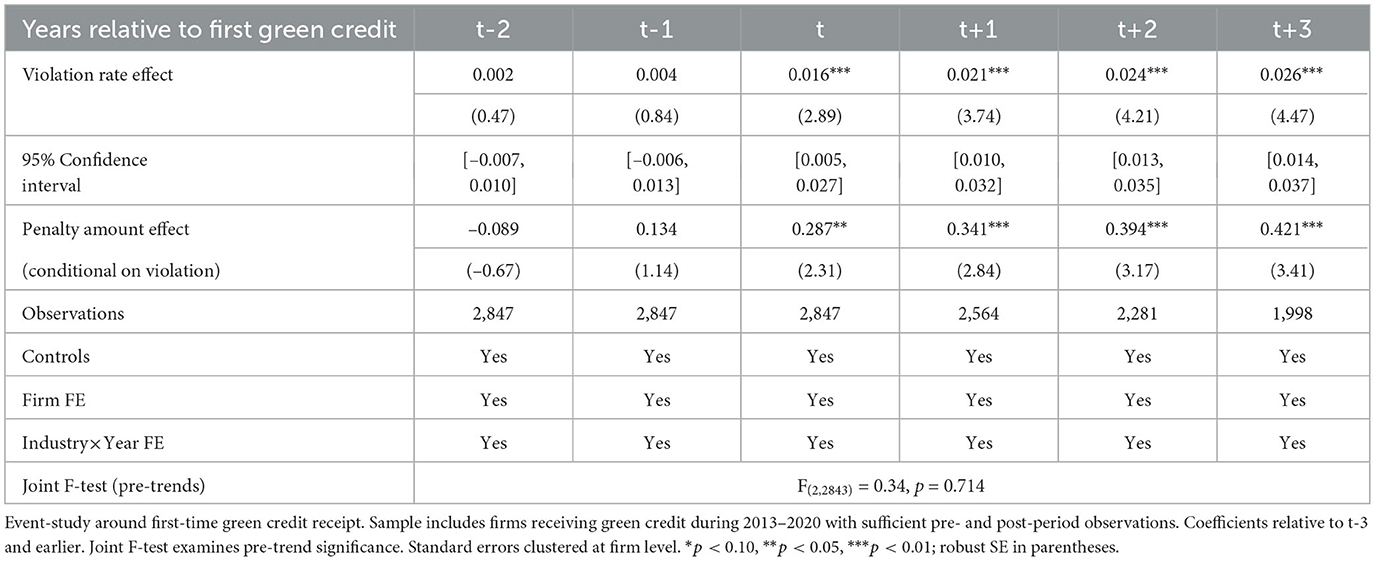
Table 8. Dynamic effects: learning to exploit regulatory leniency.
The event-study results provide three crucial insights. First, the joint F-test confirms the absence of pre-trends, with violation rates showing no systematic differences in the years preceding green credit receipt. This finding decisively rules out reverse causality concerns and supports our causal interpretation. Second, the immediate spike in violations upon green credit receipt suggests that firms quickly recognize and exploit the regulatory protection their green status provides. Third, the continuing escalation of effects over time indicates a learning process, where firms become increasingly aggressive in leveraging their regulatory advantages.
The pattern for penalty amounts conditional on violation reveals an even more striking progression. While pre-period differences are statistically insignificant, penalty amounts increase dramatically following green credit receipt, with the effect growing from 33% [exp(0.287)-1] in the first year to 52% by the third year. This escalation suggests that firms not only violate more frequently but also commit increasingly serious violations as they test the boundaries of regulatory tolerance, consistent with the dynamic greenwashing behavior documented by Bernini et al. (2024).
5.6 Heterogeneous effects across institutional contexts
Table 9 therefore lists the ownership split first and then turns to city governance and environmental disclosure. The equality tests are reported for each split and, as shown below, confirm a statistically significant difference between private firms and SOEs.
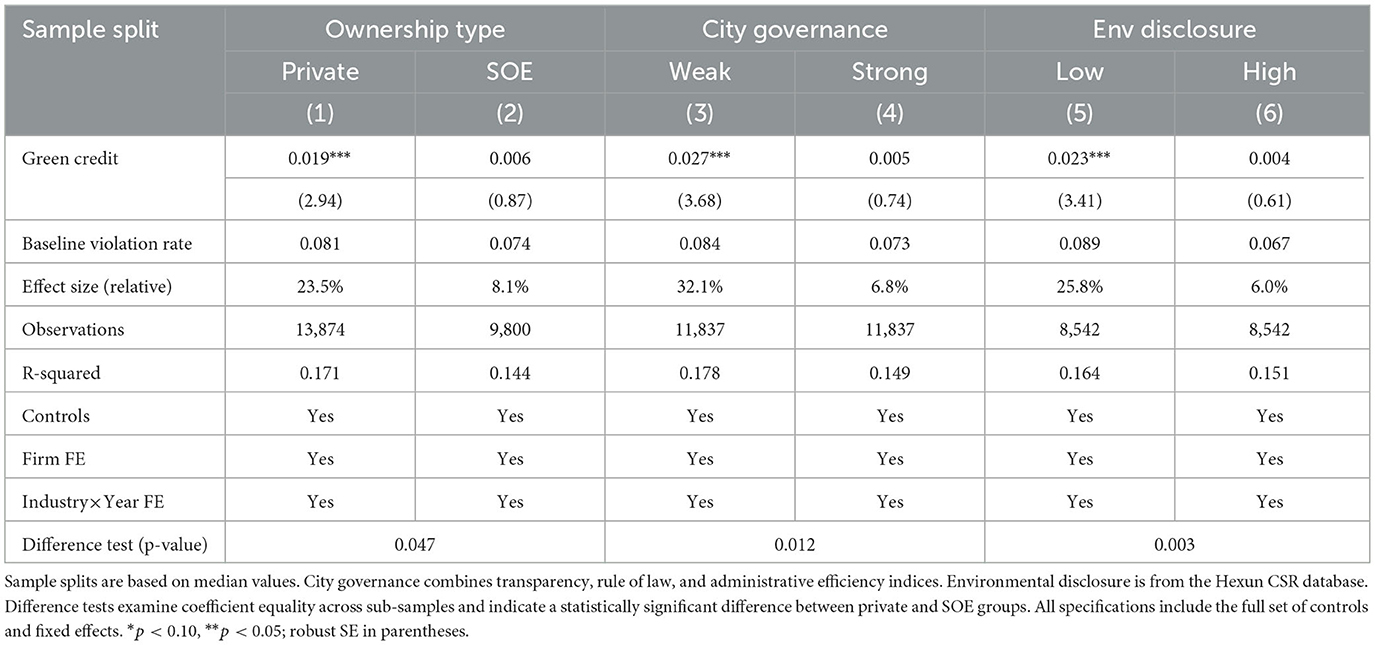
Table 9. Heterogeneous effects: ownership, institutional quality, and disclosure.
The ownership split provides the clearest window into the enforcement channel. In Table 9, the green credit coefficient is large and statistically significant among private firms, but statistically indistinguishable from zero among state owned enterprises, and the equality test confirms a meaningful difference. Relative to the baseline violation rate, the implied effect size equals 23.5 percent for private firms and 8.1 percent for state owned enterprises. This contrast is consistent with classic views that regulatory discretion and capture vary with organizational form (Peltzman, 1976; Dal Bó, 2006).
Two features of the state sector help explain the muted response among state owned enterprises. First, political and reputational oversight is tighter, and vertical monitoring reduces local room to substitute a green label for inspection or disclosure (Kahn et al., 2015). Second, internal compliance routines tend to be more standardized, which raises the expected cost of opportunistic behavior conditional on holding a green label. In contrast, private firms operate under weaker political monitoring. Where local discretion is available, a green label can be converted into fewer or softer inspections and slower disclosure. The result is a lower effective expected penalty and, as a consequence, a higher violation probability conditional on activity.
Cross patterns in the data support this interpretation. The private firm effect is much larger in weak governance cities, where discretion is higher and where spatial variation in environmental enforcement has been documented (Chen et al., 2018). The effect is also stronger when loans are extended by non state banks, where post lending environmental monitoring is less standardized and internal compliance backstops are thinner (Giannetti et al., 2023). These lender and place contrasts align with the ownership split and point to an enforcement channel rather than a pure financing channel. If cheaper capital were the primary force that financed genuine abatement, one would expect stronger effects among state owned enterprises that have easier access to public credit and closer ties to policy banks (He et al., 2019). The evidence shows the opposite.
This ownership result reframes both measurement and policy. On measurement, it clarifies why the same green label does not carry the same compliance meaning across organizational forms, which is consistent with concerns about selective signaling and greenwashing incentives (Lyon and Maxwell, 2011; Galletta et al., 2024). On policy, it suggests that enforcement standardization and auditable post lending verification are central where private ownership and weak governance coincide, and that incentive calibration for state owned enterprises should prioritize verifiable abatement outcomes rather than additional formal procedures. In short, ownership marks the boundary where green credit creates the largest compliance risk and where it can be steered toward genuine environmental improvement (Zhang et al., 2011).
Institutional context interacts with ownership in a precise way. Columns (3) and (4) show that cities with weak governance exhibit a coefficient that is nearly five times the estimate for strong governance, and the equality test confirms the difference. The relative effect size is 32.1 percent under weak governance and 6.8 percent under strong governance. These patterns indicate that local discretion is a necessary condition for the private firm advantage to materialize. Where institutional quality is higher, inspection and disclosure procedures narrow the treatment gap between private firms and state owned enterprises. This is consistent with an enforcement probability that is less sensitive to informal relationships when governance is strong, which limits the scope for a green label to reduce the effective expected penalty.
Firm level credibility further sharpens the mechanism. Columns (5) and (6) show that firms with low environmental disclosure drive almost the entire effect, while high disclosure firms show no systematic link between green credit and violations, and the equality test supports the difference. The relative effect size is 25.8 percent in the low disclosure group and 6.0 percent in the high disclosure group. Low disclosure is a credible signal of weak internal environmental management and limited genuine abatement, so any reduction in inspections or disclosure speed induced by the green label translates more directly into higher violation risk. High disclosure firms appear to use green credit in ways that align with substantive abatement and internal compliance routines, which dilutes any scope for enforcement relief.
Taken together, borrower ownership, institutional quality, and disclosure credibility trace the boundary conditions of the effect. The effect is strongest where the borrower is private, local governance is weak, and disclosure is low, and it fades where political monitoring and standardized procedures tighten. These results have two implications. First, the evidence supports an enforcement channel that operates through effective expected penalties rather than a pure financing channel. Second, policy design should prioritize enforcement standardization and credible post lending verification in settings where private ownership and weak governance coincide, and should tie preferential terms to measurable abatement outcomes to prevent label based forbearance. The heterogeneity analysis therefore adds explanatory power and external validity by showing where green credit delivers compliance risks and where it aligns with genuine environmental improvement.
Our split-sample results imply three portability rules: effects are larger where governance is weak, where borrowers are privately owned, and where disclosure quality is low. These regularities yield falsifiable cross-country predictions. In Indian states with thinner environmental capacity or lower transparency, and in Brazilian regions with weaker inspection coverage, the green-credit violation differential should be materially larger, while state-owned or heavily scrutinized issuers should show muted or null effects. This provides a ready-made template for replications that preserves our empirical design.
5.7 Economic magnitude and welfare implications
To assess the broader economic significance of our findings, we calculate the welfare costs imposed by regulatory arbitrage in green credit markets. Table 10 presents our estimates across different cost components.
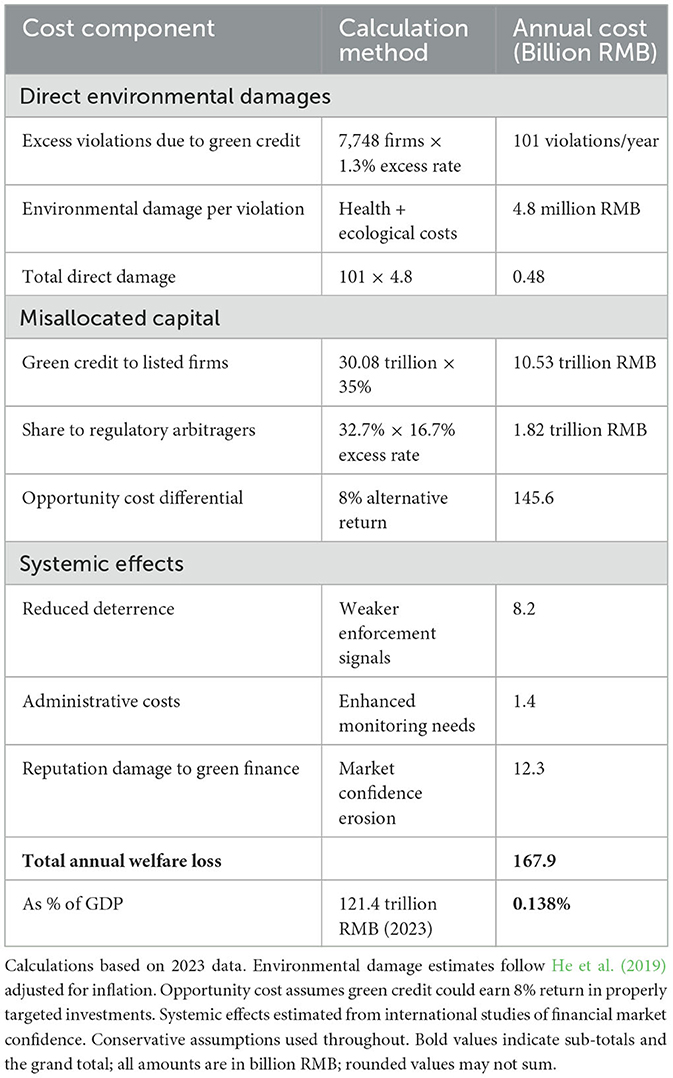
Table 10. Welfare costs of green credit regulatory arbitrage.
Our conservative welfare calculations suggest annual losses of approximately 168 billion RMB, representing 0.138% of GDP. The largest component stems from misallocated capital, where funds intended for environmental improvement instead finance production expansion by firms that subsequently violate environmental regulations. While direct environmental damages appear modest in aggregate terms, they are concentrated in already-polluted regions and disproportionately affect vulnerable populations. The systemic effects on market confidence and deterrence, though difficult to quantify precisely, may impose the largest long-term costs by undermining the entire green finance ecosystem.
These findings highlight the critical importance of performance-based rather than identity-based allocation mechanisms in sustainable finance, echoing concerns raised in recent international studies (Giannetti et al., 2023; European Securities and Markets Authority, 2024) about the disconnect between environmental claims and actual performance in financial markets. If unaddressed, such outcomes risk eroding the credibility of green finance itself, potentially undermining the broader transition to sustainable economic development that green finance is intended to facilitate.
To address potential concerns about parameter uncertainty in our welfare calculations, we standardize the back-of-the-envelope computation as
where Glisted is outstanding green loans to listed firms, α is the share plausibly misallocated due to regulatory forbearance, rΔ is the opportunity-cost wedge, Nexcess is excess violations attributable to green credit, d is per-violation damage, and S collects systemic items (deterrence, administration, reputation). Using 2023 aggregates (total green credit outstanding 30.08 trillion RMB; listed-firm coverage 35%; Glisted=10.53 trillion RMB; α = 0.173; rΔ = 0.08; Nexcess = 101; d = 4.8 million RMB; S = 21.9 bn RMB), the baseline is W = 167.9 bn RMB ( ≈ 0.133% of 2023 GDP).
To demonstrate robustness compactly, we perturb one input at a time by ±20% around the baseline (holding others fixed), and we also vary the listed-firm coverage and the unit damage d. As shown in Table 11, the total welfare loss ranges between 139 and 197 bn RMB (0.110%–0.156% of GDP), driven almost entirely by the misallocated-capital term Glisted×α × rΔ. Direct-damage terms are quantitatively small, and reasonable changes in listed-firm coverage (30%–40%) preserve the conclusion that losses are in the low-hundreds-of-billions range.
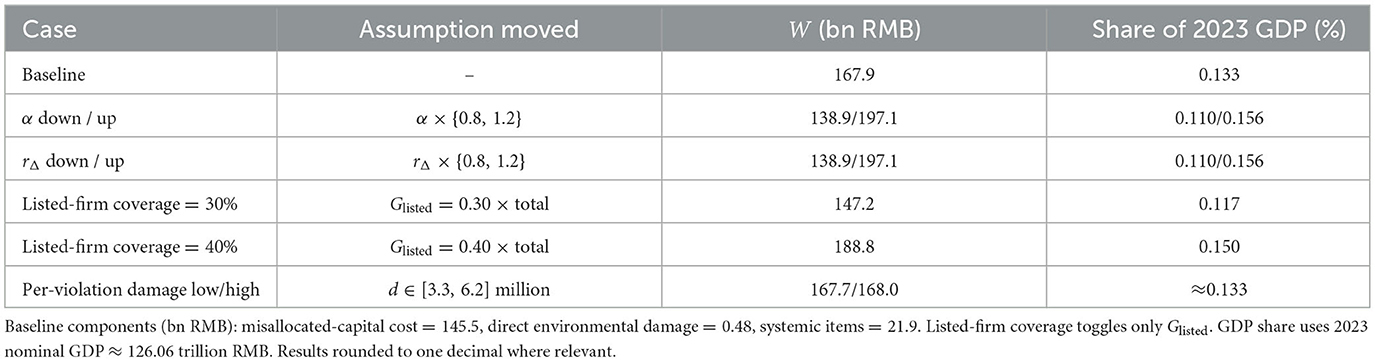
Table 11. Welfare-loss sensitivity (one-at-a-time, ±20% around baseline; 2023 RMB).
The parameter specifications and ranges are detailed in Table 12.
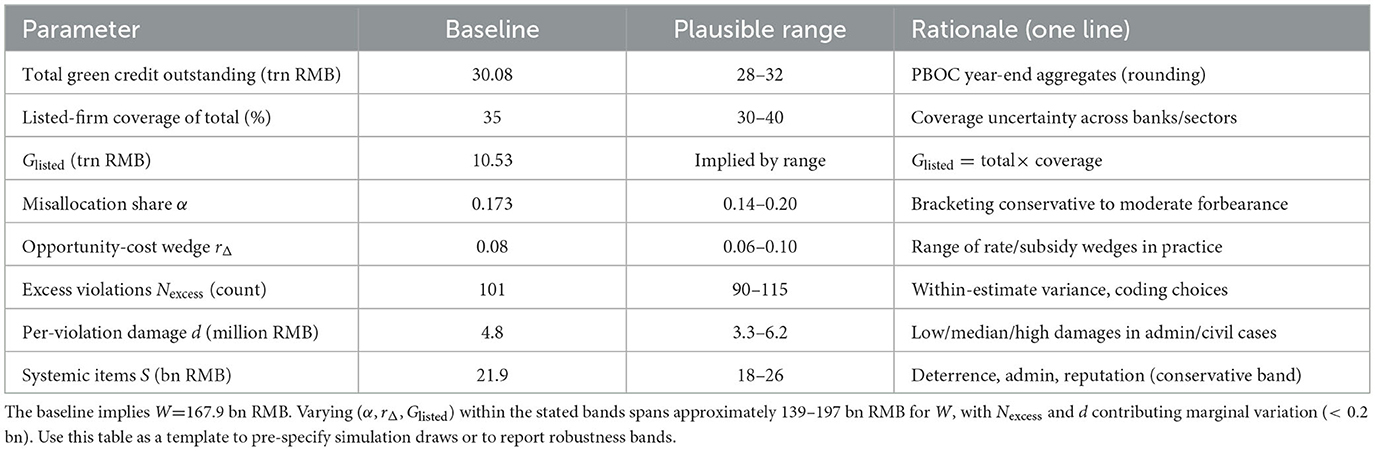
Table 12. Parameter specification and sensitivity ranges.
5.8 Long-run consequences and market discipline
An important question concerns whether markets and regulators eventually discipline firms that exploit green credit for regulatory arbitrage. Table 13 examines outcomes in the three years following violations by green credit firms.
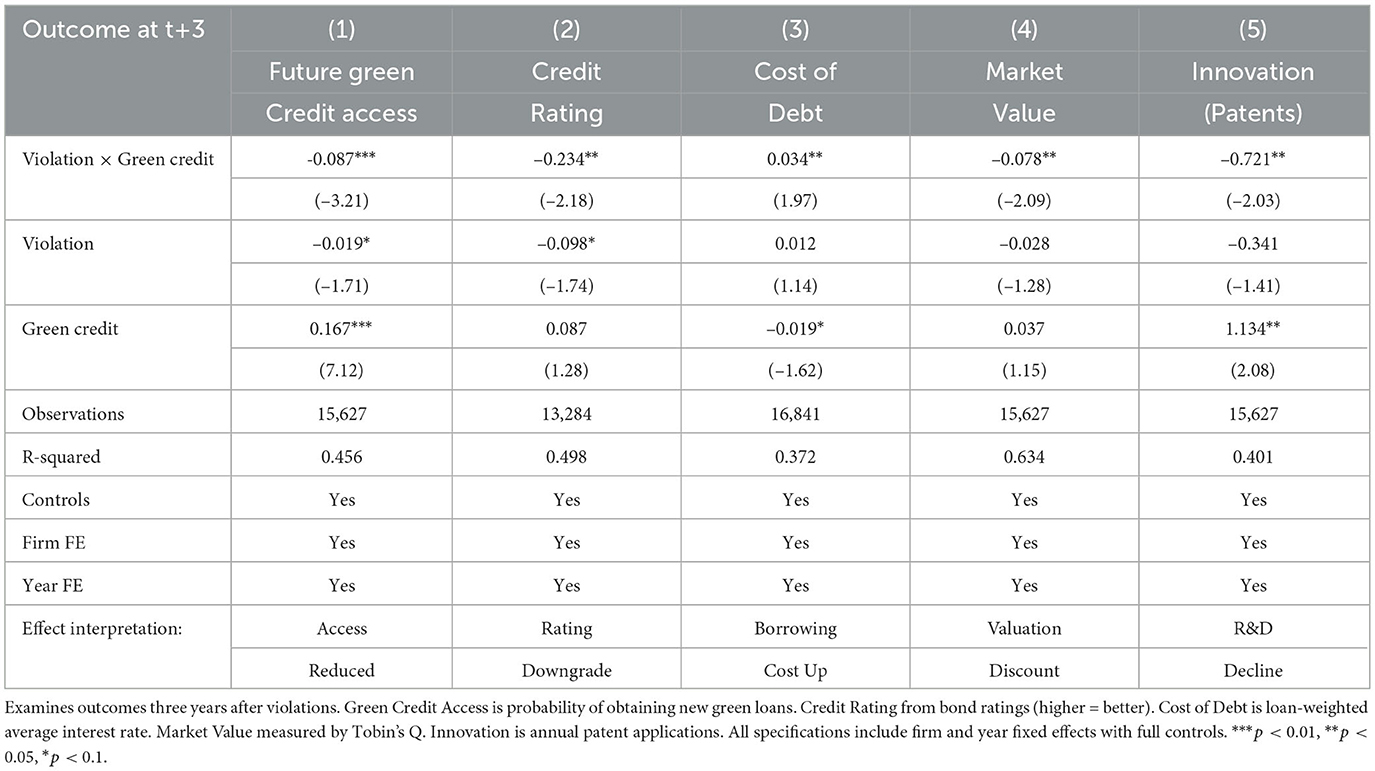
Table 13. Long-run consequences of green credit violations.
The results reveal significant long-term costs for firms caught exploiting green credit programs. Firms that violate while holding green credit face an 8.7 percentage point reduction in future green credit access, suggesting that financial institutions eventually recognize and respond to opportunistic behavior. Credit ratings suffer meaningful downgrades, borrowing costs increase, and market valuations decline. Innovation activity, as measured by patent applications, also falls substantially, possibly reflecting reduced access to capital for productive investments.
These findings suggest that while regulatory arbitrage may provide short-term benefits, market discipline eventually imposes substantial costs on opportunistic firms. However, the three-year lag in consequences means that the interim environmental damages and reputational harm to green finance programs have already occurred, highlighting the importance of preventing rather than merely punishing such behavior.
To assess the generalizability of our findings, we compare our results with evidence from other green finance programs globally. While comprehensive firm-level data comparable to ours is unavailable for most countries, aggregate patterns provide suggestive evidence about the prevalence of regulatory arbitrage in green finance.
Studies of European green lending programs reveal similar disconnects between stated environmental objectives and actual outcomes. Giannetti et al. (2023) document that banks with stronger environmental rhetoric do not achieve correspondingly better environmental performance, while OECD (2024) finds that green lending effects vary dramatically with institutional quality. These patterns echo our findings that the effectiveness of green finance depends critically on implementation details and regulatory coordination.
The broader implications extend beyond green credit to other identity-based environmental policies. Our mechanism—exploitation of regulatory inconsistencies across government departments—likely applies to green bonds, environmental subsidies, and emissions trading systems where benefits accrue based on classifications rather than verified performance outcomes.
6 Discussion, conclusion, and policy implications
6.1 Discussion
This study investigates whether identity-based green credit delivers its intended environmental gains at the firm level. Across multiple specifications, we find that firms receiving green-credit status subsequently exhibit a statistically and economically significant increase in environmental violations. The pattern is most consistent with a regulatory arbitrage/forbearance mechanism: when the green label lowers financing costs and is (de facto) accompanied by fewer or softer inspections (γ > 0 in our conceptual framework), output expands but compliance effort does not rise commensurately, so the net effect on violation risk can increase. When enforcement standards are tightened and discretion is curtailed (the γ → 0 limit), the perverse effect contracts and, in some settings, disappears.
Methodologically, three elements underpin identification and credibility. First, the baseline panel designs absorb rich fixed effects (firm and multi-way time-varying controls at the industry/city × year level), isolating within-firm changes around the attainment of green-credit status. Second, event-study estimates display no anticipatory pre-trends, and post-treatment dynamics align with gradual learning and exploitation of the forbearance margin. Third, an instrumental-variabless strategy based on policy-driven eligibility and staggered roll-outs provides an independent source of variation, with strong first-stage relevance and stable second-stage estimates. An external enforcement-standardization shock further triangulates the mechanism: once inspections and penalties are made more uniform and transparent, the green-credit effect on violations attenuates materially. Extensive robustness checks (alternative outcomes and samples, balanced panels, influential-observation trims, alternative clustering, and measurement-error corrections) yield remarkably stable coefficients.
Mechanism probes distinguish regulatory forbearance from alternative channels such as fund misallocation. Introducing proxies for financing scale and investment composition has limited effect on the main coefficient, whereas interactions with city-level enforcement intensity and disclosure transparency substantially compress the effect and, in high-governance environments, render it indistinguishable from zero. These contrasts point to cross-agency coordination failures as the relevant friction: a label granted by the credit side is interpreted in practice as a signal for leniency on the environmental enforcement side. In our setting, the remedy is not to curtail credit per se, but to eliminate the informational and incentive wedge between credit allocation and environmental compliance.
Our results complement and qualify a broader literature documenting environmental gains from green finance, policy mandates, and sustainable investment. We show that such gains are conditional: they emerge when the policy architecture ties benefits to verifiable performance and when enforcement is standardized across agencies and jurisdictions. Where discretion is high and cross-agency information sharing is weak, identity-based benefits can backfire. This contrast explains why studies centered on policy introduction under centralized implementation often find improvements, while micro settings with fragmented oversight may not.
The empirical design and data workflow are portable. The approach relies on (i) structured extraction of firm-level environmental enforcement records; (ii) transparent mapping of green-credit status from disclosures; (iii) multi-level governance indicators (enforcement intensity, disclosure regimes); and (iv) quasi-experimental policy shocks and event-time designs. These ingredients are increasingly available in many jurisdictions, enabling replication and external validation.Beyond our setting, the same design can be transported to emerging economies with bank-centered credit intermediation and decentralized enforcement such as India and Brazil. In those jurisdictions, state-level differences in inspection coverage and disclosure requirements generate the same variation we exploit, so the mechanism and sign predictions travel without redesigning the identification
External validity is conditional and testable. In emerging economies such as India or Brazil, where environmental enforcement is partly decentralized and sectoral regulators operate with heterogeneous practices, the same perverse incentive can arise if identity-based credit benefits are not matched by uniform compliance verification. We therefore predict (i) larger green-credit × low-enforcement effects on violations; (ii) attenuation following enforcement-centralizing reforms or unified disclosure mandates; and (iii) weaker effects among firms with stronger external monitoring (e.g., higher analyst coverage, mandatory ESG audits). These predictions can be evaluated with publicly accessible sanction records and loan/disclosure datasets.
Finally, the study has limitations that future work can address. Residual measurement error may remain in text-based identification of credit status and violation types. Bank-internal screening and covenant design are not directly observable, constraining our ability to separate ex ante selection from ex post monitoring. Welfare magnitudes require structural assumptions about the damage function and compliance cost; we therefore present qualitative welfare interpretations and suggest sensitivity intervals rather than point estimates. Addressing these limitations would benefit from linked regulator–bank–firm datasets and higher-frequency emissions verification (e.g., sensor or remote-sensing data).
6.2 Conclusion
This paper advances a single, central claim: identity-based green credit can backfire under discretionary enforcement, raising the incidence of environmental violations among recipient firms; once enforcement is standardized and benefits are conditioned on verifiable performance, the adverse effect contracts and may vanish. By implication, our estimates provide an upper bound for jurisdictions that retain wide enforcement discretion and a lower bound once inspection and disclosure are standardized. The framework therefore yields directly testable, cross-country predictions for federated emerging economies such as India and Brazil.
Taken together, the empirical components cohere into a single narrative. Baseline within-firm estimates show a statistically and economically meaningful rise in violations following the attainment of green-credit status. event-time profiles display no anticipatory trends and reveal post-treatment dynamics consistent with firms learning and exploiting a forbearance margin. The magnitude of the effect is concentrated where governance is weaker—low inspection intensity and limited disclosure—while it attenuates materially after an enforcement-standardization reform that reduced cross-agency discretion. An instrumental-variabless strategy, leveraging policy-driven eligibility and staggered roll-outs, yields stable second-stage estimates and corroborates the direction and size of the effect. These strands jointly imply a mechanism in which the green label lowers financing costs and, de facto, expected detection, expanding output without commensurate increases in compliance effort; when enforcement becomes uniform and transparent, this wedge closes and the effect diminishes.
The contribution is twofold. Conceptually, the paper shifts the question from whether green finance works to when it works by identifying regulatory arbitrage/forbearance as a decisive condition that can reverse intended environmental gains; this reframes green finance as a policy architecture problem requiring alignment between credit benefits and standardized compliance verification. Empirically, the paper offers a portable workflow—linking firm-level enforcement records, green-credit status, governance heterogeneity, and quasi-experimental shocks—that delivers sign-consistent tests and triangulated identification. In doing so, it reconciles mixed findings in the literature: where cross-agency coordination is strong, benefits translate into environmental improvement; where it is weak, identity-based incentives may induce perverse outcomes.
6.3 Policy implications and recommendations
The findings suggest that policymakers should re-align incentives so that preferential finance rewards verifiable environmental performance rather than conferring de facto regulatory relief. Financial authorities and environmental regulators may consider conditioning preferential terms on audited, ex post outcomes with built-in clawback provisions when targets are missed or violations occur. Standardized sustainability-linked contracts with auditable KPIs and automatic pricing adjustments can translate performance into continuous financial signals while preserving contractual clarity and legal enforceability.
Because the adverse effects arise where cross-agency discretion and information frictions are largest, coordination is as important as contract design. A unified compliance registry that links loan-level exposures with firm-level sanctions and remediation records, maintained jointly by financial and environmental authorities on a regular (e.g., quarterly) cadence, would reduce scope for regulatory shopping. A “no forbearance by label” rule—making explicit that green-credit status neither mitigates inspection intensity nor softens penalties—would close a key arbitrage margin. Harmonizing taxonomies, disclosure templates, and reporting periodicity across agencies would further narrow inconsistencies that firms can exploit.
Enhancing the timeliness of oversight can improve deterrence at reasonable cost. For material projects, integrating sensor or remote-sensing streams into supervisory dashboards enables near–real-time exception monitoring and triggers pre-specified contractual responses (pricing step-ups, enhanced scrutiny, and collateral calls). Publishing city- or sector-level enforcement and disclosure scorecards can strengthen external monitoring by investors and civil society. These steps entail non-trivial implementation costs and capacity demands; targeted pilots, phased scaling, and investments in data infrastructure and third-party verification are prudent ways to manage trade-offs.
For jurisdictions beyond the study setting—such as emerging economies with decentralized enforcement—the same principles apply, subject to institutional readiness. Policymakers might begin with pilot programs in regions that already meet minimum data and legal capacity thresholds, iterating on KPI definitions, audit protocols, and data interfaces before broader rollout. Where stricter standards raise short-run adjustment costs, complementary measures (e.g., transition support or retraining funds in heavily affected sectors) can mitigate distributional impacts while preserving the environmental objectives that green credit is meant to achieve.
Data availability statement
The raw data supporting the conclusions of this article will be made available by the authors, without undue reservation.
Author contributions
SY: Validation, Project administration, Investigation, Methodology, Funding acquisition, Supervision, Writing – review & editing, Formal analysis, Visualization, Software, Data curation, Resources, Conceptualization, Writing – original draft.
Funding
The author(s) declare that no financial support was received for the research and/or publication of this article.
Acknowledgments
The author acknowledges the valuable feedback received from reviewers and conference participants that helped improve the manuscript.
Conflict of interest
The author declares that the research was conducted in the absence of any commercial or financial relationships that could be construed as a potential conflict of interest.
Generative AI statement
The author(s) declare that no Gen AI was used in the creation of this manuscript.
Any alternative text (alt text) provided alongside figures in this article has been generated by Frontiers with the support of artificial intelligence and reasonable efforts have been made to ensure accuracy, including review by the authors wherever possible. If you identify any issues, please contact us.
Publisher's note
All claims expressed in this article are solely those of the authors and do not necessarily represent those of their affiliated organizations, or those of the publisher, the editors and the reviewers. Any product that may be evaluated in this article, or claim that may be made by its manufacturer, is not guaranteed or endorsed by the publisher.
Supplementary material
The Supplementary Material for this article can be found online at: https://www.frontiersin.org/articles/10.3389/fclim.2025.1643192/full#supplementary-material
References
Aloui, D., Benkraiem, R., Guesmi, K., and Vigne, S. (2023). The european central bank and green finance: how would green quantitative easing affect investors' behaviour during times of crisis? Int. Rev. Finan. Analy. 85:102464. doi: 10.1016/j.irfa.2022.102464
Becker, G. S. (1968). Crime and punishment: an economic approach. J. Polit. Econ. 76, 169–217. doi: 10.1086/259394
Bernini, F., Giuliani, M., and La Rosa, F. (2024). Measuring greenwashing: a systematic methodological literature review. Busin. Ethics Environ. Respons. 33, 649–667. doi: 10.1111/beer.12631
Busch, T., Bauer, R., and Orlitzky, M. (2016). Sustainable development and financial markets: old paths and new avenues. Busin. Soc. 55, 303–329. doi: 10.1177/0007650315570701
Chen, Z., Kahn, M. E., Liu, Y., and Wang, Z. (2018). The consequences of spatially differentiated water pollution regulation in China. J. Environ. Econ. Manage. 88, 468–485. doi: 10.1016/j.jeem.2018.01.010
Dai, Q., He, J., Guo, Z., Zheng, Y., and Zhang, Y. (2025). Green finance for sustainable development: analyzing the effects of green credit on high-polluting firms environmental performance. Human. Soc. Sci. Commun. 12:854. doi: 10.1057/s41599-025-05218-8
Dal Bó, E. (2006). Regulatory capture: a review. Oxford Rev. Econ. Policy 22, 203–225. doi: 10.1093/oxrep/grj013
Drahos, P., and Wang, H. (2023). China's regulatory pathway to green finance. Tsinghua China Law Rev. 15, 145–180. Available online at: https://heinonline.org/HOL/LandingPage?handle=hein.journals/tsinghua14&div=17&id=&page=
Escalante, D., Choi, J., and Larsen, M. L. (2020). Green banking in China-emerging trends: With a spotlight on the industrial and commercial bank of China (ICBC). Discussion brief, Climate Policy Initiative, London and Beijing.
European Securities and Markets Authority (2024). Final report on greenwashing. Technical Report ESMA36–287652198-2699, European Securities and Markets Authority (ESMA).
Flammer, C. (2021). Corporate green bonds. J. Financ. Econ. 142, 499–516. doi: 10.1016/j.jfineco.2021.01.010
Galletta, S., Mazzù, S., Naciti, V., and Paltrinieri, A. (2024). A prisma systematic review of greenwashing in the banking industry: a call for action. Res. Int. Busin. Finance 69:102262. doi: 10.1016/j.ribaf.2024.102262
Geng, L., Yin, W., Wu, X., Lu, X., and Zhang, C. (2023). How green credit affects corporate environmental information disclosure: evidence from new energy listed companies in China. Front. Ecol. Evol. 11:1301589. doi: 10.3389/fevo.2023.1301589
Giannetti, M., Jasova, M., Loumioti, M., and Mendicino, C. (2023). ““Glossy green” banks: the disconnect between environmental disclosures and lending activities,” in ECB Working Paper, (2023/2882). doi: 10.2139/ssrn.4668588
Gray, W. B., and Shimshack, J. P. (2011). The effectiveness of environmental monitoring and enforcement: a review of the empirical evidence. Rev. Environ. Econ. Policy 5, 3–24. doi: 10.1093/reep/req017
He, L., Zhang, L., Zhong, Z., Wang, D., and Wang, F. (2019). Green credit, renewable energy investment and green economy development. J. Clean. Prod. 208, 363–372. doi: 10.1016/j.jclepro.2018.10.119
He, Y., Wu, L., Liang, Y., Zheng, Y., and Zhang, L. (2024). Spatial suitability between water supply pressure and waterworks water supply capacity in the Guangdong-Hong Kong-Macau Greater Bay Area: spatial-temporal evolution pattern, driving mechanism and implications. J. Clean. Prod. 434:140317. doi: 10.1016/j.jclepro.2023.140317
International Energy Agency (2023). Net zero roadmap: a global pathway to keep the 1.5 °c goal in reach-2023 update. Technical report, International Energy Agency, Paris.
Kahn, M. E., Li, P., and Zhao, D. (2015). Water pollution progress at borders: the role of changes in China's political promotion incentives. Am. Econ. J. 7, 223–242. doi: 10.1257/pol.20130367
Laffont, J. J., and Tirole, J. (1991). The politics of government decision-making: a theory of regulatory capture. Quart. J. Econ. 106, 1089–1127. doi: 10.2307/2937958
Liu, L., Liu, Y., Zhang, M., Zhou, X., and Huang, J. (2025). How does green credit affect corporate green investment efficiency? A test based on listed corporations in China's heavy pollution industry. Sustainability 17:3712. doi: 10.3390/su17083712
Liu, W., and Zhu, P. (2024). The impact of green finance on the intensity and efficiency of carbon emissions: the moderating effect of the digital economy. Front. Environ. Sci. 12:1362932. doi: 10.3389/fenvs.2024.1362932
Liu, X., Lu, J., and Zhou, B. (2024). The impact of green finance on carbon emission intensity in China: mediating and spatial effects. Front. Environ. Sci. 12:1403246. doi: 10.3389/fenvs.2024.1403246
Lublóy, Á., Keresztúri, J. L., and Berlinger, E. (2024). Quantifying firm-level greenwashing: a systematic literature review. J. Environ. Manage. 373:120929. doi: 10.1016/j.jenvman.2024.123399
Lyon, T. P., and Maxwell, J. W. (2011). Greenwash: corporate environmental disclosure under threat of audit. J. Econ. Manag. Strat. 20, 3–41. doi: 10.1111/j.1530-9134.2010.00282.x
Peltzman, S. (1976). Toward a more general theory of regulation. J. Law Econ. 19, 211–240. doi: 10.1086/466865
People's Bank of China (2024). Financial institutions' credit structure statistics report, q4 2023. Technical report, People's Bank of China, Beijing. Report covers data for the fourth quarter of 2023.
Polinsky, A. M., and Shavell, S. (2000). The economic theory of public enforcement of law. J. Econ. Lit. 38, 45–76. doi: 10.1257/jel.38.1.45
Qin, L., Jin, Y., Huang, J., and Liao, X. (2024). Research on the mechanism of the carbon emission reduction effect of green finance. Sustainability 16:1105. doi: 10.3390/su16073087
Ren, C., Wang, T., Wang, Y., Zhang, Y., and Wang, L. (2023). The heterogeneous effects of formal and informal environmental regulation on green technology innovation-An empirical study of 284 cities in China. Int. J. Environ. Res. Public Health 20:1621. doi: 10.3390/ijerph20021621
Scholtens, B. (2006). Finance as a driver of corporate social responsibility. J. Busin. Ethics 68, 19–33. doi: 10.1007/s10551-006-9037-1
Shimshack, J. P., and Ward, M. B. (2005). Regulator reputation, enforcement, and environmental compliance. J. Environ. Econ. Manage. 50, 519–540. doi: 10.1016/j.jeem.2005.02.002
Tan, X., Yan, Y., and Dong, Y. (2022). Peer effect in green credit induced green innovation: An empirical study from China's green credit guidelines. Resour. Policy 76:102619. doi: 10.1016/j.resourpol.2022.102619
United Nations Conference on Trade and Development (2023). World Investment Report 2023: Investing in Sustainable Energy for All. United Nations, Geneva.
Wang, Y., Lei, X., Long, R., and Zhao, J. (2020). Green credit, financial constraint, and capital investment: evidence from China's energy-intensive enterprises. Environ. Manage. 66, 1059–1071. doi: 10.1007/s00267-020-01346-w
Xia, B., Ma, Q., and Pan, Y. J. (2025). Design of sustainable performance targets: mitigating greenwashing in sustainability-linked loans. Energy Econ. 118:108843. doi: 10.1016/j.eneco.2025.108843
Xu, K., and Li, Z. (2022). The impact of financial development and green finance on regional energy intensity: New evidence from 30 Chinese provinces. Sustainability 14:10676. doi: 10.3390/su14159207
Yue, M., and Nedopil, C. (2025). China green finance status and trends 2024–2025. Technical report, Green Finance &Development Center, FISF Fudan University and Griffith Asia Institute, Shanghai and Brisbane.
Zhang, B., Yang, Y., and Bi, J. (2011). Tracking the implementation of green credit policy in China: Top-down perspective and bottom-up reform. J. Environ. Manage. 92, 1321–1327. doi: 10.1016/j.jenvman.2010.12.019
Keywords: green credit, environmental violations, regulatory arbitrage, sustainable finance, environmental governance
Citation: Yang S (2025) Green credit and corporate environmental violations: evidence from regulatory arbitrage in China. Front. Clim. 7:1643192. doi: 10.3389/fclim.2025.1643192
Received: 17 June 2025; Accepted: 17 September 2025;
Published: 09 October 2025.
Edited by:
Stuart Walsh, Monash University, AustraliaReviewed by:
Sarat Chandra Mohapatra, University of Lisbon, PortugalLukman Raimi, Universiti Brunei Darussalam, Brunei
Copyright © 2025 Yang. This is an open-access article distributed under the terms of the Creative Commons Attribution License (CC BY). The use, distribution or reproduction in other forums is permitted, provided the original author(s) and the copyright owner(s) are credited and that the original publication in this journal is cited, in accordance with accepted academic practice. No use, distribution or reproduction is permitted which does not comply with these terms.
*Correspondence: Shuangquan Yang, c2h1YW5ncXVhbnlhbmc5N0AxNjMuY29t