 Zhaoyuan Lei
 Chunxia Zhang3
- 1Shaanxi Soft Science Research Base for Green and Low-Carbon Development of Energy Industry, Yan’an University, Yan’an, Shaanxi, China
- 2Yan’an Energy and Chemical Group Co., Ltd., Yan’an, Shaanxi, China
- 3Shaanxi Binchang Mining Group Co., Ltd., Yan’an, Shaanxi, China
China has put forward the “carbon peak and carbon neutral” climate commitment, but as the basic unit of the national economy, China’s county economy is facing the double pressure of economic growth and emission reduction. Based on panel data spanning 1677 Chinese counties from 2014 to 2022, this study employs fixed-effects, mediation, moderation, and quantile models to analyze and derive the following conclusions. (1) digital financial inclusion has a significant impact on the improvement of county carbon productivity, with an influence coefficient as high as 19.44%. (2) Digital financial inclusion enhances county-level carbon productivity by promoting technological innovation and industrial structure upgrading. The positive moderating effects of traditional finance and urbanization further amplify this impact. Digital financial inclusion exerts a strong positive effect on carbon productivity at lower quantiles, but its influence diminishes at median quantiles and turns negative at higher quantiles. This pattern reflects diminishing marginal returns and tightening resource constraints as development approaches the technological frontier. (3) Only digitalization level and coverage breadth of digital financial inclusion have a significant positive impact on county carbon productivity, and the effect of digitalization level is almost twice that of coverage breadth. The influence coefficients of digital inclusive finance on carbon productivity in the Yangtze River Economic Belt and the Yellow River Basin are 21.72% and 27.82%, respectively, which are more significant than those in other places. This paper recommends prioritizing low-carbon industrial development, shifting focus to less-developed regions to leverage latecomer advantages, and embedding carbon productivity targets into regional strategies with incentive mechanisms to drive sustainable growth.
1 Introduction
China has put forward the “carbon peak and carbon neutral” (“dual carbon”) climate commitment as a national strategy to address global climate challenges. However, this macro-level policy imposes unique pressures on county economies, which serve as the fundamental units of China’s economic structure. Counties account for approximately 40% of the national GDP (National Bureau of Statistics, 2023) 1, yet they disproportionately host energy-intensive industries and exhibit structural deficiencies such as a single industrial base, technological lag, and limited green financing channels (Chen et al., 2024a). These factors create a “carbon lock-in” effect, making counties particularly vulnerable to the dual pressures of sustaining economic growth while achieving emission reductions. Consequently, improving county-level carbon productivity is not only critical for national targets but also highlights a distinctive challenge compared to urban or provincial levels, where financial and technological resources are more abundant. Problems such as single industrial structure, lagging technology and lack of green financing channels are common in counties. Digital financial inclusion covers the “long tail group” without credit investigation records through the big data risk control model, and solves the credit exclusion problem of traditional finance relying on collateral (Guo et al., 2023). Digital financial inclusion will be lowered to counties through mobile payment terminals (such as Alipay/wechat Pay; coverage rate will reach 78% in 2023), combined with big data risk control models (such as Ant Group’s “310” model: 3 min of application, 1 s of lending, and 0 manual intervention), significantly reducing the service threshold. According to the 2023 financial inclusion Indicator Report of the People’s Bank of China, compared with traditional bank outlets, the cost of a single transaction of digital financial inclusion is reduced from ¥1.50 to ¥0.10, and it covers’ credit invisible groups’ without credit reference records. The density of physical branches of traditional banks in counties in China is only 1/3 of that in cities. Digital financial inclusion also helps to break through the limitation of traditional finance relying on physical branches (Daud and Ahmad, 2023).
China’s county economy relies on traditional manufacturing industry and the energy structure is dominated by coal, so it faces high carbon lock-in effect. By substituting administrative shutdowns with market-based green credit, digital financial inclusion mitigates the shock of “campaign-type carbon reduction” on county economies. For example, the Green e-Loan program in Shandong’s Yiyuan County provided 120 million RMB of low-interest credit to ceramic firms during the 2022 environmental inspection, allowing them to switch from coal to natural gas kilns and avoid a 50% output cut that would have occurred under an administrative closure order (Ant Group ESG Report, 2023). In 2023, the penetration rate of mobile payment, one of the important indicators of digital financial inclusion, has reached 78% in the county dimension. Although the coverage rate of digital financial inclusion is currently high in counties in China, green financial products (such as carbon inclusion and green microloans) are still in the pilot stage. Studying the impact of digital financial inclusion on carbon productivity can provide a strong basis for the expansion of “carbon emission reduction support tools” to counties and the cooperation between local governments and Internet platforms. Since the launch of Alipay in December 2004, China has progressively entered the era of digital financial inclusion (Cao et al., 2022). The data distribution of carbon productivity at the county level in China is shown in Figure 1, county-level carbon productivity has shown a steady year-on-year increase since 2004.
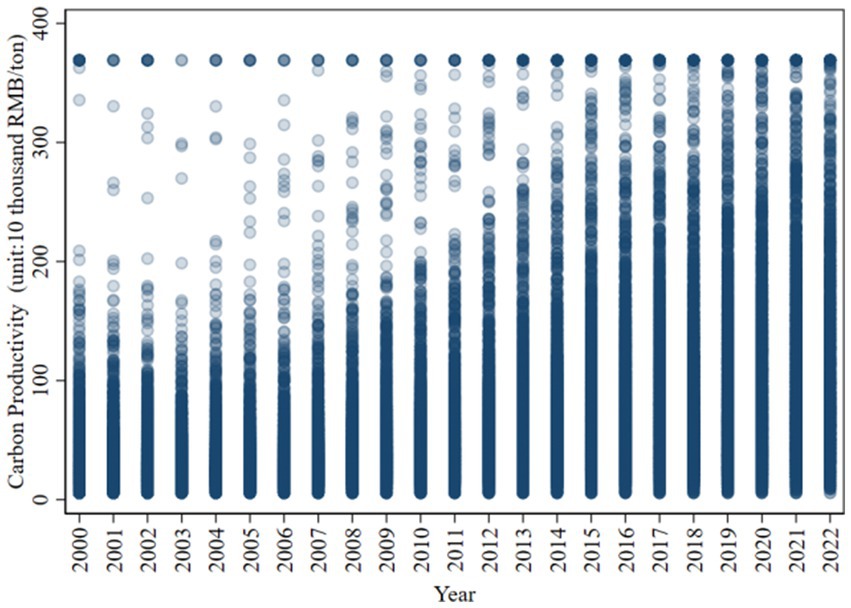
Figure 1. Distribution of county level carbon productivity.
Existing studies have reached different conclusions on the ecological and environmental effects of digital financial inclusion. For example, based on China’s provincial panel data, Xie et al. (2023) used the stochastic convergence model to find that digital financial inclusion has a carbon emission reduction effect (Xie et al., 2023), Feng et al. (2022) reached a similar conclusion by analyzing the data of Chinese listed companies and cities (Feng et al., 2022). However, the study of Wang et al. (2022) shows that digital financial inclusion reduces the carbon dioxide emissions of neighboring cities, but increases the emissions of local cities (Wang et al., 2022). This difference may result from the differences in economic structure and policy implementation effects between regions. In addition, based on the data of the Belt and Road countries from 2007 to 2019, Ilhan and Sana (2022) found that digital financial inclusion increased carbon dioxide emissions while promoting economic growth (Ilhan and Sana, 2022). This mixed effect may be related to the stage of economic development and energy mix of different countries.
In addition to its ecological effects, digital financial inclusion has garnered significant attention for its role in promoting sustainable economic development. Most scholars hold a positive and affirmative view on this relationship. For instance, Cheng et al. (2023) employs municipal panel data from China to demonstrate that the development of digital financial inclusion significantly enhances Green total factor productivity, with a more pronounced effect observed in the eastern region and non-resource-based cities (Cheng et al., 2023). Similarly, Xu X, et al. (2024) examines the impact of digital financial inclusion on sustainable economic development using data from Jiangsu Province, highlighting its potential to foster green growth (Xu T, et al., 2024). Shen et al. (2023) further corroborates these findings by analyzing panel data from 31 provinces in China, showing that digital financial inclusion significantly improves the green total factor productivity of agriculture (Shen et al., 2023). Meanwhile, Huang et al. (2022) explores the nonlinear relationship between digital financial inclusion and energy-environmental performance using panel data from 282 prefecture-level cities in China. This study reveals a U-shaped relationship, which is more pronounced in southern cities with a higher degree of financial marketization (Huang et al., 2022). Collectively, these studies underscore the multifaceted role of digital financial inclusion in driving sustainable economic development, while also highlighting regional and contextual variations in its impact.
The existing literature mostly focuses on the analysis at the provincial and municipal levels in China (Liu et al., 2024; Xu X, et al., 2024; Zhang et al., 2025), while there is a lack of research at the county level. As the basic unit of the national economy, county has the unique characteristics of “long tail market,” and its industrial structure is single, technology lag, lack of green financing channels and other problems are particularly prominent. The traditional financial system is difficult to cover small and medium-sized enterprises and rural low-carbon projects, so financial innovation is urgently needed to support green transformation and achieve win-win development of environment and economy. Therefore, using counties as the unit of analysis not only fills the gap in existing research, but also provides a new perspective for exploring the role of digital financial inclusion in county economies. In addition, existing studies mostly discuss the impact of digital financial inclusion on economic benefits and carbon emission reduction separately rather than simultaneously. However, while pursuing economic development, county economy is also facing environmental pressure, so it is more practical to take carbon productivity as an indicator to comprehensively consider economy and environment. This study uses multivariate modeling and moderator effect analysis to explore the direct and indirect impacts of digital financial inclusion on carbon productivity from an overall rather than a single perspective, so as to fully reveal its mechanism of action.
The county economy, as a fusion of urban and rural economies, plays a vital role in serving farmers and serves as a natural conduit for integrating urban and rural elements, which is also the main service object of digital financial inclusion. Enhancing carbon productivity at the county level not only mirrors China’s grassroots units’ low-carbon and efficient development but also addresses challenges of provincial heterogeneity and the urban–rural divide. Based on data from 2014 to 2022 of 1,677 counties in China, this paper studies the impact of digital financial inclusion on carbon productivity, including mediating effects, moderating effects, and heterogeneous effects at different quantiles. The main contribution of this paper are: (1) Given that county-level economies are confined to the lower end of the industrial chain and objectively need to pursue economic development, this paper takes carbon productivity as the research object and analyzes the economic promotion or carbon emission reduction benefits of digital financial inclusion from an overall rather than a single perspective. To facilitate the implementation of the “carbon peak and carbon neutral” goals at the county level, and at this crucial juncture of the urban–rural dual structure, promote the synergy between common prosperity and low-carbon development. (2) Through more detailed and diversified county-level empirical studies, this paper demonstrates the promoting effect of digital financial inclusion on carbon productivity, and further discusses its mechanism through mediating effect and moderating effect analysis. At the same time, it fills the research gap and provides a more detailed and scientific reference basis for the formulation of relevant policies for developing countries to promote the sustainable development of economy through digital financial inclusion.
2 Theoretical analysis and research hypotheses
According to the long tail theory, Internet technology reduces the cost of storing, distributing and acquiring niche products, thus activating a large number of scattered and unmet demand or supply (Hagiu and Wright, 2015). Under the traditional financial system, it is often difficult for small and medium-sized enterprises and farmers in county areas to obtain the financial support needed for low-carbon technology upgrading. However, digital financial inclusion lowers the financing threshold by providing microcredit and green financial products, enabling the “long tail” group to invest in low-carbon technologies, thereby improving energy efficiency (Zou and Deng, 2022). In addition, combined with the innovation system theory, digital financial inclusion provides strong support for decentralized low-carbon innovation projects in counties through diversified methods such as crowdfunding and supply chain finance, thus forming scale effect (Liu et al., 2021). This process not only fills the gap of traditional finance, but also promotes the green transformation of county economy by activating ‘long tail’ demand.
From the perspective of urban economics, digital financial inclusion platforms (such as Ant Forest) can accurately match reward funds with low-carbon projects such as ecological agriculture and clean energy at the county level, reducing resource misallocation and avoiding capital flow to high-pollution industries (Chen G, et al., 2022). At the same time, the popularization of digital payment and consumer finance guides county residents to choose low-carbon products, which reduces the cost of green products and accelerates the popularization process by aggregating the ‘long tail’ demand. However, this process may also introduce potential problems, such as outsourcing of carbon emissions to neighboring counties or time lags between investment and productivity changes.
H1: Digital financial inclusion can improve county carbon productivity.
By embedding digital technology into traditional financial frameworks, digital financial inclusion effectively addresses the systemic mismatches in attributes, domains, and stages that have long plagued conventional financial systems (He, 2025). This alignment creates a conducive environment for mitigating corporate financing constraints and catalyzing technological innovation within enterprises (Sun et al., 2025; Zhang K, et al., 2023). As these financing barriers are alleviated, firms are better positioned to expand their technological innovation efforts (Lee and Wang, 2022). This is particularly significant in the context of green technological innovation, where advancements and diversification are more likely to yield dual dividends—both economic and environmental.
Furthermore, digital finance enhances the integration of socially dispersed resources by financial institutions (Yang et al., 2024). By accelerating the circulation of economic resources across industrial sectors and improving resource allocation efficiency, digital financial inclusion optimizes capital allocation patterns (Feng et al., 2023). This optimization facilitates the upgrading of industrial structures to maximize utility (Ren et al., 2023). The resultant industrial restructuring promotes the rational allocation of production factors across sectors (Wang and Wang, 2021), enhances production efficiency, and drives the transformation of traditionally heavy-polluting industries into energy-efficient and environmentally sustainable ones (Aisaiti et al., 2019).
H2: Digital financial inclusion improves county-level carbon productivity by fostering technological innovation and facilitating industrial structure upgrading.
The evolution of the traditional financial system has amassed substantial expertise and robust frameworks in risk assessment and management, offering valuable insights and benchmarks for the development of digital financial inclusion (Khera et al., 2022). This progression is typically underpinned by comprehensive legal, regulatory, and policy infrastructures, which collectively establish a conducive external environment for the expansion of digital financial inclusion (Cao et al., 2021). A well-established and efficient financial system is instrumental in aggregating capital effectively, thereby supporting green investments and technological innovations, including those initiatives and technologies aimed at enhancing carbon productivity.
Urbanization, characterized by intensified economic activities and population agglomeration (Liu et al., 2023), facilitates the optimal reallocation of resources, including financial capital. As urbanization advances and infrastructure develops in tandem with information technology (Liu et al., 2022), the accessibility and efficiency of digital inclusive financial services are significantly enhanced. The concentration of populations and industries fosters inter-industry exchanges and collaborations, accelerating the dissemination of knowledge and technological advancements (Dauda et al., 2021). The high industrial concentration driven by urbanization results in increased production and economic activities, generating economies of scale. Particularly in the realm of energy production and utilization, large-scale operations often lead to improved energy efficiency.
H3: The advancement of traditional finance and the process of urbanization moderate the improvement effect of digital financial inclusion on carbon productivity.
3 Methodology
3.1 Variables selection and data source
3.1.1 Explained variable
Carbon Productivity (CP) is measured as the gross regional product (GDP) of a county divided by the regional carbon emissions (unit: 10 thousand/ton; Zhang and Liu, 2022). Carbon productivity (CP) refers to the economic value created by unit carbon emissions, which is an important indicator to measure the coordination between economic development and environmental protection increasing carbon productivity means less carbon dioxide emissions for the same amount of economic output, which is greener and more sustainable.
3.1.2 Core explanatory variable
Digital financial inclusion (DFI) refers to the provision of extensive and affordable financial services through digital technology, covering groups that are difficult to reach by the traditional financial system (such as small and micro enterprises, low-income groups, rural residents, etc.). Its core objective is to address the issue of financial exclusion and promote the popularization (inclusiveness) and efficiency improvement (digitalization) of financial services. The digital financial inclusion index (DFII) which is co-published by Alibaba and the Digital Finance Research Center of Peking University (Zhang R, et al., 2023), which is widely used in related research. The first level inducators of DFII is index aggregate (DFIia), There are three second-level indicators of DFII, which are coverage breadth (DFIcb), usage depth (DFIud), and digitization level (DFIdl).
The core goal of the baseline regression is to verify the overall net effect of digital financial inclusion on county carbon emissions. As a comprehensive index, the DFIia can cover the coverage, frequency of use and technical depth of financial services, and fully reflect the integration role of digital financial inclusion (Liu et al., 2023). Moreover, considering the differentiated action path of the three sub-dimensions of digital financial inclusion and the demand for differentiated policy customization in reality, this paper will discuss in the further analysis section. In addition, if the sub-dimension analysis shows that the degree of digitalization is the main driver of emission reduction, this indicates that technological upgrading is the core path, which can enhance the reliability of the benchmark results.
3.1.3 Control variable
Besides digital financial inclusion, it is essential to consider other socioeconomic factors that could impact carbon productivity. This paper selects following control variables: (1) Economic development level (EDL), higher regional GDP per capita means more industrial activity and higher carbon emissions(Daud and Ahmad, 2023); (2) Regional population (RP), areas with higher population density typically face greater energy demand and resource consumption(Xie et al., 2023), leading to higher levels of carbon emissions; (3) Degree of industrialization (DI), which determines the demand structure for different energy sources within the region (Chen et al., 2024b), improving energy efficiency and strengthening clean energy consumption can increase carbon productivity; (4) the degree of fiscal constraint (FC), financial constraints may lead local governments to reduce industry support and to under-invest in carbon emission reduction and technological innovation(Kumar et al., 2021), thereby reducing carbon productivity. (5) Fiscal dependence (FD), local governments with a high degree of financial dependence may pay more attention to ensuring the basic operation of the region and lack independent financial funds, resulting in insufficient investment in environmental protection and carbon emission reduction (Ahmad and Satrovic, 2023; Chen W, et al., 2022), which affects the improvement of carbon productivity. (6) Secondary industry development level (SIDL), the development level of the secondary industry is closely related to production technology (Cui et al., 2023), and it has a large demand for energy (Muhammad et al., 2022).
3.2 Model specification
The fixed effect model can control the unobservable factors (such as geographical location and resource endowment) that do not change over time at the county level, so as to more accurately estimate the impact of digital inclusive finance on carbon productivity. This paper also adds the Hausman test to the benchmark regression to test whether the fixed effect model is significantly better than the random effect model. Although counties are affiliated with provinces, this study focuses on heterogeneity at the county level rather than random effects at the province level. In addition, within the scope of a single province, there are huge differences in the industrial structure and socio-economic development levels of different county-level administrative units. Therefore, this paper chooses the county-level dimension rather than fixing or clustering the data to the provincial dimension. So this paper adopts fixed effects regression model to study the affect of digital financial inclusion on carbon productivity, as presented below:
Where CPit is the explained variable which represents the carbon productivity of the i county in the t year; DFIit is the development level of digital financial inclusion of the i county in the t year, which is the key explanatory variable of this study; β1 is the impact coefficient of DFIit, which is the focus of this paper; Cit represents a group of control variables, including EDL, RP, DI, FC, FD and SIDL; πi represents individual-fixed effects,which is used to control the county characteristics that do not change over time; λt represents time-fixed effect, which is used to control the time trend; εi,t represents error term.
3.3 Sample selection and data sources
Since DFII data for county-level administrative units of China covers only from 2014 to 2022, the start time of panel data is selected as 2014. The socio-economic variables at the county level from the China County Statistical Yearbook and the China Stock Market & Accounting Research Database (CSMAR). Besides, this paper undertakes a meticulous process of cross-referencing and supplementing the aforementioned databases to ascertain the utmost completeness of the data set.
County carbon emission data for 2014–2017 comes from Chen et al. (2020) (pp. 1997–2017). Although the interpolation method may have errors due to the linear trend premise, the change of carbon emissions often involves industrial restructuring and upgrading, as well as the leap forward of technological innovation, which is a gradual process. Because the change of this trend will not happen overnight, it has a certain inertia. In addition, China only formally proposed a two-carbon target in September 2020, so after that, China’s county level carbon emissions may be subject to additional changes due to external shocks. However, the sample studied in this paper is China’s counties, where the industrial base is relatively weak, most of the areas are far from the city center, closer to rural areas and farmers, and these areas are relatively less affected by the dual-carbon policy. County dimension data also have the richness and heterogeneity that provincial and municipal panel data do not have. Therefore, based on the original continuous data from 1999 to 2017, this paper uses the interpolation method to obtain the county carbon emission data from 2018 to 2022.
The county-level patent data in this study come from the State Intellectual Property Office, which contains three types of complete records of invention patents, utility model patents and design patents from 1985 to 2022. Invention patents require “novelty, creativity and practicability,” which has a high technical threshold and can better reflect the substantive technological innovation ability of a region. In contrast, utility model patents and design patents have low technical content and reflect more improved designs or appearance changes, which cannot fully represent the depth of technological innovation. Therefore, the index of invention patent is selected as the standard to measure technological innovation.
In order to ensure data quality, this paper implements the following standardized processing procedures: (1) With the help of the unique official administrative division code of each county, the patent data and county carbon emission data are matched with county social and economic data one by one. (2) The year 2014 is the starting point of the rapid development of digital finance in China, and also the year when the “Internet Plus” strategy was proposed. Besides, the (digital inclusive financial data has only been released since 2014). Considering the rationality and availability of core data, only the panel data from 2014 to 2022 are retained. (3) Considering that Xinjiang, Tibet, Inner Mongolia and Qinghai provinces are sparsely populated and have relatively weak infrastructure, the frequency and quality of official statistical data collection are low. In addition, these regions are involved in ethnic policies and national security issues, and local policies (such as subsidies and environmental regulations) are often specific. These regions are therefore dropped from the sample. (Including 103 in Inner Mongolia, 74 in Tibet, 108 in Xinjiang and 45 in Qinghai, excluding a total of 330 county-level administrative units). (4) Additional counties with completely missing key data, including carbon emissions, GDP, digital financial inclusion, patent data, and the development level of traditional finance, are excluded (a total of 836 counties are excluded). (5) Except for the county carbon emission data, all the other data use the original values without interpolation. (6) This paper finally constructs unbalanced panel data covering 1,677 county-level administrative units from 2014 to 2022.
There are 2,843 county-level administrative units in China, and the 1,677 county-level administrative units covered by the samples in this paper account for 58.99% of the total county-level administrative units in China, and the county-level administrative units excluding the four provinces in Step (3) account for about 66.73%. It is significantly representative in terms of numerical value and proportion. The descriptive statistics of each variable are shown in Table 1.
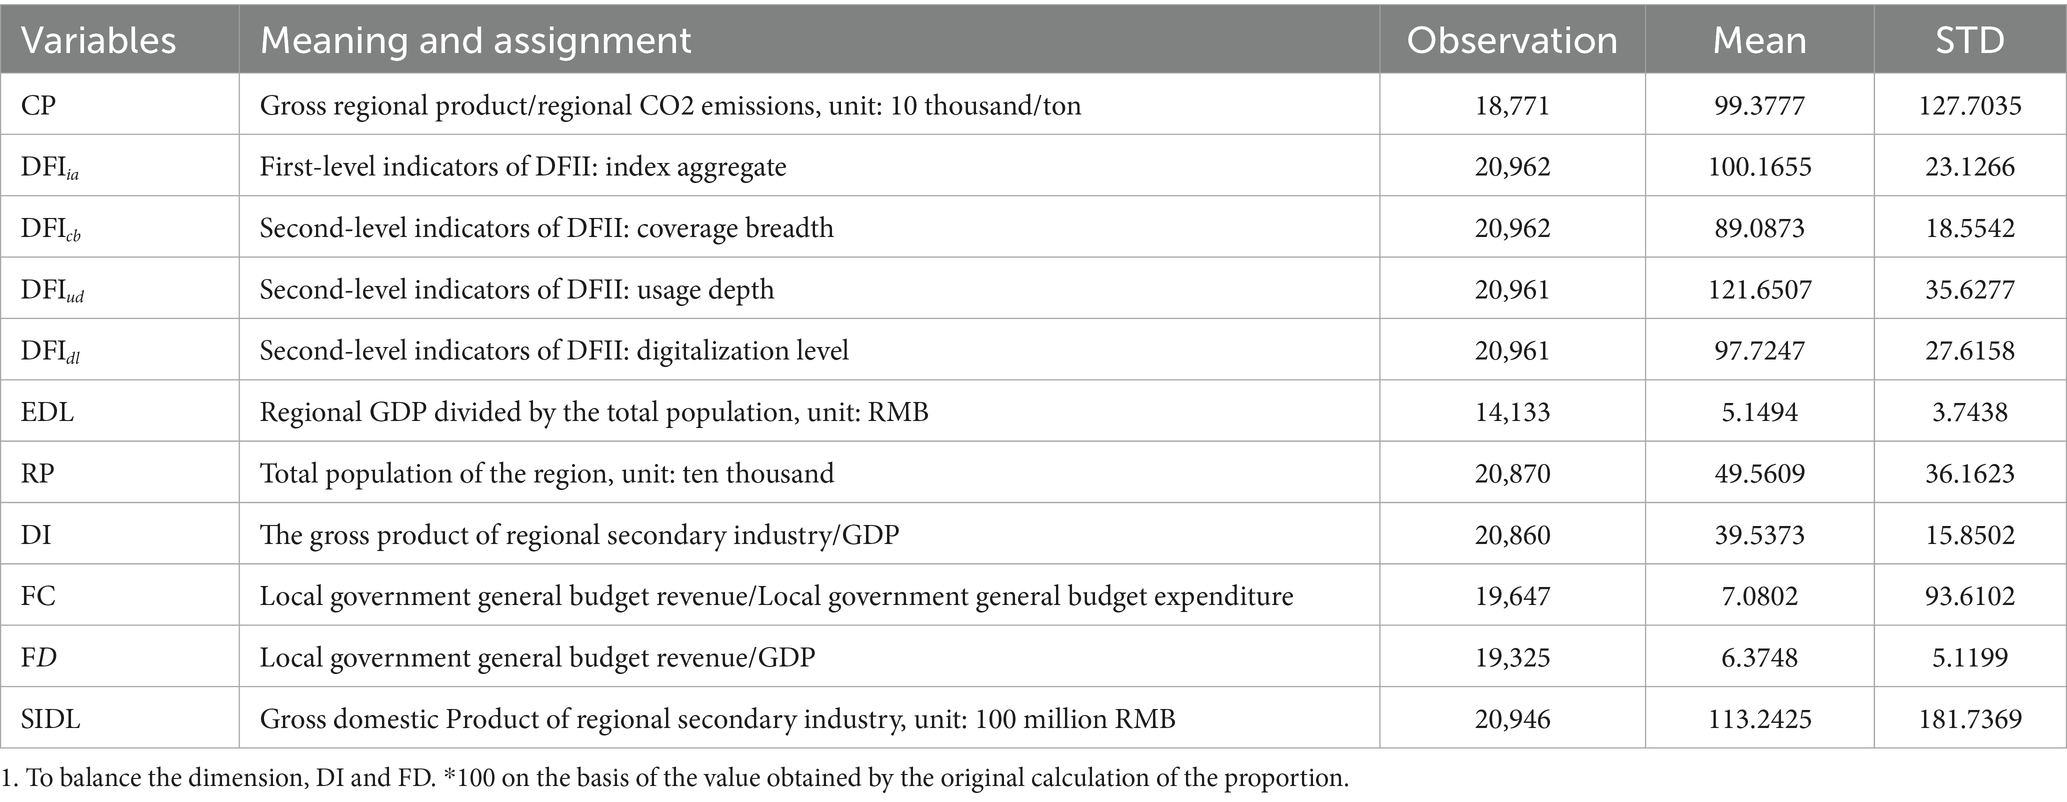
Table 1. Descriptive statistics.
4 Baseline analysis
4.1 Baseline regression
The carbon productivity sample is double-tailed by 1% to avoid the influence of extreme values. The data distribution between it and digital financial inclusion of Chinese counties is shown in Figure 2. Digital financial inclusion and carbon productivity show a potential positive correlation, and more observation points are concentrated in the range of high digital financial inclusion and moderate carbon productivity.
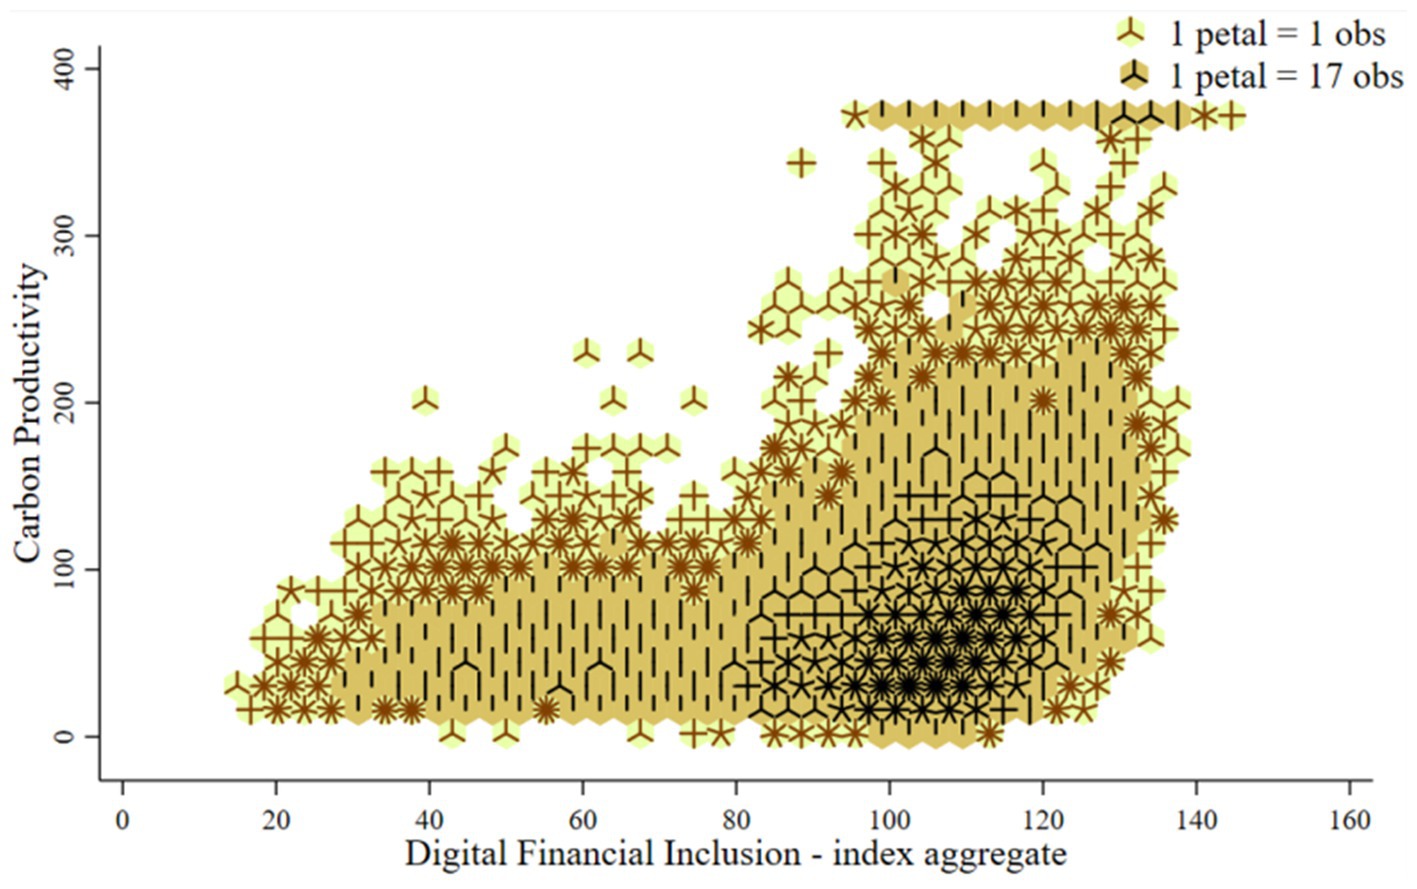
Figure 2. Distribution of digital financial inclusion and carbon productivity.
The results of the random effect and fixed effect model are shown in Table 2 column (1)–(2). the regression result of standard error clustering to county based on fixed effect is shown in column (3). Hausman test statistic chi2(7) = 332.58 and p-value≈0.0000, indicating that the null hypothesis is strongly rejected. The fixed effect model is more appropriate, because there is correlation between individual effects (such as county characteristics) and explanatory variables DFIia. The coefficients of multiple variables under fixed and random effects are significantly different, indicating that ignoring individual fixed effects will distort the direction or strength of the influence of core variables.
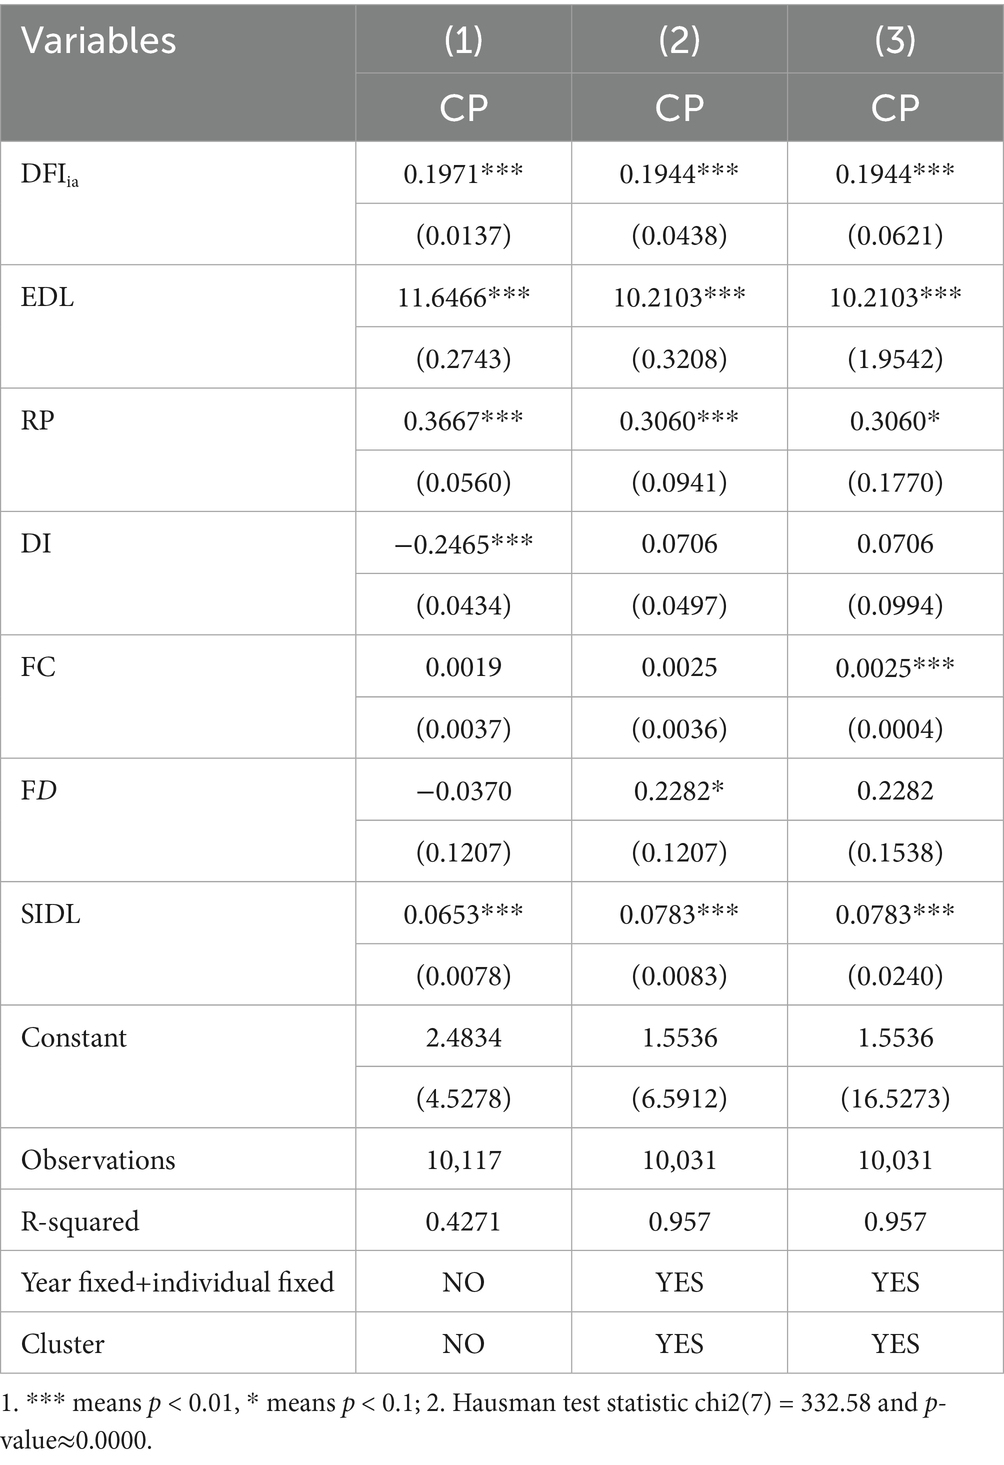
Table 2. Baseline regression.
The regression coefficient fluctuates between 19.44–19.71%, which is stable and significant. This paper takes column (3) as the benchmark regression result for analysis. The influence coefficient of DFIia on CP is 19.44%, indicating that digital financial inclusion can improve carbon productivity.
4.2 Robust test
1. In order to reduce the impact of outliers on the analysis results (Chen and Du, 2024), this paper winsorizes the explained variable and the core explanatory variable at the national sample level by 1%. The regression results are shown in Column (1) of Table 3.
2. Considering that there are significant differences in the level of economic development, resource endowment and policy implementation among provinces in China, in order to further control the heterogeneity within provinces (Tian et al., 2022), this paper groups the samples by provinces and wins-down the samples by 1%. This treatment method can reduce the influence of outliers within the group, and the regression results are also shown in Column (2) of Table 3.
3. Considering that even though they are the same county-level administrative units, there are huge differences between urban areas and ordinary counties in terms of economic and social foundation and administrative resources (Zhou et al., 2023), the samples are separated into non-urban counties, and the regression results are shown in Column (3) of Table 3.
4. Considering the carbon emission data from 2018 and beyond, the interpolation method was used to obtain it. To test the impact of the trend inertia hypothesis on this study, the sample (2014–2022) was divided into two sub-samples: 2014–2017 and 2018–2022. The regression results are shown in columns (4) to (5) of Table 3. The correlation coefficient of digital inclusive finance on carbon productivity of the samples from 2014 to 2017 is 14.81%, slightly less than 19.44% of the benchmark regression (2014–2022), but the correlation coefficient of the samples from 2018 to 2022 is 53.52%, close to 2.5 times of the benchmark regression correlation coefficient. This difference mainly comes from two aspects: policy effect and interpolation error.
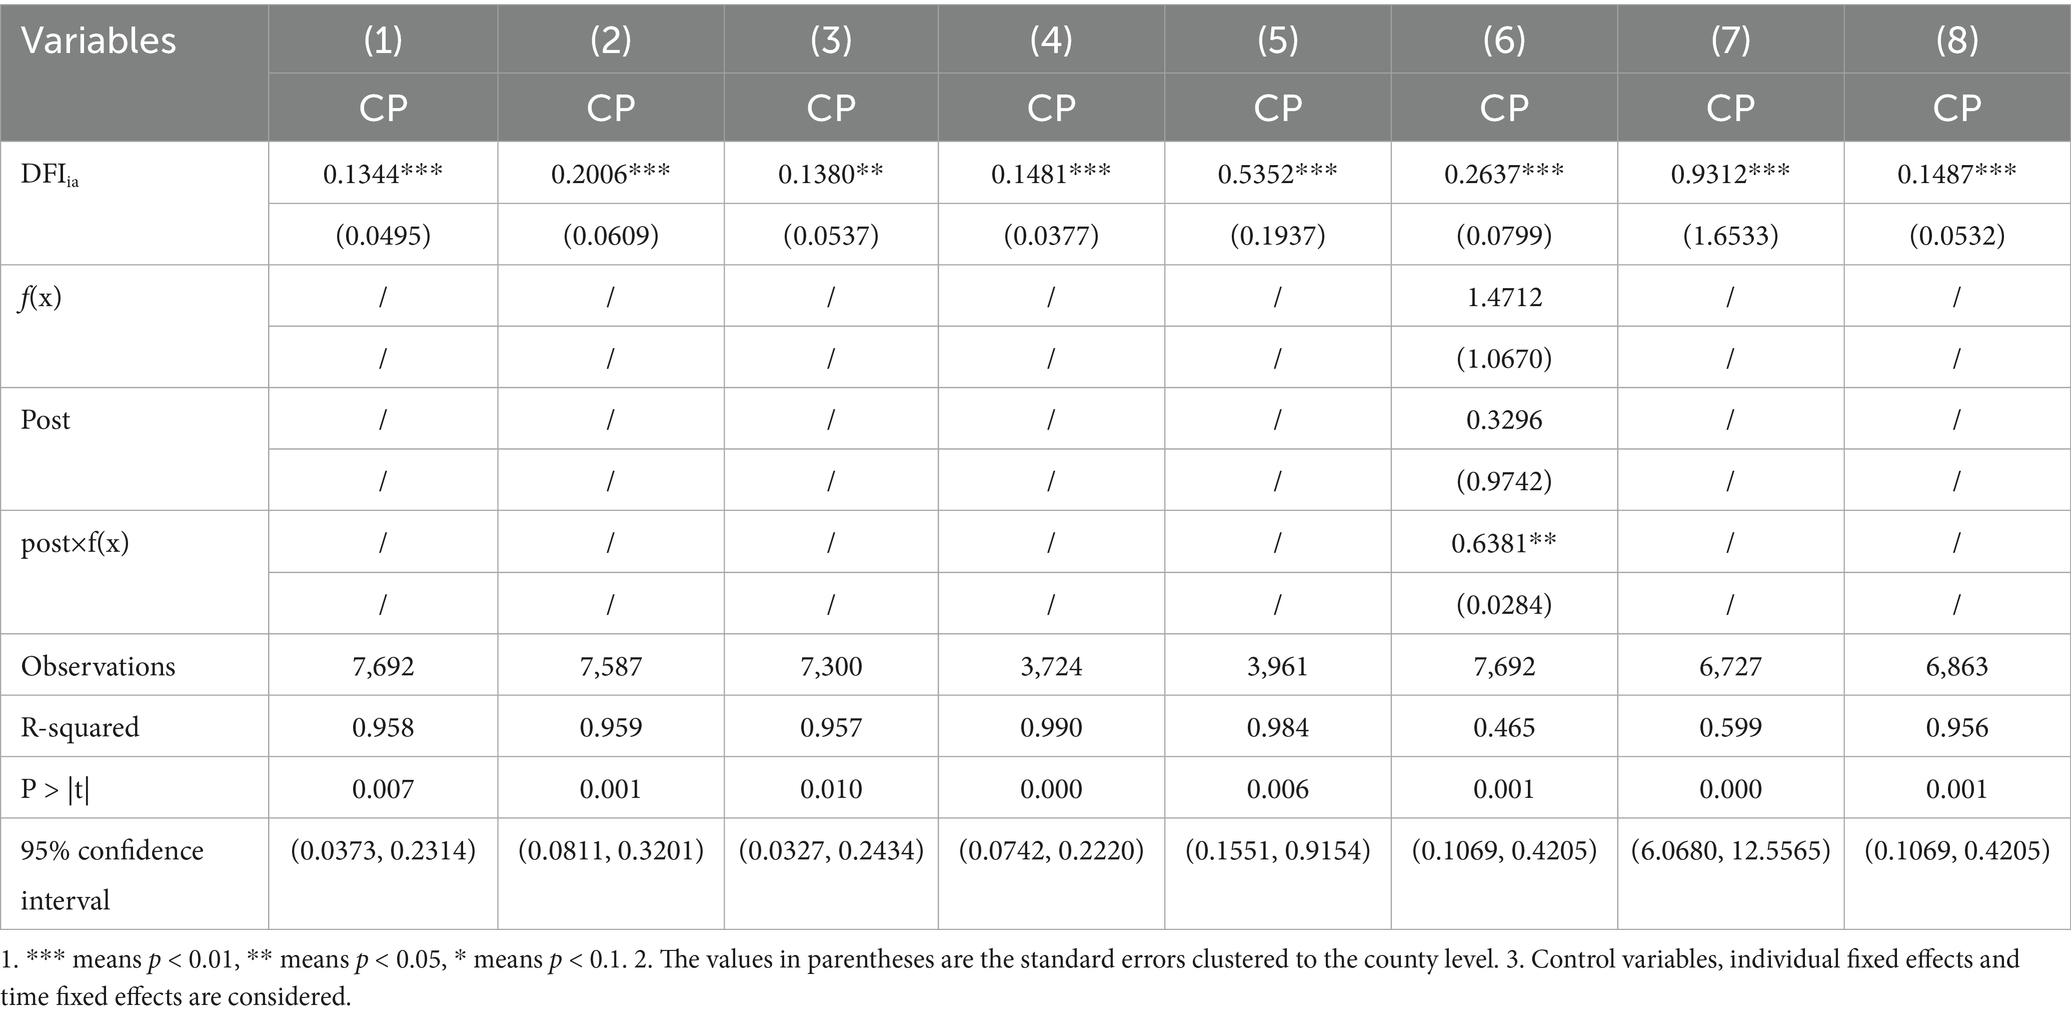
Table 3. Robustness test.
First, after the “dual carbon” target was proposed in September 2020, financial instruments such as green credit and carbon emission reduction discount interest accelerated to sink to counties, amplifying the marginal effect of DFI on CP; the second is that linear extrapolation may systematically underestimate actual emissions and thus magnify carbon productivity. This paper will specifically discuss the impact of the two points on the regression results in the following robustness test.
1. In order to strip the interpolation error and take into account the potential impact of the dual carbon target on the carbon emission pattern, this paper further introduces the regression discontinuity (RDD) method to evaluate the impact of policy shocks on trend inertia. The RDD model is constructed as follows:
The regression results are shown in Column (6) of Table 3: the time trend is significant, but the policy intercept has no jump, and the interaction term reappears and is significant. After 2020, the post-policy slope is significantly higher than the pre-policy slope. Digital inclusive finance and county low-carbon transformation form an “acceleration effect” rather than a simple horizontal jump. The “dual carbon” declaration in 2020 does not bring about a sudden change in the intercept level, but significantly accelerates the “time slope” of county carbon productivity, which is manifested as an “accelerated increase” after the policy rather than a one-time jump. At the same time, the carbon productivity improvement effect of digital inclusive finance is still robust and effective.
1. Based on relevant research results, at the county scale, the night light index shows a significant and stable linear correlation with energy consumption and CO₂ emissions (Elvidge et al., 1997; Razzaq et al., 2024; Tian et al., 2022). In order to exclude interpolation errors and further verify the robustness of the linear extrapolation of county-level carbon emissions from 2018 to 2022, we introduce the night light intensity data as the proxy variable of carbon emissions, and conduct a correlation analysis between the night light intensity and the growth rate of carbon emissions. The regression results are shown in Column (7) of Table 3, and the correlation coefficient is 93.12%, which indicates that there is a strong positive linear correlation between the two at the county scale, and the direction is consistent without significant deviation. The emission series, proxied by the nighttime light index, is synchronized with the interpolated series with limited interpolation bias, and the linear extrapolation assumption still holds at the county scale.
2. The panel data used in this study is unbalanced, which may introduce attrition bias. In order to verify the robustness of the research results, this paper extracts a balanced subsample and conducts the regression analysis again. The regression results shown in Column (8) of Table 3 show that the main conclusions are basically consistent with the analysis of the whole sample, indicating that the attrition bias of unbalanced panel data has a limited impact on the research results.
Although there are slight numerical differences in the regression results of the above robustness test, the correlation coefficients are consistent with the benchmark regression results in terms of government and robustness (including the confidence interval and p-value range). The robustness tests all prove that the correlation coefficient of digital inclusive finance on carbon productivity is significantly positive.
4.3 Endogenous test
For baseline regression, clustering standard errors based on the fixed-effects model helps to mitigate endogeneity to a considerable degree. Given that the instrumental variable two-stage least squares method (IV-2SLS) can alleviate the endogenous problem caused by reverse causation, this paper selects Disthangzhou*Mean-DFIia and Average-DFIiacity as the instrumental variable.
Disthangzhou*Mean-DFIia is the intersection term of the spherical radius distance from Hangzhou and the average annual value of digital inclusive finance across the country (Li et al., 2022). Hangzhou, as the birthplace of China’s largest Alipay digital inclusive finance platform, has a geographical agglomeration effect. The closer the county is to Hangzhou, the more affected it is by its technology diffusion and infrastructure spillover, and the higher the level of DFI is (Lu et al., 2021). At the same time, annual national DFI averages can be used to capture time trends to control for national policy shocks. Based on geographical and historical factors, the distance between a county and Hangzhou should not directly affect carbon productivity. However, as a macro time trend, the annual average of the national DFI is not related to the specific shocks to the county, such as environmental policies.
Average-DFIiacity is the average value of DFIia of other counties in the same city. Under fixed fiscal and financial resource constraints, there is resource competition among counties within the same municipal area. If other counties have a high level of DFI, they may attract more financial resources (such as bank credit and digital platform services), which will inhibit the development of DFI in their own counties (Chen et al., 2024a). In addition, municipal governments usually promote coordinated regional development through differentiated policy allocation. If the surrounding counties have a high DFI level, the county may be positioned as a “traditional industry retention area,” and the policy support will be weakened, which will lead to a decrease in DFI penetration rate. Carbon productivity is mainly determined by local industrial structure (such as document variable DI), energy efficiency (such as clean technology patents) and other factors, and will not be directly disturbed by financial activities in neighboring counties.
As shown in column (1)–(2) of Table 4. The Sanderson-Windmeijer multivariate F-test, the Cragg-Donald Wald F-test and the Kleibergen-Paap rk LM test all show that the instrumental variables are very strong and there is no weak instrumental variable problem. The Kleibergen-Paap rk LM test indicates that the model is sufficiently identified and the number of instrumental variables is sufficient. The Anderson-Rubin Wald test and Stock-Wright LM S test show that the endogenous variables are still jointly significant in the master equation even when the weak instrumental variable problem is considered. The Hansen J test shows that the instrumental variables are exogenous and there is no over-identification problem. Disthangzhou*MEAN-DFIia and Average-DFIiacity are significantly correlated with DFIia. The coefficients of DFIia for CP is significantly positive and consistent with the benchmark regression.
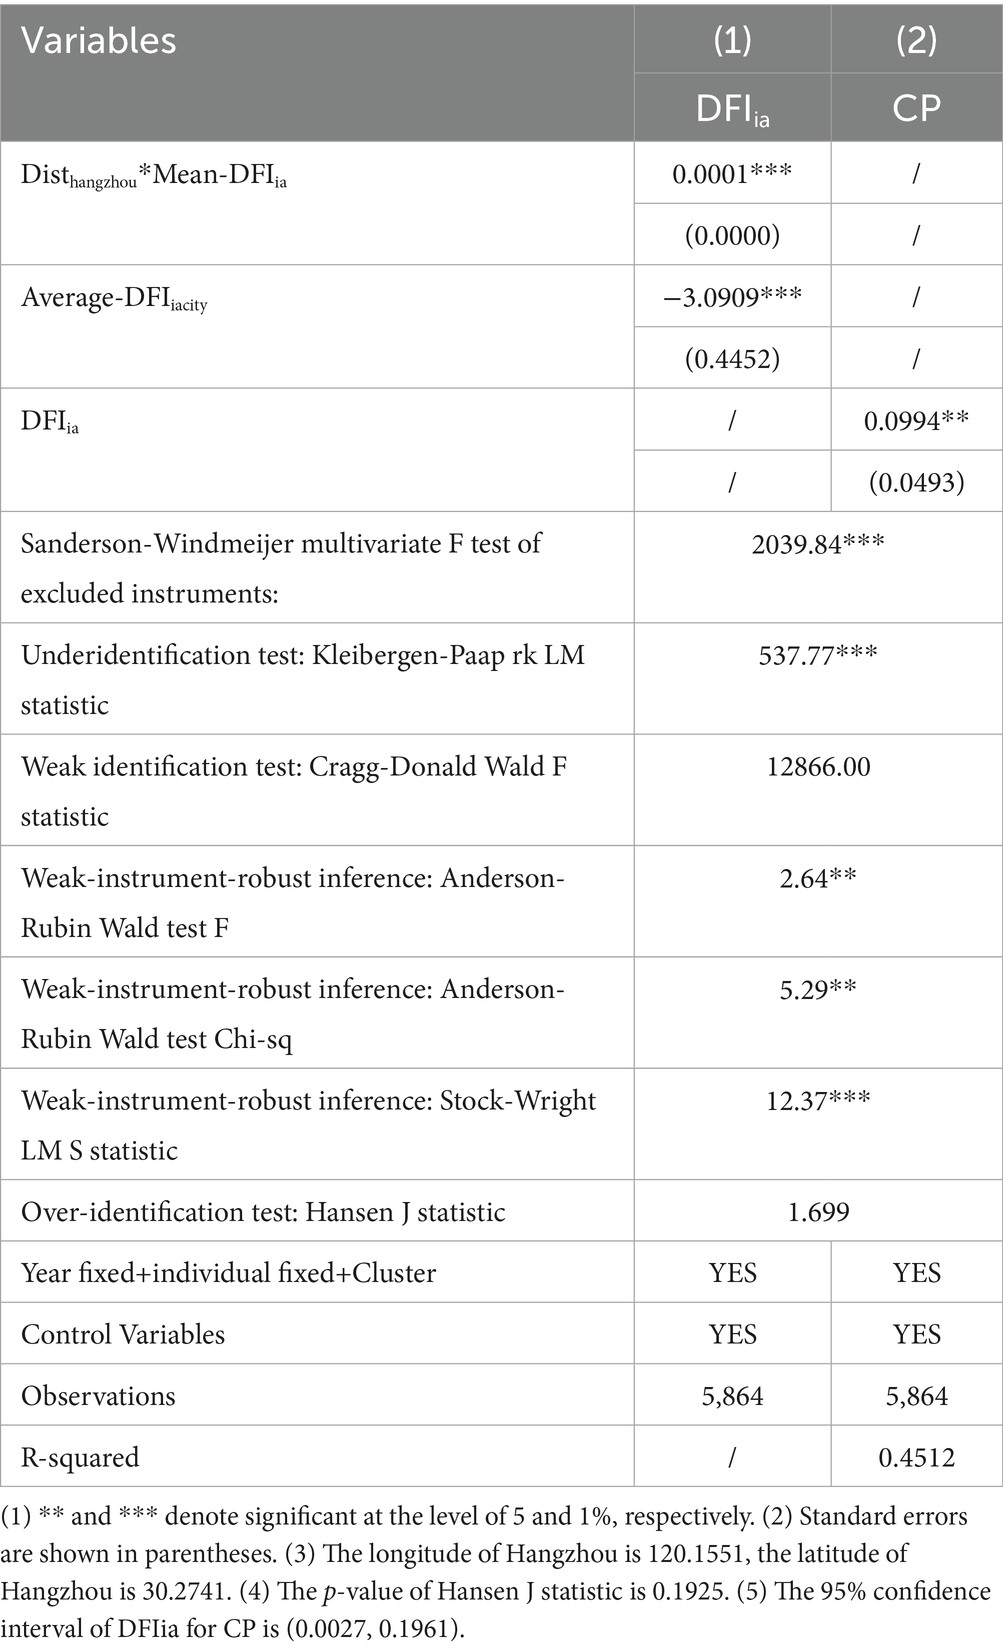
Table 4. Endogenous test.
5 Further discussion
5.1 Mediation effect analysis
According to theoretical analysis, digital financial inclusion affects county carbon productivity mainly through two channels: improving industrial structure and developing scientific and technological innovation. The level of industrial structure development is measured by the industrial upgrading index (IND; Wang and Wang, 2021). The technological innovation level is measured by the number of patented inventions published within the county area (Patent). In order to verify the significance of the mediating effect, this paper adopts the superposition clustering model of individual and time fixed effects with Bootstrap 500 times. The mediation variable construction and the mediation effect model are shown in Equations (3) and (4).
Where IND is the industrial upgrading index; GDPP, GDPS, and GDPT are the proportion of the region’s primary, secondary, and tertiary industry in regional GDP, respectively; Mit is the mediating variable of i county in t year, which is substituted by IND and Patent in the mediation effect analysis. The regression results of mediating effect are shown in Table 5 (1) ~ (3), and the 95% confidence interval of Bootstrap method does not contain zero, which further confirms the existence of mediating effect. DFI has a significant dual-path impact on county CP. The direct effect coefficient of DFIia on CP is 16.59% (p < 0.01), which indicates that for every unit increase in digital inclusive finance, carbon productivity will directly increase by 16.59%. For every one standard deviation increase of DFIia, the industrial upgrading index of county will significantly increase by 7.63% units (p < 0.01); However, for every one unit increase in industrial upgrading index, county-level carbon productivity will significantly increase by 77.32% units (p < 0.01). Therefore, the indirect effect of this path is 0.0763 × 0.7732 ≈ 0.0590, accounting for 89.0% of the total indirect effect.
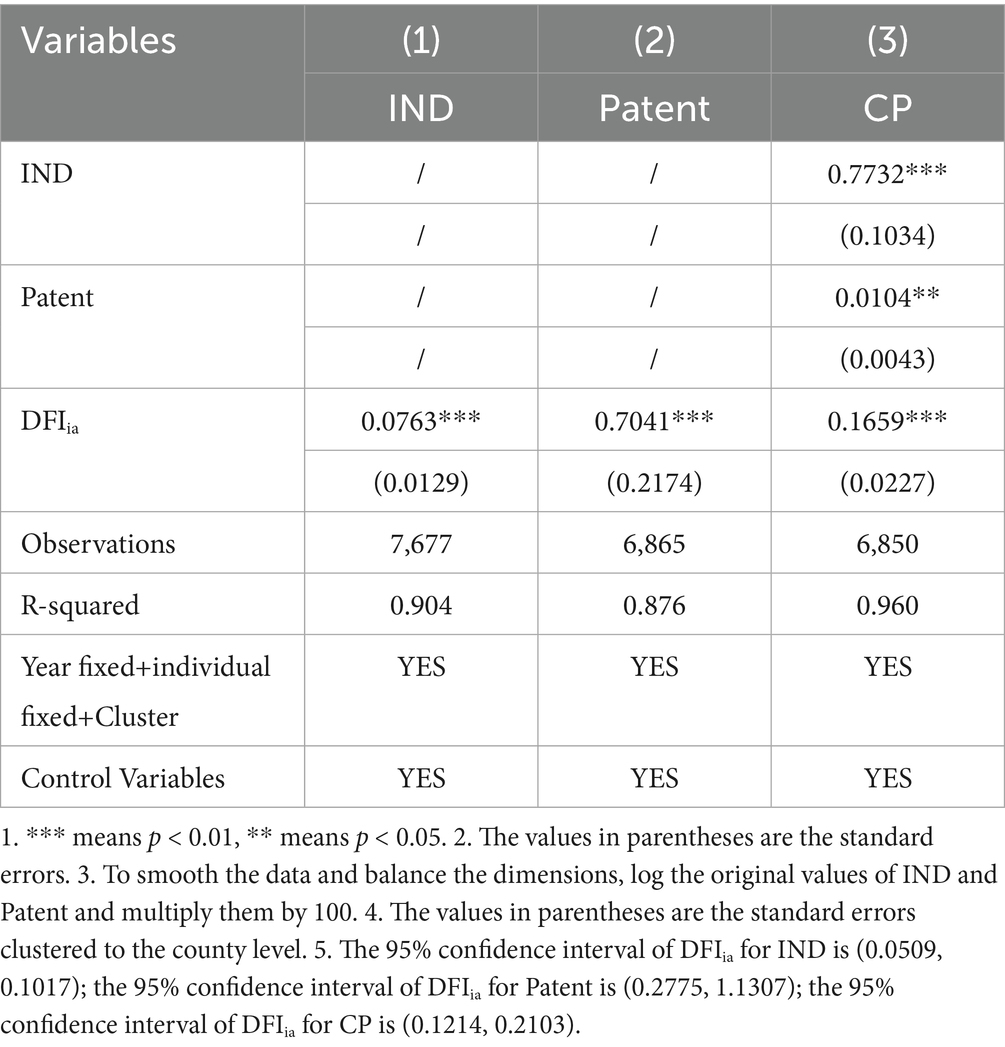
Table 5. Mediation effect analysis.
For every unit increase in DFI, the patented inventions published will significantly increase by 0.7041 units (p < 0.01); However, for every one unit increase in patented invention, the county-level carbon productivity will significantly increase by 1.04% units (p < 0.05). Therefore, the indirect effect of this path is 0.7041 × 0.0104 ≈ 0.0073, accounting for 11.0% of the total indirect effect.
County digital inclusive finance mainly promotes the improvement of carbon productivity through the macro channel of “industrial structure upgrading” and the micro channel of “patent technology innovation.” Among them, the marginal contribution of industrial structure upgrading is about eight times that of patent innovation. This suggests that policy makers should give priority to supporting industrial upgrading policies and green technology R&D incentives when promoting the sinking of green credit, so as to achieve the multiplier effect of carbon productivity.
5.2 Moderator effect analysis
According to the theoretical analysis, in order to test the moderating effect of The advancement of traditional finance and the process of urbanization, this paper sets the moderating effect regression model as the Equation (5).
Where Modit is the moderator variable of the i county in the t year. Use the year-end loan balance of regional financial institutions (Loan) to measure the traditional financial development (Chen et al., 2021), and the regional night light index (NLI) to measure urbanization levels. (1) Loan interaction with DFIia (Loan*DFIia), (2) NLI interaction with DFIia (NLI*DFIia), and (3) both Loan and NLI interaction with DFIia (Loan*NLI*DFIia) were introduced, respectively, to test the moderator effect, the regression results are shown in Table 6 (1)–(3). the regression coefficients of Loan*DFIia, NLI*DFIia, and Loan*NLI*DFIia in the obtained regression results are significantly positive.
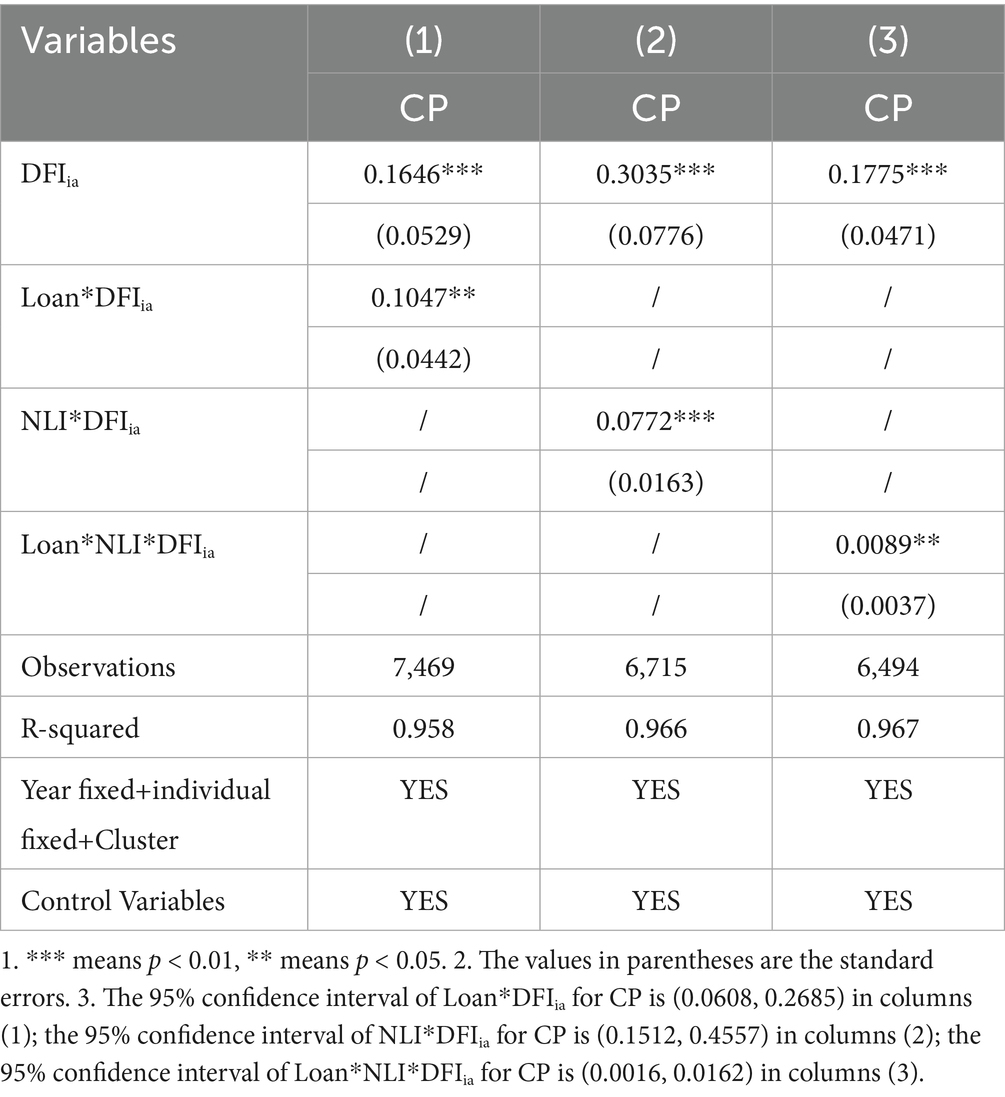
Table 6. Moderating effect analysis.
The regression results demonstrate that traditional finance significantly amplifies DFI’s positive effect on carbon productivity, evidenced by a statistically robust coefficient of 10.47% (p < 0.05) for the Loan*DFIia, with a 95% confidence interval (0.0608, 0.2685) excluding stochasticity. This implies that regions with advanced traditional financial systems extract greater carbon productivity dividends from DFI. Similarly, urbanization enhances DFI’s marginal contribution to carbon productivity, as shown by the 7.72% coefficient (p < 0.01) for NLI*DFIia and a confidence interval (0.1512, 0.4557), indicating that higher urbanization levels intensify DFIia’s carbon efficiency gains. Critically, the synergistic effect among traditional finance, urbanization, and DFI is confirmed by the significant triple-interaction term Loan*NLI*DFIia (coefficient = 0.89%, p < 0.05; confidence interval: 0.0016–0.0162), revealing that improvement effect of DFI on carbon productivity is maximized when high traditional finance development coincides with advanced urbanization.
For counties with a solid traditional financial foundation and a high urbanization rate, priority can be given to integrating green credit, digital risk control and industrial funds into a “one-stop” platform to form an amplification effect. In areas where traditional financial development is weak or urbanization lags behind, simply expanding the coverage of digital inclusive finance has limited effect. The participation of traditional finance should first be enhanced through measures such as fiscal interest subsidies and the establishment of risk compensation pools. At the same time, the construction of digital infrastructure and the agglomeration of population and economy should be accelerated. Only in this way can the carbon productivity dividend of DFI be truly implemented.
5.3 Quantile regression
Under the theoretical framework of diminishing marginal effects and resource constraints, counties in the lower quantiles remain in the “finance-technology” bottleneck stage, where the efficacy of DFI in enhancing marginal carbon productivity is constrained. Initially, investments are primarily allocated to bridge developmental gaps and establish financial infrastructure, leaving advanced green technology sectors untapped. As county-level carbon productivity gradually improves, financial resources, professional expertise, and technological stock accumulate synergistically, giving rise to diminishing marginal costs and economies of scale. During this phase, the emission reduction dividend of DFI is amplified through enhanced technological absorptive capacity. However, as county development approaches the technological frontier or the upper limits of environmental regulation, additional inputs encounter a steeper marginal cost curve, and resource constraints tighten once more. Given that higher-order emission reduction technologies demand greater capital density and more robust institutional support, the marginal effect inevitably moderates again.
This paper employs the “qrprocess” command to obtain the information on the conditional distribution, and mitigate the influence of outliers on the estimated outcomes. To further analyze the potential different improvements effect by digital financial inclusion at different quantiles of carbon productivity, this paper established the quantile regression model as the Equation (6) (Angrist et al., 2006):
Where Q(CPit|DFIit) is the quantile function of CPit, represents the regression result of a particular quantile of CPit. The quantile regression results are shown in columns (1) ~ (9) of Table 7. Low quantiles (0.1 to 0.5): The coefficient on DFIia is significantly positive and statistically significant (all p-values are less than 0.05). This indicates that DFIia has a positive effect on CP at low quantiles. Median quantile (0.6 to 0.8): The coefficient of DFIia decreases gradually and remains significant at the 0.6 quantile, but is no longer significant at the 0.7 and 0.8 quantiles (p values greater than 0.05). This indicates that the effect of DFIia on CP gradually weakens at the median quantile. High quantile (0.9): The coefficient of DFIia is significantly negative (p-value less than 0.01), indicating that DFIia has a negative effect on CP at high quantiles.
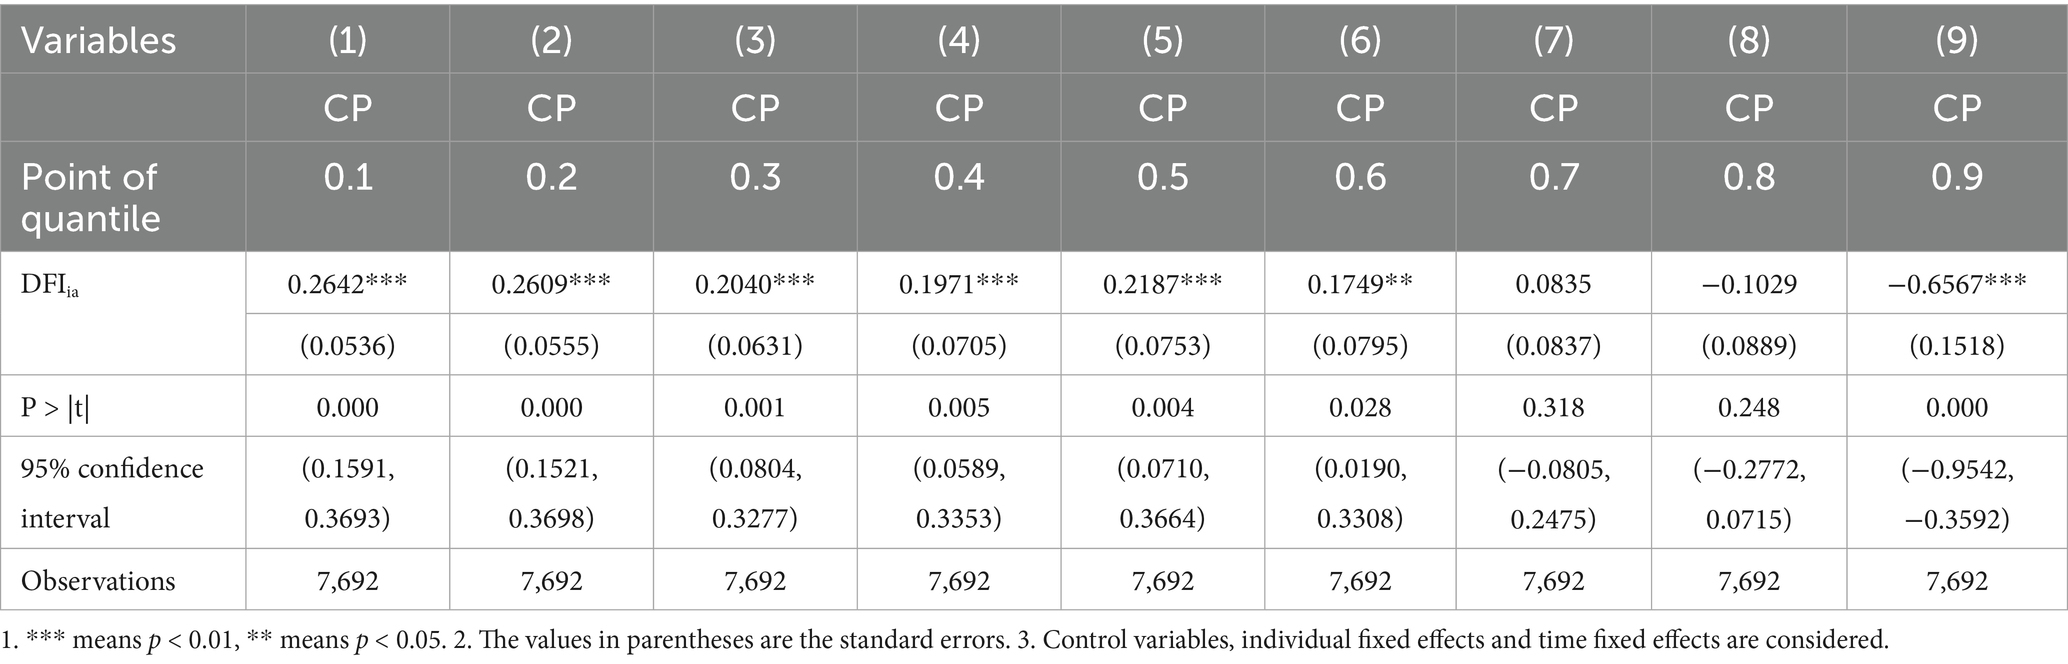
Table 7. Quantile regression.
The regression results show that the impact of DFI on CP is significantly different at different quantiles. This heterogeneity may reflect different mechanisms of action of DFI in different groups or under different economic conditions. Positive effect at low quantiles: The positive effect of DFI on CP at low quantiles may indicate that DFI is able to significantly improve CP when CP is low. This may reflect that the DFIia has a stronger promotion effect on disadvantaged groups or individuals with lower economic performance. Negative effect at high quantiles: The negative effect of DFI on CP at high quantiles may indicate that the role of DFIia may be affected by diminishing marginal effects or other limiting factors at high CP, and may even have a negative effect.
At low CP, the effect of DFI is more significant, so the policy should be preferentially skewed toward these groups or regions to maximize the policy effect. For example, the DFI can be upgraded by increasing investment, improving infrastructure, or providing technical support. However, in the case of high CP, DFI needs to be used carefully to avoid potential negative effects.
5.4 Heterogeneity analysis
5.4.1 Sub-dimension analysis
The DFIia may mask the diverse impacts of its sub-dimensions on carbon productivity. Thre are fundamentally distinct characteristics of the sub-dimensions: the coverage breadth is mainly related to account coverage; the usage depth involves payment, money funds, and credit business, reflecting the development degree of digital financial business, the digitization level focuses on convenience,mobility, affordability, and credit (Qin et al., 2022). In a random sample of 500 counties in the county sample, the year-by-year changes in the coverage breadth, usage depth and digitization level of digital financial inclusion are shown in Figure 3. The growth rate, change trend and convergence of coverage breadth, usage depth and digitization level are obviously different.
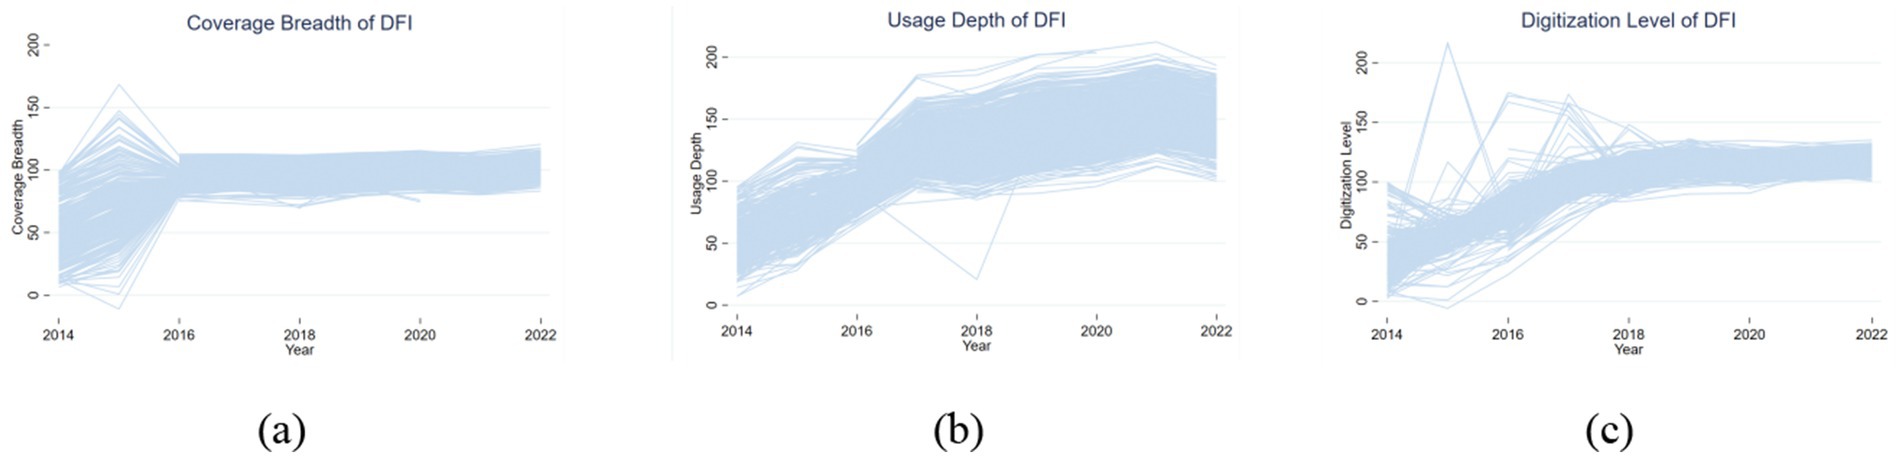
Figure 3. Trend chart of random sampling variation of subdimensions of digital financial inclusion.
The regression results of substituting DFIcb, DFIud, and DFIdl into the explanatory variables, respectively, are shown in columns (1)–(3) of Table 8. The influence coefficients of DFIcb and DFIdl are 8.96 and 18.13%, respectively. Although the influence coefficient of DFIud for CP is 6.15%, its significance level is not significant, indicating that the relationship is not statistically stable. Only digitalization level and coverage breadth have a significant positive impact on county carbon productivity, and the effect of digitalization level is almost twice that of coverage breadth; The effect of depth of use on carbon productivity is not robust. In order to further test the robustness of the three sub-dimensions of digital inclusive finance to county carbon emissions, this paper adds the three sub-dimensions into the same regression equation at the same time. The regression results are shown in columns (4) of Table 8, and the absolute value and relative ranking of each coefficient are basically consistent with the single regression, which indicates that the multicollinearity between the sub-dimensions is not serious, and the previous conclusion is robust, not driven by missing variables or model setting.
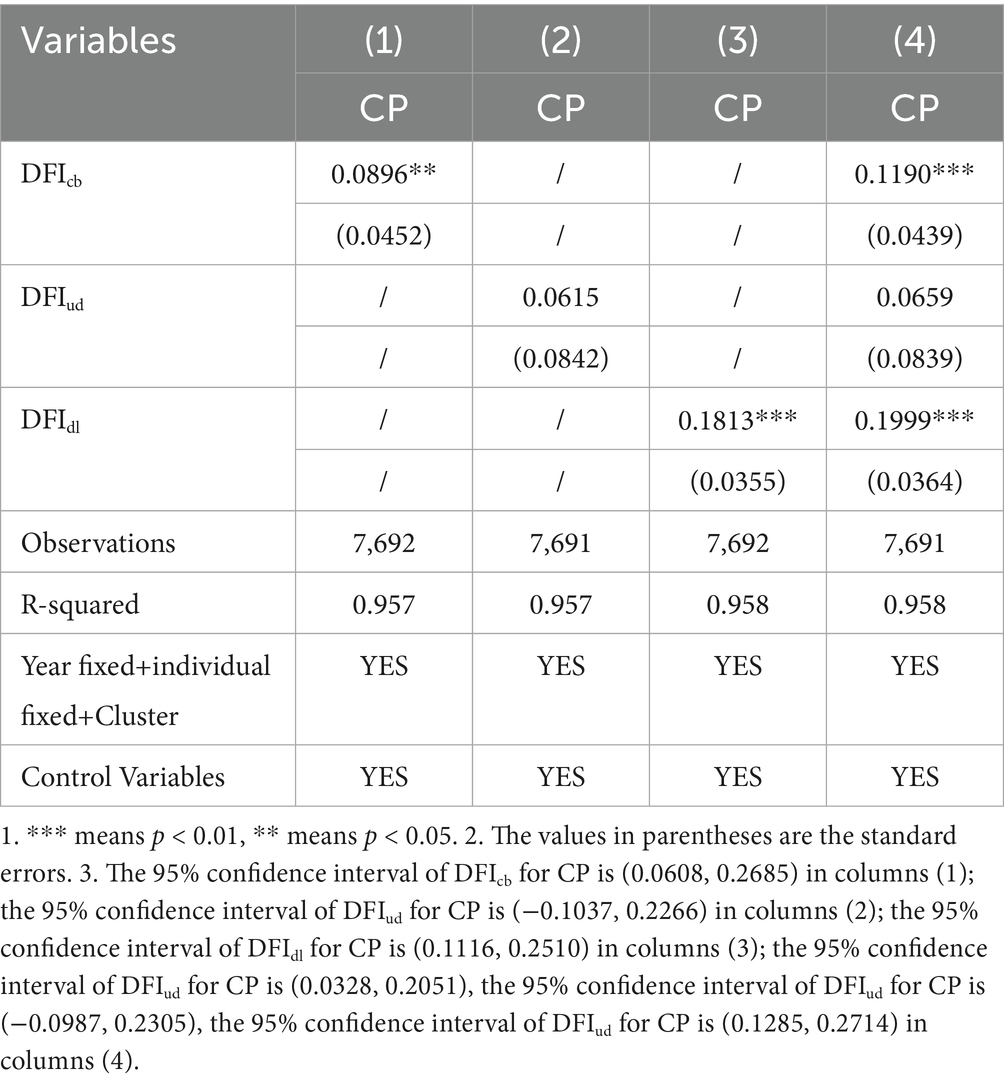
Table 8. Sub-dimension analysis.
Digital technology significantly reduces financial service costs by mitigating information asymmetry while enabling clean-tech R&D, thereby lowering corporate low-carbon transition costs and enhancing technical efficiency. The impact of coverage breadth on carbon productivity is constrained by scale dependency, particularly in rural areas where low population density elevates per-unit service costs and accelerates marginal utility decay. Although usage depth relies on high-frequency transaction data integrity, pervasive data fragmentation among SMEs—exemplified by the 30% data completeness rate in Shandong Shouguang’s agricultural cloud platform—impedes risk models from accurately identifying green project risks, thereby hindering efficient capital allocation. Building on the multidimensional analysis of digital inclusive finance, local governments and platform institutions should prioritize investments in digital infrastructure upgrades and intelligent risk-control algorithm development while expanding inclusive finance account coverage. Concurrently, establishing a “green project whitelist” mechanism coupled with targeted interest subsidies is essential to anchor financial resource allocation to carbon reduction initiatives. This integrated strategy effectively leverages inclusive finance’s coverage advantage to generate measurable carbon productivity dividends.
5.4.2 Yangtze River Economic Belt
The Yangtze River Economic Belt, encompassing 11 provincial-level administrative regions in China, abounds in natural resources and a skilled labor pool. After experiencing rapid industrialization and urbanization, enterprises and residents in the Yangtze River Economic Belt have become increasingly concerned about environmental protection and carbon emission reduction, and actively fostered the optimization of its industrial structure and the advancement of high-tech industries. This offers crucial support for scientific and technological innovation as well as industrial upgrading, particularly in areas such as energy conservation, emission reduction, clean energy, and green manufacturing (Chen G, et al., 2022). Moreover, the Yangtze River Economic Belt region has a comprehensive digital infrastructure, leading digital economy, and widespread DFI.
The samples are divided into two subgroups based on whether they are situated within the Yangtze River Economic Belt or not, and the regression outcomes are shown in columns (1)–(2) of Table 9. For the non-Yangtze River Economic Belt region, the impact coefficient of DFIia is positive but not significant. In contrast to that, the impact coefficient of DFIia is 21.72% and significant for the Yangtze River Economic Belt. There is notable regional heterogeneous impact of digital financial inclusion on carbon productivity. Within the Yangtze River Economic Belt region, digital financial inclusion significantly enhances carbon productivity.
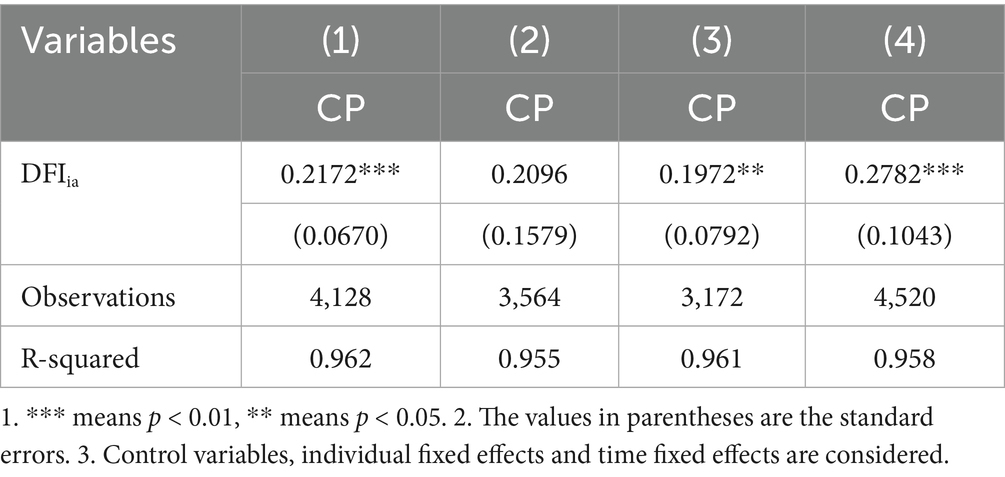
Table 9. Heterogeneity analysis.
5.4.3 Yellow River Basin
The Yellow River Basin holds significant importance as ecological security barrier area in China, but its resource depletion, environmental pollution, ecological damage, and other problems are becoming increasingly serious (Chen W, et al., 2022). The potential and urgency of transformation may be more prominent, because the economic development of the Yellow River Basin mainly relied on high-carbon emission industries in the past. In this context, increasing carbon productivity, reducing pollution, and promoting green development have become important policy directions in the region. Hence, digital financial inclusion is poised to foster investment and advancement in low-carbon technologies within the Yellow River Basin, thereby leading to heightened carbon productivity.
Based on whether they are situated within the Yellow River Basin or not, the samples are divided into two sub-samples whose the regression results are shown in columns (3)–(4) of Table 9. The influence coefficient of Yellow River Basin DFIia is 27.82%, which is more significant and robust compared with that of non-Yellow River basin regions, whose influence coefficient is 19.72%. This indicates that within the Yellow River Basin, digital financial inclusion can significantly and reliably improve carbon productivity.
6 Conclusion
Based on panel data covering 1,677 counties in China from 2014 to 2022 to conduct empirical research using fixed effects, mediation, moderation, and quantile models, this paper in-depth studies how the digital financial inclusion affects carbon productivity. Through theoretical and empirical analysis, this paper finds the following conclusions: (1) digital financial inclusion has a significant impact on the improvement of county carbon productivity, with an influence coefficient as high as 19.44%. (2) Digital financial inclusion enhances county-level carbon productivity by promoting technological innovation and industrial structure upgrading. Its influence coefficients on patent invention publication and industrial upgrading index reach 7.63 and 77.32%, respectively. The positive moderating effects of traditional finance and urbanization further amplify this impact. Digital financial inclusion exerts a strong positive effect on carbon productivity at lower quantiles, but its influence diminishes at median quantiles and turns negative at higher quantiles. This pattern reflects diminishing marginal returns and tightening resource constraints as development approaches the technological frontier. (3) Only digitalization level and coverage breadth of digital financial inclusion have a significant positive impact on county carbon productivity, and the effect of digitalization level is almost twice that of coverage breadth. The influence coefficients of digital inclusive finance on carbon productivity in the Yangtze River Economic Belt and the Yellow River Basin are 21.72 and 27.82%, respectively, which are more significant than those in other places.
This paper puts forward the following policy recommendations. (1) Governments are focusing on developing low-carbon and clean energy industries by adjusting the industrial structure and increasing research, development, and application of clean energy and energy-saving technologies. (2) Considering regions with strong traditional financial systems, rapid urbanization, and high carbon productivity enjoy a clear ‘first-mover advantage,’ the attention of government should shift toward less-developed areas in these sectors. Through targeted industrial policies, strengthening digital infrastructure, and stimulating innovation, these places can gain a latecomer advantage in increasing carbon productivity. (3) Local governments must embed carbon productivity targets into regional development strategies by establishing a mandatory linkage mechanism. In the Yangtze River Economic Belt and Yellow River Basin, county plans should incorporate carbon productivity growth as a binding indicator. Such as if Counties achieve these targets will receive a 20% green re-loan quota increase via digital financial inclusion platforms, to incentive sustainable development.
The findings of this paper are also applicable to other developing countries in realizing double environmental and economic dividends through digital financial inclusion. This paper also has research deficiencies as shown below. (1) Limited by the availability of data, the county carbon emissions from 2018 to 2022 are estimated by linear interpolation method. This approach, which assumes a smooth trend in emissions, may underestimate short-term emissions surges due to policy shocks or capacity expansions, which in turn allow carbon productivity to be systematically amplified. (2) This paper does not consider potential issues such as outsourcing of carbon emissions to neighboring counties or time lags between investment and productivity changes. These problems may weaken the positive impact of digital financial inclusion on carbon productivity to some extent, and need to be further verified in future research. (3) Although this paper has not been included in spatial econometric analysis due to the unbalanced panel structure, more and more studies have shown that unbalanced data is not an impassable obstacle for spatial econometric. The latest literature has proposed a variety of solutions: Koster (2022) successfully maintained the validity of the spatial weight matrix in the study of county fiscal competition through the combination of missing value multiple imputation and maximum likelihood estimation (Koster and Koster, 2022); Chen et al. (2023) used the dynamic spatial Durbin model based on generalized estimation of moments to confirm that the spatial spillover coefficient was still robust even when the missing rate exceeded 20% (Chen et al., 2023). Future spatial models tailored to unbalanced panels will broaden the scope of research into the socio-economic impact of digital financial inclusion.
Data availability statement
Publicly available datasets were analyzed in this study. This data can be found at: the socio-economic data at the county level are obtained from the China County Statistical Yearbook (2014–2022) and the China Stock Market and Accounting Research Database (CSMAR). The data of digital finance comes from the Research Center of Digital Finance of Peking University (https://idf.pku.edu.cn/zsbz/515315.htm, accessed on 10 October 2023). Data supporting the findings of this study may be obtained upon reasonable request by email to the corresponding author.
Author contributions
ZL: Funding acquisition, Visualization, Resources, Writing – review & editing, Writing – original draft, Validation, Supervision. CZ: Writing – original draft, Writing – review & editing, Validation, Supervision. RL: Writing – original draft. LC: Writing – original draft. YZ: Writing – review & editing.
Funding
The author(s) declare that financial support was received for the research and/or publication of this article. This work was supported by the following projects: [1] Yan’an Key Science and Technology Funding Project (2024-CYL-041); [2] Shaanxi Young Science and Technology Star Fund Project (2025ZC-KJXX-82); [3] Key Points of Yan’an Federation of Social Sciences (2025-YASK-034).
Conflict of interest
ZL, RL, and YZ are employed by the company Yan’an Energy and Chemical Group Co., Ltd. CZ is employed by the company Shaanxi Binchang Mining Group Co., Ltd.
Generative AI statement
The author(s) declare that no Gen AI was used in the creation of this manuscript.
Any alternative text (alt text) provided alongside figures in this article has been generated by Frontiers with the support of artificial intelligence and reasonable efforts have been made to ensure accuracy, including review by the authors wherever possible. If you identify any issues, please contact us.
Publisher’s note
All claims expressed in this article are solely those of the authors and do not necessarily represent those of their affiliated organizations, or those of the publisher, the editors and the reviewers. Any product that may be evaluated in this article, or claim that may be made by its manufacturer, is not guaranteed or endorsed by the publisher.
References
Ahmad, M., and Satrovic, E. (2023). Relating fiscal decentralization and financial inclusion to environmental sustainability: criticality of natural resources. J. Environ. Manag. 325:116633. doi: 10.1016/j.jenvman.2022.116633
Aisaiti, G., Liu, L., Xie, J., and Yang, J. (2019). An empirical analysis of rural farmers’ financing intention of inclusive finance in China the moderating role of digital finance and social enterprise embeddedness. Ind. Manag. Data Syst. 119, 1535–1563. doi: 10.1108/IMDS-08-2018-0374
Angrist, J., Chernozhukov, V., and Fernández-Val, I. (2006). Quantile regression under misspecification, with an application to the U.S. wage structure. Econometrica 74, 539–563. doi: 10.1111/j.1468-0262.2006.00671.x
Ant Group ESG Report,. (2023). Ant Group Releases 2023 Sustainability Report. Available at: https://www.antgroup.com/en/esg/reportdetail?SustainabilityReport
Cao, J., Law, S. H., Wu, D., Tang, X., and Yang, X. (2022). Effect of digital financial inclusion on dredging the path of green growth—new evidence from front-end and back-end perspectives. Front. Environ. Sci. 10:865229. doi: 10.3389/fenvs.2022.865229
Cao, S., Nie, L., Sun, H., Sun, W., and Taghizadeh-Hesary, F. (2021). Digital finance, green technological innovation and energy-environmental performance: evidence from China’s regional economies. J. Clean. Prod. 327:129458. doi: 10.1016/j.jclepro.2021.129458
Chen, L., and Du, T. (2024). The impact of National Revitalization Plan for old Revolutionary Base areas on fixed asset investment. Rev. Ind. Econ. 1, 162–179. doi: 10.19313/j.cnki.cn10-1223/f.20241028.002
Chen, L., Du, T., Wu, D., and Lai, C. (2024a). Can digital financial inclusion promote the nighttime economy? - new evidence from Chinese counties’ nighttime lighting data and threshold model. Technol. Econ. Dev. Econ. 30, 1553–1571. doi: 10.3846/tede.2024.22245
Chen, J., Gao, M., Cheng, S., Hou, W., Song, M., Liu, X., et al. (2020). County-level CO2 emissions and sequestration in China during 1997–2017. Sci Data 7:391. doi: 10.1038/s41597-020-00736-3
Chen, G., Han, J., and Yuan, H. (2022). Urban digital economy development, enterprise innovation, and ESG performance in China. Front. Environ. Sci. 10. doi: 10.3389/fenvs.2022.955055
Chen, Y., Li, X., and Wang, Z. (2023). Handling unbalanced panels in dynamic spatial econometric models: evidence from China’s city-level carbon emissions. Energy Econ. 128:107056. doi: 10.1016/j.eneco.2023.107056
Chen, L., Liu, C., Li, Z., and Wu, D. (2024b). The impact of clean energy demonstration province policies on carbon intensity in Chinese counties based on the multi-phase PSM-DID method. Environ. Sci. Pollut. Res. 31, 12978–12994. doi: 10.1007/s11356-023-31799-5
Chen, Z., Shu, W., Guo, H., and Pan, C. (2021). The spatial characteristics of sustainable development for agricultural products E-commerce at county-level: based on the empirical analysis of China. Sustainability 13:6557. doi: 10.3390/su13126557
Chen, W., Wang, Q., and Zhou, H. (2022). Digital rural construction and farmers’ income growth: theoretical mechanism and micro experience based on data from China. Sustainability 14:11679. doi: 10.3390/su141811679
Cheng, Y., Lv, K., and Zhu, S. (2023). How does digital financial inclusion promote green total factor productivity in China? An empirical analysis from the perspectives of innovation and entrepreneurship. Process. Saf. Environ. Prot. 174, 403–413. doi: 10.1016/j.psep.2023.04.002
Cui, X., Lin, M., and Qiu, Y. (2023). Regional differences and dynamic evolution of urban land green use efficiency within the Yangtze River Economic Belt, China. Front. Environ. Sci. 10. doi: 10.3389/fenvs.2022.1098924
Daud, S. N. M., and Ahmad, A. H. (2023). Financial inclusion, economic growth and the role of digital technology. Financ. Res. Lett. 53:103602. doi: 10.1016/j.frl.2022.103602
Dauda, L., Long, X., Mensah, C. N., Salman, M., Boamah, K. B., Ampon-Wireko, S., et al. (2021). Innovation, trade openness and CO2 emissions in selected countries in Africa. J. Clean. Prod. 281:125143. doi: 10.1016/j.jclepro.2020.125143
Elvidge, C. D., Baugh, K. E., Kihn, E. A., Kroehl, H. W., Davis, E. R., and Davis, C. W. (1997). Relation between satellite observed visible-near infrared emissions, population, economic activity and electric power consumption. Int. J. Remote Sens. 18, 1373–1379. doi: 10.1080/014311697218485
Feng, S., Liu, J., and Xu, D. (2023). Digital financial development and indirect household carbon emissions: empirical evidence from China. Environ. Dev. Sustain. 26, 23401–23435. doi: 10.1007/s10668-023-03603-4
Feng, S., Zhang, R., and Li, G. (2022). Environmental decentralization, digital finance and green technology innovation. Struct. Chang. Econ. Dyn. 61, 70–83. doi: 10.1016/j.strueco.2022.02.008
Guo, Q., Wu, Z., Ding, C., Akbar, M. W., and Guo, T. (2023). An empirical analysis of the nexus between digital financial inclusion, industrial structure distortion, and China’s energy intensity. Environ. Sci. Pollut. Res. 30, 49397–49411. doi: 10.1007/s11356-023-25323-y
Hagiu, A., and Wright, J. (2015). Marketplace or reseller? Manag. Sci. 61, 184–203. doi: 10.1287/mnsc.2014.2042
He, S. (2025). The impact of climate risk on low-carbon innovation: evidence from listed companies in China. Front. Clim. 7. doi: 10.3389/fclim.2025.1646491
Huang, H., Mbanyele, W., Fan, S., and Zhao, X. (2022). Digital financial inclusion and energy-environment performance: what can learn from China. Struct. Chang. Econ. Dyn. 63, 342–366. doi: 10.1016/j.strueco.2022.10.007
Ilhan, O., and Sana, U. (2022). Does digital financial inclusion matter for economic growth and environmental sustainability in OBRI economies? An empirical analysis. Resour. Conserv. Recycl. 185:106489. doi: 10.1016/j.resconrec.2022.106489
Khera, P., Ng, S., Ogawa, S., and Sahay, R. (2022). Measuring digital financial inclusion in emerging market and developing economies: a new index. Asian Econ. Policy Rev. 17, 213–230. doi: 10.1111/aepr.12377
Koster, H. R. A., and Koster, S. (2022). Spatial econometrics with missing data: applications to fiscal competition. Reg. Sci. Urban Econ. 93:103741. doi: 10.1016/j.regsciurbeco.2021.103741
Kumar, R. R., Chakraborty, A., and Mandal, P. (2021). Promoting electric vehicle adoption: who should invest in charging infrastructure? Transportation Res. Part e-Logistics Transportation Rev. 149:102295. doi: 10.1016/j.tre.2021.102295
Lee, C., and Wang, F. (2022). How does digital inclusive finance affect carbon intensity? Econ. Anal. Policy 75, 174–190. doi: 10.1016/j.eap.2022.05.010
Li, G., Zhang, R., Feng, S., and Wang, Y. (2022). Digital finance and sustainable development: evidence from environmental inequality in China. Bus. Strateg. Environ. 31, 3574–3594. doi: 10.1002/bse.3105
Liu, C., Chen, L., Li, Z., and Wu, D. (2023). The impact of digital financial inclusion and urbanization on agricultural mechanization: evidence from counties of China. PLoS One 18:e0293910. doi: 10.1371/journal.pone.0293910
Liu, B., Chen, H., Zhang, Y., and Bai, S. (2024). The impact of digital finance on provincial carbon productivity: empirical evidence from China. SAGE Open 14:21582440241288013. doi: 10.1177/21582440241288013
Liu, T., Hu, M., Elahi, E., and Liu, X. (2022). Does digital finance affect the quality of economic growth? Analysis based on Chinese city data. Front. Environ. Sci. 10:951420. doi: 10.3389/fenvs.2022.951420
Liu, G., Huang, Y., and Huang, Z. (2021). Determinants and mechanisms of digital financial inclusion development: based on urban-rural differences. Agronomy 11:1833. doi: 10.3390/agronomy11091833
Lu, X., Guo, J., and Zhou, H. (2021). Digital financial inclusion development, investment diversification, and household extreme portfolio risk. Account. Finance 61, 6225–6261. doi: 10.1111/acfi.12863
Muhammad, S., Pan, Y., Agha, M. H., Umar, M., and Chen, S. (2022). Industrial structure, energy intensity and environmental efficiency across developed and developing economies: the intermediary role of primary, secondary and tertiary industry. Energy 247:123576. doi: 10.1016/j.energy.2022.123576
National Bureau of Statistics,. (2023). Available at: https://www.stats.gov.cn/sj/ndsj/2023/indexeh.htm
Qin, X., Wu, H., and Li, R. (2022). Digital finance and household carbon emissions in China. China Econ. Rev. 76:101872. doi: 10.1016/j.chieco.2022.101872
Razzaq, A., Qin, S., Zhou, Y., Mahmood, I., and Alnafissa, M. (2024). Determinants of financial inclusion gaps in Pakistan and implications for achieving SDGs. Sci. Rep. 14:13667. doi: 10.1038/s41598-024-63445-6
Ren, X., Zeng, G., and Gozgor, G. (2023). How does digital finance affect industrial structure upgrading? Evidence from Chinese prefecture-level cities. J. Environ. Manag. 330:117125. doi: 10.1016/j.jenvman.2022.117125
Shen, Y., Guo, X., and Zhang, X. (2023). Digital financial inclusion, land transfer, and agricultural green total factor productivity. Sustainability 15:6436. doi: 10.3390/su15086436
Sun, Y., Liu, J., and Li, Q. (2025). Spatiotemporal dynamics and driving mechanisms of total factor carbon productivity in China’s provincial transportation sector. Front. Clim. 7. doi: 10.3389/fclim.2025.1624297
Tian, X., Gong, J., and Zhai, Z. (2022). The effect of job displacement on labor market outcomes: evidence from the Chinese state-owned enterprise reform. China Econ. Rev. 72:101743. doi: 10.1016/j.chieco.2022.101743
Wang, X., and Wang, Q. (2021). Research on the impact of green finance on the upgrading of China’s regional industrial structure from the perspective of sustainable development. Res. Policy 74:102436. doi: 10.1016/j.resourpol.2021.102436
Wang, X., Wang, X., Ren, X., and Wen, F. (2022). Can digital financial inclusion affect CO2 emissions of China at the prefecture level? Evidence from a spatial econometric approach. Energy Econ. 109:105966. doi: 10.1016/j.eneco.2022.105966
Xie, Q., Ma, D., Raza, M. Y., Tang, S., and Bai, D. (2023). Toward carbon peaking and neutralization: the heterogeneous stochastic convergence of CO2 emissions and the role of digital inclusive finance. Energy Econ. 125:106841. doi: 10.1016/j.eneco.2023.106841
Xu, X., Wang, S., Qin, X., and Han, Y. (2024). Can the digital economy help reduce agricultural carbon emissions? An empirical test based on the moderated mediating effect model. Front. Sustain. Food Syst. 8:1454636. doi: 10.3389/fsufs.2024.1454636
Xu, T., Yang, G., and Chen, T. (2024). The role of green finance and digital inclusive finance in promoting economic sustainable development: a perspective from new quality productivity. J. Environ. Manag. 370:122892. doi: 10.1016/j.jenvman.2024.122892
Yang, J., Guo, X., and Zhang, X. (2024). Analysis of the effect of digital financial inclusion in promoting inclusive growth: mechanism and statistical verification. Economics 18. doi: 10.1515/econ-2022-0078
Zhang, M., and Liu, Y. (2022). Influence of digital finance and green technology innovation on China’s carbon emission efficiency: empirical analysis based on spatial metrology. Sci. Total Environ. 838:156463. doi: 10.1016/j.scitotenv.2022.156463
Zhang, K., Qian, J., Zhang, Z., and Fang, S. (2023). The impact of carbon trading pilot policy on carbon neutrality: empirical evidence from Chinese cities. Int. J. Environ. Res. Public Health 20:5. doi: 10.3390/ijerph20054537
Zhang, R., Wu, K., Cao, Y., and Sun, H. (2023). Digital inclusive finance and consumption-based embodied carbon emissions: a dual perspective of consumption and industry upgrading. J. Environ. Manag. 325:116632. doi: 10.1016/j.jenvman.2022.116632
Zhang, L., Zhao, Y., Liu, L., Sun, H., and Wang, Y. (2025). The spatial effects of green-innovation coupling and coordinated development from the perspective of digital inclusive finance: evidence from China. Technol. Forecast. Soc. Change 210:123884. doi: 10.1016/j.techfore.2024.123884
Zhou, L., Sun, J., Hu, W., and Zhang, Y. (2023). Asset smoothing and consumption smoothing: disaster-coping strategies in noncontiguous and contiguous destitute areas. China World Econ. 31, 223–250. doi: 10.1111/cwe.12475
Keywords: digital financial inclusion, carbon productivity, mediation effect, moderator effect, quantile regression
Citation: Lei Z, Zhang C, Li R, Cai L and Zhou Y (2025) How does digital financial inclusion improve Chinese county-level carbon productivity? Front. Clim. 7:1644628. doi: 10.3389/fclim.2025.1644628
Edited by:
Shunsuke Managi, Kyushu University, JapanReviewed by:
Amar Razzaq, Huanggang Normal University, ChinaMustafa Naimoglu, Bingöl University, Türkiye
Copyright © 2025 Lei, Zhang, Li, Cai and Zhou. This is an open-access article distributed under the terms of the Creative Commons Attribution License (CC BY). The use, distribution or reproduction in other forums is permitted, provided the original author(s) and the copyright owner(s) are credited and that the original publication in this journal is cited, in accordance with accepted academic practice. No use, distribution or reproduction is permitted which does not comply with these terms.
*Correspondence: Zhaoyuan Lei, NjQ1MTI5ODU1QHFxLmNvbQ==