 Derek Fucich
 Heather J. Lynch
 Cody Shaw
 Matthew D. Eisaman
 Mallory C. Ringham
- 1Department of Ecology and Evolution, Stony Brook University, Stony Brook, NY, United States
- 2Department of Chemistry, Stony Brook University, Stony Brook, NY, United States
- 3Department of Earth and Planetary Sciences, Yale University, New Haven, CT, United States
- 4Ebb Carbon, Inc., South San Francisco, CA, United States
- 5Department of Electrical and Computer Engineering, Stony Brook University, Stony Brook, NY, United States
Ocean alkalinity enhancement (OAE) presents a promising means to leverage the ocean carbon sink to mitigate the effects of anthropogenic climate change. We report on a series of mesocosm experiments simulating electrodialysis-based OAE through the addition of aqueous sodium hydroxide to seawater in large tanks (~6,000 L) and small aquaria (~10 L) at Flax Pond Marine Laboratory, NY. In previous studies, the confounding effects of biological processes were controlled by imposing a sterilization treatment to seawater throughout each experiment. Here, we take the first steps in characterizing the influence of biological processes on OAE-based CO2 uptake through comparisons between sterilized and unsterilized mesocosms and aquaria. We combine our results with those of similar Flax Pond mesocosm experiments and develop a model to identify the most influential variables for determining the rate and magnitude of CO2 uptake. We found that the rate of CO2 uptake varies with changes in initial carbonate chemistry, the amount of alkalinity added, whether the mesocosm was sterilized, and the season in which the seawater was collected. Our model suggests that sterilized tanks did not differ in the amount of CO2 sequestered, but experienced a slower rate of equilibration relative to unsterilized tanks. These results indicate that laboratory mesocosm experiments could reasonably represent CO2 uptake in the field even with the complication of biological processes over the timeline of air-sea CO2 equilibration. This finding is valuable in supporting the measurement, reporting and verification of OAE, which must rely on a combination of laboratory data, near-field measurements, and modeling exercises.
1 Introduction
On top of drastic reductions in CO2 emissions, removal and storage of atmospheric CO2 on the order of 100–1,000 Gt over the 21st century is necessary to limit global warming below 2 °C (Rogelj et al., 2018; Kikstra et al., 2022; Intergovernmental Panel on Climate Change, 2023). One way that carbon removal and storage can be effectuated is by using the ocean as a carbon sink in a process known as marine carbon dioxide removal (mCDR). There are multiple strategies to realize mCDR including Ocean Alkalinity Enhancement (OAE). OAE increases alkalinity in the surface ocean, altering the speciation of dissolved inorganic carbon in seawater to result in a disequilibrium in pCO2 across the air-sea boundary. This will enhance uptake of atmospheric CO2 into the ocean, or decreased degassing of dissolved CO2 into the atmosphere, resulting in durable carbon storage in the form of stable bicarbonate and carbonate ions in seawater (Renforth and Henderson, 2017).
Multiple alkaline feedstocks have been proposed for OAE, including mined minerals, industrial products, and aqueous solutions (Eisaman et al., 2023; Oschlies et al., 2023). One electrochemical OAE method converts seawater or brine into acid and base streams through bipolar membrane electrodialysis, removing the acid from the system and returning an alkalinity-enhanced seawater stream to the surface ocean. The chemistry in this pathway is analogous to the addition of NaOH to seawater, which has been studied in multiple laboratory (Bach et al., 2024; Ferderer et al., 2024; Hartmann et al., 2023; Iglesias-Rodríguez et al., 2023; Ringham et al., 2024) as well as a few field (Albright et al., 2016; Savoie et al., 2025) OAE studies. Under typical ocean conditions, OAE results in an increase of 0.7–0.9 moles of DIC per mole of alkalinity added to seawater in the form of NaOH (He and Tyka, 2023; Wang et al., 2023; Ringham et al., 2024; Khangaonkar et al., 2024).
Due to the need for industrial infrastructure, the primary delivery method for electrochemical OAE is dispersal of the alkalinity-enhanced seawater stream through a coastal outfall. Coastal outfalls are typically designed to mitigate the release of wastewater and/or pollutants into the natural environment, with the goal of rapid dilution to achieve water quality standards. The impact of electrochemical OAE on receiving water will vary depending on project design and scale. In general, elevated pH and alkalinity will be measurable in the near-field and near-term of alkalinity-enhanced seawater discharge, but dilution will rapidly limit the detection of these signals relative to background variation of carbonate chemistry in dynamic coastal environments. Because seawater carbonate chemistry is altered by both dilution and air-sea gas equilibration, the ability to measure air-sea gas exchange resulting from OAE in the field is limited. The majority of CO2 removal and storage occurs over the timeline of air-sea equilibration (i.e. weeks to years) in the broader oceanographic region. Measurement, reporting, and verification (MRV) of carbon dioxide removal (CDR) for OAE must then rely on direct measurement of the rate and concentration of the alkalinity-enhanced seawater released to the surface ocean, direct measurement of water quality parameters in the immediate vicinity of the outfall, and ocean modeling to quantify carbon removal and storage (Fennel et al., 2023; Ho et al., 2023; Ringham et al., 2024; Khangaonkar et al., 2024; Halloran et al., 2025). Laboratory experiments can supplement this work and provide an important body of knowledge in advance of field trials. The controlled environment of a lab setting allows us to capture processes that are not currently measurable in small field trials due to low signal-to-noise and, by improving our ability to evaluate the safety and efficacy of OAE approaches, they will be critical to the development of operational guidelines for MRV.
This study was based on the experimental design described by Ringham et al. (2024) and includes a continuation of experiments performed at the Flax Pond Marine Laboratory at Stony Brook University (New York, USA). This study aimed to quantify CDR in a setting where the residence time of alkalinity-enhanced seawater is controlled and CO2 equilibration can be measured. Ringham et al. (2024) reported multiple laboratory mesocosm OAE experiments in which carbon dioxide uptake was analyzed via pH sensors and routine seawater DIC and TA sampling over weeks to months to measure CO2 equilibration in a way that is challenging to capture in the field. The experiments described in Ringham et al. (2024) were conducted in 6,000 L mesocosms and 15 L aquaria in which total alkalinity (TA) was raised between 187 and 3,829 μmol/kg and pHT was raised between 0.3 and 2.3 units from ambient conditions through the addition of 0.5 M NaOH, simulating alkalinity produced by electrochemical methods. An increase of 0.7–0.9 mol DIC per mol added NaOH was observed over the course of each experiment, in agreement with theoretical expectations and modeling studies (He and Tyka, 2023; Oschlies et al., 2023).
Ringham et al. (2024) limited biological activity during their experiments to focus on physical and chemical dynamics. To do so, they filtered seawater through 0.5 μm sock filters, treated it with 40 ppm bleach (sodium hypochlorite), then circulated the seawater through UV light arrays to break down the bleach over 1–2 weeks. Seawater was continually pumped through the UV arrays over the course of the experiments, reducing biological growth and, in theory, isolating the increase in DIC following an alkalinity addition to air-sea gas exchange. However, over the course of these multi-week experiments, biological growth occurred despite the initial bleach and UV sterilization, ranging from algae resembling the order Cladophorales (Hanyuda et al., 2002) and bacterial films resembling the class Cyanophyceae (Skulberg et al., 1993), typically concentrated on the walls of each mesocosm. This biological growth raised the question: if this study was extrapolated to the field, would the presence of natural biological communities measurably impact the rate, timescale, and magnitude of atmospheric CO2 removal and storage?
Here, we report on a series of experiments to understand the impact of biological processes on the dynamics of ocean alkalinity enhancement. We tested the relative sensitivity of carbon uptake in ex-situ laboratory experiments to address the following questions: (1) What is the rate, timescale, and magnitude of atmospheric CO2 removal and storage in seawater in response to a given alkalinity perturbation?; (2) Is the rate of carbon uptake measurably impacted by the presence or absence of biology under controlled laboratory settings?; and (3) What are the minimum viable measurements required to extrapolate or predict the amount of carbon dioxide removal following the addition of alkalinity to seawater? Addressing these questions will enable us to better understand how well controlled OAE studies in the laboratory may represent field conditions, improving estimates for theoretical CO2 uptake resulting from an OAE deployment.
2 Methods
The general design of these laboratory experiments continued from Ringham et al. (2024), with alterations in the source and initial treatment of seawater and in monitoring methods, as described in the following sections. As in the previous study, experiments were conducted in two 6,000 L mesocosms, supplemented with a series of smaller (10 L) aquarium scale. Carbonate chemistry was measured by oceanographic sensors in the mesocosms and by discrete samples at both scales.
2.1 Mesocosm experiments
All experiments were conducted at Flax Pond Marine Laboratory at Stony Brook University, NY, USA between August 2023 and August 2024 within the same mesocosm setup used in Ringham et al. (2024). Where the previous study used natural seawater pumped during high tides from the edge of Flax Pond, part of a 0.5 km2 salt marsh tidal wetland connected to Long Island Sound, this study used an updated pumping system installed near the mouth of Flax Pond where there is greater exchange of seawater with the Sound. This system automatically pumps near-surface (<10 m depth) seawater across a range of tidal conditions through an in-line sand filter to maintain a large outdoor reservoir tank. On average, 6,185 L was then pumped into each of two large indoor mesocosms (2.4 m diameter, 1.5 m height, filled to ~1.35 m). The dimensions of these mesocosms were chosen to allow volume for a range of oceanographic sensors and frequent bottle sampling, a significant air-sea boundary, and limited surface area interactions along the walls relative to smaller experimental setups. While we were able to control factors such as temperature and initial carbonate chemistry and biology, there remain several key differences between laboratory and field conditions such as the rate of mixing, the air-sea interaction, light levels, atmospheric CO2 levels, and the composition and abundance of biological communities.
We conducted three sets of mesocosm experiments with multiple replicates per set:
(1) Biological growth was controlled in one mesocosm [following Ringham et al. (2024) and described below] and uncontrolled in the other. Enough NaOH was added to each mesocosm to raise the seawater pH from ambient conditions (range 7.87–7.96) to a target pHT of 8.5. (3 replicate experiments).
(2) Biological growth was controlled in one mesocosm and uncontrolled in the other. Enough NaOH was added to each mesocosm to raise the seawater pH from ambient conditions (range 7.88–7.96) to a target pHT of 9.2. (three replicate experiments).
(3) Neither mesocosm was controlled for biological growth. Enough NaOH was added to only one mesocosm to raise the seawater pH from ambient conditions (range 7.85–7.93) to a target pHT of 9.5. (two replicate experiments).
To control biological growth in these mesocosms, seawater was treated with 40 ppm bleach (sodium hypochlorite). The bleached seawater was circulated for 1 day, then pumped through UV light arrays for 1–2 weeks to break down the chlorine. Bleach breakdown was assessed with a Hach test for free chlorine. The seawater was then continually pumped (via Current eFlux DC Flow Pump, 210 GPH; overturning time of 1 day) through the UV light arrays for the remainder of each experiment to reduce biological growth. For experiments in which biology was not controlled, seawater was not bleached and was pumped through the same arrays without UV treatment.
During all experiments, a second pump (Kedsum Submersible Pump, 260 GPH) was suspended at an angle halfway down each the wall of each mesocosm to promote subsurface seawater circulation to homogenize biological growth. Seawater and air temperature and atmospheric CO2 of the mesocosm were moderated by the laboratory's HVAC system, with some variation throughout days and seasons depending on other uses of the lab space. To limit impacts of variable HVAC conditions on air-sea equilibration, forced air movement was added across the surface of each mesocosm using a stationary fan with a wind speed of ~5 km h–1. AcuRite Iris weather stations were mounted on the side of each mesocosm to monitor air temperature (±2 °C) and air speed (±0.8 m s–1). Air was bubbled into the bottom of each mesocosm at a rate of ~30 L min–1 with an estimated surface area of ~0.3 m2 to increase the rate of CO2 equilibration.
Seawater and carbonate chemistry data were collected after the bleaching period for several days prior to the start of each experiment (i.e. the addition of alkalinity to seawater) via oceanographic sensors and discrete sampling, as described in Section 2.2. After we achieved a stable characterization of the initial pH for each mesocosm, alkalinity was added by pumping (at a rate of ~50 ml min–1) a designated amount of 0.5 M aqueous NaOH to raise the bulk seawater pH to the target pH, based on an extrapolation from initial conditions using CO2SYS (Pierrot et al., 2006; Van Heuven et al., 2011), within the first mesocosm in each set of experiments. The same volume of NaOH was then added to the second mesocosm. For the final set of experiments, where NaOH was only added to one mesocosm, the same volume of DI water was added to the control tank in place of the NaOH addition. NaOH was added directly over the air bubble outflow to speed the mixing of NaOH into the bulk tank, increase dilution from the point source, and limit the immediate precipitation of Mg(OH)2 upon contact of the NaOH with seawater.
The pH target (and amount of alkalinity added) was chosen to: (1) allow for comparison with results from Ringham et al. (2024); (2) to represent simulated conditions in the near-field of proposed in situ alkalinity releases (Khangaonkar et al., 2024); and (3) to remain below conditions in which secondary carbonate precipitation is likely to occur (in these conditions, expected at pHT > 10.0 when aragonite saturation state (Ωaragonite) > 30.0 (Ringham et al., 2024).
After the alkalinity addition, seawater carbonate chemistry was monitored as the mesocosms were left to equilibrate with the atmosphere (Section 2.2). The experiments were concluded when the observed pH or DIC (calculated from pH and TA measurements) appeared to stabilize (e.g., ΔpHT ±0.02) over several days.
2.2 Seawater analysis
Oceanographic sensors were placed halfway up the wall of the mesocosm near the inlet of the UV circulation pump, including: (1) Sea-Bird 38 Digital Oceanographic Thermometer and Sea-Bird 45 MicroTSG Thermosalinograph; (2) PME miniDOT dissolved oxygen logger (10 min resolution); and (3) SAMI-pH (daily resolution at manufacturer-specified accuracy and precision ~0.003 and 0.001, respectively). While miniDOT and SAMI-pH data were available for all experiments, external damage occurred to the Sea-Bird Thermometer and Thermosalinograph halfway through this study, such that seawater temperature and salinity data were continuously recorded for the first four experiments reported herein, after which we used miniDOT and/or SAMI-pH data for seawater temperature and a handheld refractometer for salinity. SAMI-pH data were corrected with in-situ salinity as recorded by either the Sea-Bird Thermosalinograph or infrequent refractometer measurements. SAMI-pH data were intermittently corrected to calculations of pH from DIC/TA samples; between Ringham et al. (2024) and this study, the differences between SAMI-pH and bottle sample data were small, typically <0.005 unit. We note that the spectrophotometric measurement of pH by the SAMI-pH sensors is appropriate to a pHT range of 7.0–9.0; however, we found good agreement between sensor data and samples within 7.0–9.2 as studied in these and previous experiments.
Discrete samples were collected throughout these experiments. Bottle samples of 500 ml of seawater were collected from each mesocosm before and immediately after the addition of alkalinity, and typically at the end of each experiment, following best practices laid out by Dickson et al. (2007). These samples were analyzed at NOAA Pacific Marine Environmental Laboratory (PMEL) for DIC via a coulometer (UIC Inc.) and single-operator multiparameter metabolic analyzer (SOMMA) (Johnson et al., 1985), and for TA via an open-cell acidimetric titration (Dickson et al., 2007). The overall uncertainty for both DIC and TA, assessed in comparison to Dickson CRMs, was typically ±2 μmol kg−1. Discrete samples were also collected for more frequent analysis of TA via open-cell potentiometric titration at Stony Brook University following the methods of Ringham et al. (2024) with estimated uncertainties of ±5– 10 μmol kg−1.
Seawater carbonate chemistry measurements were used to analyze the rate and magnitude of CO2 uptake in each mesocosm. Because NOAA PMEL DIC and TA analyses were infrequent, we typically relied on interpolated SAMI-pH and Stony Brook TA measurements, with spot checks against other discrete analyses where possible. We normalized TA data to the salinity at the beginning of each experiment to account for the slow increase in TA due to evaporation (Friis et al., 2003). Carbonate chemistry calculations were performed using CO2SYS (Lewis et al., 1998) or seacarb using carbonate constants from Lueker et al. (2000), KSO4 from Dickson (1990), and total boron from Lee et al. (2010). An in-depth comparison of seacarb and CO2SYS shows that discrepancies in calculations are negligible when using equilibrium constants according to established best practices as done here (Orr et al., 2015).
CO2SYS and seacarb are based on the chemical equilibrium of CO2 in seawater, and while there are chemical solvers that are used to simulate CO2 mineralization and kinetics (e.g., PHREEQC, OLI Software), it can be challenging to extrapolate an alkalinity addition to a final change in DIC to an accuracy beyond that of the theoretical 0.7–0.9 mol CO2/mol NaOH range based on thermodynamic modeling and stoichiometry (Burt et al., 2021; Schulz et al., 2023; Wang et al., 2023; Ringham et al., 2024). Experimental data are complicated by both biological and physical factors, and assessment of the initial seawater condition is not always straightforward, given that coastal seawater pumped into warm laboratories may not fully equilibrate with the atmospheric CO2 in advance of alkalinity addition experiments. The calculation of the final carbon uptake resulting from OAE in the field is currently based on regional oceanographic modeling comparing simulations with and without alkalinity additions (Fennel et al., 2023; Wang et al., 2023; Khangaonkar et al., 2024). Because this topic is so important in OAE MRV, we were interested in determining whether we had enough information to model realistic final DIC values, based on the experimental data collected in these controlled mesocosm experiments, such that more precise estimates of near-field mol CO2/mol NaOH could be estimated on a context-dependent basis. To statistically evaluate the influence of initial mesocosm conditions and experimental manipulations on carbon uptake, as well as attempt to deliver more robust predictions of CO2 uptake, the data from the eight experiments discussed here were combined with 5 experiments from Ringham et al. (2024), resulting in a final sample size of 19 mesocosms across 13 experiments. We excluded control mesocosm data without the addition of NaOH as well as two full experiments from the Ringham et al. (2024) set: one experiment that resulted in runaway carbonate precipitation and another that had insufficient data. Based on the data collected above, we modeled dissolved inorganic carbon over time (mmol kg−1) as an exponential curve of the form:
where t indicates the number of days since the initial alkalinity addition. All model fitting and evaluation were performed in R (R Core Team, 2024). Once model fits were obtained, they were used to calculate instantaneous rates of change of DIC over the duration of the experiment along with 95% prediction intervals using the flexFitR package (Aparicio and Endelman, 2025). Following parameter extraction, a multivariate linear model was fit to the data to predict the parameters a, b, and c from the seawater conditions (water temperature, salinity, pHT, interpolated TA, DIC), experimental treatments (alkalinity added, sterilization, wind, bubbles), and Flax Pond phenology (summer, fall, winter, spring). A model was fit for each permutation of possible predictors and leave one out cross validation (LOOCV) was performed (see Shao and Er, 2016 for a description of the LOOCV procedure). The parameter permutation resulting in the lowest relative root mean squared error (RMSE) was selected as the final model to predict all three parameters. For the final model, the influence of dependent variables was assessed using Wilk's lambda as well as univariate t tests for continuous variables and F tests for categorical variables. Benjamini-Hochberg corrections were applied to univariate tests to account for increases in type 1 error rate (Benjamini and Hochberg, 1995). As simultaneous prediction intervals for multivariate linear models appear inflated due to the correlation between variables, we also evaluate the uncertainty of the model by drawing predictor coefficients of the final model from their multivariate distribution. With these new parameter draws, a new shape of the DIC equilibrium curve was calculated. This process was repeated many times to determine the sensitivity of the estimated equilibration curve to the uncertainty of all predictor coefficients.
We compared our results to two alternative methods of predicting carbonate chemistry dynamics following perturbation. The first makes use of the theoretical molar uptake ratio, i.e., simply multiplying the amount of alkalinity added to seawater by 0.8 mol DIC per mol NaOH, as theorized by He and Tyka (2023) and calculated by Ringham et al. (2024). We also compared our model to estimates calculated through the R package seacarb (Gattuso et al., 2010). Given initial seawater conditions, seacarb's pH function predicts final seawater conditions factoring in both the equilibrium kinetics of the seawater itself as well as gas exchange with the ambient atmosphere. Unlike the linear model we constructed, both of these methods only predict final DIC values rather than the rate of equilibration. Thus, we only compare final DIC estimates at equilibrium conditions among all three models.
2.3 Aquaria experiments
We conducted additional OAE experiments in January–February 2025 at aquaria scale (12 L polycarbonate aquaria filled to a volume of 10 L seawater). Aquaria were filled in four pairs with seawater consisting of one aquaria each of:
(1) Seawater collected from a reservoir of Flax Pond seawater that is filtered (0.45 μm) and continually overturned UV light arrays to limit biological growth. Reservoir water was pumped through a 0.2 μm groundwater filter to limit residual microbiology.
(2) Seawater collected directly from the edge of Flax Pond, filtered through cheesecloth to remove macroscopic debris, then allowed to equilibrate to ambient temperatures for 12 h within the laboratory.
The use of aquaria at smaller scale allowed for better control over biological growth than in the mesocosms. Seawater salinity was monitored via handheld refractometer, and water temperature and pHNBS was collected daily via Thermo Scientific Orion ROSS Ultra pH/ATC Triode combination electrode (8157BNUMD) calibrated using three buffer solutions (pHNBS 4.01, 7, and 10.01). Seawater TA was analyzed via open cell potentiometric titration following the mesocosm procedure.
After the initial carbonate chemistry analysis, we added 4 ml of 0.5 M NaOH to each aquarium using a pipette, a volume that was chosen for comparison with an aquaria experiment run in Ringham et al. (2024). The seawater was stirred during the alkalinity addition to limit Mg(OH)2 precipitation/ dissolution and to ensure a homogeneous solution. The aquaria were monitored for temperature and pH and stirred manually daily to promote homogeneity and equilibration. TA was analyzed within 3 h of NaOH addition, at the midpoint, and at the end of each experiment, which lasted 15–23 days until pH was stable within ΔpH±0.01. TA data was then interpolated linearly to the same temporal resolution as the pH and temperature data. Carbonate chemistry calculations were performed using the R package seacarb, using the empirical pH and interpolated TA data and carbonate constants from Lueker et al. (2000), KSO4 from Dickson (1990), and total boron from Lee et al. (2010). Following the completion of all experiments, the rate and amount of carbon uptake was characterized by fitting Equation 1 to the DIC calculated for each aquarium. Finally, we attempted to predict the shape of the fit DIC curve from the initial conditions of each aquarium using the same model selected from our mesocosm analyses to test whether our nonlinear model preserves its accuracy at smaller scales.
3 Results
3.1 Mesocosm experiments
Sensor and sample data across the eight mesocosm experiments are summarized in Table 1. These experiments lasted between 20 and 39 days each, and it is important to note that the initial seawater chemical and biological conditions varied over seasons as the experiments were conducted between August 14, 2023 and August 6, 2024.
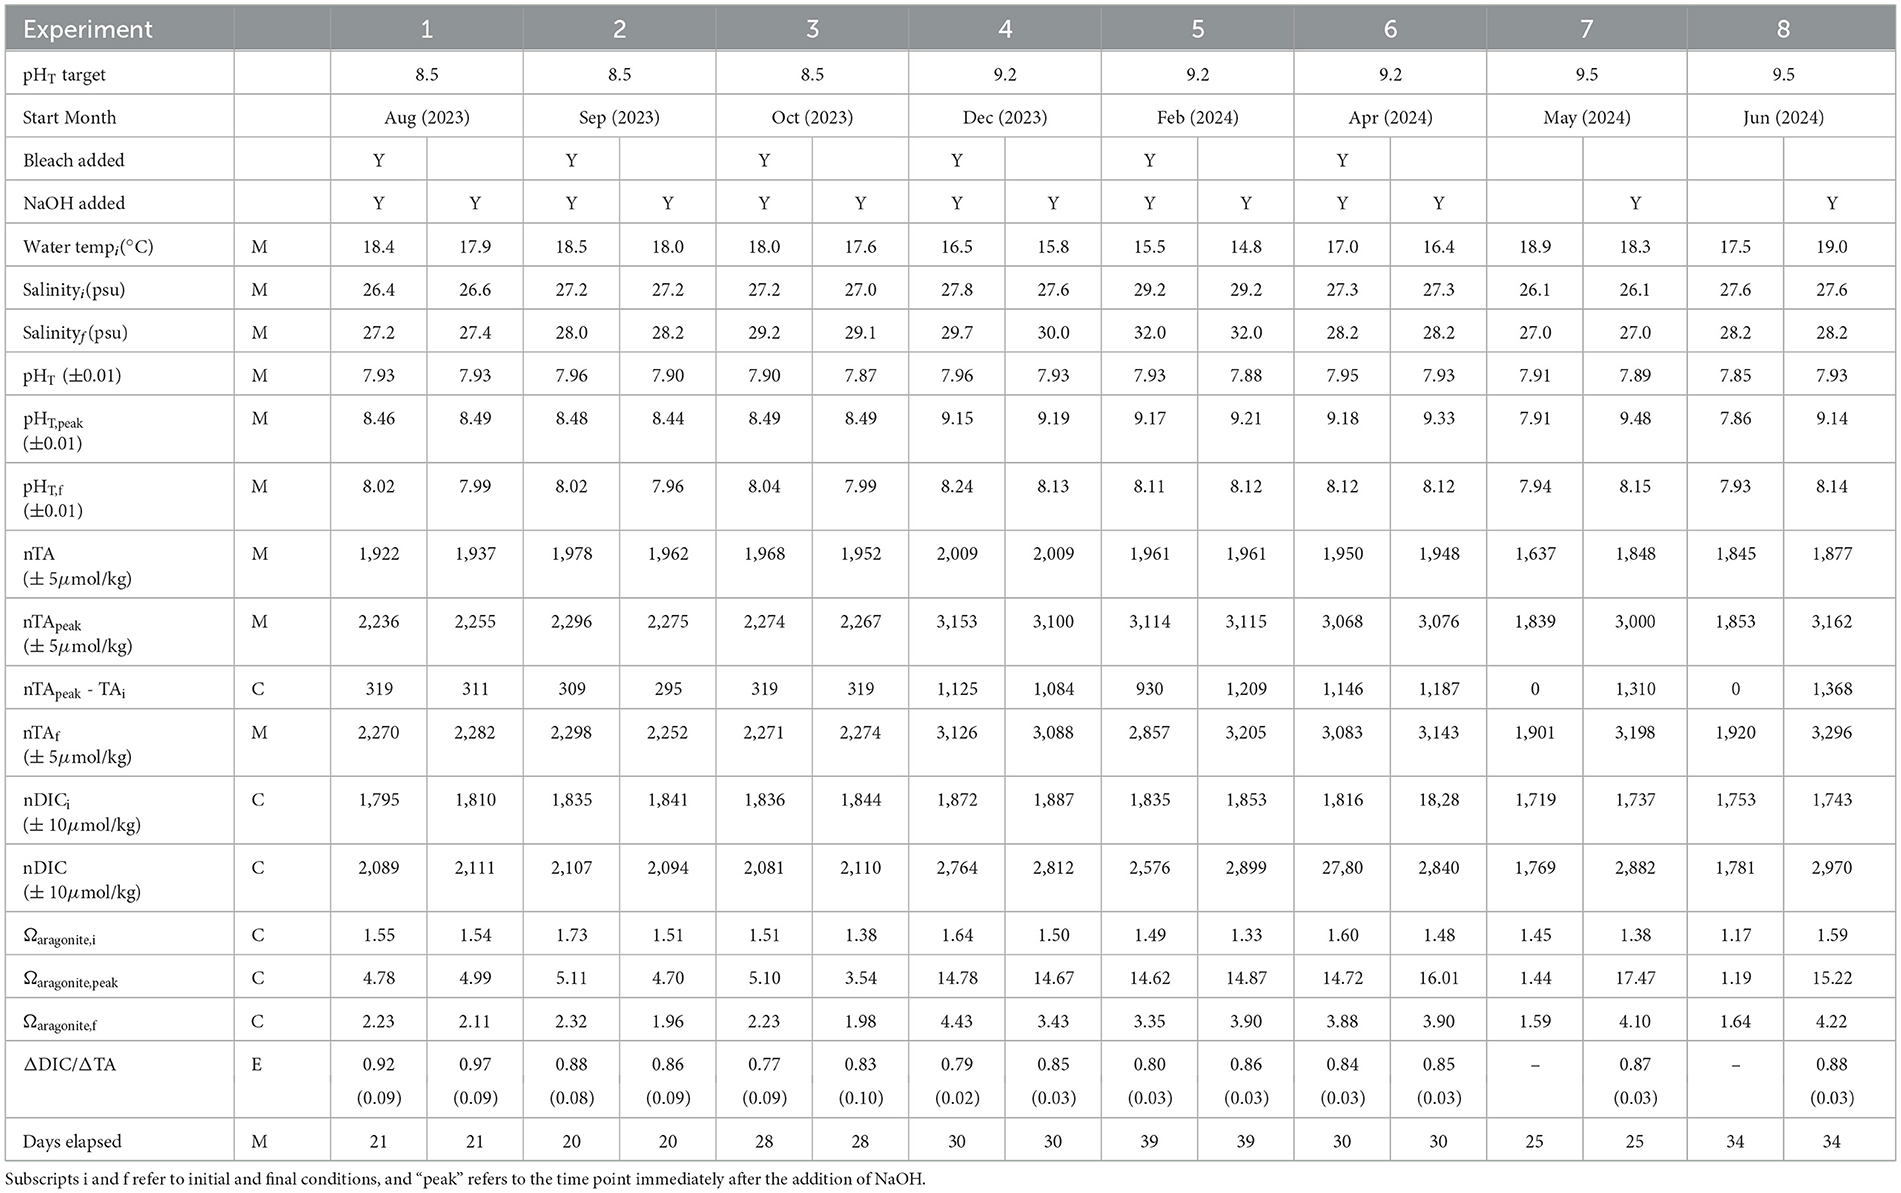
Table 1. Range of variables measured, calculated, or extrapolated in mesocosm experiments, where M denotes direct measurement, C denotes calculation via CO2SYS, and E denotes extrapolation to equilibrium conditions.
Because these experiments took place across a full year, there was some variation in initial conditions: initial pHT varied from 7.87–7.96, initial TA varied from 1,837–2,009 μmol kg−1, and DIC varied from 1,719 to 1,887 μmol kg−1. Because the mesocosms were initially treated differentially (i.e., in biological control), there was some variation between tanks in initial pH, TA, and DIC. To simplify comparison between mesocosms, approximately the same volume of NaOH was added to each mesocosm, which typically resulted in similar ΔTA (as calculated between the TA measured before and after NaOH addition) and pH. However, we note that there is some variation in these values between mesocosms due to (1) measurement error in pumping NaOH into each mesocosm and (2) uncertainty in the TA measurements.
Salinity increased due to evaporation over the course of these experiments (lasting 20–39 days), and we compensated by normalizing TA and DIC (nTA and nDIC respectively). After the initial increase in nTA following NaOH addition, nTA remained fairly stable throughout all experiments. There was no evidence for precipitation of calcium carbonate minerals, as might be indicated through the visual presence of suspended particulates or decreasing nTA. pH and aragonite saturation state both increased stepwise according to the alkalinity addition, and then exponentially decayed toward their final equilibrium. nDIC slowly increased to its new equilibrium value as CO2 was taken up by seawater. Mixing, forced air flow, and air bubbling ensured that the chemistry of the system reached equilibrium before the termination of the experiment, as determined by the stabilization of measured pH and calculated nDIC. There were no clear trends in pH, nTA, nDIC, or aragonite saturation state during the two control experiments without the addition of alkalinity. Finally, we note that biology was present in both sterilized and non-sterilized mesocosms by the end of each weeks-long experiment. Unidentified biofilms were observed primarily along the walls of the tanks, on instruments, and on plumbing within the tanks.
An example of one set of time-series measurements for experiment 2 is included in Figure 1, for a case in which NaOH was added into both mesocosms to reach a target pHT of 8.5, where one mesocosm was controlled for biological growth and the other was not. Time-series plots for the other experiments are available in the Supplementary material. There were some apparent differences between the two mesocosms in this experiment: water temperature was offset between the two mesocosms (~0.5 °C), likely due to HVAC differences and proximity of the mesocosms in reference to exterior laboratory doors. There was a difference in TA of approximately 16 μmol/kg throughout the experiment, which is likely due to a difference in seawater volume as the mesocosms were filled. After NaOH was added to each mesocosm, we observed a more rapid decrease in pH and increase in pCO2 and DIC within the mesocosm in which biology was not controlled through bleach and UV sterilization. While DIC plateaued at similar values between the two mesocosms, there was some variation between the final pH and pCO2 of each mesocosm. This trend occurred during several, but not all replicates of these experiments (Figure 2, Supplementary material).
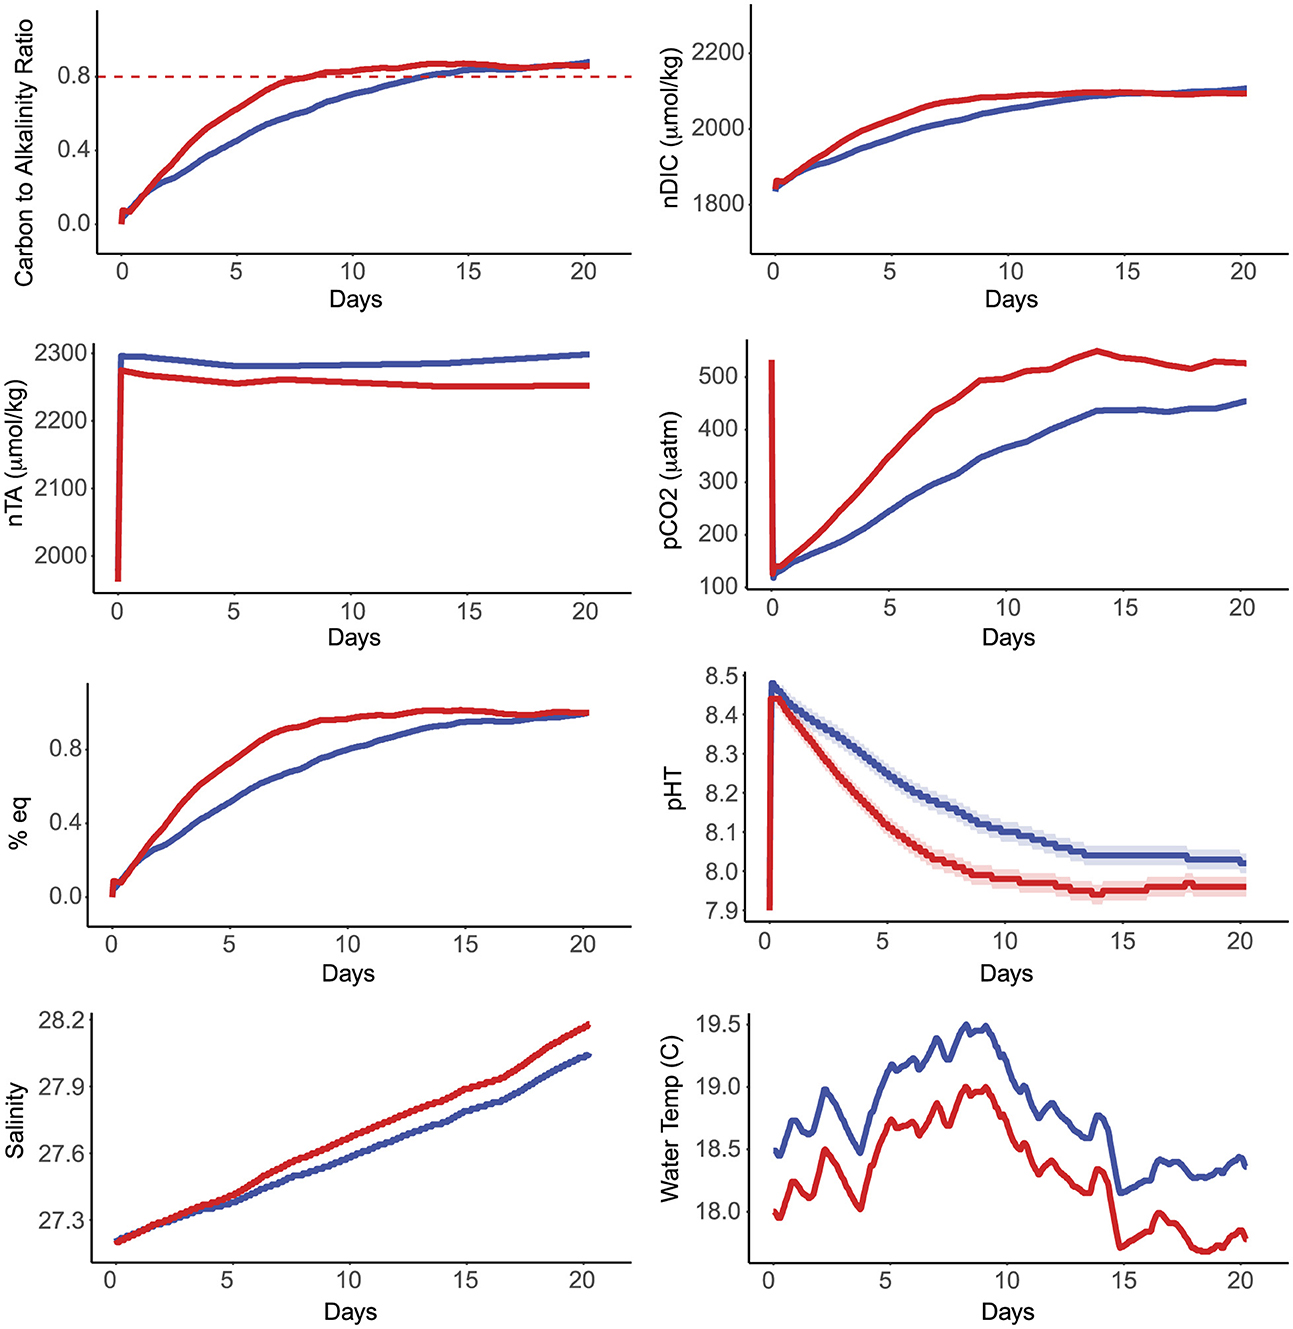
Figure 1. A series of six graphs display various oceanographic measurements over 22 days. The top left graph shows the carbon to alkalinity ratio rising towards 0.8. The top right graph indicates an increase in normalized dissolved inorganic carbon (nDIC). The middle left graph shows a stable normalized total alkalinity (nTA). The middle right graph presents rising partial pressure of carbon dioxide (pCO2). The bottom left graph displays a gradual increase in salinity. The bottom right graph shows fluctuating water temperature. Red and blue lines represent different data sets in each graph. Time-series data for experiment 2 in which NaOH was added to both mesocosms. The blue line indicates data from the mesocosm in which seawater was bleached and continually circulated through a UV array throughout the duration of the experiment. The red line indicates data from the mesocosm lacking sterilization treatments. pHT data was interpolated from SAMI-pH data and nTA wasinterpolated from bottle samples. pCO2 and nDIC were calculated from pH and TA data.
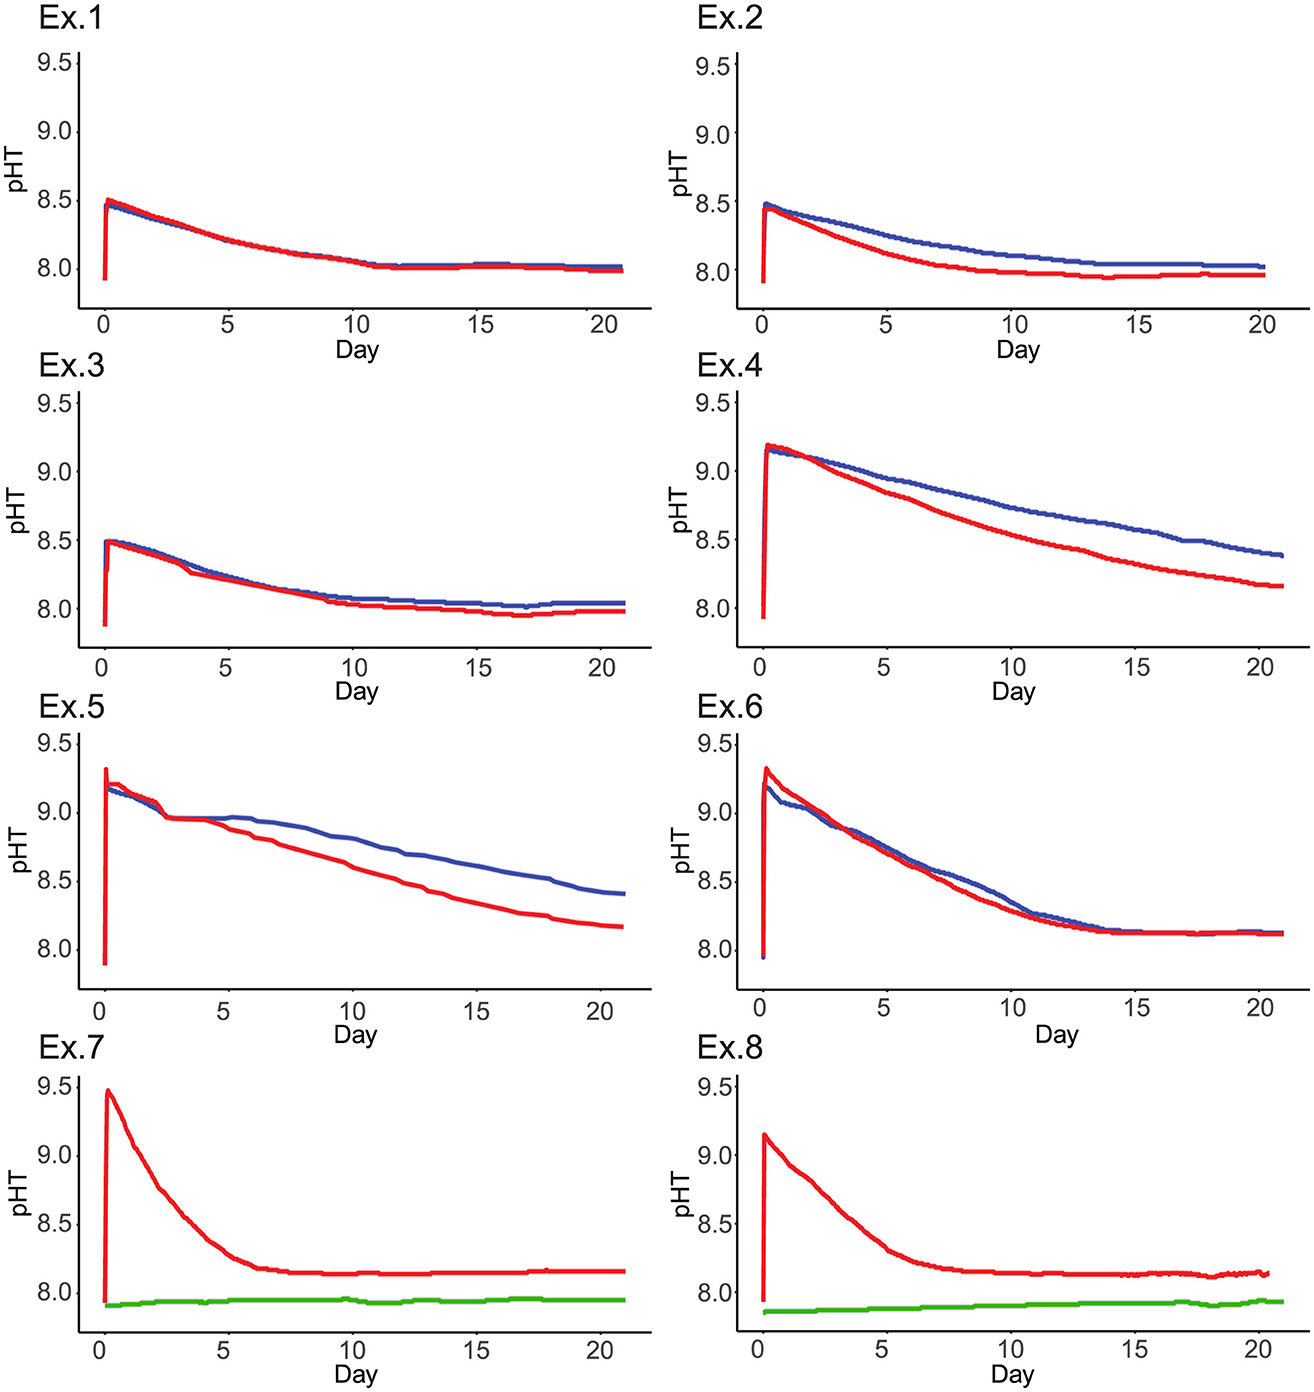
Figure 2. Eight graphs labeled Ex.1 to Ex.8 show pH over 20 days. Most graphs depict red and blue lines starting around pH 9, declining, and stabilizing after day 10. Ex.7 and Ex.8 include a constant green line at a lower pH. All graphs follow a similar pattern with slight variations in line behavior. Time series of pH over time within three replicates each of an experiment in which enough NaOH was added to both mesocosms to raise pHT to a target of 8.5 (experiments 1, 2, and 3) and 9.2 (experiments 4 through 6). Within each panel, the blue line indicates mesocosms in which seawater was bleached and UV sterilized, and the red line indicates a lack of sterilization treatments. Two replicates each of an experiment are also shown where NaOH was added to only one mesocosm to raise pHT to a target of 9.2, while the other (green) did not receive any alkalinity addition (experiments 7 and 8). Neither tank in experiment 7 or 8 received sterilization treatments.
Across the experiments in which NaOH was added to both mesocosms, we noted a trend in which pH more rapidly declined in the mesocosm in which biology was uncontrolled than in the sterilized mesocosm (Figure 2). This trend did not appear in all replicates, and typically falls just outside of the range of uncertainty for pH sensing.
Another example of time-series measurements for experiment 7 is included in Figure 3, where neither mesocosm was sterilized and base was only added to one tank to reach a target pH of 9.2. In both experiments of this type, temperature differences were less consistent compared to other mesocosm experiments.
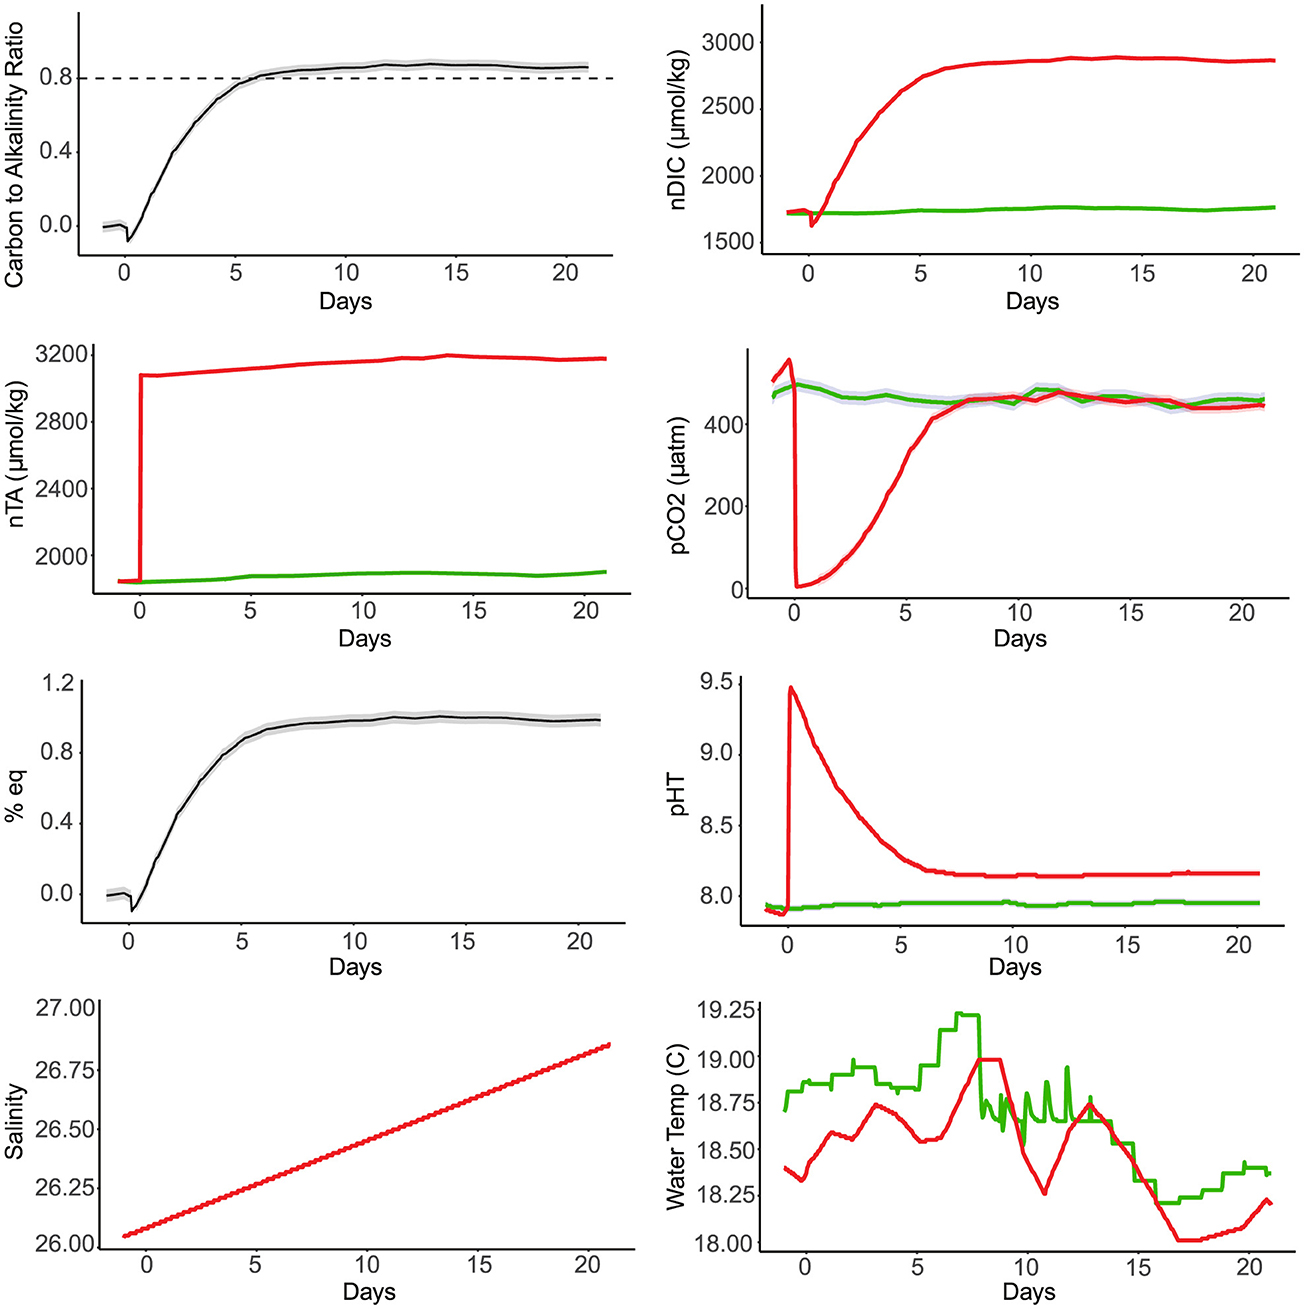
Figure 3. Six graphs depict various marine chemistry parameters over 23 days. Top left shows carbon-to-alkalinity ratio stabilizing around 0.8. Top middle shows red and green lines for nDIC, with red increasing sharply to over 3000. Top right shows pCO2 surging then stabilizing around 400. Middle left shows % eq leveling at 1.2. Middle right shows pHT decreasing sharply then stabilizing. Bottom left shows salinity steadily increasing from 26.0 to 27.0. Bottom right shows fluctuating water temperature, red and green lines overlap between 18.0-19.5°C. Time-series data for experiment 7 in which NaOH was added to one mesocosm, while neither was sterilized. The green line indicates data from the mesocosm in which seawater was not dosed with NaOH. The red line indicates data from the mesocosm dosed with enough NaOH to meet a target pH of 9.2 on day 0. pHT data was interpolated from SAMI-pH data and nTA was interpolated from bottle samples. pCO2 and nDIC were calculated from pH and TA data.
3.2 Aquaria
Aquaria experiments were conducted over a shorter period of time (January 15, 2025–March 7th, 2025), resulting in more consistent initial conditions among replicates (pH: 7.87–8.05, TA: 2016–2066 μmol kg−1). The timeline of aquaria experiments constrains the stochastic changes to Flax Pond's carbonate chemistry over the course of years or seasons. The range of experimental data collected across these experiments is indicated in Table 2. Again, there was some variation in the initial NaOH addition, which was calculated as the difference in TA pre- and post-NaOH addition and reported in μmol kg−1 (Table 2). In this case, the NaOH addition was precisely known as it was dispensed via pipette (rather than by peristaltic pump as for the larger volumes in the mesocosm experiments), and the discrepancy is likely due to variation in the initial volume of seawater within these aquaria, combined with uncertainty from the TA analysis.

Table 2. Range of variables measured, calculated, or extrapolated in aquaria experiments, where M denotes direct measurement, C denotes calculation via CO2SYS, and E denotes extrapolation to equilibrium conditions.
The carbonate chemistry dynamics of all aquaria replicates were consistent with one another, characterized by an immediate decrease in pCO2, increase in TA, and increase in pH upon addition of NaOH to seawater. As pCO2 and pH re-equilibrated, DIC increased over time as CO2 was stored in seawater. Time series figures are available in the Supplementary material.
The aquaria experiments were left to equilibrate until measured pH was stable. However, the probe used to monitor pH introduced a relatively large (0.01) uncertainty in measurements, and at the termination of experiments, CO2 may not have been fully equilibrated. This is apparent in the ratio of ΔDIC to ΔTA (Table 2), which was much smaller in the aquaria (0.10–0.66) than in the larger mesocosms (0.77–0.97). This is likely due to the short duration of experiments (19–23 days), which, combined with lack of bubbling or other interventions, prevented full atmospheric equilibration in each tank. Aquaria filled with untreated seawater from Flax Pond appeared to consistently have a higher final ΔDIC to ΔTA ratio than reservoir treatments in which biology was controlled, consistent with observations from the mesocosm experiments.
3.3 Model fitting
Equation 1 was fit to both mesocosms and aquaria (Supplementary material). The mean root mean square error (RMSE) for both mesocosms and aquaria was relatively low (24 μmol kg–1 and 13 μmol kg–1 respectively), indicating that parameterization using Equation 1 was a reasonable characterization of both the rate and amount of inorganic carbon sequestered through alkalinity addition. We differentiated the exponential fit of each DIC curve for estimates of the instantaneous rate of DIC uptake for each experiment (Figure 4, Supplementary material). The adherance of the empirical data to our fit curves allow for precise predictions of instantaneous rates of DIC uptake, exemplified by our narrow 95% prediction intervals.

Figure 4. Line graph showing the rate of DIC increase in micromoles per kilogram per day over 20 days. The red and blue lines both start high, decrease steeply, and gradually level off approaching zero. Instantaneous rate of change for DIC in experiment 2 as inferred by exponential fit. The blue line indicates data from the mesocosm in which seawater was bleached and continually circulated through a UV array throughout the duration of the experiment. The red line indicates data from the mesocosm without sterilization treatments. 95% prediction intervals are superimposed, but are too narrow to be seen.
Maximum instantaneous rates of change varied substantially between mesocosm experiments (36–555 μmol/kg/day). CO2 uptake rates were consistently higher in unsterilized mesocosms, but converged toward the end of these experiments.
Our aim was to build a model to predict the three parameters determining the shape of the curve describing DIC accumulation and equilibration. The linear model assumes that true observations of parameters are distributed normally around their mean values. The data loosely fit our assumptions, as Mardia tests for both skewness and kurtosis do not suggest significant departures from multivariate normality. However, Mahalanobis distances reveal several multivariate outliers and univariate Shapiro–Wilk tests show departures from normality in both a and b. While there are subtle departures from normality, there were no clear nonlinear trends between our continuous predictors and our response variables, suggesting that linear modeling should fit reasonably well to our data. The best-fitting model in terms of LOOCV RMSE included the following predictors: amount of NaOH added to the tank, whether the tank was sterilized, the season when the experiment began, and the DIC of the tank prior to NaOH addition. Our multivariate tests suggest that both the initial DIC and the amount of NaOH added explain a significant amount of variance across all three parameters (Supplementary material). While the type 1 error rate of our sterilization treatment and season are greater than our threshold of 0.05, we still chose to include them in our model, since all predictors together lead to the most accurate predictions.
We assessed model uncertainty by calculating prediction intervals for our leave one out estimates. Although we find that simultaneous prediction intervals for all parameters are wide (Supplementary material), the correlation between predictors and response variables constrains the bounds of the multidimensional prediction (Supplementary material). To visualize how model uncertainty relates to changes in the predicted shape of the DIC curve, we performed multiple leave-one-out predictions for each tank, redrawing all predictor coefficients for each parameter from their multivariate distribution. The shape of redrawn curves were mostly consistent suggesting that, despite large prediction intervals, the uncertainty of our model does not prohibit consistent predictions.
Each of the different parameters predicted by our model represent a specific aspect of the DIC equilibration curve's shape and all had different relationships with our model's predictors. For instance, the a parameter, determines where the DIC accumulation curve will asymptote and represents the final equilibrated DIC concentration of seawater post NaOH addition. Univariate tests show that, of our four predictor variables, only the amount of NaOH added had a strong role in predicting a, as its coefficient was the only one not significantly different from 0 (Supplementary material).
The b parameter controls how much DIC increases to meet its final equilibration value; similarly to a, the only significant predictor for this parameter was the amount of NaOH added. The c parameter controls the rate at which dosed seawater reaches equilibrium. The initial DIC, whether the tank was sterilized, and the season of the experiment were all significant predictors of c. Relatively low initial DIC, unsterilized tanks, and experiments run in the spring or fall equilibrated the fastest.
To determine if our model preserves its accuracy across experiment scales, we used our linear model to predict the rate and amount of DIC uptake in the aquaria experiments and compared the resulting errors to those of our leave-one-out predictions using a Mann–Whitney U-test. There is no evidence to suggest that errors for a (U = 43, P = 0.201), b (U = 66, P = 0.759) or c (U = 47, P = 0.285) are consistently smaller for the mesocosms than for aquaria. We also compared our linear model predictions of final post-equilibration DIC to estimates from both seacarb, factoring in gas exchange and the equilibrium processes of the carbonate system, as well as estimates based off of the theoretical carbon uptake ratio (Supplementary material). Average absolute errors were lower for seacarb and linear model estimates (85.56 and 85.93 μmol/kg respectively) compared to theoretical estimates (92.85 μmol/kg), but a Kruskal–Wallis test shows no strong evidence for differences in medians.
For most experiments, DIC trajectories predicted from our linear model adhered strongly to the exponential curve fit to our data (Figure 5, Supplementary material). This underscores the ability of our model to provide reasonable predictions of both the final DIC at equilibrium and the trajectory of carbon uptake over the duration of experiments.

Figure 5. Line graphs labeled (a) and (b) show normalized DIC (millimioles per kilogram over 20 days. Both graphs feature individual data trends with yellow, pink, and black lines rising between days 0 to 7, then stabilizing. Both graphs show many simulations in light gray following similar trends. Interpolated, normalized DIC curves (black) along with fit curves (pink) and leave-one-out model predictions (yellow) for experiment 2. To demonstrate model uncertainty, parameters were redrawn from their multivariate distributions 1,000 times and corresponding curves are plotted in gray. The two panels represent data from the mesocosm with sterilization treatments (a) and the one that was not (b).
4 Discussion
4.1 CO2 uptake following NaOH addition
Here we add to the growing body of literature characterizing the rate and magnitude of carbon uptake following alkalinity additions to seawater in an experimental setting (Supplementary material). Our results are consistent with the timescales and carbon uptake efficiency characterized by previous experiments under similar experimental setups (Ringham et al., 2024). We leveraged our previous experimental data to provide predictions of carbon uptake trajectories and determine influential predictors on final DIC.
It is known that there is a range in the expected efficiency of OAE based on regional factors impacting air-sea CO2 exchange, including gas transfer velocity, subduction, temperature and spatial variability in the background carbonate system, and that full re-equilibration of CO2 will result in 0.7–0.9 mol CO2 uptake per mol alkalinity added to seawater (Zhou et al., 2025). In the early stages of OAE field trials, validating this assumption at increasing scales and complexity is an important step in building confidence in OAE MRV.
We found that the theoretical stoichiometric approximations, equilibration-based seacarb calculations, and linear model-based predictions of the CO2 uptake capacity are all reasonable reflections of measured values within controlled laboratory experiments. The linear model-based prediction is advantageous in that it was robust to drastic changes in experiment scales and was capable of producing both estimates of the final equilibration state as well as the rate of CO2 uptake. However, this linear model requires several inputs such as DIC which are not always readily available. Thus, in circumstances where predictions of CO2 uptake rate and small increases in accuracy are irrelevant, estimates using the theoretical carbon uptake ratio can be used in place of our linear model-based predictions. While model fit was satisfactory, our small sample size constrains the ability to extrapolate our linear model to seawater samples with different initial conditions, as seawater DIC and TA vary substantially both spatially and temporally (Shaik et al., 2024). Our sample size also precludes our ability to implement a wider range of data-hungry modeling approaches, which have the potential to achieve greater model accuracy and more clearly identify the variables with the greatest influence on OAE-based carbon sequestration.
4.2 Biological impacts on CO2 uptake
Our modeling procedure suggests that the presence of microbial biology increases the rate of carbon uptake following alkalinity addition, but does not substantially change the amount of carbon that is ultimately sequestered in seawater. The convergence of results from both sterile and non-sterile experiments on the final DIC calculated after air-sea CO2 equilibration indicates that total inorganic carbon uptake following alkalinity enhancement may be robust to changes the abundance and/or composition of the microbial community. While further experimentation is needed to definitively prove that carbonate chemistry dynamics in mesocosms can replicate conditions in the near-field of alkalinity releases, the consistency in our results are a promising first step. In cases where researchers are more interested in physical and chemical dynamics than biological complexity, OAE experiments conducted without onerous sterilization procedures may be used to increasingly approximate field conditions in advance of widespread OAE field trials. The influence of the presence of biology on the rate of equilibration of CO2, even when that biological community is uncharacterized, is interesting in the context of MRV. Most OAE applications are constrained to the coasts in order to deliver alkalinity while minimizing CO2 emissions. As such, OAE will likely be located in highly productive coastal environments where an increase in the rate of CO2 equilibration is advantageous.
Previous work quantifying ecosystem-level fluxes in organic and inorganic carbon in coastal ecosystems can help inform the mechanisms by which microbial life increases carbon sequestration rates in our mesocosms. In highly productive coastal ecosystems, predictable diel fluctuations in pCO2, dissolved oxygen, and pH have been associated with a dynamic interplay between community photosynthesis (6CO2 + 6H2O + light → C6H12O6 + 6O2) and respiration (C6H12O6 + 6O2 → 6CO2 + 6H2O + energy) (Baumann and Smith, 2018). Similar processes could be responsible for the increase in carbon uptake rates in unsterilized mesocosms. During daylight hours, photosynthetic organisms fix inorganic carbon to organic carbon, reducing pCO2 while increasing pH and dissolved oxygen. In our system, the deficit of pCO2 will favor the conversion of new CO2 inputs via respiration to other inorganic carbon species, effectively trapping these inorganic carbon fluxes in the mesocosms' carbonate system.
If community photosynthesis and respiration or its chemical byproducts were driving the increased rates of CO2 equilibration in our experiments, we would expect these effects to vary with the season in which the experiment was conducted. Phytoplankton abundance in the Long Island Sound fluctuates drastically over annual time scales, characterized by predictable blooms in the early spring, typical of temperate regions (Riley et al., 1956; Anderson and Taylor, 2001). We both found that the season at which we collected seawater was a significant predictor in CO2 equilibration and experiments conducted in spring equilibrated fastest. This preliminary data indicates a strong influence of community photosynthesis and respiration on the rate of CO2 equilibration, but future studies are needed to directly validate photosynthesis-respiration diel cycling through more frequent pH, chlorophyll, nutrient and dissolved oxygen measurements, along with indicators of community biomass and composition.
The strength of this relationship could change substantially with the composition of the community. Both photosynthetic rates (Behl et al., 2011) and respiration rates (Munson-McGee et al., 2022) are highly dependent on functional group richness within phytoplankton communities. Community composition is not an equilibrium process; plankton species in natural systems experience extremely rapid turnover as they are sensitive to abiotic (temperature, salinity, dissolved oxygen, nutrient availability) and biotic (allelopathy, preferential grazing, differential viral susceptibilities) influences (Hutchinson, 1961; Suter et al., 2014; Anderson and Taylor, 2001; Agawin et al., 2000). Although our experiments were carried out in a controlled setting, our measurements indicate that temperature, salinity and dissolved oxygen did vary over the course of our experiments (Supplementary material). If community composition had an observable effect on carbon sequestration in our experiments, we would have expected to see higher variance in instantaneous rates of DIC equilibration and therefore a higher degree of noise over the course of equilibration in unsterilized tanks relative to sterilized thanks. There was no strong evidence for a difference in noise between the two treatments, indicating that functional-group-level effects did not have a substantial influence on carbonate chemistry dynamics relative to the chemical processes at play. It is possible that changes in species abundances were too slight to have any effects on community level processes, or that the species comprising each functional group were in flux, but the functional groups themselves were not. Future studies should directly observe community composition through DNA metabarcoding at multiple points throughout OAE experiments. While the abiotic conditions in our experimental setup were in slight flux, they are not representative of the highly transient conditions of Long Island Sound (Duvall et al., 2024; Woodwell et al., 1979). Functional-group-related influences on OAE could be more apparent as the magnitude of change among abiotic seawater conditions increases, and should be a focus of future work.
OAE literature has focused extensively on the potential for coccolithophores and other calcifying plankton species due to their profound impacts on marine carbonate chemistry (Lehmann and Bach, 2025; Bach et al., 2019; Gately et al., 2023; Faucher et al., 2025). Through calcification, bicarbonate ions are taken up to produce protective coccoliths, thereby decreasing the TA of the surrounding seawater and offsetting the effects of NaOH addition. However, coccolithophore abundances in Long Island Sound have historically been low (Riley et al., 1956), leading us to expect that calcification would not play a central role in altering carbonate chemistry during our experiments. Average TA data during our experiments did not show any clear variation in unsterilized tanks relative to sterilized tanks with equivalent NaOH additions, suggesting that the effects of calcification were not observable in our experiments. Similar mesocosm experiments in waters where coccolithophores are predominant will be valuable for quantifying the abundances sufficient for an observable effect on alkalinity enhancement.
Because the carbon removal resulting from OAE occurs in an open environment with signal-to-noise issues in tracking shifts in carbonate chemistry, experiments linking biological, chemical, and physical dynamics to OAE in controlled settings have an outsized role to play in establishing OAE as a viable carbon removal method. Quantification of carbon removal from OAE will require a suite of measurements and models to establish the amount of alkalinity released into seawater, to predict the movement of the alkalinity-enhanced seawater and its contact with the atmosphere, and to calculate resulting air-sea CO2 exchange (Ho et al., 2023; Fennel et al., 2023). Regional ocean models are currently used for this purpose (e.g., Wang et al., 2023; Khangaonkar et al., 2024), but there are weaknesses in fully characterizing the marine carbonate chemistry system in the presence of biological responses due to both computational expense and complexity in predicting biological response in plankton communities (Wagner et al., 2025; Fatland et al., 2016). If the influence of marine microorganisms on OAE is minimal in the context of the magnitude of CO2 equilibration, then it may be useful to consider less computationally expensive modeling approaches that simulate carbon uptake dynamics without simulating changes to the phytoplankton community. While more testing is needed, the lack of strong functional group-related influences on the final equilibrium conditions suggests that the effects of biology on OAE may be simplified in these models.
4.3 Summary, limitations and future recommendations
Through imposing sterilization controls on our alkalinity addition experiments across both mesocosms and aquaria, we tested for the influence of biology on the magnitude, rate, and efficiency of electrodialysis-based OAE. We found that unsterilized tanks had a consistently higher rate of equilibration, but did not differ significantly in the magnitude of carbon uptake over the duration of our experiments. These results are a key first step in predicting how the presence of biology might impact OAE in situ, but further experimentation is needed to both directly characterize the mechanism behind our results and investigate the confounding factors inherent to our controlled experimental setting.
While we find a strong influence of biology on DIC equilibration rate, our experimental setup may reduce the magnitude of the effects we observed relative to the field. First, due to scheduling constraints, aquarium experiments were only performed in the late winter. While data from these experiments were not used to train our model, additional experiments performed throughout the year could have been informative in discerning how the magnitude of biological effects interact across experimental scales and seasons. Second, the source of seawater in this experiment was a reservoir filled from Flax Pond. The residence time of this holding tank is uncertain, and it is possible that the residence time was long enough to limit the initial abundance of phytoplankton in non-sterilized mesocosm experiments. Third, biology was still present in sterilized tanks as indicated by biofilms on the walls and instruments in sterilized tanks, potentially decreasing the magnitude of the effect size between our sterilized and unsterilized treatments. Fourth, our methodology could inadvertently constrain phytoplankton abundance and photosynthetic rates, limiting the effects of biology that we observe. The decrease in pCO2 initiated by the introduction of NaOH could be drastic enough to severely limit photosynthetic rates, cutting off the source of organic carbon to be respired back into the medium. Many phytoplankton taxa are capable of utilizing carbon concentrating mechanisms (CCMs) (Reinfelder, 2011) to increase photosynthetic efficiency at low pCO2 by taking in aqueous bicarbonate and using it to increase intracellular carbon dioxide concentrations, facilitated through the action of the enzyme carbonic anhydrase (Badger, 2003). Yet, there is still a lower limit to pCO2 where CCMs fail to compensate at ~100 μatm (Riebesell et al., 1993; Bach et al., 2019). Directly following NaOH addition, our tanks reach these lower limits, which could temporarily minimize the processes contributing to increased sequestration rates. Other than carbon, nutrient availability can also strongly limit photosynthetic rate (Suter et al., 2014). The lack of consistent nutrient inputs into our experimental tanks suggest progressive depletion of nutrients which could also progressively constrain biologically mediated increases in carbon uptake over the duration of the experiment.
Future studies could better quantify these relationships with increased monitoring of the amount of living biomass in each mesocosm. Fluorometry and chlorophyll measurements can be used to estimate the prevalence of phytoplankton in experimental tanks as well as characterize changes in photosynthetic rate over the duration of experiments. Analysis of the community composition and potential changes in that composition over time would be valuable for disentangling the potential bidirectional interactions between marine communities and alkalinity enhancement.
Data availability statement
The raw data supporting the conclusions of this article will be made available by the authors, without undue reservation.
Author contributions
DF: Visualization, Investigation, Conceptualization, Writing – original draft, Validation, Methodology, Writing – review & editing, Formal analysis. HL: Writing – original draft, Supervision, Visualization, Funding acquisition, Resources, Validation, Project administration, Writing – review & editing. CS: Investigation, Writing – review & editing, Supervision, Data curation. ME: Conceptualization, Resources, Writing – original draft, Funding acquisition, Methodology, Project administration. MR: Project administration, Data curation, Software, Formal analysis, Methodology, Resources, Conceptualization, Investigation, Writing – review & editing, Supervision, Funding acquisition, Writing – original draft.
Funding
The author(s) declare that financial support was received for the research and/or publication of this article. This research was supported by the Grantham Foundation for the Protection of the Environment (Grant No. 15: Safe Elevation of Alkalinity for the Mitigation of Acidification Through Electrochemistry—SEA MATE).
Acknowledgments
We would like to thank Brendan Carter for early planning discussions and use of instrumentation, and Stephen Baines for helpful discussions and advice.
Conflict of interest
ME and MR were employed by Ebb Carbon, Inc.
The remaining authors declare that the research was conducted in the absence of any commercial or financial relationships that could be construed as a potential conflict of interest.
Generative AI statement
The author(s) declare that no Gen AI was used in the creation of this manuscript.
Any alternative text (alt text) provided alongside figures in this article has been generated by Frontiers with the support of artificial intelligence and reasonable efforts have been made to ensure accuracy, including review by the authors wherever possible. If you identify any issues, please contact us.
Publisher's note
All claims expressed in this article are solely those of the authors and do not necessarily represent those of their affiliated organizations, or those of the publisher, the editors and the reviewers. Any product that may be evaluated in this article, or claim that may be made by its manufacturer, is not guaranteed or endorsed by the publisher.
Supplementary material
The Supplementary Material for this article can be found online at: https://www.frontiersin.org/articles/10.3389/fclim.2025.1652680/full#supplementary-material
References
Agawin, N. S., Duarte, C. M., and Agustí, S. (2000). Nutrient and temperature control of the contribution of picoplankton to phytoplankton biomass and production. Limnol. Oceanogr. 45, 591–600. doi: 10.4319/lo.2000.45.3.0591
Albright, R., Caldeira, L., Hosfelt, J., Kwiatkowski, L., Maclaren, J. K., Mason, B. M., et al. (2016). Reversal of ocean acidification enhances net coral reef calcification. Nature 531, 362–365. doi: 10.1038/nature17155
Anderson, T. H., and Taylor, G. T. (2001). Nutrient pulses, plankton blooms, and seasonal hypoxia in western Long Island Sound. Estuaries 24, 228–243. doi: 10.2307/1352947
Aparicio, J., and Endelman, J. (2025). flexFitR: Flexible Non-Linear Least Square Model Fitting. R package version 1.2.0. Madison. doi: 10.32614/CRAN.package.flexFitR
Bach, L. T., Ferderer, A. J., LaRoche, J., and Schulz, K. G. (2024). Technical note: Ocean alkalinity enhancement pelagic impact intercomparison project (OAEPIIP). Biogeosciences 21, 3665–3676. doi: 10.5194/bg-21-3665-2024
Bach, L. T., Gill, S. J., Rickaby, R. E., Gore, S., and Renforth, P. (2019). CO_2 removal with enhanced weathering and ocean alkalinity enhancement: potential risks and co-benefits for marine pelagic ecosystems. Front. Clim. 1:7. doi: 10.3389/fclim.2019.00007
Badger, M. (2003). The roles of carbonic anhydrases in photosynthetic co2 concentrating mechanisms. Photosyn. Res. 77, 83–94. doi: 10.1023/A:1025821717773
Baumann, H., and Smith, E. M. (2018). Quantifying metabolically driven pH and oxygen fluctuations in US nearshore habitats at diel to interannual time scales. Estuaries Coasts 41, 1102–1117. doi: 10.1007/s12237-017-0321-3
Behl, S., Donval, A., and Stibor, H. (2011). The relative importance of species diversity and functional group diversity on carbon uptake in phytoplankton communities. Limnol. Oceanogr. 56, 683–694. doi: 10.4319/lo.2011.56.2.0683
Benjamini, Y., and Hochberg, Y. (1995). Controlling the false discovery rate: a practical and powerful approach to multiple testing. J. R. Stat. Soc. B 57, 289–300. doi: 10.1111/j.2517-6161.1995.tb02031.x
Burt, D., Fröb, F., and Ilyina, T. (2021). The sensitivity of the marine carbonate system to regional ocean alkalinity enhancement. Front. Clim. 3:624075. doi: 10.3389/fclim.2021.624075
Dickson, A. (1990). Thermodynamics of the dissociation of boric acid in synthetic seawater from 273.15 to 318.15 K. Deep Sea Res. A. 37, 755–766. doi: 10.1016/0198-0149(90)90004-F
Dickson, A., Sabine, C., and Christian, J. (2007). Guide to Best Practices for Ocean CO2 Measurements. Sidney, BC, North Pacific Marine Science Organization.
Duvall, M. S., Hagy, I. I. I., Ammerman, J. D., and Tedesco, J. W. M. A. (2024). High-frequency dissolved oxygen dynamics in an urban estuary, the Long Island Sound. Estuaries Coasts 47, 415–430. doi: 10.1007/s12237-023-01278-8
Eisaman, M. D., Geilert, S., Renforth, P., Bastianini, L., Campbell, J., Dale, A. W., et al. (2023). “Assessing the technical aspects of ocean-alkalinity-enhancement approaches,” in Guide to Best Practices in Ocean Alkalinity Enhancement Research, Vol. 2-oae2023, eds. A. Oschlies, A. Stevenson, L. T. Bach, K. Fennel, R. E. M. Rickaby, T. Satterfield, et al. (Göttingen: Copernicus Publications), 3. doi: 10.5194/sp-2-oae2023-3-2023
Fatland, R., MacCready, P., and Oscar, N. (2016). “Liveocean,” in Cloud Computing in Ocean and Atmospheric Sciences, eds. T. C. Vance, N. Merati, and C. Yang · (Amsterdam: Elsevier), 277–296. doi: 10.1016/B978-0-12-803192-6.00014-1
Faucher, G., Haunost, M., Paul, A. J., Tietz, A. U. C., and Riebesell, U. (2025). Growth response of emiliania huxleyi to ocean alkalinity enhancement. Biogeosciences 22, 405–415. doi: 10.5194/bg-22-405-2025
Fennel, K., Long, M. C., Algar, C., Carter, B., Keller, D., Laurent, A., et al. (2023). “Modelling considerations for research on ocean alkalinity enhancement (OAE),” in Guide to Best Practices in Ocean Alkalinity Enhancement Research, Vol. 2-oae2023, eds. A. Oschlies, A. Stevenson, L. T. Bach, K. Fennel, R. E. M. Rickaby, T. Satterfield, et al. (Göttingen: Copernicus Publications), 9. doi: 10.5194/sp-2-oae2023-9-2023
Ferderer, A., Schulz, K. G., Riebesell, U., Baker, K. G., Chase, Z., Bach, L. T., et al. (2024). Investigating the effect of silicate- and calcium-based ocean alkalinity enhancement on diatom silicification. Biogeosciences 21, 2777–2794. doi: 10.5194/bg-21-2777-2024
Friis, K., Körtzinger, A., and Wallace, D. (2003). The salinity normalization of marine inorganic carbon chemistry data. Geophys. Res. Lett. 30:1085. doi: 10.1029/2002GL015898
Gately, J. A., Kim, S. M., Jin, B., Brzezinski, M. A., and Iglesias-Rodriguez, M. D. (2023). Coccolithophores and diatoms resilient to ocean alkalinity enhancement: a glimpse of hope? Sci. Adv. 9:eadg6066. doi: 10.1126/sciadv.adg6066
Gattuso, J.-P., Lee, K., Rost, B., Schulz, K., and Gao, K. (2010). Approaches and Tools to Manipulate the Carbonate Chemistry. Luxembourg City: Publications Office of the European Union, 41–52.
Halloran, P. R., Bell, T. G., Burt, W. J., Chu, S. N., Gill, S., Henderson, C., et al. (2025). Seawater carbonate chemistry based carbon dioxide removal: towards commonly agreed principles for carbon monitoring, reporting, and verification. Front. Clim. 7:1487138. doi: 10.3389/fclim.2025.1487138
Hanyuda, T., Wakana, I., Arai, S., Miyaji, K., Watano, Y., Ueda, K., et al. (2002). Phylogenetic relationships within cladophorales (Ulvophyceae, Chlorophyta) inferred from 18s rrna gene sequences, with special reference to aegagropila linnaei. J. Phycol. 38, 564–571. doi: 10.1046/j.1529-8817.2002.01151.x
Hartmann, J., Suitner, N., Lim, C., Schneider, J., Marín-Samper, L., Arístegui, J., et al. (2023). Stability of alkalinity in ocean alkalinity enhancement (OAE) approaches-consequences for durability of CO_2 storage. Biogeosciences 20, 781–802. doi: 10.5194/bg-20-781-2023
He, J., and Tyka, M. D. (2023). Limits and CO2 equilibration of near-coast alkalinity enhancement. Biogeosciences 20, 27–43. doi: 10.5194/bg-20-27-2023
Ho, D. T., Bopp, L., Palter, J. B., Long, M. C., Boyd, P. W., Neukermans, G., et al. (2023). “Monitoring, reporting, and verification for ocean alkalinity enhancement,” in Guide to Best Practices in Ocean Alkalinity Enhancement Research, Vol. 2-oae2023, eds. A. Oschlies, A. Stevenson, L. T. Bach, K. Fennel, R. E. M. Rickaby, T. Satterfield, et al. (Göttingen: Copernicus Publications), 12. doi: 10.5194/sp-2-oae2023-12-2023
Iglesias-Rodríguez, M. D., Rickaby, R. E. M., Singh, A., and Gately, J. A. (2023). “Laboratory experiments in ocean alkalinity enhancement research,” in Guide to Best Practices in Ocean Alkalinity Enhancement Research, Vol. 2-oae2023, eds. A. Oschlies, A. Stevenson, L. T. Bach, K. Fennel, R. E. M. Rickaby, T. Satterfield, et al. (Göttingen: Copernicus Publications), 5. doi: 10.5194/sp-2-oae2023-5-2023
Intergovernmental Panel on Climate Change (2023). Summary for Policymakers. Cambridge: Cambridge University Press, 3–32. doi: 10.1017/9781009157896.001
Johnson, K., King, A., and Sieburth, J. (1985). Coulometric TCO_2 analyses for marine studies: an introduction. Mar. Chem. 16, 61–82. doi: 10.1016/0304-4203(85)90028-3
Khangaonkar, T., Carter, B. R., Premathilake, L., Yun, S. K., Ni, W., Stoll, M. M., et al. (2024). Mixing and dilution controls on marine co2 removal using alkalinity enhancement. Environ. Res. Lett. 19:104039. doi: 10.1088/1748-9326/ad7521
Kikstra, J. S., Nicholls, Z. R. J., Smith, C. J., Lewis, J., Lamboll, R. D., Byers, E., et al. (2022). The IPCC Sixth Assessment Report WGIII climate assessment of mitigation pathways: from emissions to global temperatures. Geosci. Model Dev. 15, 9075–9109. doi: 10.5194/gmd-15-9075-2022
Lee, K., Kim, T.-W., Byrne, R., Millero, F., Feely, R., Liu, Y.-M., et al. (2010). The universal ratio of boron to chlorinity for the North Pacific and North Atlantic oceans. Geochim. Cosmochim. Acta 74, 1801–1811. doi: 10.1016/j.gca.2009.12.027
Lehmann, N., and Bach, L. (2025). Global carbonate chemistry gradients reveal a negative feedback on ocean alkalinity enhancement. Nature Geosci. 8:1–7. doi: 10.1038/s41561-025-01644-0
Lewis, E., Wallace, D., and Allison, L. J. (1998). Program Developed for CO2 System Calculations. Oak Ridge, TN. doi: 10.2172/639712
Lueker, T., Dickson, A., and Keeling, C. (2000). Ocean pCO_2 calculated from dissolved inorganic carbon, alkalinity, and equations for K1 and K2: validation based on laboratory measurements of CO_2 in gas and seawater at equilibrium. Mar. Chem. 70, 105–119. doi: 10.1016/S0304-4203(00)00022-0
Munson-McGee, J. H., Lindsay, M. R., Sintes, E., Brown, J. M., D'Angelo, T., Brown, J., et al. (2022). Decoupling of respiration rates and abundance in marine prokaryoplankton. Nature 612, 764–770. doi: 10.1038/s41586-022-05505-3
Orr, J., Epitalon, J.-M., and Gattuso, J.-P. (2015). Comparison of ten packages that compute ocean carbonate chemistry. Biogeosciences 12, 1483–1510. doi: 10.5194/bg-12-1483-2015
Oschlies, A., Bach, L. T., Rickaby, R. E. M., Satterfield, T., Webb, R., Gattuso, J.-P., et al. (2023). “Climate targets, carbon dioxide removal, and the potential role of ocean alkalinity enhancement,” in Guide to Best Practices in Ocean Alkalinity Enhancement Research, Vol. 2-oae2023, eds. A. Oschlies, A. Stevenson, L. T. Bach, K. Fennel, R. E. M. Rickaby, T. Satterfield, et al. (Göttingen: Copernicus Publications), 1. doi: 10.5194/sp-2-oae2023-1-2023
Pierrot, D., Lewis, E., and Wallace, D. (2006). MS Excel Program Developed for CO_2 System Calculations. ORNL/CDIAC-105a. Oak Ridge, TN: Carbon Dioxide Information Analysis Center, Oak Ridge National Laboratory, U.S. Department of Energy.
R Core Team (2024). R: A Language and Environment for Statistical Computing. Vienna: R Foundation for Statistical Computing. Available online at: https://www.R-project.org/
Reinfelder, J. R. (2011). Carbon concentrating mechanisms in eukaryotic marine phytoplankton. Ann. Rev. Mar. Sci. 3, 291–315. doi: 10.1146/annurev-marine-120709-142720
Renforth, P., and Henderson, G. (2017). Assessing ocean alkalinity for carbon sequestration. Rev. Geophys. 55, 636–674. doi: 10.1002/2016RG000533
Riebesell, U., Wolf-Gladrow, D., and Smetacek, V. (1993). Carbon dioxide limitation of marine phytoplankton growth rates. Nature 361, 249–251. doi: 10.1038/361249a0
Riley, G. A., Conover, S. A., Deevey, G. B., Conover, R. J., Wheatland, S. B., Harris, E., et al. (1956). Oceanography of Long Island Sound, 1952-1954. Bull. Bingham Oceanogr. Collect. 15, 62–112. doi: 10.21236/AD0096209
Ringham, M. C., Hirtle, N., Shaw, C., Lu, X., Herndon, J., Carter, B. R., et al. (2024). An assessment of ocean alkalinity enhancement using aqueous hydroxides: kinetics, efficiency, and precipitation thresholds. Biogeosciences 21, 3551–3570. doi: 10.5194/bg-21-3551-2024
Rogelj, J., Popp, A., Calvin, K. V., Luderer, G., Emmerling, J., Gernaat, D., et al. (2018). Scenarios towards limiting global mean temperature increase below 1.5°C. Nat. Clim. Change 325–332. doi: 10.1038/s41558-018-0091-3
Savoie, A. M., Ringham, M. C., Torres Sanchez, C., Carter, B. R., Dougherty, S., Feely, R. A., et al. (2025). Novel field trial for ocean alkalinity enhancement using electrochemically-derived aqueous alkalinity. Front. Environ. Eng. 4:1641277. doi: 10.3389/fenve.2025.1641277
Schulz, K., Bach, L., and Dickson, A. (2023). Seawater carbonate chemistry considerations for ocean alkalinity enhancement research: theory, measurements, and calculations. State Planet 2:2-oae-2-2023. doi: 10.5194/sp-2-oae2023-2-2023
Shaik, I., Krishna, K. V., Nagamani, P. V., Begum, S. K., Shanmugam, P., Mathew, R., et al. (2024). Estimation of spatiotemporal variability of global surface ocean DIC fields using ocean color remote sensing data. IEEE Trans. Geosci. Remote Sens. 62, 1–14. doi: 10.1109/TGRS.2024.3390179
Shao, Z., and Er, M. J. (2016). Efficient leave-one-out cross-validation-based regularized extreme learning machine. Neurocomputing 194, 260–270. doi: 10.1016/j.neucom.2016.02.058
Skulberg, O. M., Carmichael, W. W., Codd, G. A., Skulberg, R., et al. (1993). Taxonomy of toxic cyanophyceae (cyanobacteria). Algal Toxins Seafood Drink. Water 1, 145–164. doi: 10.1016/B978-0-08-091811-2.50014-9
Suter, E. A., Lwiza, K. M., Rose, J. M., Gobler, C., and Taylor, G. T. (2014). Phytoplankton assemblage changes during decadal decreases in nitrogen loadings to the urbanized Long Island Sound estuary, USA. Mar. Ecol. Prog. Ser. 497, 51–67. doi: 10.3354/meps10602
Van Heuven, S., Pierrot, D., Rae, J., Lewis, E., and Wallace, D. (2011). MATLAB Program Developed for CO_2 System Calculations. MATLAB Program deVELoped for CO_2 System Calculations. ORNL/CDIAC-105b, 530. doi: 10.3334/CDIAC/otg.CO2SYS_MATLAB_v1.1
Wagner, G. L., Silvestri, S., Constantinou, N. C., Ramadhan, A., Campin, J.-M., Hill, C., et al. (2025). High-level, high-resolution ocean modeling at all scales with oceananigans. arXiv [preprint]. arXiv:2502.14148. doi: 10.48550/arXiv.2502.14148
Wang, H., Pilcher, D. J., Kearney, K. A., Cross, J. N., Shugart, O. M., Eisaman, M. D., et al. (2023). Simulated impact of ocean alkalinity enhancement on atmospheric co2 removal in the bering sea. Earth's Future 11:e2022EF002816. doi: 10.1029/2022EF002816
Woodwell, G., Hall, C., Whitney, D., and Houghton, R. (1979). The Flax Pond ecosystem study: exchanges of inorganic nitrogen between an estuarine marsh and Long Island Sound. Ecology 60, 695–702. doi: 10.2307/1936606
Keywords: ocean alkalinity enhancement, mesocosms, NaOH, carbon dioxide removal, mCDR
Citation: Fucich D, Lynch HJ, Shaw C, Eisaman MD and Ringham MC (2025) Determining the net influence of biological processes on aqueous hydroxide-based ocean alkalinity enhancement: a mesocosm approach. Front. Clim. 7:1652680. doi: 10.3389/fclim.2025.1652680
Received: 24 June 2025; Accepted: 27 August 2025;
Published: 15 September 2025.
Edited by:
Michael Fong, National Institute of Standards and Technology (NIST), United StatesReviewed by:
Phillip Williamson, University of East Anglia, United KingdomBenjamin Twining, Bigelow Laboratory for Ocean Sciences, United States
Copyright © 2025 Fucich, Lynch, Shaw, Eisaman and Ringham. This is an open-access article distributed under the terms of the Creative Commons Attribution License (CC BY). The use, distribution or reproduction in other forums is permitted, provided the original author(s) and the copyright owner(s) are credited and that the original publication in this journal is cited, in accordance with accepted academic practice. No use, distribution or reproduction is permitted which does not comply with these terms.
*Correspondence: Derek Fucich, ZGVyZWsuZnVjaWNoQHN0b255YnJvb2suZWR1
†Deceased February 28, 2025