 Shitian Huang
 Zhiying Su1
 Guotao Cui
- 1School of Geography and Planning, Sun Yat-sen University, Guangzhou, China
- 2Carbon-Water Research Station in Karst Regions of Northern Guangdong, School of Geography and Planning, Sun Yat-sen University, Guangzhou, Guangdong, China
Amidst rapid urbanization and an increasing frequency of extreme events, urban climate stress is intensifying and potentially affecting wet-bulb temperature (WBT), a key indicator of human-perceived thermal stress. This study examined the combined effects of urbanization and extreme events on the WBT dynamics in Guangdong Province, a humid tropical region in China. Using long-term meteorological data spanning five decades and urbanization metrics, we systematically analyzed urban–rural WBT differences using paired station comparisons and quantified the contribution of urbanization. Key findings highlight urban–rural WBT differences across three distinct urbanization stages: (a) Initial urbanization, where heat island effects dominate and amplify WBT differences; (b) Rapid urbanization, characterized by impervious surface expansion that widens WBT disparities to their peak, with the urban–rural difference increasing by 0.0027° C decade−1 (p < 0.001); and (c) Mature urbanization (e.g., Guangdong-Hong Kong-Macao Greater Bay Area, GBA), where dry island effects reduce humidity, thereby narrowing urban–rural gaps. Furthermore, extreme weather events alter these urban–rural WBT patterns. High-temperature and compound heat-drought events can reduce WBT differences, in some cases by a factor of three, while periods of extreme precipitation can amplify them. These findings underscore the critical impacts of urbanization and extreme events on urban thermal stress. This understanding is crucial for evaluating human heat stress and informing urban risk planning, particularly in the context of advancing urbanization and climate change in urban agglomerations.
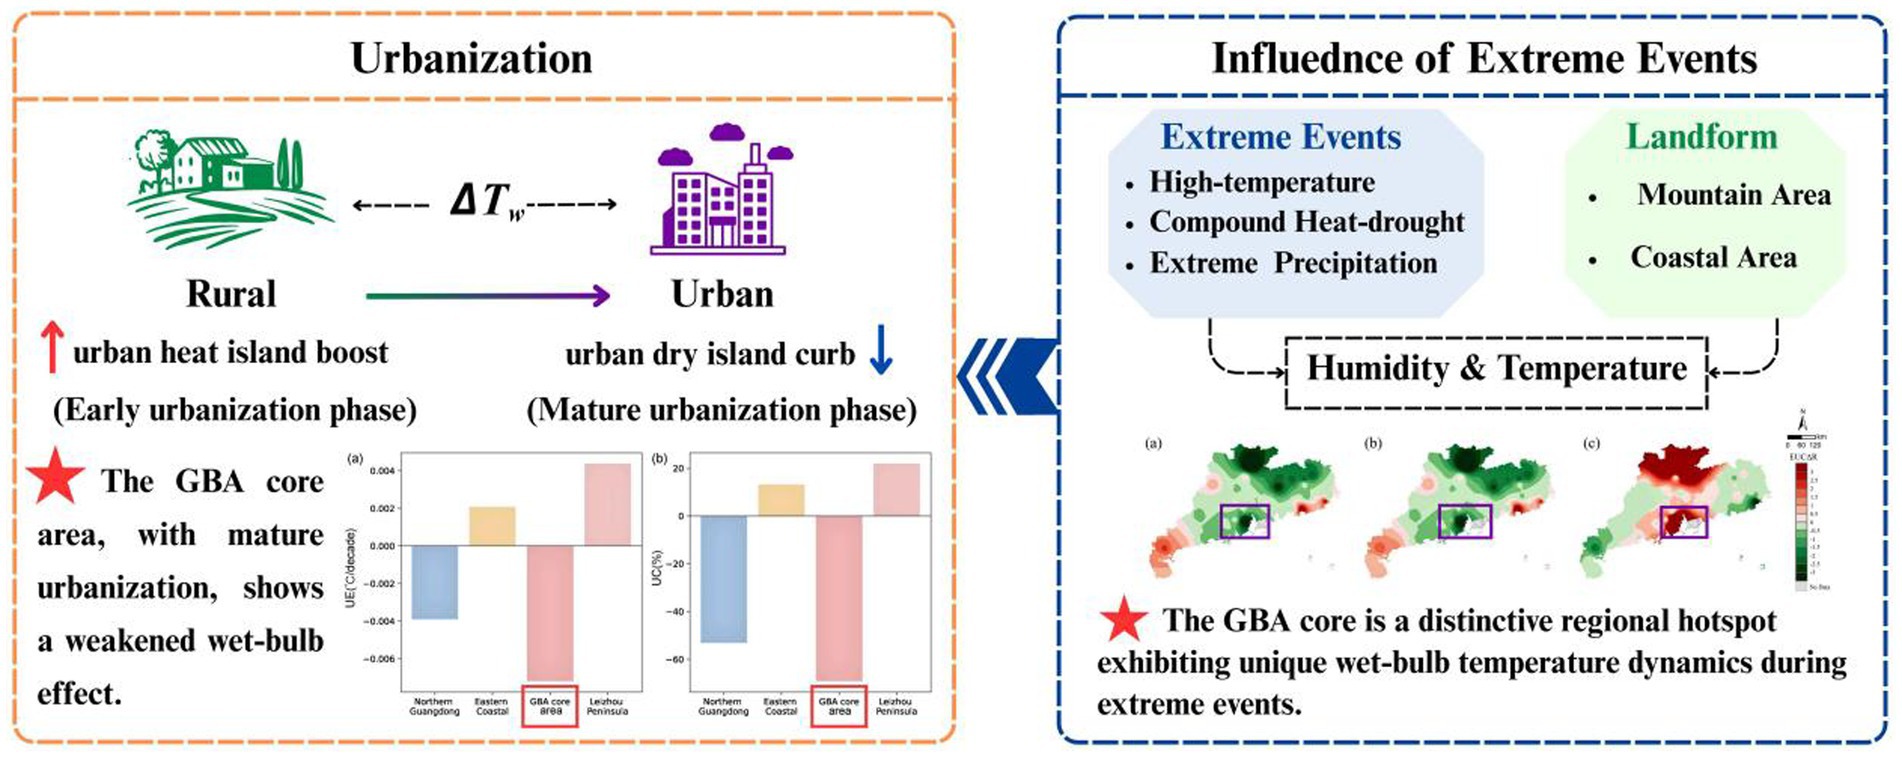
Graphical Abstract.
Highlights
• Wet-bulb temperature difference (WBT) between urban and rural areas in humid Guangdong was investigated.
• Extreme events (high temperature, compound heat-drought, and extreme precipitation) impact urban–rural WBT differences.
• The Greater Bay Area is a hotspot showing unique WBT patterns.
• Both urbanization and extreme events affect urban–rural wet-bulb temperature differences.
1 Introduction
In a warming climate, the increasing frequency of extreme events (e.g., high temperature, compound heat-drought, and extreme precipitation) presents a significant threat. These events not only trigger ecological crises such as ecosystem degradation and loss of habitat (Qu et al., 2023; Walsh et al., 2020) but also have far-reaching impacts on agricultural production (Han et al., 2024), socio-economic development (Newman and Noy, 2023), and human health (Clayton, 2020; Ebi et al., 2021). An event is typically classified as “extreme” when a meteorological variable exceeds an established threshold, corresponding to a low probability of occurrence, typically below 10% (Qin et al., 2015). It is crucial to investigate the multidimensional effects of extreme events (Wang et al., 2022). Urbanization, marked by rising population density and expansion of impervious surfaces, restructures social-economic dynamics while heightening climate risks in densely populated urban areas (Jones, 2005; Ali et al., 2013; Fu and Weng, 2016; Hanson et al., 2011). Furthermore, increased atmospheric pollutants and population density during urban development significantly influence extreme events (Jiao et al., 2020).
As a key indicator of human-perceived thermal stress (Zhang et al., 2023), wet-bulb temperature (WBT) has recently emerged as an important indicator for investigating how urban meteorological environments evolve and how extreme weather events alter climatic conditions, which are often used for urban planning and safeguarding public health (Justine et al., 2023; Zhang et al., 2023; Rahman et al., 2022). Urban Heat Island (UHI) processes, driven by impervious surface expansion, raise urban air temperatures and consequently WBT (Cho, 2022; Wong et al., 2021). Previous studies have investigated the combined roles of temperature and moisture dynamics, highlighting how interactions among urban morphology, building configurations, and climatic conditions drive WBT increases through both warming and humidity changes (Lu et al., 2021; Wang et al., 2019). Regarding extreme events, heatwaves can raise WBT by 2–6° C in humid environments (Shreevastava et al., 2023), and droughts amplify WBT by suppressing evaporative cooling (Zhou et al., 2022). The effect of extreme precipitation is more complex: while rainfall can cause evaporative cooling that reduces WBT (Yin et al., 2023), the accumulation of atmospheric humidity before a storm can also cause transient increases (Ivanovich et al., 2022; Wu, 2000).
Although progress has been made in understanding urbanization’s impact on WBT and its responses to extreme events, several gaps remain. First, although previous studies have documented urban–rural differences in WBT, its magnitude and mechanisms in humid regions remain uncertain (Zhang et al., 2023). Second, while the individual roles of urbanization and extreme events have been explored (Chen H. P. et al., 2024; Chen Y. et al., 2024; Luo and Lau, 2021; Yao et al., 2022), few have examined their combined effects on wet-bulb temperature. Finally, most studies are limited by short time frames or coarse spatial scales (Lu et al., 2021; Zhang et al., 2023), particularly lacking detailed, long-term analysis for humid regions. Addressing these gaps is an urgent research challenge, particularly for urban agglomerations where dense populations face heightened heat stress.
To address these gaps, this study focuses on Guangdong Province in China (encompassing Guangdong-Hong Kong-Macao Greater Bay Area, GBA) as a case study of a humid and highly urbanized region. First, we use long-term meteorological and urban development data to quantify the urban–rural WBT difference, evaluating the effect of urbanization. Second, we quantitatively assess how extreme events, namely heatwaves, compound heat-drought events, and extreme precipitation, alter this effect. Finally, we investigate the combined effect of urbanization and extreme weather on the urban–rural WBT differences, providing insights for developing climate-adaptive strategies in humid urban agglomerations.
2 Materials and methods
This study investigates the effects of urbanization and extreme events on urban–rural wet-bulb temperature differences in Guangdong Province. First, we classified 86 meteorological stations as either urban or rural based on population size, population density, and land cover, and established urban–rural station pairs considering elevation and spatial distance. Second, we identified three types of extreme weather events: high-temperature events, extreme precipitation, and compound heat-drought events. Finally, we assessed the response of WBT differences to extreme events using the Extreme Urban-Countryside Change Ratio ( ).
2.1 Study area
Located within the tropical and subtropical monsoon zone of southern China (Figure 1), Guangdong Province experiences high temperatures and humidity year-round, with hot, humid summers and warm, humid winters, which is a typical humid tropical region (Ye et al., 2022; Zhang et al., 2017). It is one of China’s most rapidly urbanizing provinces (Cai and Deng, 2020), with the Pearl River Delta-centered Guangdong-Hong Kong-Macao Greater Bay Area (GBA) being one of the world’s largest bay economies (Hui et al., 2020). Guangdong experienced more frequent and intense heatwaves and extreme rainfall in recent years due to urbanization and global climate change. For example, the frequency of severe heatwaves rose by 0.141 events per year between 1960 and 2015 (Jiang et al., 2015; Wu and Du, 2011; Zhang et al., 2018). Therefore, Guangdong Province encompassing GBA is a particularly suitable region for investigating the impacts of urbanization and extreme weather on wet-bulb temperature in humid regions.
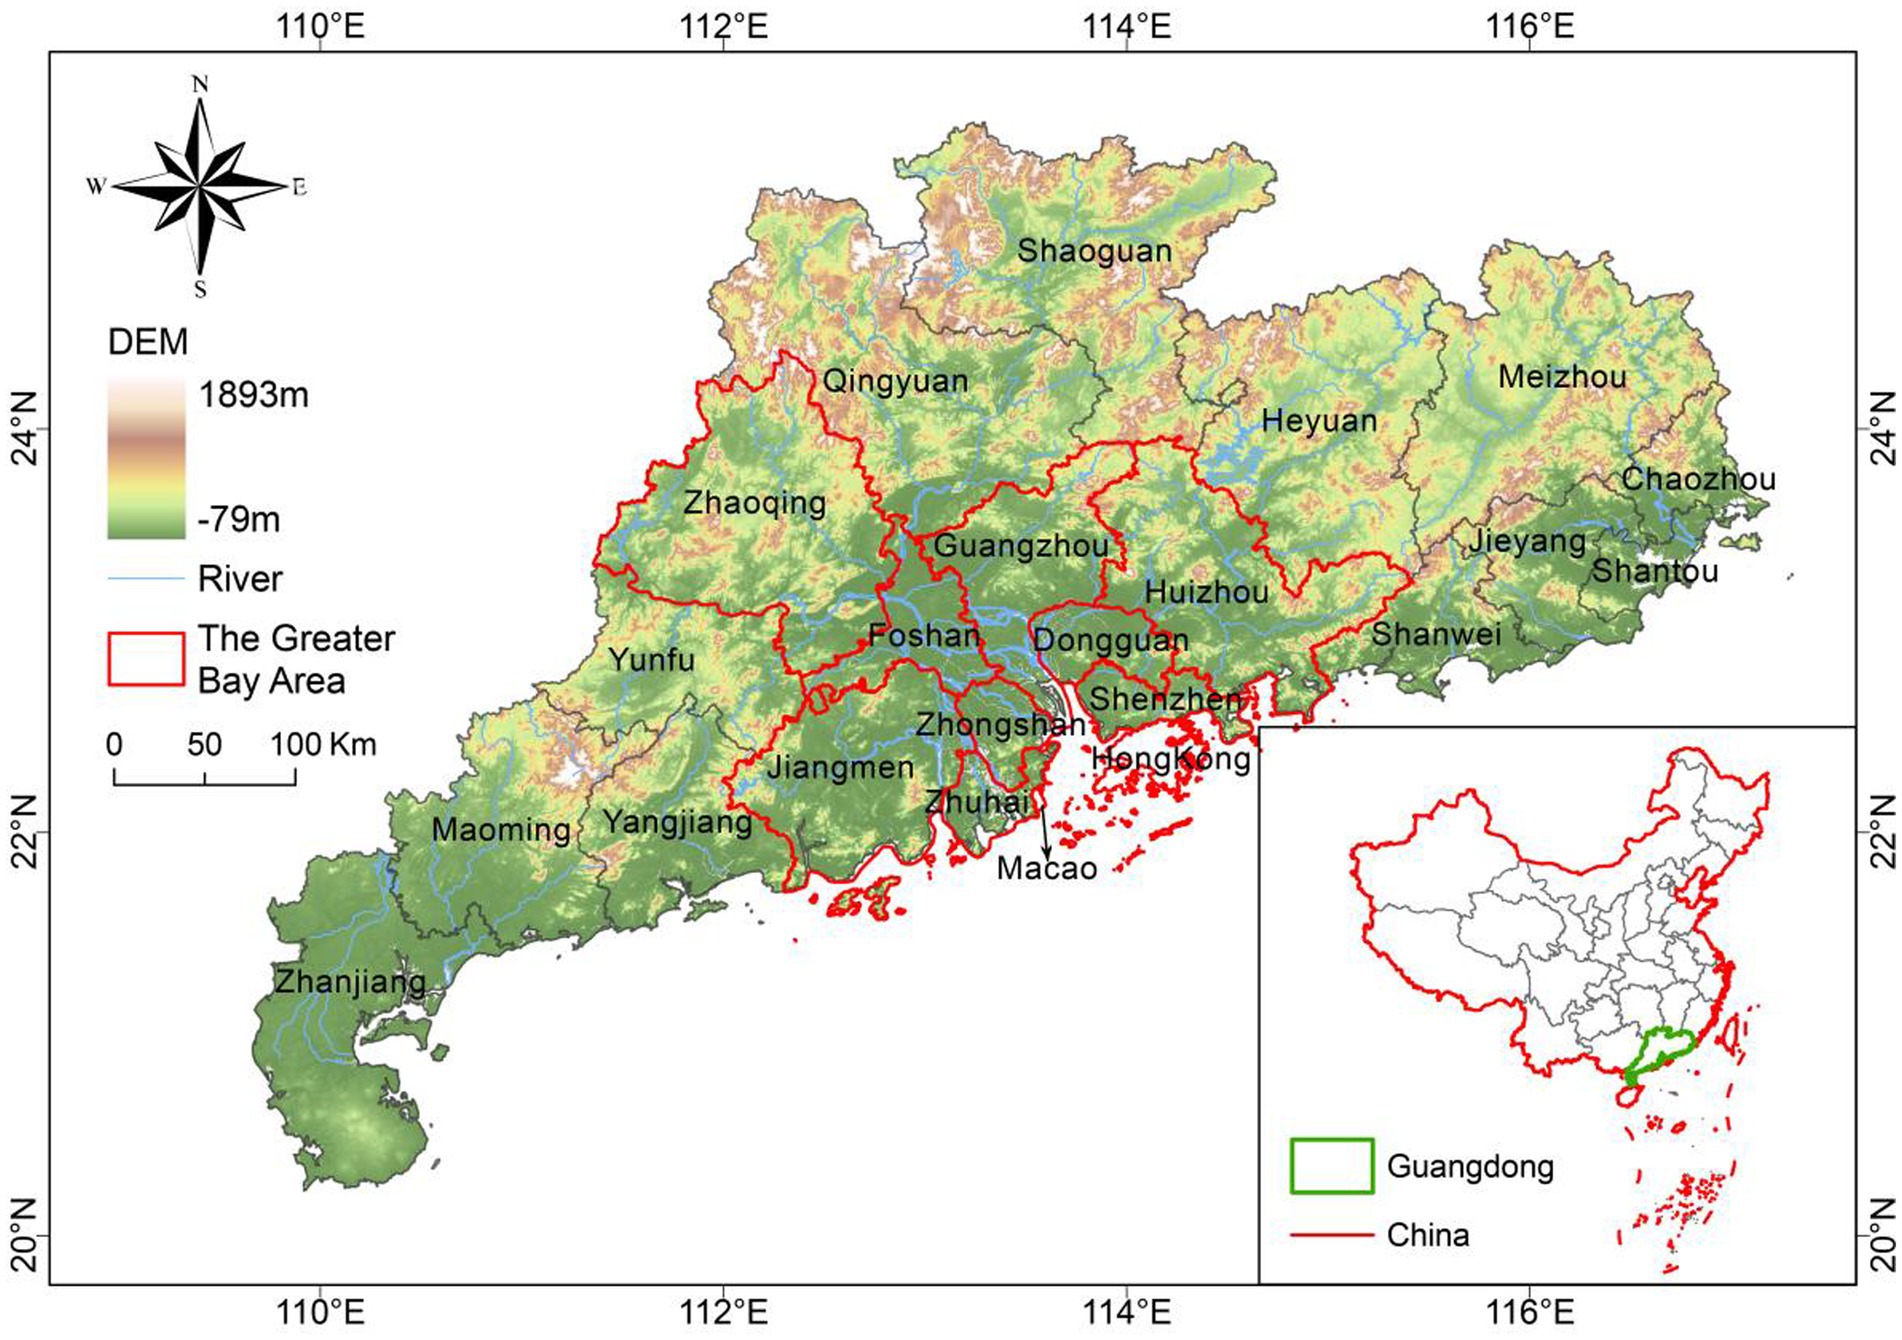
Figure 1. Topographic map of the study area, Guangdong Province. The map displays the elevation based on a Digital Elevation Model (DEM), major rivers, and cities. The boundary of the Guangdong-Hong Kong-Macao Greater Bay Area (GBA) is outlined. The inset shows the location of Guangdong Province within China.
Long-term meteorological observations, including daily precipitation, air temperature, and relative humidity, were collected from 86 stations in Guangdong (Figure 2; Hong Kong and Macao excluded due to inaccessible data) via the China Meteorological Data Network (CMDN) for 1951–2018. Land use data were obtained from the China Land Cover Dataset (CLCD) on Google Earth Engine, covering 1985–2019. Population size data were obtained from the 2010 Sixth National Census, while population density data were sourced from the Gridded Population of the World Version 4 (GPWv4).
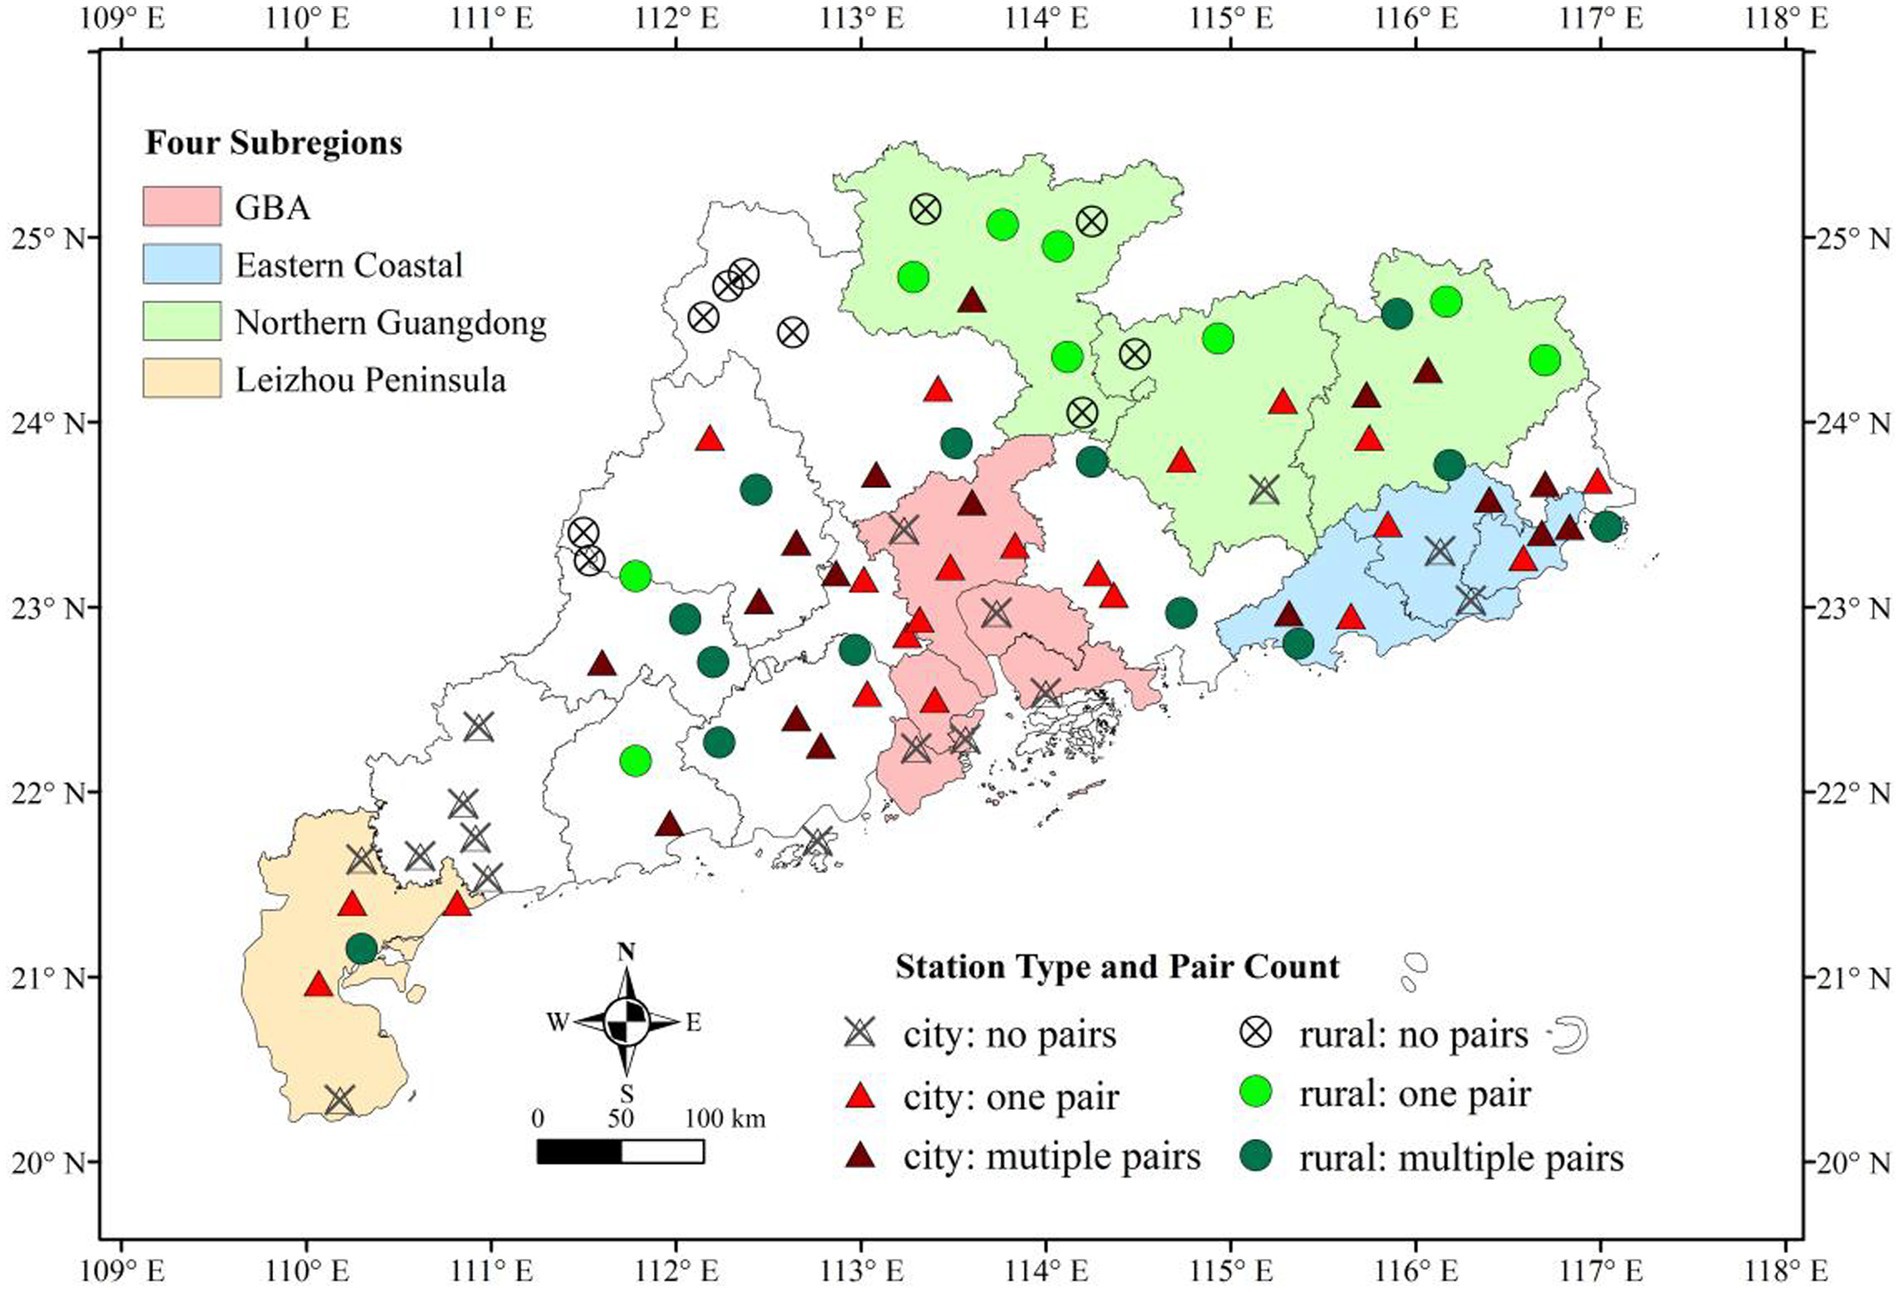
Figure 2. Spatial distribution of meteorological stations across Guangdong Province, classified as urban or rural. The symbols indicate both the station type and the outcome of the pairing process (e.g., paired, unpaired, or multiple pairs), as detailed in the legend. The map also delineates the four subregions used for regional analysis: the Greater Bay Area (GBA), Eastern Coastal, Northern Guangdong, and Leizhou Peninsula.
2.2 Criteria for urban–rural station pairing
To investigate the impact of urbanization on WBT, we first classified 86 meteorological stations in Guangdong Province as either urban or rural. This classification was based on a scoring system using three indicators: population size, population density, and land cover (Zhong et al., 2024).
a. Population size was retrieved from the 2010 Sixth National Census at the county level. Stations in counties with populations <500,000 were scored as rural (score = 0), those with populations >1,000,000 as urban (score = 1), and those with populations between 500,000 and 1,000,000 received a score of 0.5.
b. Population density data were sourced from the Gridded Population of the World, version 4 (GPWv4). For each station, we assigned the maximum population density value from its surrounding nine grid cells. Stations with a density less than 70% of the average density across all stations were scored as rural (score = 0), those with a density greater than 99% of the average were scored as urban (score = 1), and those in between received a score of 0.5.
c. Land cover data were sourced from the China Land Cover Dataset (CLCD). For each station, we calculated the proportion of impervious surface within a 3-pixel radius buffer. Stations were classified as rural if impervious surface coverage was less than 20% (score = 0), urban if it exceeded 40% (score = 1), and received a score of 0.5 for values between 20 and 40%.
After aggregating the three scores for each station, stations with a cumulative score of ≥2 were designated as urban, while those scoring below this threshold were categorized as rural (Zhong et al., 2024). Urban–rural station pairs were selected based on strict criteria for spatial and climatic comparability. The pairing process adhered to the following conditions: (1) an elevation difference of less than 100 m, (2) a spatial distance of less than 80 km, and (3) a latitudinal distance of less than 50 km. To account for elevation-related temperature differences, a vertical lapse rate of 0.0065° C m−1 was applied (Zhang et al., 2023). For each urban station, if only one rural station met the criteria, it was selected as the pair. In cases where multiple rural stations qualified, the geographically nearest station was chosen (Jiang et al., 2020).
2.3 Urban–rural WBT differences
The wet-bulb temperature (WBT, ° C) was calculated using elevation-corrected air temperatures and relative humidity (Equation 1, Stull, 2011):
The urban–rural WBT difference ( , °C) was then calculated for each station pair over the period 1967–2018. Although meteorological records at some observation sites extend back to 1951, the 1967–2018 period was selected to ensure data from a more consistent and comprehensive network of stations, thereby maintaining temporal consistency and data reliability. The for each station pair was then computed in Equation 2:
2.4 Extreme events and urbanization
2.4.1 Identification of extreme events
We focused on three types of extreme events, namely high temperature, extreme precipitation, and compound heat-drought events, which were identified to assess the changes in WBT during these periods relative to normal non-event conditions. The specific criteria for these events are presented in Table 1.
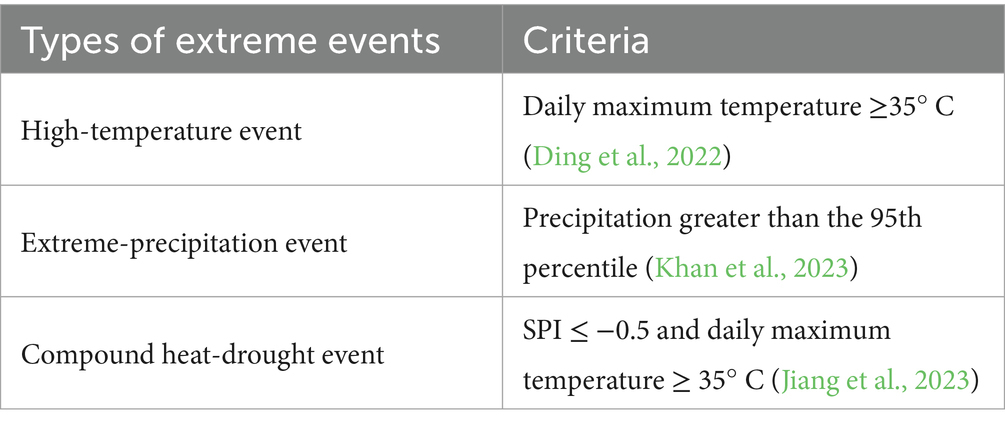
Table 1. Criteria for identifying extreme events.
2.4.2 The effect of extreme events
The impact of extreme events on the urban–rural WBT differences is quantified using the change in the difference during extreme events relative to non-event periods. We define a metric, the Extreme Urban-Countryside Change Ratio ( ), as shown in Equation 3. Its purpose is to provide a measure of how much the urban–rural WBT difference shifts during an extreme event. This allows us to compare the response across different locations and identify regional hotspots.
2.4.3 The effect of urbanization
To quantify the impact of urbanization on WBT trends, we used the Urbanization Effect (UE) indicator, defined as the difference between the WBT trends of urban and rural stations, as shown in Equation 4 (Zhong et al., 2024):
To quantify the extent to which urbanization affects WBT, we used the Urbanization Contribution (UC) indicator (Equation 5, Zhong et al., 2024):
The UC indicator represents the percentage of the observed urban WBT trend that can be attributed to local urbanization. For instance, a UC value of 30% suggests that 30% of the total WBT trend in the urban station is due to this urbanization effect. A negative UC value would typically occur if the urbanization effect and the urban trend have opposite signs.
All WBT trends were calculated using the Block Bootstrap method, a non-parametric resampling technique designed for autocorrelated time series data (Härdle et al., 2003). The main steps are described below.
For time series data , pseudo-samples are generated by dividing the data into fixed-length blocks b and randomly sampling these blocks with replacement. The data is first divided into n-b + 1 overlapping sliding blocks (B) of length b Equation 6:
Next, blocks are randomly selected from the sliding block with replacement and combined to form the pseudo-sample .
A linear regression of year (independent variable X) and temperature (dependent variable Y) in the pseudo-sample is modeled with Equation 7:
Note that interaction between urbanization and extreme climate events is complex and nonlinear (Zhao et al., 2021; Chen H. P. et al., 2024; Chen Y. et al., 2024). Rather than deconstructing the underlying nonlinear physics, the UE, UC, and were therefore used as diagnostic indices to quantify and characterize the net outcome of these complex interactions across different regions and event types.
3 Results
3.1 Distribution of paired stations
Figure 2 illustrates the spatial distribution of final urban–rural meteorological station pairs. Initial attempts at pairing revealed challenges, namely: the issue of one-to-many associations (i.e., a single site having multiple potential matches) and the failure to find pairs for all sites, a problem most common in regions with dense station distributions. To address these challenges, a refined two-step pairing strategy was adopted. First, all urban stations for which at least one potential rural counterpart could be identified were retained. Second, for each of these urban stations, the geographically closest rural station was selected as its definitive pair. This process resulted in 38 distinct urban–rural station pairs, providing coverage for the majority (90.9%) of cities in Guangdong Province. The four subregions (the Greater Bay Area, Eastern Coastal, Northern Guangdong, and Leizhou Peninsula) were used in subsequent analysis and highlighted to emphasize their spatial distribution (Figure 2).
3.2 Impact of urbanization on urban–rural WBT differences
Figure 3 presents the temporal variations of annual mean WBT for all stations and for the urban and rural subgroups. During the study period, the overall mean WBT across all stations was 19.39° C. Urban stations exhibited a higher average WBT of 19.48° C, compared to 19.04° C for rural stations. This observed difference (0.44° C) implies an urban impact on moist heat conditions. Overall, the mean WBT increased slightly at a rate of 0.136° C decade−1 (p value = 0.001). The rate of increase was 0.132° C decade−1 (p value = 0.001) for urban stations, compared to a slightly higher rate of 0.151° C decade−1 (p value <0.001) for rural stations. This difference in warming rates resulted in a slight narrowing of the urban–rural WBT difference over the study period.
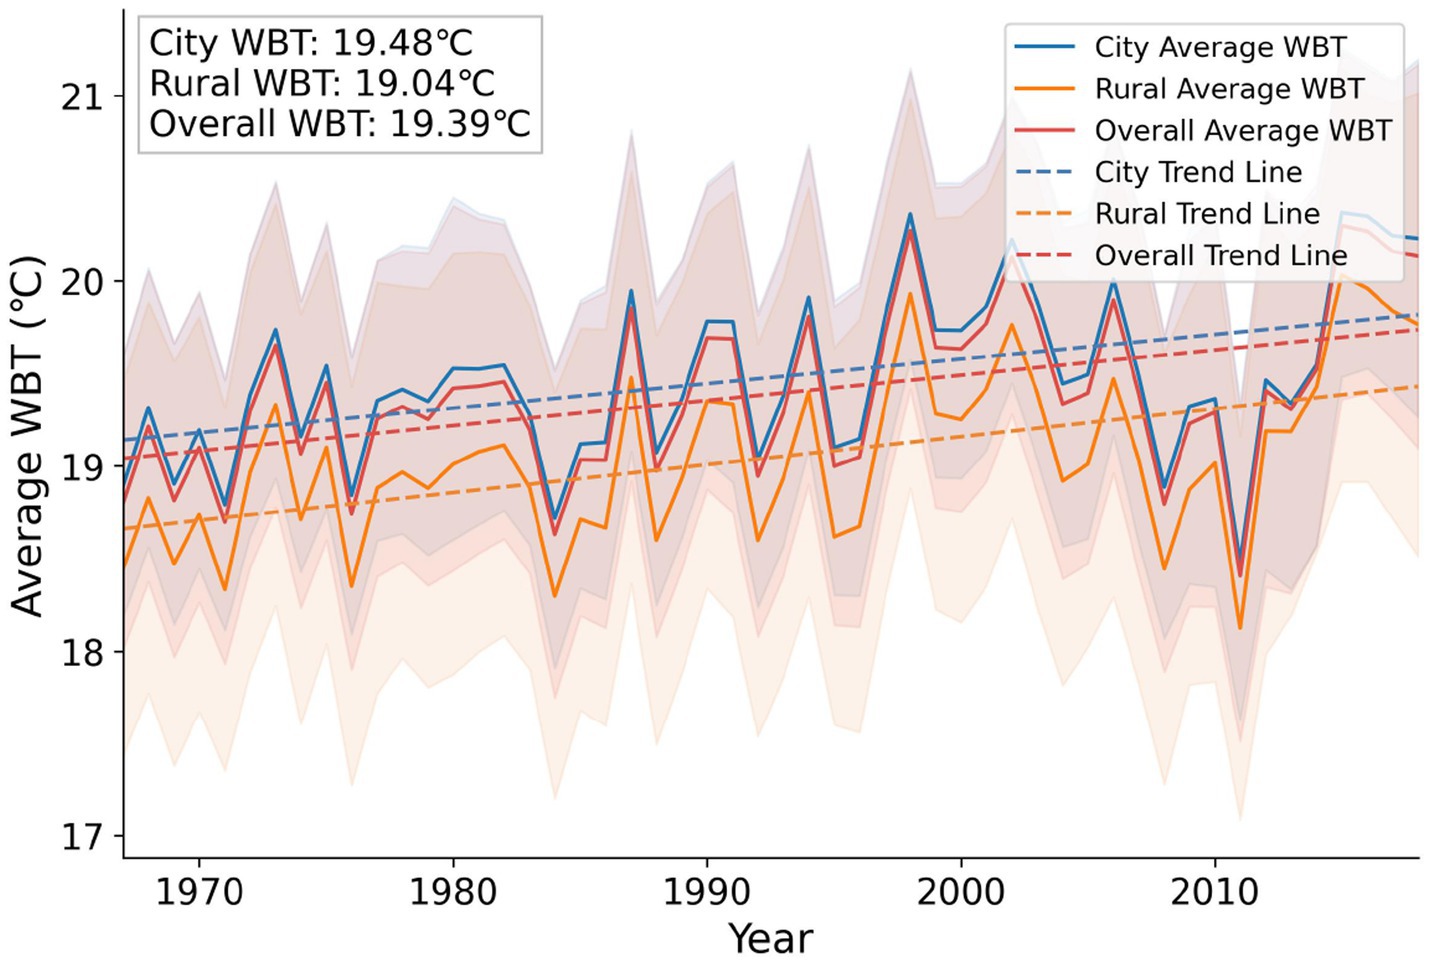
Figure 3. Time series of annual mean WBT across Guangdong province from 1967 to 2018. Solid lines represent the annual mean WBT for urban, rural, and all station groups, with the corresponding shaded bands indicating ± one standard deviation. Dashed lines show the linear trend for each group. The inset text provides the long-term mean WBT for each group over the entire study period.
To assess the spatial distribution of urbanization’s impact on annual mean WBT changes, the UE and UC metrics were calculated for each station pair (Figure 4). On average, urban WBT increased 0.0027° C decade−1 (p < 0.001) faster than rural WBT. This positive UE demonstrates that urbanization has exacerbated the urban–rural WBT difference. Furthermore, the UC analysis revealed that within Guangdong Province, urbanization accounted for an average of 3.13% of the total observed WBT increase in urban areas, highlighting its contribution to the warming of these urban environments.
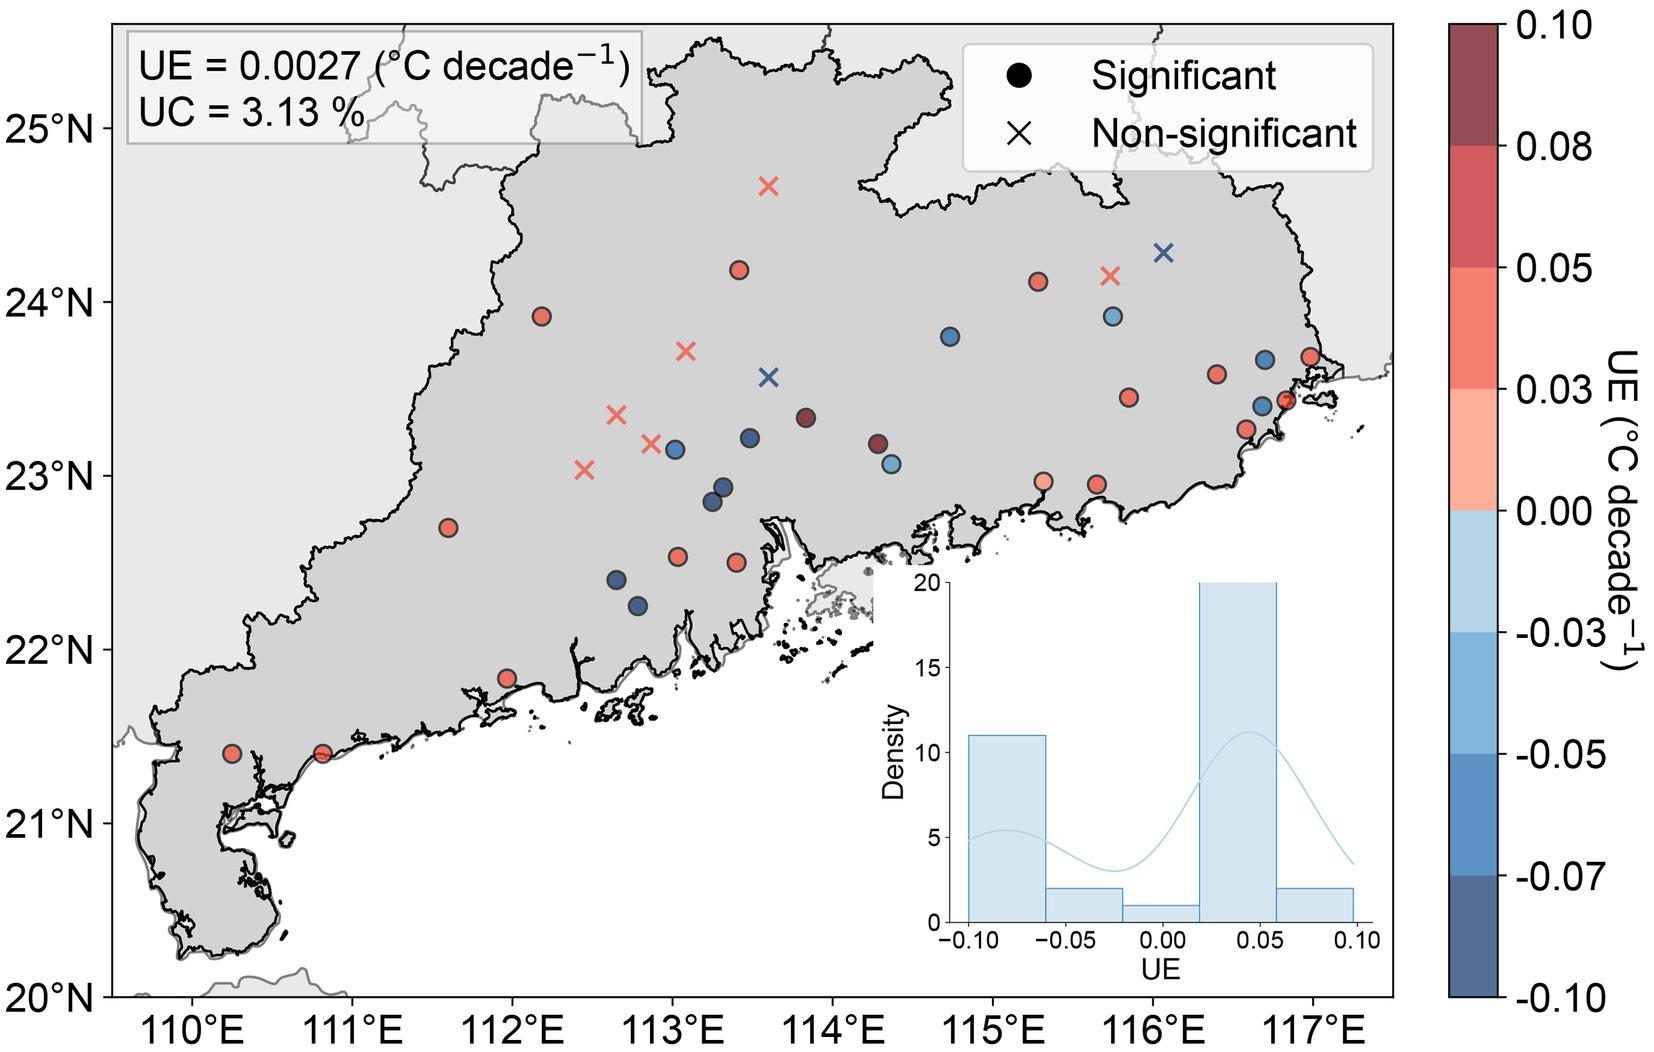
Figure 4. Spatial distribution of the urbanization effect (UE) on annual mean WBT trends across Guangdong Province. The color of each point indicates the magnitude of the UE, while symbols distinguish between statistically significant (circles, p < 0.05) and non-significant (crosses) trends. The inset displays the probability density function of all UE values, and the text overlay provides the province-wide mean UE and urbanization contribution (UC).
Spatially, stations exhibiting statistically significant upward WBT trends were widespread, particularly in the GBA and in western and eastern Guangdong. Within the GBA, urban stations exhibiting UE values less than 0 are predominantly found in the Pearl River Delta (PRD), particularly in cities like Guangzhou, Foshan, and Jiangmen. This suggests that in these mature, highly urbanized centers, the net impact of ongoing urban development on WBT trends is less pronounced compared to their rural counterparts, potentially leading to a stabilization or even a narrowing of the urban–rural WBT difference (Liang et al., 2022). Conversely, stations in regions such as eastern Guangdong, characterized by rapid recent expansion, showed higher rates of WBT warming and larger urbanization contributions (Zhong et al., 2024).
3.3 Spatial patterns of urban–rural WBT differences under extreme events
To better understand urban–rural WBT differences across Guangdong, we analyzed WBT trends in four primary subregions, namely the northern Guangdong, the GBA, the eastern coast, and the Leizhou Peninsula (delineated in Figure 2; trends are presented in Figure 5). Distinct regional patterns emerged. In the rapidly urbanizing Leizhou Peninsula, urban areas exhibited a faster rise in WBT (0.175° C decade−1, p < 0.001) than rural areas (0.145° C decade−1, p = 0.004), suggesting a pronounced urban heat island (UHI) effect on air temperature is observed, coexisting with a relatively weak urban dry island effect. In contrast, the GBA, characterized by more mature and slowing urbanization, showed slower urban warming (0.123° C decade−1, p = 0.005) compared to rural areas (0.174° C decade−1, p < 0.001), indicating that a weakening urban dry island effect (a relative increase or lesser suppression of urban humidity over time) may exert a more dominant influence on WBT trends than the sensible heat component of the UHI.
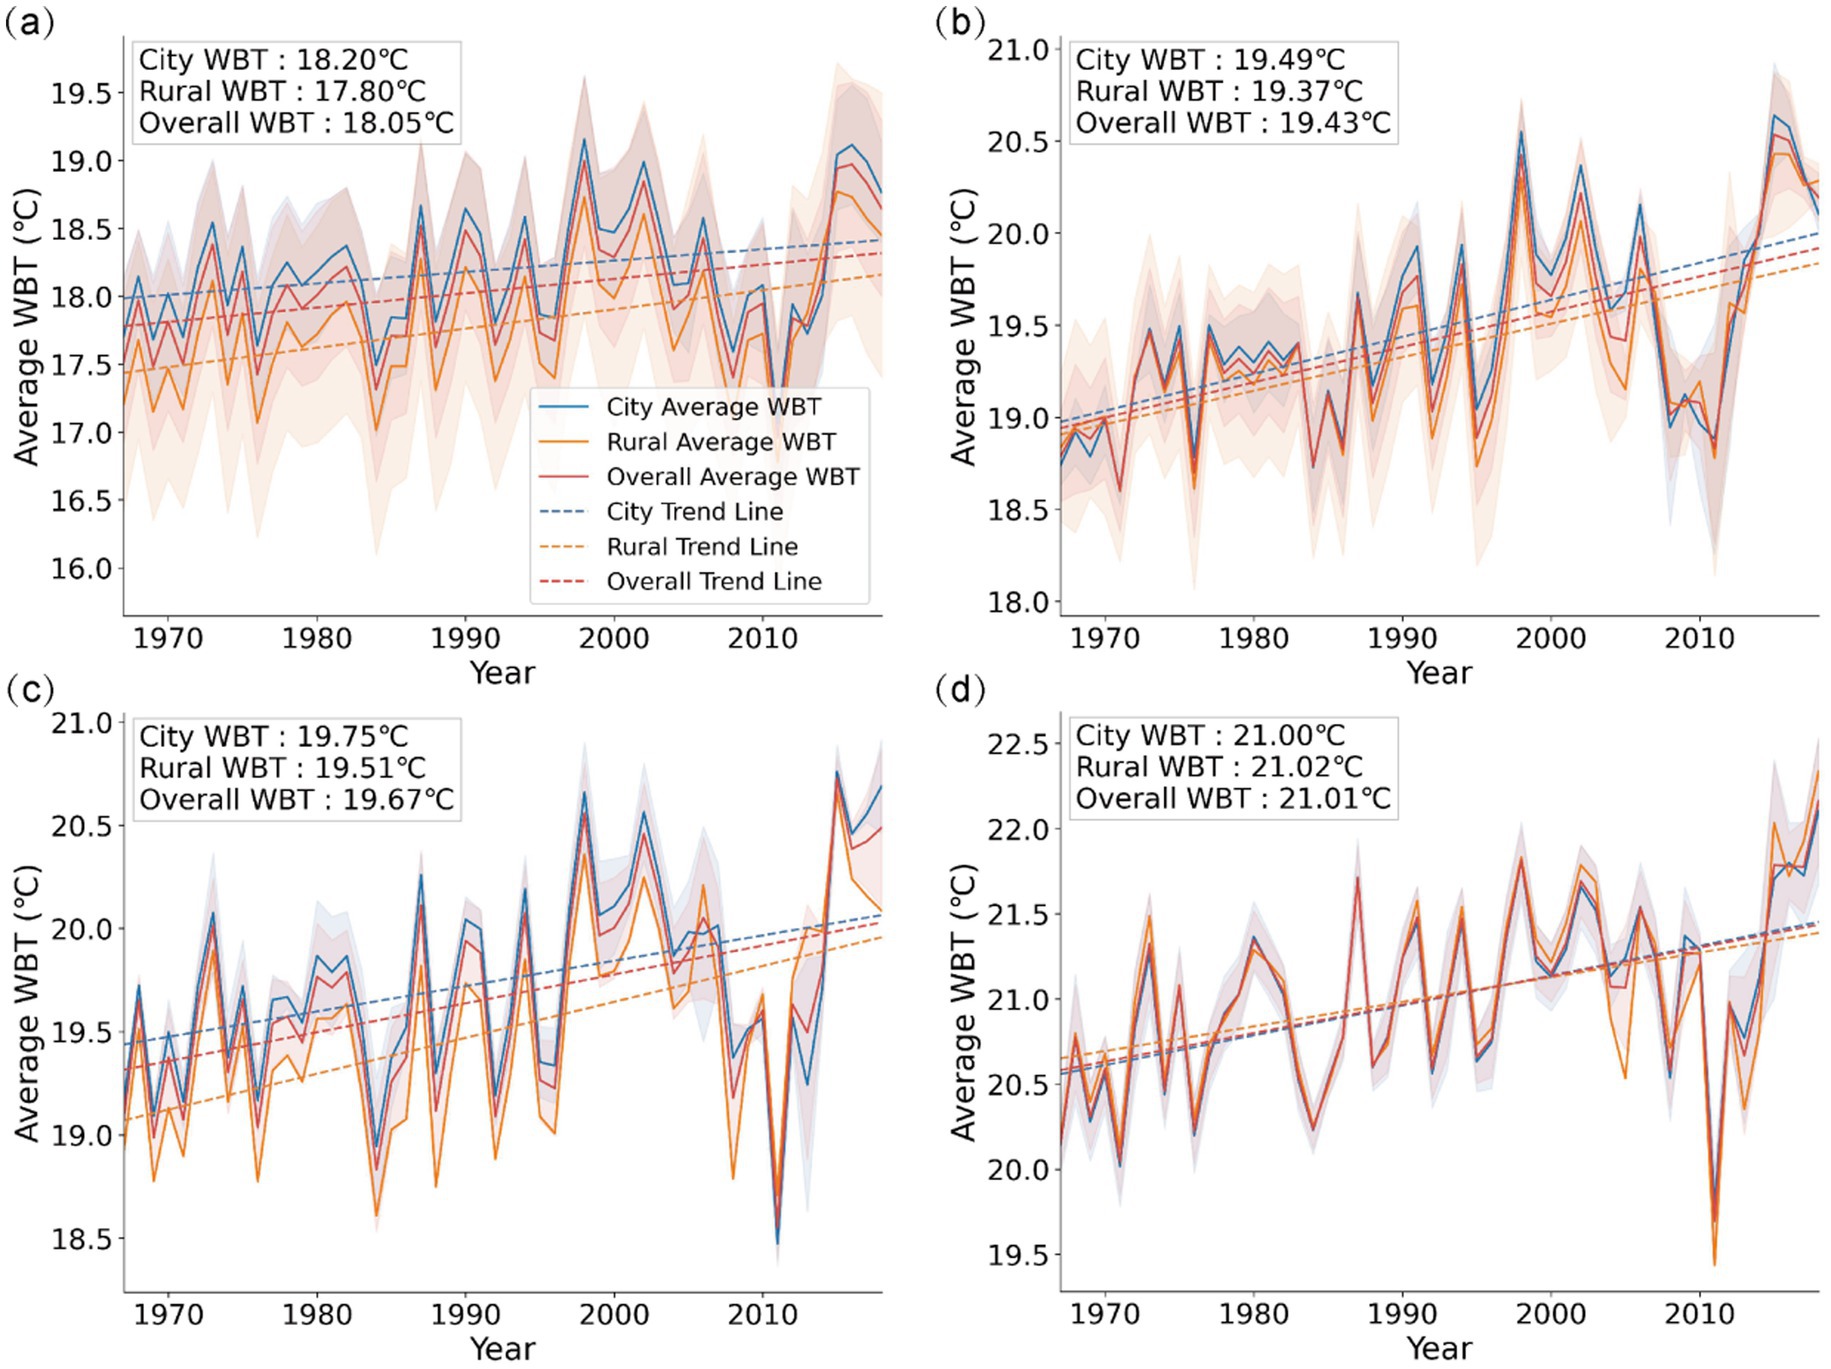
Figure 5. Regional time series of annual mean WBT from 1967–2018 for four subregions of Guangdong Province: (a) Northern mountainous area, (b) Eastern coastal area, (c) GBA urban agglomeration, and (d) Leizhou Peninsula. In each panel, solid lines represent the annual mean WBT for urban, rural, and all station groups, with shaded bands indicating ± one standard deviation. Dashed lines show the corresponding linear trends.
Urban–rural WBT trends and their resulting differences are also influenced by local climate factors across Guangdong’s diverse subregions. For instance, along the eastern coast, there are more comparable WBT warming trends between urban sites (0.201° C decade−1, p < 0.001) and their adjacent rural counterparts (0.182° C decade−1, p < 0.001), which may be explained by that sea breeze circulation may moderate local temperatures. In northern Guangdong, a mountainous region with extensive forest cover, the rural WBT warming again outpaces that observed in urban areas, with averaged urban WBT (18.20° C) being higher than the rural WBT (17.80° C).
In the GBA, characterized by advanced and mature urbanization, the average UE was −0.072° C decade−1 (p < 0.001), with the UC being the lowest among all subregions (Figure 6). This negative trend suggests that as urban centers reach advanced stages of development, urbanization ceases to be the primary driver, exacerbating the WBT difference between the city and its rural surroundings. Conversely, subregions such as the northern mountainous region and the eastern coastal region, which are still undergoing active (but not yet saturated) urbanization, generally exhibited positive or near-zero average UE and UC values. This indicates that in these developing areas, urban development continues to contribute to the observed warming of urban WBT, either by causing faster warming than in rural areas (positive UE) or by ensuring urban areas warm at least in line with regional trends (near-zero UE). The Leizhou Peninsula exhibited the highest average UE (+0.044° C decade−1, p < 0.001) and UC (21.90%), reflecting an impact of recent urban expansion that both elevates urban WBT and accounts for a substantial portion of its overall warming trend.
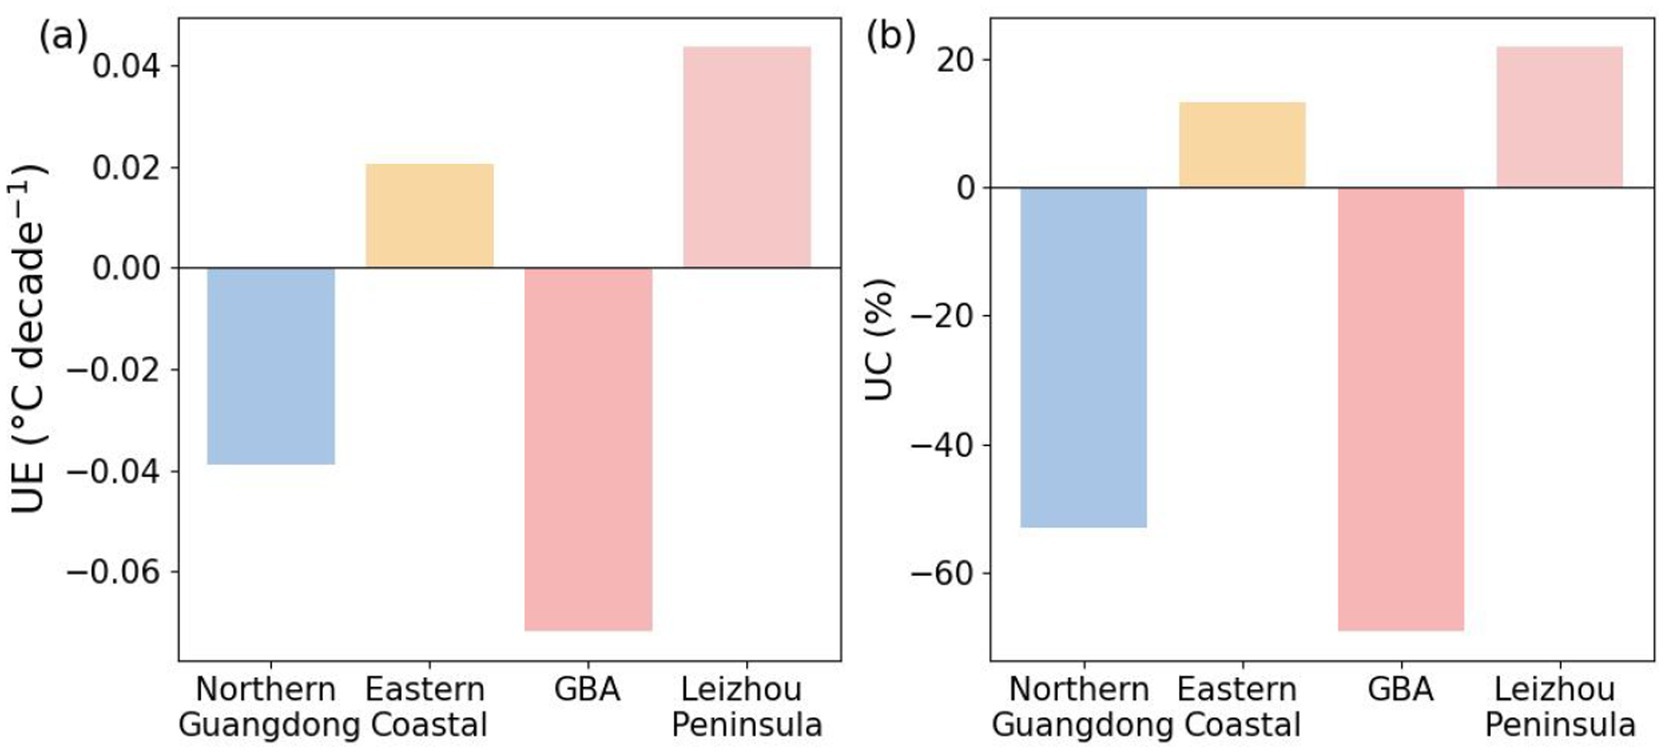
Figure 6. (a) Mean urbanization effect (UE; ° C decade−1) and (b) Urbanization Contribution (UC; %) across four subregions of Guangdong Province: Northern Guangdong, Eastern Coastal area, GBA area, and Leizhou Peninsula.
To further investigate the spatial patterns underlying the aforementioned regional variations, we examined the spatial distribution of the urban–rural WBT difference under different extreme-event conditions, including non-extreme events (i.e., normal), extreme precipitation events, high-temperature events, and compound heat-drought events (Figure 7). During periods without extreme events (Figure 7a), the urban–rural WBT difference across most of the province was modest, typically ranging between −1° C and +1° C, indicating generally weak, albeit spatially heterogeneous, urban–rural WBT differences under normal conditions. Notably, the GBA area exhibited small median WBT differences (≤1° C). In contrast, this core was encircled by a distinct ring of significantly higher WBT differences, where values frequently exceeded 2° C, with localized peaks reaching up to 4° C.
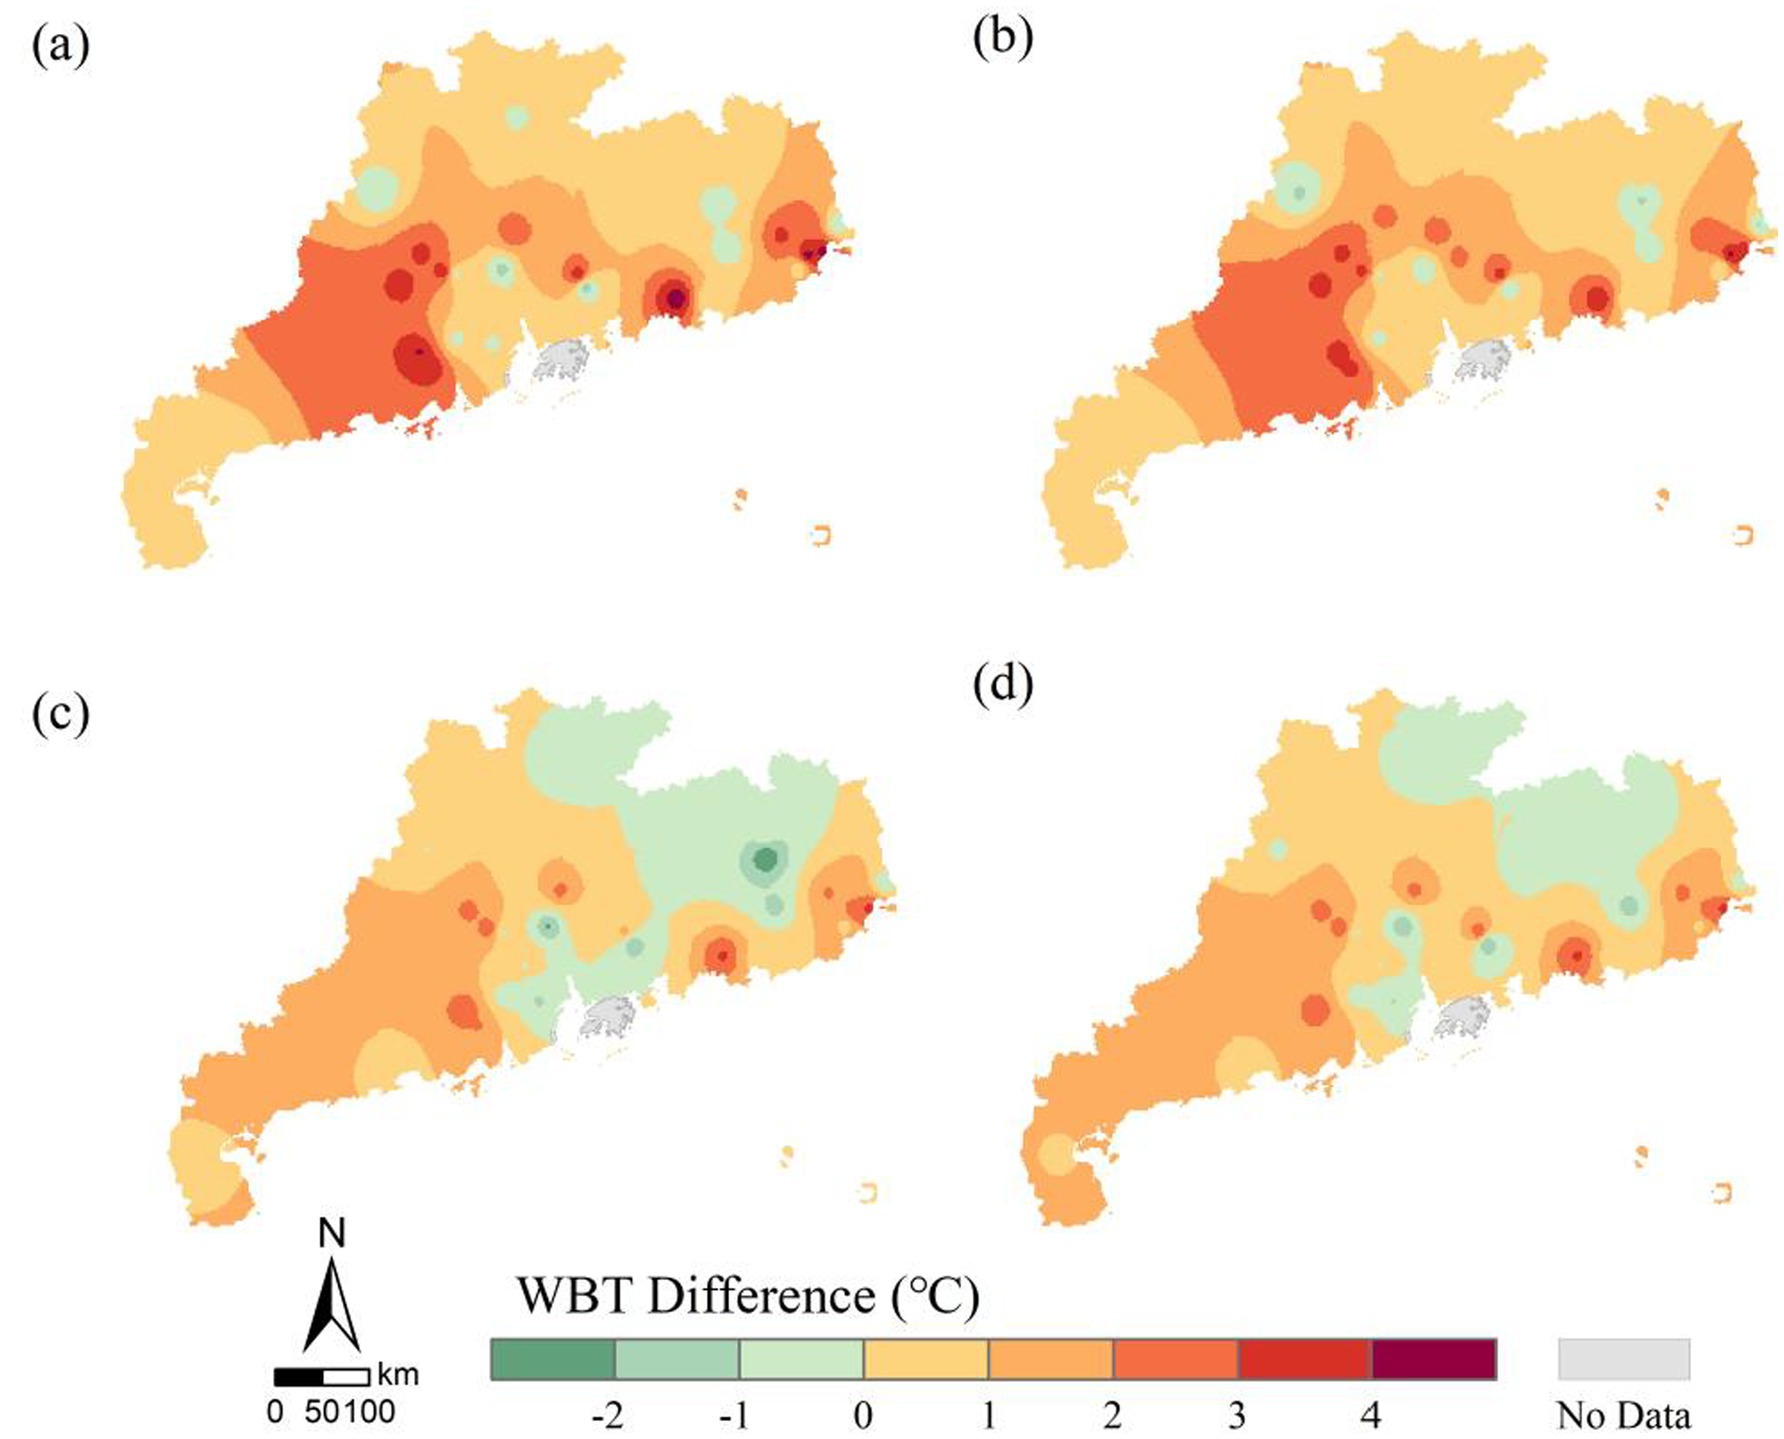
Figure 7. Spatial distribution of the median urban–rural WBT difference under different extreme-event conditions: (a) non-extreme periods; (b) extreme precipitation events; (c) high-temperature events; and (d) compound heat-drought events.
Under extreme precipitation events (Figure 7b), the spatial pattern of the urban–rural WBT difference closely resembled that of non-event periods, with most areas maintaining a similar range of values. In contrast, both high-temperature events (Figure 7c) and compound heat-drought events (Figure 7d) generally reduced in the WBT difference across most regions. Specifically, the WBT difference often decreased, and the overall range of values narrowed from approximately 6° C during non-event periods to about 4° C. Despite the general reduction, weak positive urban–rural WBT differences (i.e., urban WBT slightly higher than rural WBT) persisted in many areas. Notable exceptions were the GBA and northern mountainous regions, where a wet-bulb cold-island effect emerged, meaning urban WBT became lower than their rural counterparts. Nevertheless, the spatial pattern remained largely consistent with that of non-event periods. The Leizhou Peninsula exhibited an increase in its urban–rural WBT difference (by approximately 0.5–1.0° C) during both high-temperature and compound heat-drought events. This might be due to localized topographic and climatic factors on the peninsula partially counteracting the broader suppressive impact that high ambient temperatures typically exert on the urban–rural WBT differences.
3.4 Influence of extreme events on urban–rural WBT differences
3.4.1 Effects of heat-related events
During high-temperature (Figure 8a) and compound heat-drought events (Figure 8b), values in most regions of Guangdong are predominantly negative (Figures 9a,b), indicating a significant reduction in the urban–rural WBT difference compared to non-event periods. Spatially, the GBA and northern mountainous regions emerge as primary zones exhibiting strongly negative WBT difference, with extremes falling below −3. These negative values signify a pronounced reversal where the urban WBT drops below the rural WBT. This negative difference reaches a magnitude more than three times greater than the positive urban–rural difference typically observed during non-event periods. Correspondingly, in these locations, the urban–rural WBT difference commonly shifts from a positive range during normal periods (e.g., urban 0–1° C warmer) to a negative range (e.g., urban 0–1° C cooler), forming distinct wet-bulb cold islands. Conversely, the Leizhou Peninsula and eastern coastal areas consistently exhibit values greater than 1, with local maxima even exceeding 3. This finding points to a strong amplification effect during heat-related extreme events, wherein the warming of urban areas relative to their rural surroundings is significantly exacerbated compared to non-event conditions.
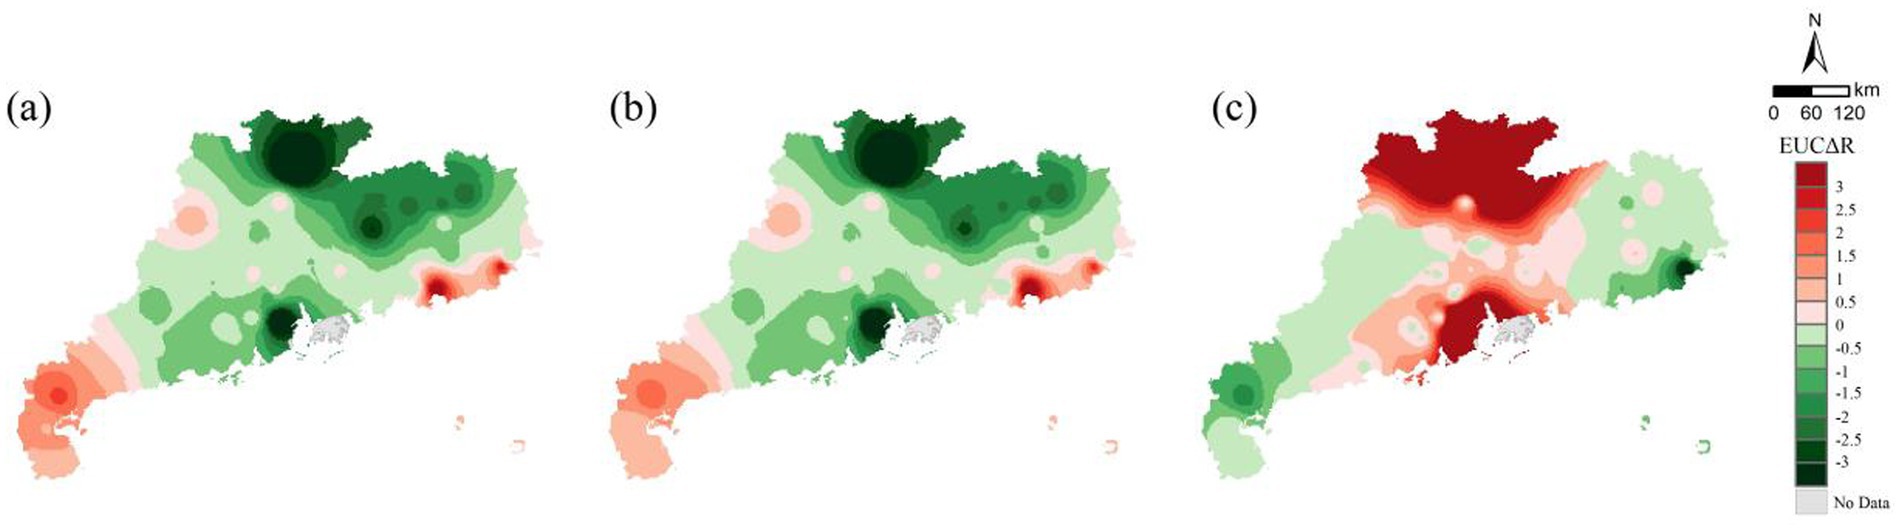
Figure 8. Spatial distribution of the Extreme Urban-Countryside Change Ratio ( ) for three different extreme events: (a) compound heat-drought events; (b) high-temperature events; and (c) extreme precipitation events.
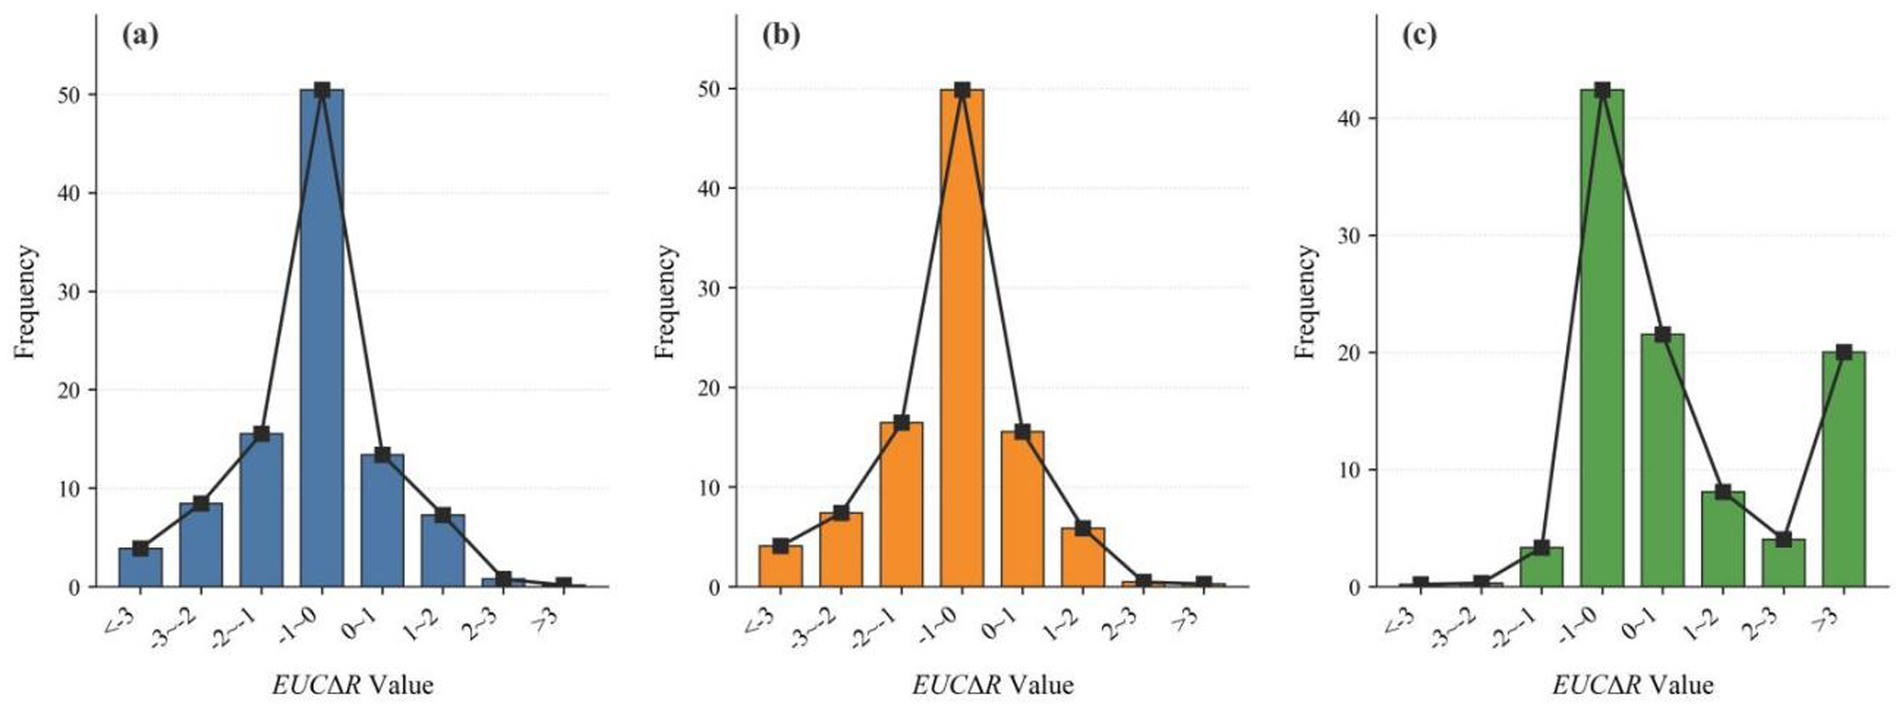
Figure 9. Frequency distribution of the for different extreme events: (a) high-temperature events; (b) compound heat-drought events; and (c) extreme precipitation events.
During heat-related extreme events, a negative value typically occurs when the WBT increase in urban areas is less pronounced than in the corresponding rural areas, thus reducing the urban–rural WBT difference. The spatial consistency in patterns between compound heat-drought events and high-temperature events alone suggests that extreme heat is the dominant driver of changes in the urban–rural WBT differences in humid subtropical regions like Guangdong. The additional influence of the drought component of compound events appears to be secondary.
3.4.2 Effects of extreme precipitation events
Extreme precipitation events induced fundamentally different spatial patterns of the urban–rural WBT difference, often leading to a partial or complete reversal of the effects observed during heat-drought and high-temperature events (Figures 8c, 9c). During these precipitation events, the overall values showed a noticeable shift towards positive values, generally indicating an enhancement of the urban–rural WBT difference across most regions.
Notably, the regional responses in exhibited a near-complete inversion compared to heat-related events. For instance, Northern Guangdong and the GBA, which previously showed negative during heat extremes, become zones with high positive values (peaks >3) during extreme precipitation. Conversely, the Leizhou Peninsula and eastern coast, which experienced amplified urban–rural WBT differences ( > 1) during heat events, transition to zones with negative (minimums < −3) under extreme precipitation. Although both urban and rural humidity levels increased during these events, urban WBTs increased more substantially in the GBA and northern regions, whereas coastal areas showed greater rural increases.
4 Discussion
4.1 Impacts of urbanization on the spatial heterogeneity of urban–rural WBT differences
Our findings reveal that urbanization’s impact on the urban–rural WBT difference is dependent on the stage of urban development, leading to significant spatial heterogeneity. In regions undergoing active urbanization, such as eastern Guangdong, a positive UE was observed, indicating that urban WBT is warming faster than in the surrounding rural areas. This is consistent with the urban heat island effect, where urbanization alters the hydrothermal properties of the surface by increasing temperature (Wu et al., 2019).
In contrast, in mature, highly urbanized centers like the GBA core, we found a negative UE, indicating that urban WBT is warming more slowly than in the countryside. This reflects a transition from a heat-island-dominated system to one where the urban dry island effect becomes more influential. In these advanced stages, the vast expanses of impervious surfaces and loss of vegetation lead to significant reductions in urban relative humidity and suppressed evapotranspiration (Luo and Lau, 2018; Pyrgou et al., 2020). This finding is corroborated by the observed long-term decrease in relative humidity across the GBA (Lin et al., 2020), where the urban dry island effect has been strengthening (Luo et al., 2022). The cooling influence of this reduced humidity on WBT can eventually outweigh the warming influence of the UHI (Du et al., 2019), causing the urban–rural WBT difference to narrow. In contrast, rural areas maintain higher humidity levels through sustained evapotranspiration, thereby experiencing a more pronounced rise in WBT as background temperatures increase (Du et al., 2016; Jiang et al., 2019).
4.2 Extreme event modulation of urban–rural WBT differences: divergent responses to heat, drought, and precipitation
High-temperature and compound heat-drought events generally reduce urban–rural WBT differences in GBA and northern mountainous areas, sometimes even leading to the emergence of wet-bulb cold island. Conversely, the Leizhou Peninsula and eastern coastal areas show enhanced urban–rural WBT differences, while extreme precipitation exhibits opposite spatial patterns. Moreover, the consistent effects of high-temperature and heat-drought events indicate that drought’s regulatory role in humid thermal environments is relatively limited.
Under high-temperature and heat-drought conditions, both urban and rural areas experience elevated air temperatures. However, changes in the urban–rural WBT differences primarily stem from the differing evaporative capacities of urban versus natural surfaces. In rural regions, the abundance of natural surfaces allows for gradual soil moisture release that helps maintain relatively higher air humidity (Luo et al., 2021). This leads to a more pronounced increase in WBT compared to urban areas, where high proportions of impervious surfaces result in lower baseline humidity (Du et al., 2019; Hao et al., 2018; Hao et al., 2023; Ward et al., 2016) and thus smaller WBT rises. This contrast is particularly evident in regions such as the GBA, where high impervious surface coverage makes urban areas significantly drier than their surroundings, and in the northern mountainous areas, where extensive forests maintain near-surface humidity through sustained transpiration during heat events. In both cases, these contrasting land surface conditions lead to a greater increase in rural WBTs.
The effect of precipitation on WBT is complex. For instance, recent studies using global gridded products and General Circulation Models found that light rain can exacerbate humid heat by increasing near-surface humidity with only a minor reduction in solar radiation, especially over arid and semi-arid regions (Zhang et al., 2024). Our study investigates extreme precipitation in a humid region, where the balance between radiative cooling and humidity enhancement varies, a dynamic that appears to be mediated by the land surface. During extreme precipitation events, as both urban and rural areas approach saturation, this land surface dependence becomes critical, particularly the difference in drainage efficiency. This reveals a paradoxical relationship in our humid region where heavy rainfall, despite its cooling effect on air temperature, may exacerbate moist-heat stress. In urban areas, the prevalence of impervious surfaces leads to rapid runoff (Miao and Tang, 1998), yet the retained surface water keeps humidity levels high (Ramamurthy and Bou-Zeid, 2014). This massive spike in local humidity may overwhelm the drop in air temperature, increasing the WBT and perceived thermal stress, to which human thermoregulation is highly sensitive (Raymond et al., 2020). In contrast, rural areas benefit from vegetation interception and swift soil infiltration (Dai et al., 1999; Zhou et al., 2009), which limits the proportion of water available for evaporation (Hao et al., 2018) and results in a relatively smaller humidity increase. Consequently, this divergence amplifies the urban–rural WBT difference, particularly in the GBA and northern regions, where urban WBTs rise more sharply.
Interactions between coastal land-sea breezes and urban systems further influence urban–rural WBT difference, with studies showing that urban-coastal microclimates can be confounded by complex interactions that favor hot-wet compound occurrences (Ganguli and Merz, 2025). For instance, during heat-drought events, sea breeze advection along the Leizhou Peninsula and the eastern coast can partially mitigate drought-induced humidity losses (Du et al., 2004) and reduce the urban–rural humidity gradient. Nevertheless, enhanced urban heat island effects in these coastal zones tend to increase the WBT differences. Under extreme precipitation, as relative humidity approaches saturation in both urban and rural areas, the modulating influence of the sea breeze diminishes. Additionally, turbulent mixing during typhoons or severe convective storms accelerates air exchange between urban and rural areas, reducing both temperature and humidity gradients and thereby narrowing the WBT differences.
4.3 Limitations and future work
The interaction between urbanization and extreme climate events is fundamentally complex and nonlinear (Zhao et al., 2021; Chen H. P. et al., 2024; Chen Y. et al., 2024). The UE and UC provide first-order estimates of the urbanization signal in station-based records (Zhong et al., 2024), while the offers a normalized measure of how extreme events alter the urban–rural WBT difference. It should be noted that these metrics are designed as diagnostic tools to capture the net outcome of such complex interactions, rather than to unravel the underlying nonlinear physics. This inherent limitation underscores that our approach is not a substitute for mechanistic modeling studies (e.g., Zhao et al., 2021), but rather complements them by providing an essential observational benchmark that quantifies the real-world magnitude of these interactions and reveals their spatial heterogeneity.
The spatial representativeness of this study is somewhat constrained by the uneven distribution of urban and rural stations. While urban stations are predominantly concentrated in the GBA, rural stations are mainly situated in northern Guangdong. As a result, some rural stations could not be paired with urban counterparts, and certain urban stations lacked nearby rural stations for comparison. This spatial imbalance may impact the representativeness of the UE and UC indicators, potentially affecting the generalizability of the regional analysis.
Furthermore, our station-based approach cannot resolve the fine-scale spatial heterogeneity of WBT. Future research should leverage high-resolution meteorological grid data and atmospheric models (e.g., Weather Research and Forecasting model with an urban canopy scheme) to overcome the above limitations. Such an approach would allow for a more detailed analysis of the thermodynamic and dynamic processes at the sub-city scale, enabling a clearer attribution of the mechanisms driving WBT changes during and after extreme precipitation events.
5 Conclusion
This study investigates how urbanization and extreme events combine to affect WBT dynamics in the humid Guangdong Province. Using five decades of meteorological data from paired urban–rural stations, we show that the urban–rural WBT difference is controlled by a complex interaction between the stage of urbanization and the type of extreme weather event.
Urbanization’s influence on urban–rural WBT difference is stage-dependent. Initially, the urban heat island effect typically widens these WBT disparities (an average rate of 0.0027° C decade−1). However, in mature urban cores, such as within the GBA, the emergence of urban dry island effect can reduce local humidity and subsequently narrow the urban–rural WBT difference gap. Furthermore, extreme events significantly alter these patterns. High-temperature and compound heat-drought conditions tend to diminish or even reverse the urban–rural WBT difference in many urban interiors, while enhancing this difference in certain coastal regions like the Leizhou Peninsula. In contrast, extreme precipitation events often enhance urban humidity retention, generally leading to an amplification of urban–rural WBT differences and a reversal of the spatial response patterns seen during heat-related extreme events. These complex interactions underscore the regulation of wet-heat stress by the stage of urbanization, prevailing hydrothermal feedback mechanisms, and regional geo-climatic conditions, highlighting the need for further research into their coupled effects.
This study used Guangdong Province, including the GBA, as a representative example of rapidly urbanizing humid regions. It provides insights into the impacts of extreme events under ongoing global urbanization, particularly within megacity clusters and other densely populated areas.
Data availability statement
The original contributions presented in the study are included in the article/supplementary material, further inquiries can be directed to the corresponding author.
Author contributions
SH: Conceptualization, Formal analysis, Investigation, Methodology, Validation, Visualization, Writing – original draft, Writing – review & editing. ZS: Conceptualization, Data curation, Formal analysis, Investigation, Methodology, Validation, Visualization, Writing – original draft, Writing – review & editing. GC: Conceptualization, Data curation, Formal analysis, Funding acquisition, Investigation, Methodology, Project administration, Resources, Supervision, Writing – original draft, Writing – review & editing. YH: Investigation, Writing – review & editing. ZD: Investigation, Writing – review & editing. SL: Investigation, Writing – review & editing.
Funding
The author(s) declare that financial support was received for the research and/or publication of this article. This research was supported by the Guangzhou Basic and Applied Basic Research Foundation (2024A04J3814), the National Natural Science Foundation of China (42301012), the National Key R&D Program of China (2024YFD1700801), the 100 Talents Plan Foundation of Sun Yat-sen University (37000-12230030), and the Fundamental Research Funds for the Central Universities of Ministry of Education of China (24qnpy020).
Acknowledgments
The authors very grateful to the reviewers for their insightful comments and suggestions, which have substantially strengthened our work.
Conflict of interest
The authors declare that the research was conducted in the absence of any commercial or financial relationships that could be construed as a potential conflict of interest.
Generative AI statement
The authors declare that no Gen AI was used in the creation of this manuscript.
Any alternative text (alt text) provided alongside figures in this article has been generated by Frontiers with the support of artificial intelligence and reasonable efforts have been made to ensure accuracy, including review by the authors wherever possible. If you identify any issues, please contact us.
Publisher’s note
All claims expressed in this article are solely those of the authors and do not necessarily represent those of their affiliated organizations, or those of the publisher, the editors and the reviewers. Any product that may be evaluated in this article, or claim that may be made by its manufacturer, is not guaranteed or endorsed by the publisher.
References
Ali, R., Haque, N. U., Ishrat, H., and Arif, G. (2013). Estimating urbanization, vol. 16. Lahore, Pakistan: The Urban Unit.
Cai, Z., and Deng, Z. (2020). Measurement of China's spatial urbanization level and analysis of its influencing factors: evidence from a provincial geographically weighted regression model. J. Zhengzhou Univ. 53, 48–54.
Chen, H. P., He, W. Y., and Zhang, S. H. (2024). Recent urbanization increases exposure to humid-heat extreme events over populated regions of China. Atmos. Ocean. Sci. Lett. 17:100409. doi: 10.1016/j.aosl.2023.100409
Chen, Y., Zhang, R., Alekouei, S. A., and Amani-Beni, M. (2024). Nonlinear impacts of landscape and climatological interactions on urban thermal environment during a hot and rainy summer. Ecol. Indic. 166:112551. doi: 10.1016/j.ecolind.2024.112551
Cho, H. (2022). Effects of road components and roadside vegetation on temperature reduction in Seoul considering air, wet-bulb globe, and surface temperatures. Sustainability 14:16663. doi: 10.3390/su142416663
Clayton, S. (2020). Climate anxiety: psychological responses to climate change. J. Anxiety Disord. 74:102263. doi: 10.1016/j.janxdis.2020.102263
Dai, A., Trenberth, K. E., and Karl, T. R. (1999). Effects of clouds, soil moisture, precipitation, and water vapor on diurnal temperature range. J. Clim. 12, 2451–2473. doi: 10.1175/1520-0442(1999)012<2451:EOCSMP>2.0.CO;2
Ding, T., Li, X., and Gao, H. (2022). An unprecedented high temperature event in southern China in autumn 2021 and the essential role of the mid-latitude trough. Adv. Clim. Chang. Res. 13, 772–777. doi: 10.1016/j.accre.2022.11.002
Du, Y., Liu, J., and Song, L. (2004). Characteristics, causes and countermeasures of drought in Leizhou peninsula. Agric. Res. Arid Areas. 22, 28–31. doi: 10.7606/j.issn.1000-7601.2004.01.06
Du, J., Wang, K., Jiang, S., Cui, B., Wang, J., Zhao, C., et al. (2019). Urban dry island effect mitigated urbanization effect on observed warming in China. J. Clim. 32, 5705–5723. doi: 10.1175/JCLI-D-18-0712.1
Du, H., Wang, D., Wang, Y., Zhao, X., Qin, F., Jiang, H., et al. (2016). Influences of land cover types, meteorological conditions, anthropogenic heat and urban area on surface urban heat island in the yangtze river delta urban agglomeration. Sci. Total Environ. 571, 461–470. doi: 10.1016/j.scitotenv.2016.07.012
Ebi, K. L., Capon, A., Berry, P., Broderick, C., de Dear, R., Havenith, G., et al. (2021). Hot weather and heat extremes: health risks. Lancet 398, 698–708. doi: 10.1016/S0140-6736(21)01208-3
Fu, P., and Weng, Q. H. (2016). A time series analysis of urbanization induced land use and land cover change and its impact on land surface temperature with Landsat imagery. Remote Sens. Environ. 175, 205–214. doi: 10.1016/j.rse.2015.12.040
Ganguli, P., and Merz, B. (2025). Increasing probability of extreme rainfall preconditioned by humid heatwaves in global coastal megacities. NPJ Clim. Atmos. Sci. 8:144. doi: 10.1038/s41612-025-01023-x
Han, H. Q., Su, Z. H., Zhang, K. X., and Bai, Y. M. (2024). Impact of extreme weather events on ecosystem services. Appl. Ecol. Environ. Res. 22, 3577–3602. doi: 10.15666/aeer/2204_35773602
Hanson, S., Nicholls, R., Ranger, N., Hallegatte, S., Corfee-Morlot, J., Herweijer, C., et al. (2011). A global ranking of port cities with high exposure to climate extremes. Clim. Chang. 104, 89–111. doi: 10.1007/s10584-010-9977-4
Hao, L., Huang, X., Qin, M., Liu, Y., Li, W., and Sun, G. (2018). Ecohydrological processes explain urban dry island effects in a wet region, southern China. Water Resour. Res. 54, 6757–6771. doi: 10.1029/2018WR023002
Hao, L., Sun, G., Huang, X., Tang, R., Jin, K., Lai, Y., et al. (2023). Urbanization alters atmospheric dryness through land evapotranspiration. NPJ Clim. Atmos. Sci. 6:149. doi: 10.1038/s41612-023-00479-z
Härdle, W., Horowitz, J., and Kreiss, J. (2003). Bootstrap methods for time series. Int. Stat. Rev. 71, 435–459. doi: 10.1111/j.1751-5823.2003.tb00485.x
Hui, E., Li, X., Chen, T. T., and Lang, W. (2020). Deciphering the spatial structure of China's megacity region: a new bay area-the Guangdong-Hong Kong-Macao greater bay area in the making. Cities 105:102168. doi: 10.1016/j.cities.2018.10.011
Ivanovich, C., Anderson, W., Horton, R., Raymond, C., and Sobel, A. (2022). The influence of intraseasonal oscillations on humid heat in the persian gulf and south asia. J. Clim. 35, 4309–4329. doi: 10.1175/JCLI-D-21-0488.1
Jiang, Y. t., Hao, Z. c., and Feng, S. f. (2023). Spatiotemporal evolution characteristics of compound extreme heat and drought events in the Yangtze and Yellow River basins. Water Resour. Prot. 39, 70–77. doi: 10.3880/j.issn.1004-6933.2023.02.009
Jiang, S., Lee, X., Wang, J., and Wang, K. (2019). Amplified urban heat islands during heat wave periods. J. Geophys. Res. Atmos. 124, 7797–7812. doi: 10.1029/2018JD030230
Jiang, P., Wang, D. g., and Chen, X. h. (2015). Temporal and spatial characteristics and causes of extreme precipitation events in Guangdong Province in recent 50 years. J. China Hydrol. 35, 77–84.
Jiang, S., Wang, K., and Mao, Y. (2020). Rapid local urbanization around most meteorological stations explain the observed daily asymmetric warming rates across China from 1985 to 2017. J. Clim. 33, 9045–9061. doi: 10.1175/JCLI-D-20-0118.1
Jiao, Y., Zhao, N., and Yue, T. (2020). Impact of urbanization on extreme climate in Beijing. Geogr. Res. 39, 461–472. doi: 10.11821/dlyj020181343
Jones, G. W. (2005). Cities transformed:demographic change and its implications in the developing world. Popul. Stud. 59:259.
Justine, J., Monteiro, J. M., Shah, H. R., and Rao, N. T. (2023). The diurnal variation of wet bulb temperatures and exceedance of physiological thresholds relevant to human health in south asia. Commun. Earth Environ. 4:244. doi: 10.1038/s43247-023-00897-0
Khan, M., Bhattarai, R., and Chen, L. (2023). Elevated risk of compound extreme precipitation preceded by extreme heat events in the upper midwestern United States. Atmos. 14:1440. doi: 10.3390/atmos14091440
Liang, K., Ren, X. b., and Zhang, Y. (2022). Spatiotemporal variation analysis of urban heat island and land cover in Pearl River Delta urban agglomeration. Geospat. Inf. 20, 36–40. doi: 10.3969/j.issn.1672-4623.2022.09.008
Lin, L., Chan, T. O., Ge, E., Wang, X., Zhao, Y., Yang, Y., et al. (2020). Effects of urban land expansion on decreasing atmospheric moisture in Guangdong, South China. Urban Clim. 32:100626. doi: 10.1016/j.uclim.2020.100626
Lu, Y., Yang, Y., Wu, X., Wang, L., Wan, Z., Zheng, Z., et al. (2021). Spatiotemporal variations of wet-bulb temperature and its impact factors of Nanjing urban neighborhood. J. Appl. Ecol. 32, 4223–4236. doi: 10.13287/j.1001-9332.202112.012
Luo, M., and Lau, N. (2018). Increasing heat stress in urban areas of eastern China: acceleration by urbanization. Geophys. Res. Lett. 45:13-60, 69. doi: 10.1029/2018GL080306
Luo, M., and Lau, N. C. (2021). Increasing human-perceived heat stress risks exacerbated by urbanization in China: a comparative study based on multiple metrics. Earth Future 9:e2020EF001848. doi: 10.1029/2020EF001848
Luo, Z., Liu, J., Shao, W., Zhou, J., and Jia, R. (2022). Distribution of dry and wet islands in the pearl river delta urban agglomeration using numerical simulations. Atmos. Res. 273:106170. doi: 10.1016/j.atmosres.2022.106170
Luo, Z., Liu, J., Zhang, Y., Zhou, J., Yu, Y., and Jia, R. (2021). Spatiotemporal characteristics of urban dry/wet islands in China following rapid urbanization. J. Hydrol. 601:126618. doi: 10.1016/j.jhydrol.2021.126618
Miao, M., and Tang, Y. (1998). Interaction between summer sea-land breeze and heat island circulation in Yangtze River Delta and the impact of urbanization. Plateau Meteorol. 17, 59–68.
Newman, R., and Noy, I. (2023). The global costs of extreme weather that are attributable to climate change. Nat. Commun. 14:6103. doi: 10.1038/s41467-023-41888-1
Pyrgou, A., Hadjinicolaou, P., and Santamouris, M. (2020). Urban-rural moisture contrast: regulator of the urban heat island and heatwaves’ synergy over a mediterranean city. Environ. Res. 182:109102. doi: 10.1016/j.envres.2019.109102
Qin, D. h., Zhang, J. y., and Shan, C. c. (2015). China National Assessment Report on extreme weather, climate events and disaster risk management and adaptation (Chinese version). Beijing: Science Press.
Qu, Q., Xu, H. W., Ai, Z. M., Wang, M. G., Wang, G. L., Liu, G. B., et al. (2023). Impacts of extreme weather events on terrestrial carbon and nitrogen cycling: a global meta-analysis. Environ. Pollut. 319:120996. doi: 10.1016/j.envpol.2022.120996
Rahman, M. A., Franceschi, E., Pattnaik, N., Moser-Reischl, A., Hartmann, C., Paeth, H., et al. (2022). Spatial and temporal changes of outdoor thermal stress: influence of urban land cover types. Sci. Rep. 12:671. doi: 10.1038/s41598-021-04669-8
Ramamurthy, P., and Bou-Zeid, E. (2014). Contribution of impervious surfaces to longer-time urban evaporation. Water Resour. Res. 50, 2889–2902. doi: 10.1002/2013WR013909
Raymond, C., Matthews, T., and Horton, R. M. (2020). The emergence of heat and humidity too severe for human tolerance. Sci. Adv. 6:eaaw1838. doi: 10.1126/sciadv.aaw1838
Shreevastava, A., Raymond, C., and Hulley, G. (2023). Contrasting intraurban signatures of humid and dry heatwaves over southern California. J. Appl. Meteorol. Climatol. 62, 709–720. doi: 10.1175/JAMC-D-22-0149.1
Stull, R. (2011). Wet-bulb temperature from relative humidity and air temperature. J. Appl. Meteorol. Climatol. 50, 2267–2269. doi: 10.1175/JAMC-D-11-0143.1
Walsh, J. E., Ballinger, T. J., Euskirchen, E. S., Hanna, E., Mård, J., Overland, J. E., et al. (2020). Extreme weather and climate events in northern areas: a review. Earth-Sci. Rev. 209:103324. doi: 10.1016/j.earscirev.2020.103324
Wang, P., Leung, L., Lu, J., Song, F., and Tang, J. (2019). Extreme wet-bulb temperatures in China: the significant role of moisture. J. Geophys. Res. Atmos. 124, 11944–11960. doi: 10.1029/2019JD031477
Wang, Y., Wang, D., and Gao, M. (2022). Impacts of climate change on human health: an interpretation of IPCC AR6 WGII. Trans. Atmos. Sci. 45, 520–529. doi: 10.13878/j.cnki.dqkxxb.20220508011
Ward, K., Lauf, S., Kleinschmit, B., and Endlicher, W. (2016). Heat waves and urban heat islands in europe: a review of relevant drivers. Sci. Total Environ. 569-570, 527–539. doi: 10.1016/j.scitotenv.2016.06.119
Wong, N. H., Tan, C. L., Kolokotsa, D. D., and Takebayashi, H. (2021). Greenery as a mitigation and adaptation strategy to urban heat. Nat. Rev. Earth Environ. 2, 166–181. doi: 10.1038/s43017-020-00129-5
Wu, H. y., and Du, Y. d. (2011). Climatic characteristics and variation of high temperature in Guangdong in recent 49 years. J. Trop. Meteorol. 27, 427–432.
Wu, Z. x., Zhang, Q., and Song, Z. q. (2019). Spatiotemporal differential impacts of urbanization on air temperature in the Pearl River Delta. Acta Geograph. Sin. 74, 2342–2357. doi: 10.11821/dlxb201911011
Yao, R., Hu, Y. Q., Sun, P., Bian, Y. J., Liu, R. L., Zhang, S. L., et al. Effects of urbanization on heat waves based on the wet-bulb temperature in the yangtze river delta urban agglomeration, China. Urban Clim. 41:101067. doi: 10.1016/j.uclim.2021.101067
Ye, Z. Q., Song, S., and Zhong, R. F. (2022). Temporal and spatial evolution of climate comfort and population exposure in Guangdong Province in the last half century. Atmosphere 13:502. doi: 10.3390/atmos13030502
Yin, J., Guo, S., and Wang, J. (2023). Thermodynamic driving mechanisms and eco-hydrological effects of global extreme precipitation. Sci. China Earth Sci. 53, 96–114. doi: 10.1360/SSTe-2022-0100
Zhang, K., Cao, C., Chu, H., Zhao, L., Zhao, J., and Lee, X. (2023). Increased heat risk in wet climate induced by urban humid heat. Nature 617, 738–742. doi: 10.1038/s41586-023-05911-1
Zhang, Z., Wang, Y., Zhang, G. J., Xing, C., Xia, W., and Yang, M. (2024). Light rain exacerbates extreme humid heat. Nat. Commun. 15:7326. doi: 10.1038/s41467-024-51778-9
Zhang, P., Yan, J. p., and Li, Y. j. (2018). Variation characteristics of summer heatwaves in Guangdong and Guangxi from 1960 to 2015. J. Zhejiang Univ. 45, 73–81. doi: 10.3785/j.issn.1008-9497.2018.01.012
Zhang, L., Zhou, G. S., Ji, Y. H., and Bai, Y. F. (2017). Grassland carbon budget and its driving factors of the subtropical and tropical monsoon region in China during 1961 to 2013. Sci. Rep. 7:14717. doi: 10.1038/s41598-017-15296-7
Zhao, L., Oleson, K., Bou-Zeid, E., Krayenhoff, E. S., Bray, A., Zhu, Q., et al. (2021). Global multi-model projections of local urban climates. Nat. Clim. Chang. 11, 152–157. doi: 10.1038/s41558-020-00958-8
Zhong, R., Song, S., Zhang, J., and Ye, Z. (2024). Spatial–temporal variation and temperature effect of urbanization in Guangdong Province from 1951 to 2018. Environ. Dev. Sustain. 26, 9661–9683. doi: 10.1007/s10668-023-03113-3
Zhou, L., Dai, A., Dai, Y., Vose, R. S., Zou, C., Tian, Y., et al. (2009). Spatial dependence of diurnal temperature range trends on precipitation from 1950 to 2004. Clim. Dyn. 32, 429–440. doi: 10.1007/s00382-008-0387-5
Keywords: extreme events, urbanization, urban–rural wet-bulb temperature differences, urban agglomeration, climate warming
Citation: Huang S, Su Z, Cui G, Huang Y, Deng Z and Lin S (2025) The Greater Bay Area as a hotspot: interacting impacts of urbanization and extreme events on wet-bulb temperatures in Guangdong Province. Front. Clim. 7:1653561. doi: 10.3389/fclim.2025.1653561
Edited by:
Xixi Wang, Old Dominion University, United StatesReviewed by:
Qianrong Ma, Yangzhou University, ChinaGoran Trbic, University of Banjaluka, Bosnia and Herzegovina
Copyright © 2025 Huang, Su, Cui, Huang, Deng and Lin. This is an open-access article distributed under the terms of the Creative Commons Attribution License (CC BY). The use, distribution or reproduction in other forums is permitted, provided the original author(s) and the copyright owner(s) are credited and that the original publication in this journal is cited, in accordance with accepted academic practice. No use, distribution or reproduction is permitted which does not comply with these terms.
*Correspondence: Guotao Cui, Y3VpZ3RAbWFpbC5zeXN1LmVkdS5jbg==