 Sinan Wang1
 Kairan Xu1Xiaoming Ma2*Wei Hu1Jianwei Zhao3Fuqiang Wang3Donghui Su2Zhuo Zhang2Yingjie Wu1Mingyang Li4
- 1Institute of Water Resources of Pastoral Area Ministry of Water Resources, Hohhot, China
- 2Water Resources Research Institute of Inner Mongolia Autonomous Region, Hohhot, China
- 3College of Water Conservancy and Civil Engineering, Inner Mongolia Agricultural University, Hohhot, China
- 4Water Resources Research Institute of Shandong Province, Jinan, China
The Inner Mongolia section of the Yellow River Basin is a critical ecological barrier and core production base (energy, agriculture, animal husbandry) in northern China, where water resource security and ecological sustainability directly affect regional and national development. Drought is a major constraint on the basin’s ecosystem and production activities, but its long-term spatial-temporal patterns and driving mechanisms remain insufficiently understood. Here, we used MOD16 evapotranspiration data (2001-2024) to construct the Crop Water Stress Index (CWSI), aiming to clarify drought evolution in the region, and applied the Geodetector model to identify key drivers of CWSI spatial heterogeneity and their interactions. Our results showed that: (1) Potential evapotranspiration (PET) and CWSI had stable interannual fluctuations, while actual evapotranspiration (ET) exhibited significant interannual variability; the average CWSI was 0.85, indicating long-term severe drought in the study area. (2) Spatially, most regions were in severe drought, but >76% of the area showed a significant downward CWSI trend (drought alleviation). (3) All land use types had decreasing CWSI; water bodies had the highest CWSI and cropland the lowest—opposite to the ET ranking. (4) NDVI and air temperature were the primary drivers of CWSI spatial variability (average q-values >0.5). The strongest interactive effects on CWSI heterogeneity were between precipitation and temperature (q: 0.72-0.95) and between precipitation and DEM (q: 0.78-0.93), with both interactive q-values >0.81. These findings reveal that drought in the basin is regulated more by ET than PET, and is driven by the synergy of meteorological factors (precipitation, temperature) and topographic factors (DEM). They provide a scientific basis for drought prediction, water resource management, and ecological protection in the Yellow River Basin, and offer a reference for similar arid/semi-arid regions globally.
1 Introduction
Drought, as the natural disaster with the longest duration, the highest frequency, and the widest area involved, has caused great harm to the survival wealth of human beings and the sustained economic and social development globally (Ren H. et al., 2024; Suo et al., 2024). Under the background of global warming, the degree, frequency, and impact range of drought are further increasing (Niazkar et al., 2025; Wu F. et al., 2024) The Inner Mongolia section of the Yellow River Basin is in the arid and semi-arid transition zone in the northern part of China, with a fragile ecological environment, prominent contradiction between the supply and demand of water resources, and the frequent occurrence of droughts severely restricts the local agricultural and animal husbandry production and ecological security (Abu Arra and Şişman, 2024; Ge et al., 2024; Peng et al., 2024). Therefore, clarifying the spatial and temporal characteristics of droughts in the Inner Mongolia section of the Yellow River Basin is of great significance for safeguarding agricultural production and food security (guiding irrigation, crop yield estimation), maintaining the stability of ecosystems (curbing desertification, protecting biodiversity), optimizing the management of water resources (balancing supply and demand, responding to climate change), and guarding against secondary disasters and supporting the implementation of national strategies.
Currently, many relatively effective drought monitoring methods have been developed. The traditional drought monitoring method is based on station data to calculate drought index, to monitor the occurrence and development of drought; however, the traditional method is often due to the uneven distribution of stations and limited data, so it is not able to carry out large-scale drought monitoring, and cannot reflect the characteristics of regional drought spatial and temporal changes in a timely and effective manner (Kumar and Chu, 2024; Mukhtar et al., 2024; Zhang et al., 2024a). Compared with the traditional methods, the development of remote sensing science and technology can make up for these shortcomings. Drought monitoring indices based on remote sensing data include Vegetation Condition Index (VCI) (Yin et al., 2024), Temperature Vegetation Dryness Index (TVDI) (Khosravi et al., 2024), Vegetation Supply Water Index (VSWI) (Wei et al., 2024), Crop Water Stress Index (CWSI) (Kim et al., 2025), and so on. Among them, CWSI integrates the roles of climatic elements such as surface wind speed, sunshine hours, water vapour pressure, air temperature and so on, based on the theory of energy balance principle, which has high measurement accuracy and clear physical significance, and has been widely used in drought research (Chen H. et al., 2024; Irik et al., 2024; Yi and Wenjiao, 2024). However, most of these studies did not consider the influence of multidimensional factors such as climate elements, soil texture, land use and other factors in the drought formation mechanism on the dependence of CWSI, which will inevitably lead to errors in the accurate monitoring of drought by CWSI.
Drought is affected by a variety of factors, including meteorological (precipitation, air temperature), environmental factors such as soil (soil texture, topographic factors) and vegetation (vegetation type), as well as human activities (Alzurqani et al., 2024; Wu H. et al., 2024; Zhao W. et al., 2024). Many scholars have carried out a series of studies on the drivers of drought change, and the main methods include Pearson correlation, partial correlation, complex correlation, etc. Correlation analysis can quickly clarify the degree of influence of each driver on drought from the whole (Li L. et al., 2024). However, traditional correlation analyses mostly focus on the independent effects of a single factor, making it difficult to accurately reveal the interactive effects among multiple factors, and there are limitations in dealing with nonlinear relationships and spatial heterogeneity. For example, it is not possible to quantify the synergistic or antagonistic effects of different factor combinations on drought, and it is also difficult to reflect the differences in driving effects with geographic regions, which leads to a lack of in-depth analysis of drought-driving mechanisms, and it is difficult to satisfy the refined needs of drought causation research in complex environments (Wu J. et al., 2024). Compared with the correlation analysis method, the parametric optimal geoprobe can clarify the dominant factors affecting drought changes by comparing the explanatory power of each driving factor on drought, and also reveal the driving force behind it, without the limitation of time lag effect, and at the same time, it is able to analyse the analysis by coupling the natural and other influencing factors, and the results of the study have a higher reliability and practicality (Li et al., 2024b; Wang and Yang, 2024; Zhao X. et al., 2024).
Drought is one of the most common natural disasters in the Inner Mongolia section of the Yellow River Basin, which has a serious impact on agricultural and animal husbandry production as well as the lives of farmers and herdsmen in general, as the soil moisture is poor and crop yields are reduced in light cases, and the surface of the ground is cracked in heavy cases, with crop extinction and difficulties in drinking water for both humans and animals. In view of this, the main research objectives of this paper are (1) to study the spatial and temporal evolution patterns of ET, PET and CWSI, and to reveal the drought changes; (2) to analyse the spatial variability characteristics of CWSI and the future trends of the changes; and (3) to quantitatively evaluate the digital elevation model (DEM), Aspect, Slope, Clay, Sand, Silt, normalized difference vegetation index (NDVI), precipitation (Pre), temperature (TEM), land use and land cover change (LUCC), and other 10 factors on CWSI and the effects of these factors on CWSI and the interactions among the factors were investigated. The results of this study can provide a scientific basis for the ecological protection and optimal allocation of water resources in the Yellow River Basin.
2 Materials and methods
2.1 Study area
The Inner Mongolia section of the Yellow River Basin (106°59′E ~ 110°10′E, 38°26’N ~ 42°50’N) is in the middle and upper reaches of the Yellow River, with a watershed area of 155,000km2, including 7 alliance cities and 42 flag counties (districts) in the Inner Mongolia Autonomous Region. The main stream of the Yellow River enters the Inner Mongolia Autonomous Region from the junction of Ningmeng and Mongolia, and flows through Alashan League, Bayannur, Ordos, Baotou and Hohhot in turn. The length of the main stream of the Yellow River in Inner Mongolia is 843.5 km (Figure 1).
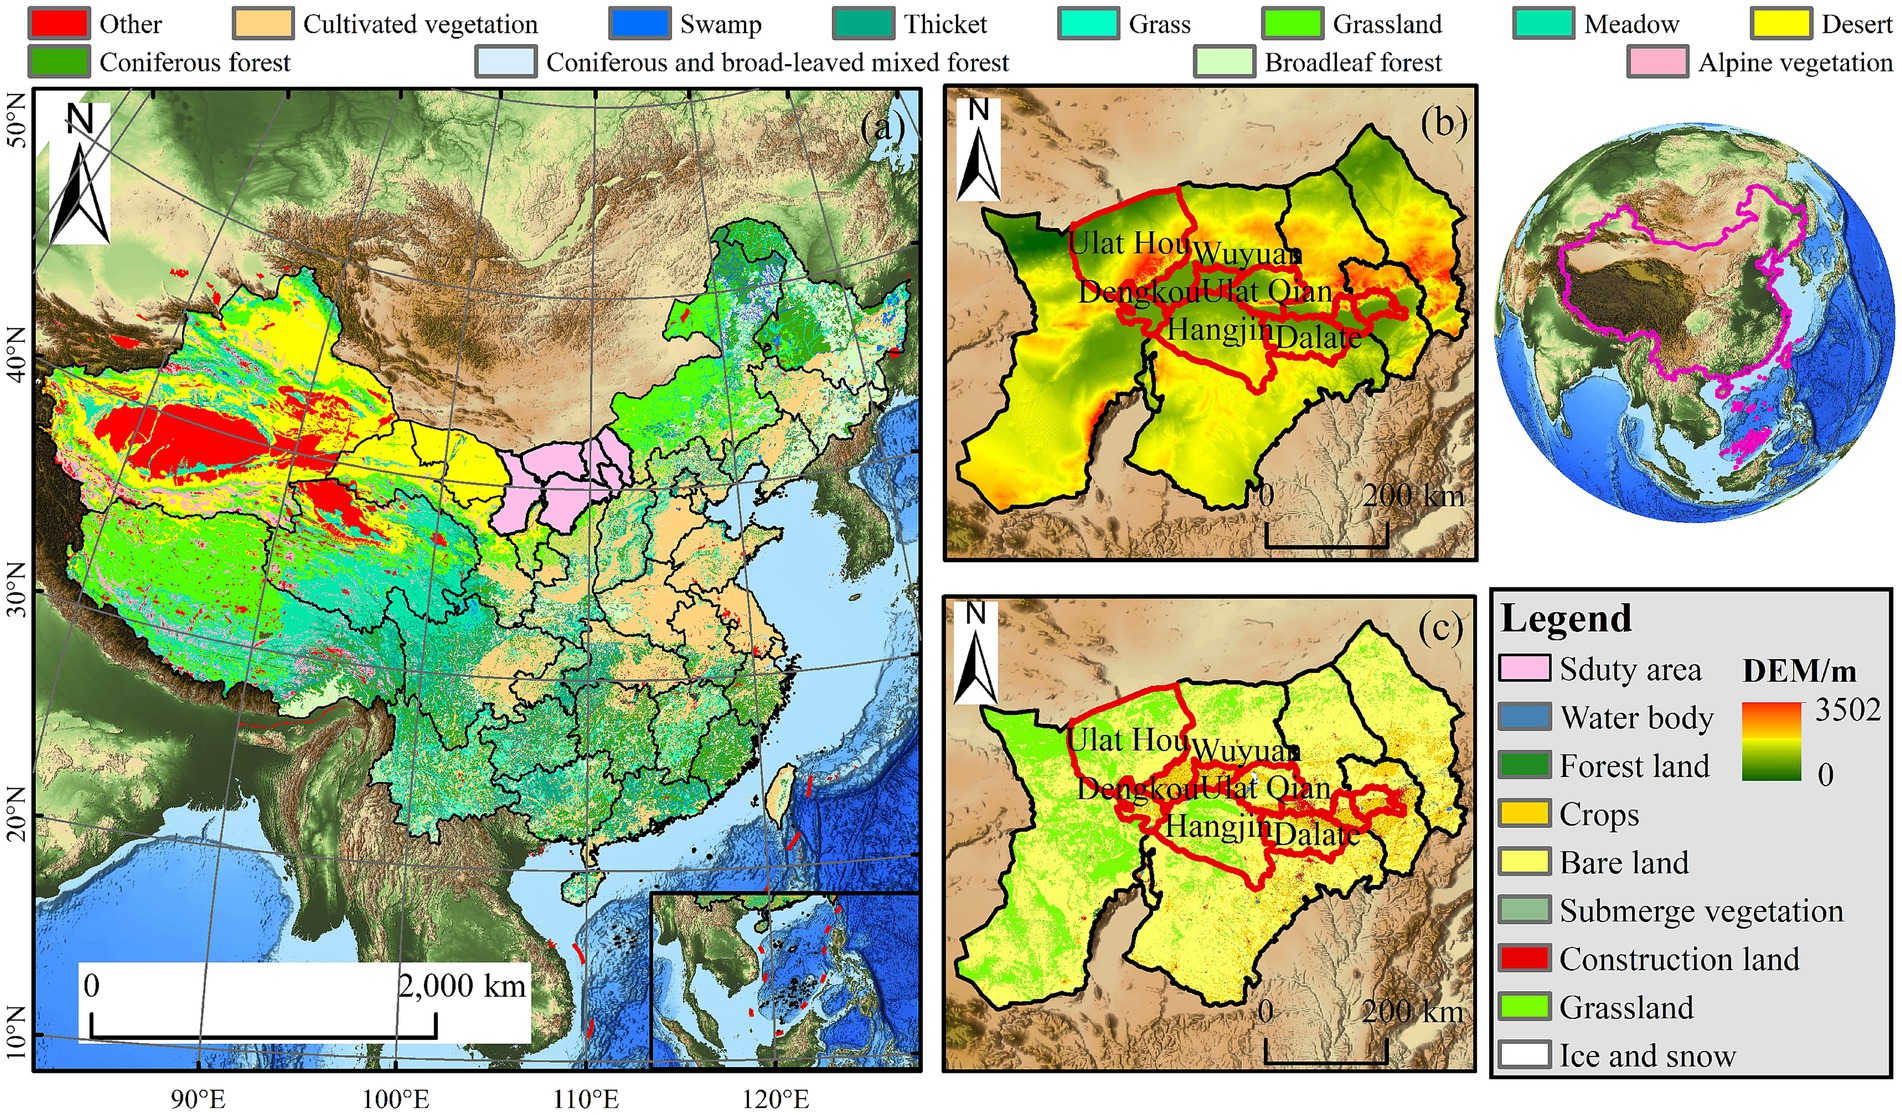
Figure 1. (a) Geographical location of the Inner Mongolia section of the Yellow River Basin, (b) Topographic and hydrological characteristics, and (c) land use types (2023).
2.2 Data sources
The actual evapotranspiration and potential evapotranspiration (PET) data used in this paper are obtained from the remote sensing product MODIS dataset (MOD16A2) (download URL: https://lad-sweb.modaps.eosdis.nasa.gov/), which has a temporal resolution of 8 d and a spatial resolution of 500 m. The DEM data were obtained from the digital elevation map of China on the Spatio-Temporal Tri-Polar Environmental Big Data Platform,1 with a spatial resolution of 1 km, and the slope gradient and direction were calculated with the help of the Slope and Direction Toolbox in ArcGIS Pro. Slope and aspect were calculated with the Slope and Aspect Toolbox in ArcGIS Pro; NDVI data were obtained from the 1 km resolution month-by-month dataset of the MOD13A2 product of MODIS, which is a 16-d synthetic 1 km L3 data product; temperature and precipitation data were obtained from the 1 km resolution annual mean temperature and annual precipitation data of China from the National Geosystems Data Centre;2 and the annual precipitation data were obtained from the National Environmental Data Platform (see text footnote 2), with a spatial resolution of 1 km. Soil texture (Clay, Sand and Silt) data were obtained from the Resource and Environment Science and Data Centre of the Chinese Academy of Sciences.3 The land use data were MCD12Q1 at 500 m resolution, and the global vegetation classification scheme of IGBP was adopted, combined with the main surface features of the Inner Mongolia section of the Yellow River, this study reclassifies it into four categories: farmland, grassland, water body and bare land. To unify the spatial resolution, this study used ArcGIS software to resample all the data to 1,000 m by bilinear interpolation, which was consistent with the resolution of CWSI data. At the same time, the data were subjected to preprocessing steps such as projection transformation, cropping and mean calculation to ensure the consistency of the data in space and time.
2.3 Methods
2.3.1 Crop water stress index (CWSI)
This index is based on energy balance and fully considers meteorological parameters such as vegetation coverage of the underlying surface, vapor pressure, ground wind speed, and solar radiation. Equation 1 is as follows (Bai et al., 2017):
Where ET and PET represent actual evapotranspiration and potential evapotranspiration, respectively. The value of CWSI ranges from 0 to 1. The larger the value, the more arid the climate. According to the agricultural drought classification standard for soil relative humidity adopted by the National Meteorological Bureau of China, CWSI is divided into 5 drought grades (Table 1), the multi-year average CWSI drought grade distribution is shown in Figure 2.
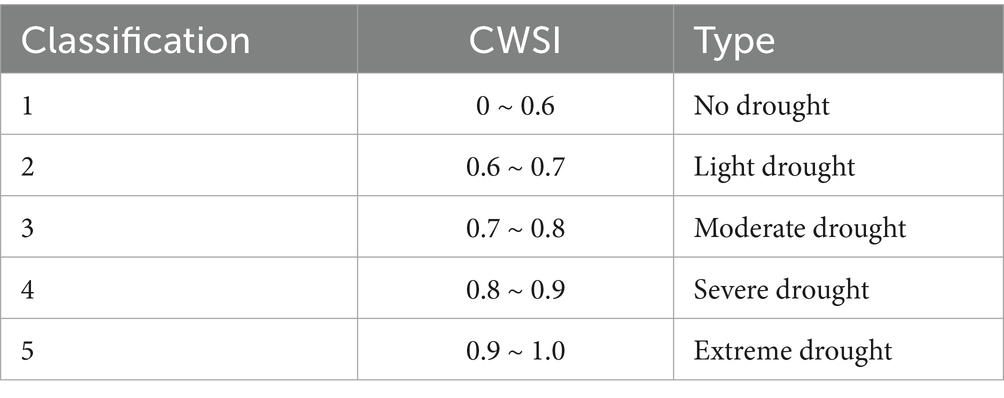
Table 1. CWSI drought classification.
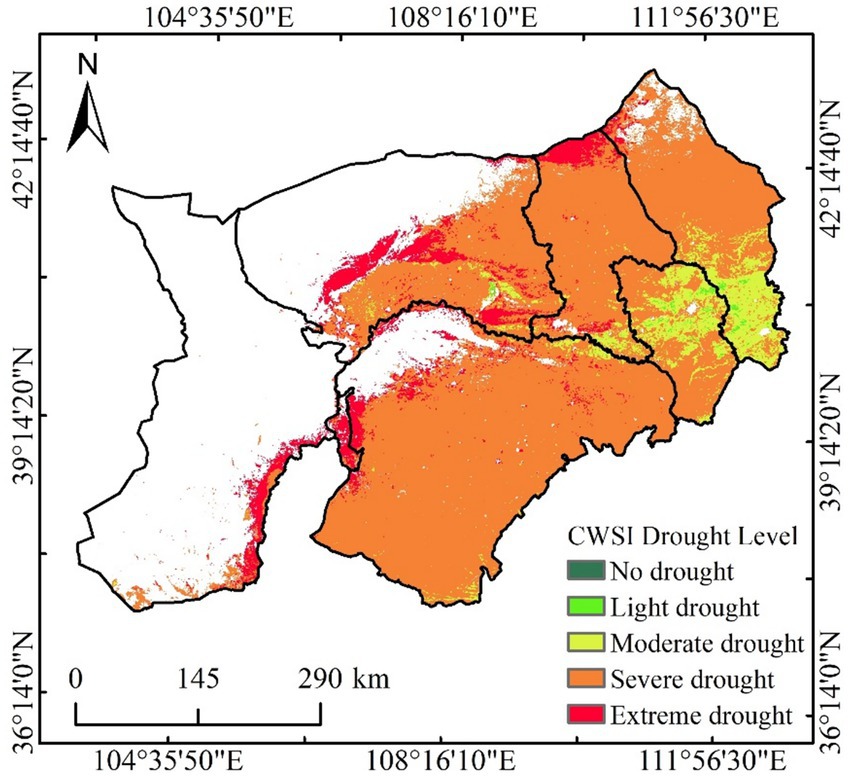
Figure 2. Multi-year average CWSI drought classification, 2001–2024.
2.3.2 Analysis of trends in changes
The combination of Theil-Sen Median trend analysis and Mann-Kendall test has been successfully applied in the analysis of long time series of hydrology, vegetation, meteorology, etc., and has achieved good results in the analysis of temporal changes and trends and the test of trend significance. The Theil-Sen Median method was used to analyze the trend of CWSI, ET, and PET in the Inner Mongolia section of the Yellow River Basin from 2001 to 2024, respectively, and the use of this method does not require the data to obey the normal distribution, and at the same time, it can exclude the interference of a small number of outliers, and it can effectively circumvent the measurement error. Equation 2 is as follows (Wang et al., 2022a):
Where: β is the trend rate of change; xi and xj denote the values corresponding to variable x in year i and year j, respectively; and n is the length of the study time series. When β < 0, it indicates a decreasing trend in CWSI (ET or PET) and vice versa.
Mann-Kendall can be used to determine the trend significance and mutation of the data series, which has the advantages of not being bound by the sample distribution and being less affected by outliers, and has been widely used in hydrological, meteorological and ecological trend changes (Wang et al., 2022b). The Mann-Kendall significance test statistic Z was used for trend testing (Wang et al., 2023). When |Z| > 1.96 indicates that it passes the 95% confidence test. In this paper, the significance of change tendency and trend is judged at the confidence level α = 0.05, i.e., significant when |Z| > 1.96 and not significant when |Z| < 1.96, as shown in Table 2.
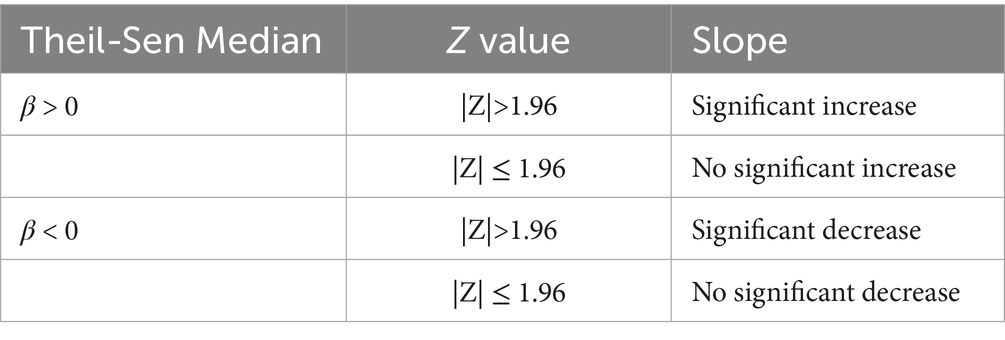
Table 2. Mann-Kendall test trend division.
2.3.3 Coefficient of variation
Stability was analyzed using the Coefficient of Variation (CV), which quantifies the degree of variation in the observations and can accurately represent the degree of dispersion of the unit mean. Equation 3 is as follows (Han et al., 2022):
Where: σ and represent the standard deviation and mean value; CV is the coefficient of variation; the larger the CV value, the larger the data fluctuation and the more discrete the data distribution; on the contrary, it means that the data fluctuation is small and the more centralized the data distribution.
2.3.4 Prediction of future changing trends
The simplest linear extrapolation method was used to predict future trends in CWSI. Specifically, for each like element of the CWSI time series (2001 to 2024), a linear regression was performed using ordinary least squares (OLS) with year as the independent variable and CWSI value as the dependent variable, predict the drought situation in 2030 and 2035. Equation 4 is as follows (Usman et al., 2013):
Where, a is the intercept, b is the slope, and X represents the rate of change of CWSI over time.
2.3.5 Geographic detector
Geographic Probe Model is a kind of statistic approach that can measure the difference in space and discover its motive power. The fundamental theory of this paper is to determine the degree of similarity between two variables in space from the point of view of heterogeneous space level. The model is composed of four types (Liu et al., 2025). This thesis focuses on the application of the Element Detector and the Interactive Detector.
(1) Factor detection: used to detect the influence of driving factor X on CWSI changes, represented by q, Equation 5 is as follows:
In this case, h = 1,2, …, L is the grading or division of the variable Y or Factor X, N and Nh are the number of cells in the entire area and in the entire area, and SSW and SST are the sum of the inner and outer areas, respectively. The value of q is between [0,1] and the greater the value, the more strongly the driver is affected by CWSI.
(2) Interaction Detection: Used to determine the interaction among the drivers, that is, if the co-driving forces X1 and X2 have an impact on CWSI, or if they affect CWSI independently. Interactions have been classified in 5 groups (Table 3).
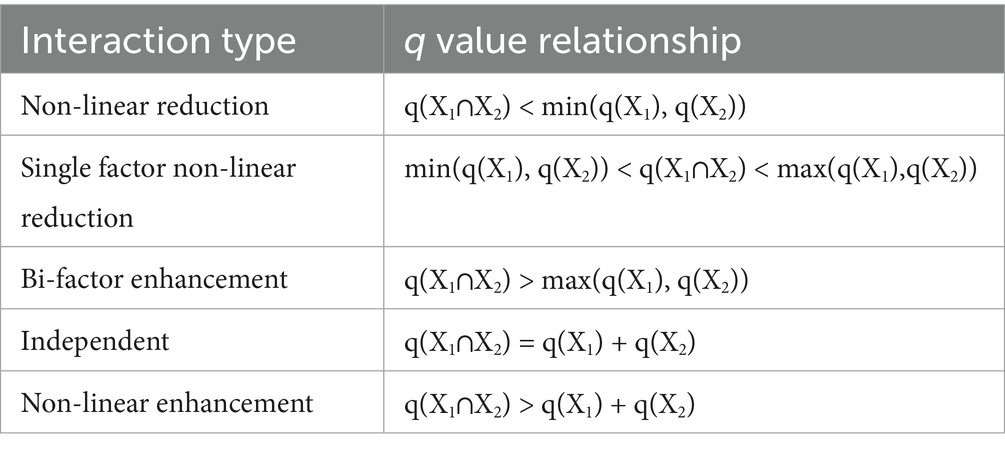
Table 3. Type of interaction between two factors.
3 Result and analysis
3.1 Spatiotemporal dynamics of drought (CWSI) and its driving components
3.1.1 Temporal evolution of drought and the role of ET and PET
Figure 3 shows the interannual changes in evapotranspiration and the dry-wet index (CWSI) in the Inner Mongolia section of the Yellow River basin. From a temporal perspective, the study area exhibits a significant trend toward alleviated drought conditions, despite fluctuations, with the CWSI showing an overall downward trend. This is primarily attributed to the combined effects of actual evapotranspiration (ET) and potential evapotranspiration (PET). Although PET exhibits relatively stable interannual fluctuations, ET demonstrates greater variability and a significant growth trend. It is the rapid growth of ET that drives the decline in CWSI. The figure shows that the interannual variation in evapotranspiration (ET) is very pronounced, with variation rates ranging from −30% to 37%. In contrast, the interannual fluctuations in potential evapotranspiration (PET) and CWSI are not significant, with variation rates ranging from −5% to 7% and −7% to 11%, respectively. The maximum value of CWSI is 0.92 (2005), the minimum value is 0.78 (2023), and the average value is 0.85; The maximum value of evapotranspiration (ET) was 289.01 millimeters (2024), the minimum value was 119.56 millimeters (2001), and the average value was 176.01 millimeters. By analyzing the annual variation rates of interannual variability for each indicator, the trends of CWSI and PET are consistent. The trends of CWSI and PET are consistent. From the perspective of interannual variability in CWSI, the Inner Mongolia section of the Yellow River basin has been in a state of severe drought from 2001 to 2024. During this period, the rate of change in CWSI ranged from 0% to 10%, indicating that the interannual variability in drought conditions in the basin was relatively stable, with relatively mild fluctuations.
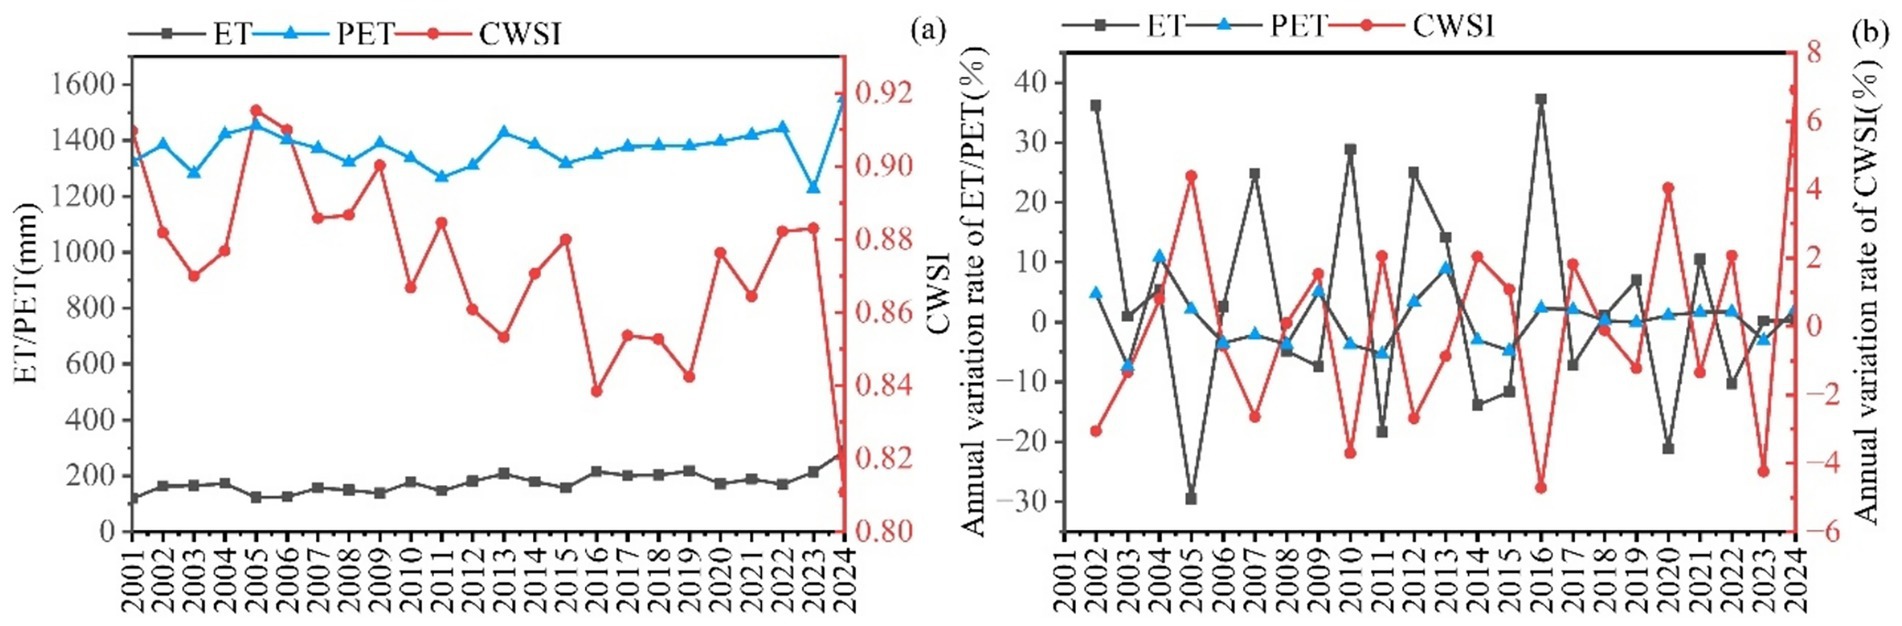
Figure 3. Mean values of indicators in the Inner Mongolia section of the Yellow River Basin from 2001 to 2024 (a) annual scale time change characteristics, (b) annual change rate.
3.1.2 Spatial patterns of drought as explained by ET and PET
From the spatial distribution of evapotranspiration (ET), potential evapotranspiration (PET), and crop water stress index (CWSI) (Figure 4), it can be seen that the CWSI in the Inner Mongolia section of the Yellow River basin exhibits a clear distribution pattern, with the agricultural areas along the Yellow River being the least arid, while areas farther from the river are more arid. ET exhibits a pattern of higher values in the east and lower values in the west, with high-value areas highly overlapping with riverine farmland (such as Dengkou County and the southern part of Hangjin Banner). These regions have ample irrigation water sources, ensuring high actual evapotranspiration and effectively reducing water stress. This corresponds to the lower CWSI values in these areas. PET distribution characteristics show higher values in the southwest and central regions and lower values in the northeast. PET is generally higher in the southwest and central regions and lower in the northeast, with high-value areas primarily distributed in the northern part of E’ertuoqi, the northwestern part of Hangjinqi, and Wulatehouqi. The trend coefficients of different indicators show significant spatial differences. The trend coefficient range for evapotranspiration (ET) is from 21.25 mm∙a−1 to −18.07 mm∙a−1,with an unclear upward trend primarily concentrated in central and eastern China, a downward trend mainly appearing in northern and southern regions, and no significant changes in other areas (p < 0.05) The trend coefficients for PET range from 47.21 mm∙a−1 to −71.07.07 mm∙a−1. ~-The trend coefficients for PET ranged from 47.21 mm∙a−1 to −71.07.07 mm∙a−1, with a large overall trend, mainly upward, but not downward, and the trend for CWSI varied less throughout the basin, with trend coefficients ranging from 0.0138∙a−1 to −0.016∙a−1.
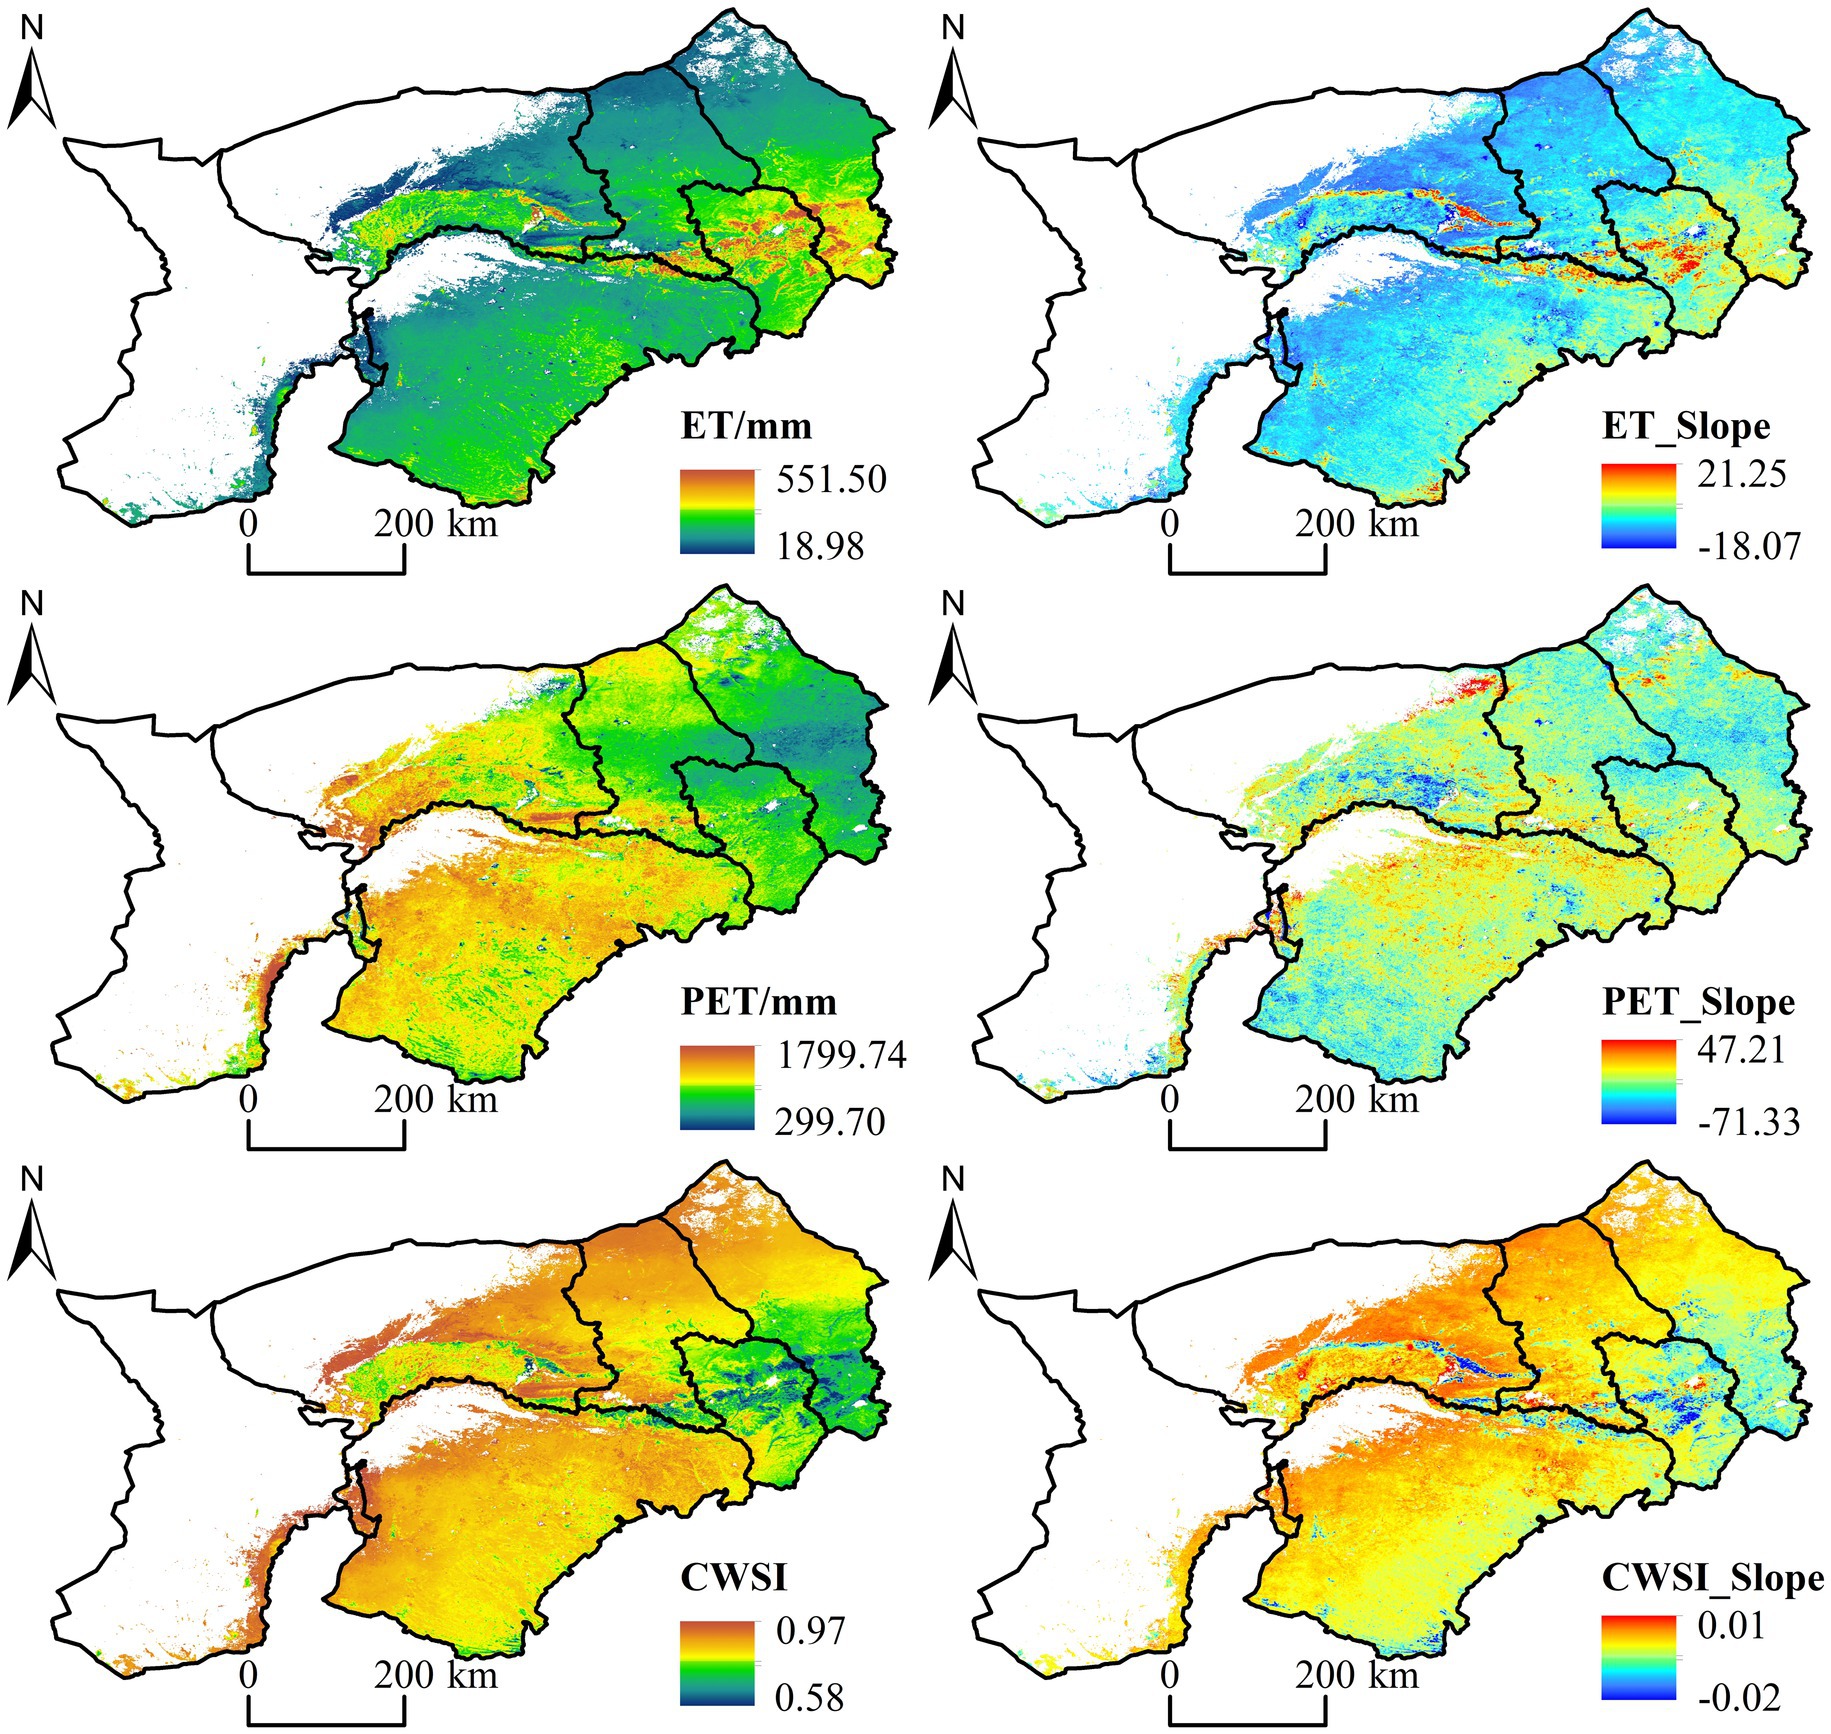
Figure 4. Interannual spatial distribution and trends of indicators (ET, PET and CWSI) in the Inner Mongolia section of the Yellow River Basin from 2001 to 2024.
To quantitatively analyze the spatiotemporal characteristics and interannual stability of indicators within the study area, the Sen slope estimation method was first employed. This method calculates the trend of the preferred drought index during the study period using image elements to estimate long-term trend changes in time series data. Additionally, the spatial coefficient of variation for each indicator was calculated, collectively reflecting the spatial distribution and interannual trend characteristics of drought indices within the study area. Furthermore, the Mann-Kendall test was used to assess the significance of trend changes, ensuring the statistical reliability of the trend analysis. The Sen slope value S reflects the rate of change in the drought index, while the Mann-Kendall significance statistic p value is used to determine the significance level of the trend. Based on the combination of the Sen slope value S and the p value, the trends of the selected drought indices in the study area were classified (Table 4).
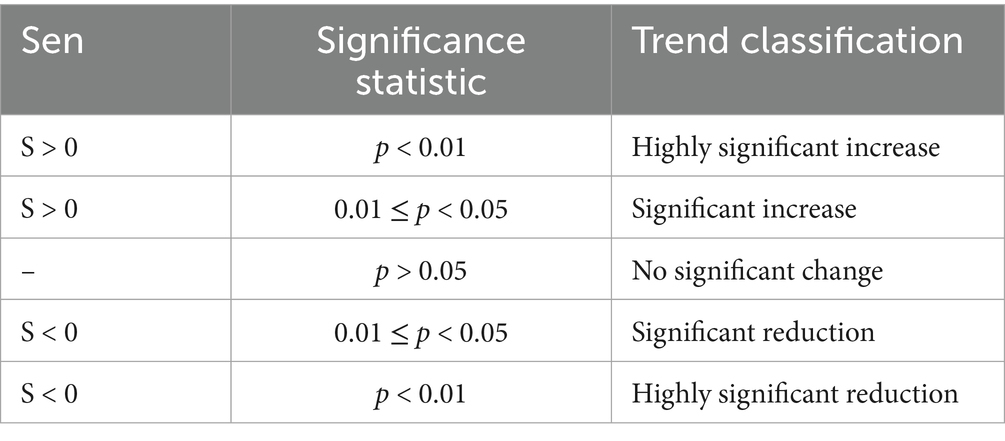
Table 4. Classification of change trends.
Combining Figure 5 and Table 5, the evapotranspiration trends in the Inner Mongolia section of the Yellow River basin exhibit significant differences across different regions. Areas with no significant spatial trend changes account for approximately 41.71% of the total area. Next are areas with a significant increasing trend, accounting for approximately 34.31% of the total area, primarily distributed in the southeastern part of the region. Meanwhile, areas with significant decreasing and very significant decreasing trends are not significant across the entire region, accounting for only 2.08% of the total area. PET trends show no significant overall spatial trend, accounting for approximately 87.29% of the total area; a significant increase trend accounts for approximately 7.07% of the total area, while regions with significant decrease trends and very significant decrease trends are primarily concentrated in localized areas around urban areas, accounting for only 4.94% of the total area. The CWSI trend shows a significant decreasing trend overall, accounting for approximately 62.11% of the total area; the areas with a significant decrease are mainly distributed in parts of the northeastern region, accounting for approximately 2.08% of the total area. Overall, the CWSI shows a highly significant decreasing trend, accounting for 62.11% of the total area; significantly decreasing regions are primarily concentrated in the northeastern regions, accounting for 14.55% of the total area; regions with significantly increasing and highly significantly increasing trends account for a relatively low proportion, only 0.98% of the total area. Additionally, evapotranspiration (ET) in the Inner Mongolia section of the Yellow River basin exhibits high variability, with few low-variability regions, and the remaining regions primarily characterized by high variability. Potential evapotranspiration (PET) exhibits high and moderate volatility, with low-volatility regions primarily located in the southeastern part of the area. CWSI exhibits low volatility and low volatility characteristics. This indicates that actual water loss (ET) is far more sensitive to environmental changes than potential evapotranspiration demand (PET) or final water stress (CWSI).
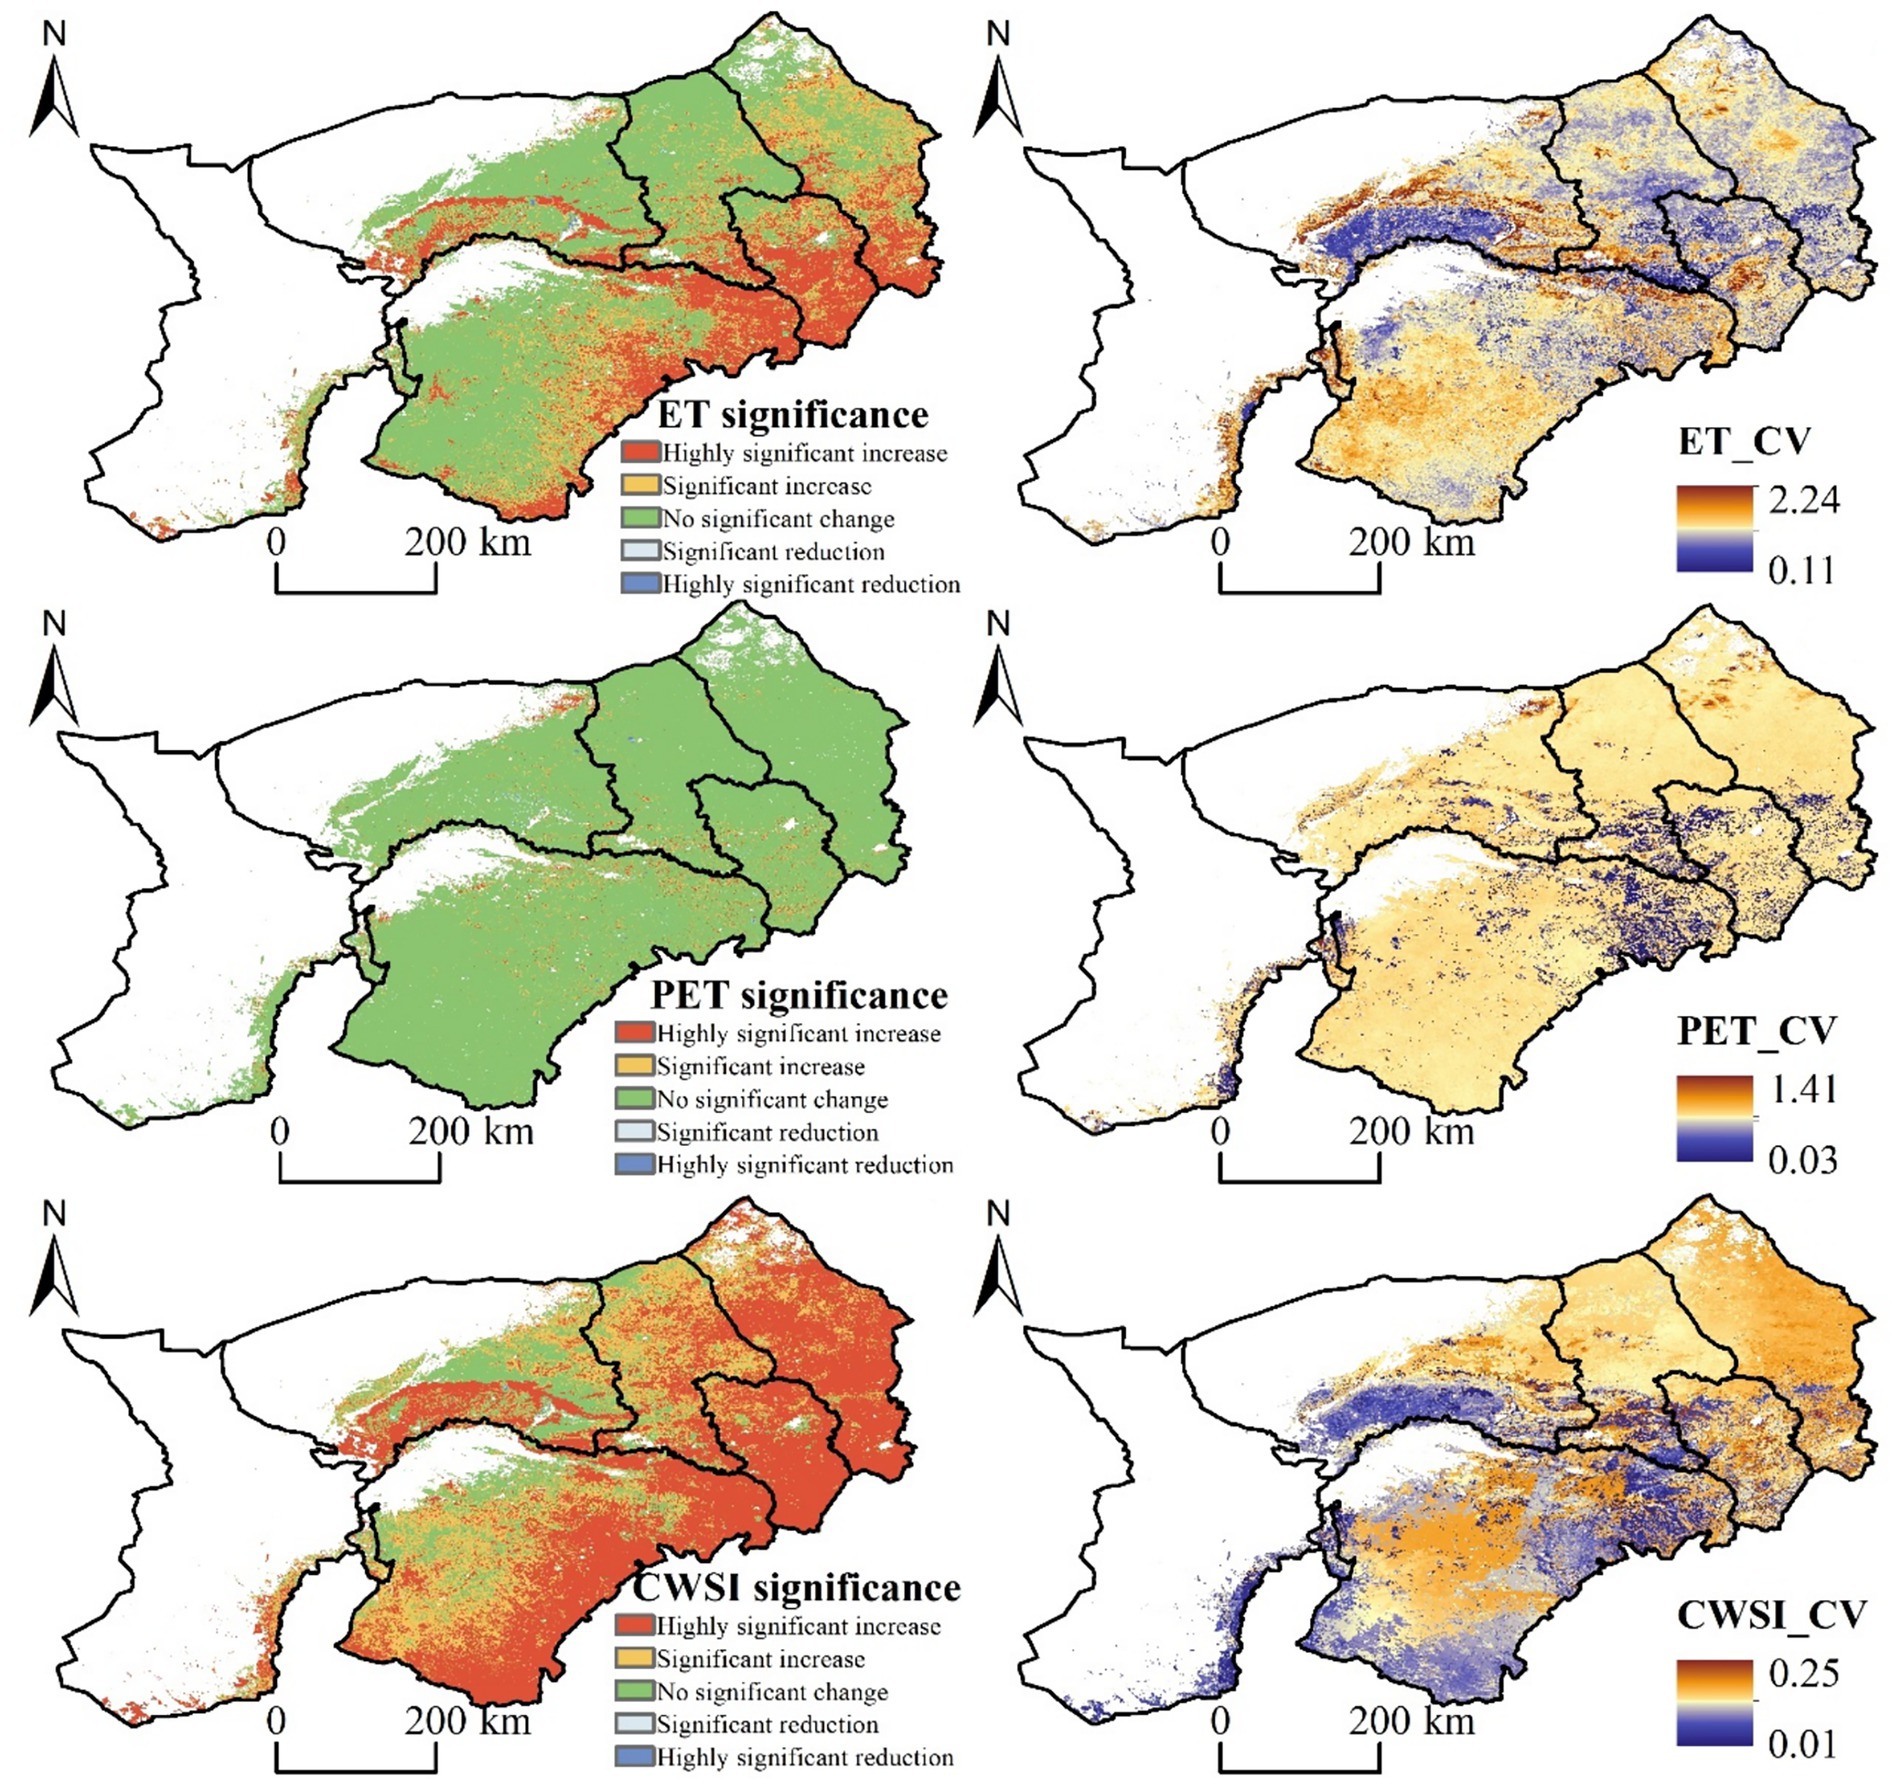
Figure 5. Spatial distribution of interannual trend rank and coefficient of variation of indicators (ET, PET and CWSI) in Inner Mongolia section of the Yellow River Basin, 2001–2024.
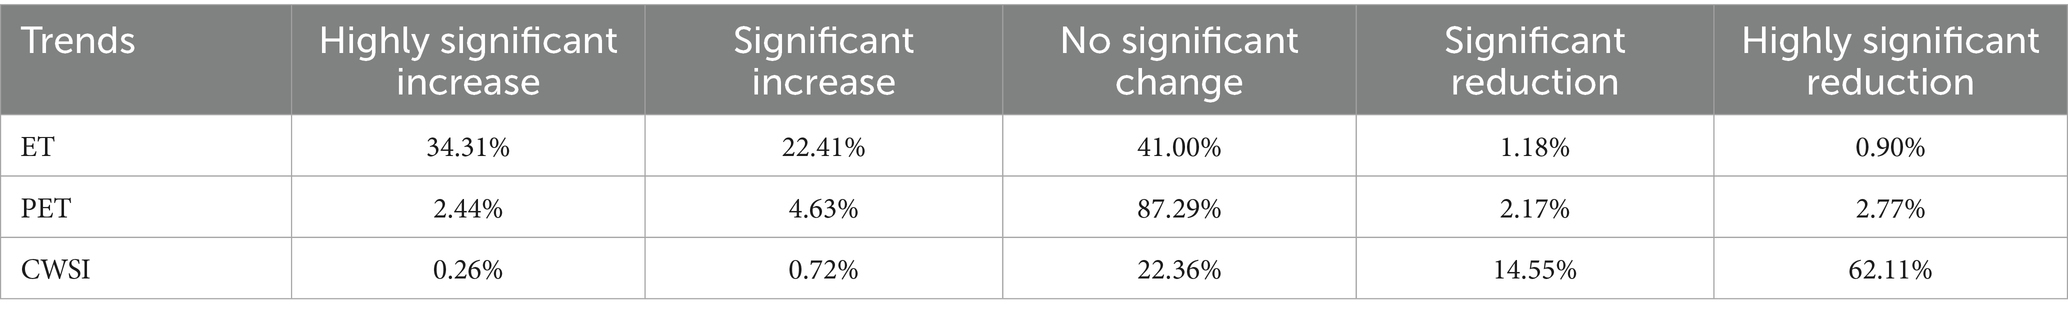
Table 5. Proportion of change trend of each indicator.
3.1.3 Calculate the spatial trend values and coefficient of variation values of the three indicators under different land uses
To explore the distribution of spatial trends and coefficients of variation of ET, PET and CWSI of different land use types, the corresponding ET, PET and CWSI of each land use type were extracted year by year from 2001 to 2024, and the regional average values were calculated. As shown in Figure 6, the spatial trend of ET corresponding to each land use type is in the following order: farmland > bare land > grassland > water body, and the trend of all types of ET is basically the same as the trend of ET in the whole region, whereas the ET of farmland shows an obvious increasing trend, and the trend of ET of water body is not obvious. The differences in PET values for each land use type were small, with the following order of magnitude: water body > grassland > bare land > farmland. Among them, water bodies showed a significant decreasing trend. The change trend of CWSI for each land use type is consistent with that of the whole region, with an obvious downward trend in general. In addition, the corresponding CWSI value of each land use type is: water body > grassland > bare land > farmland, which is opposite to the corresponding ET size of each land use type. The CWSI showed little volatility across land use types, while ET showed the greatest fluctuation. ET fluctuated most significantly in water areas (CV = 0.43), while grassland, cultivated land, and bare land showed relatively stable drought conditions.
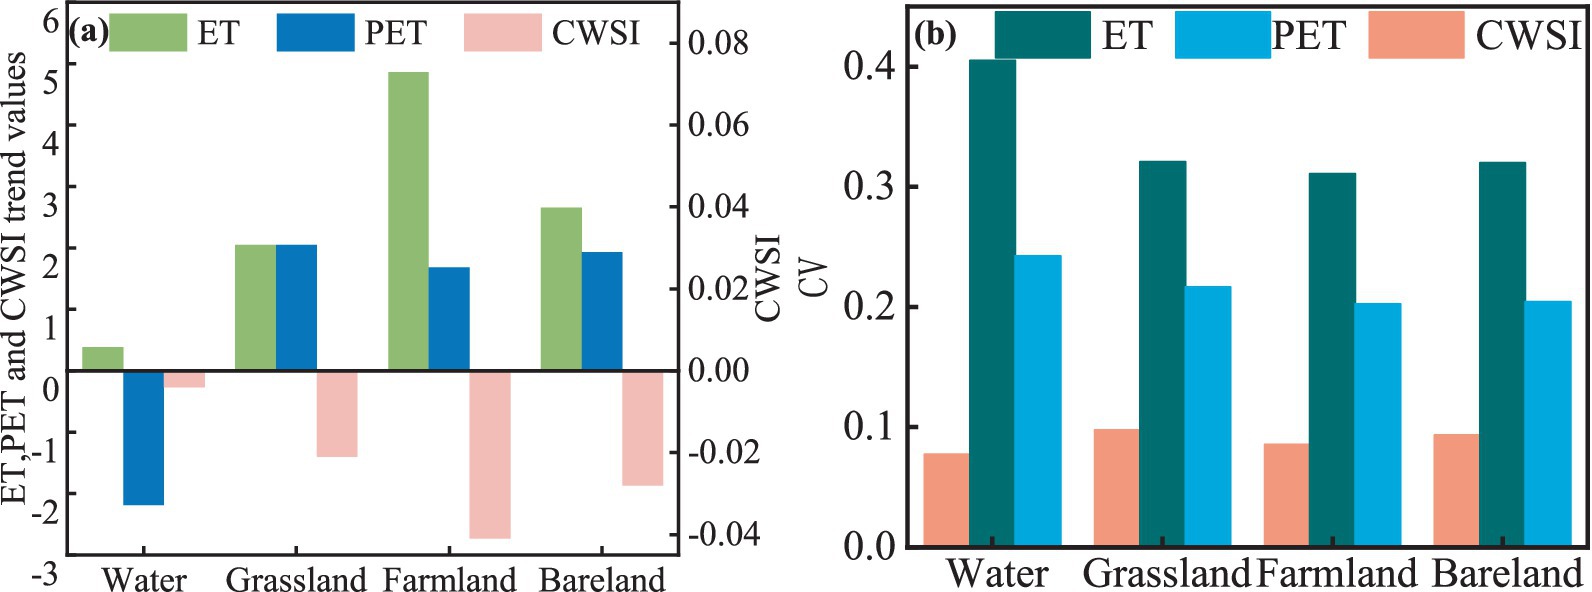
Figure 6. The spatial trend and coefficient of variation of each index under different land use conditions in the Inner Mongolia section of the Yellow River Basin. (a) Trend statistics, (b) Coefficient of variation statistics.
3.2 Forecast of future trends in CWSI
Based on the regression coefficients obtained from the fitting, the CWSI values for future years (e.g., 2030 and 2035) can be predicted as shown in Figure 7, which shows that the future prediction of the basin will be mitigated to a certain extent, and the drought will continue to be slowed down in the agricultural planting areas along the Yellow River, while the drought in the northern and southern parts of the country will continue to occur.
Figure 7. Single-factor detection results of geographic detectors in the Inner Mongolia section of the Yellow River Basin.
3.3 CWSI drive factor detection
3.3.1 Single-factor detection results
The calculation results, classification methods and number of classifications of single-factor detections of geodetectors in the watershed are shown in Table 6. In this study, a total of 10 influencing factors, X₁ ~ X10, were selected, and the optimal geodetectors were utilized to assess the degree of influence of each factor on the change of CWSI in the study area. Among them, X₁ ~ X3 (DEM, Aspect, slope), represent the topographic factors, which reflect the influence of topography and geomorphology on the CWSI; X4 ~ X6 (proportion of chalk, sand and clay in the fine soil fraction) represent the soil texture, which influences the CWSI, and X7 ~ X10 (NDVI, PRE, TEM, and LUCC) represent the influence of the vegetation status and the hydrothermal conditions on the CWSI. In performing the geodetector analysis, this paper adopts the optimal classification method to reduce the bias caused by the inconsistency of data scales of different factors. The results show that the classification method for each influence factor is mainly based on quartile classification, but due to the differences in data scales, some variables are discretized with 5, 6 or 7 categories, while most variables still use 8 classification numbers. This optimization process helps to enhance the comparability between the factors, reduce the error caused by the uneven classification of the factors, and improve the explanatory power of the factors influencing the changes in CWSI.
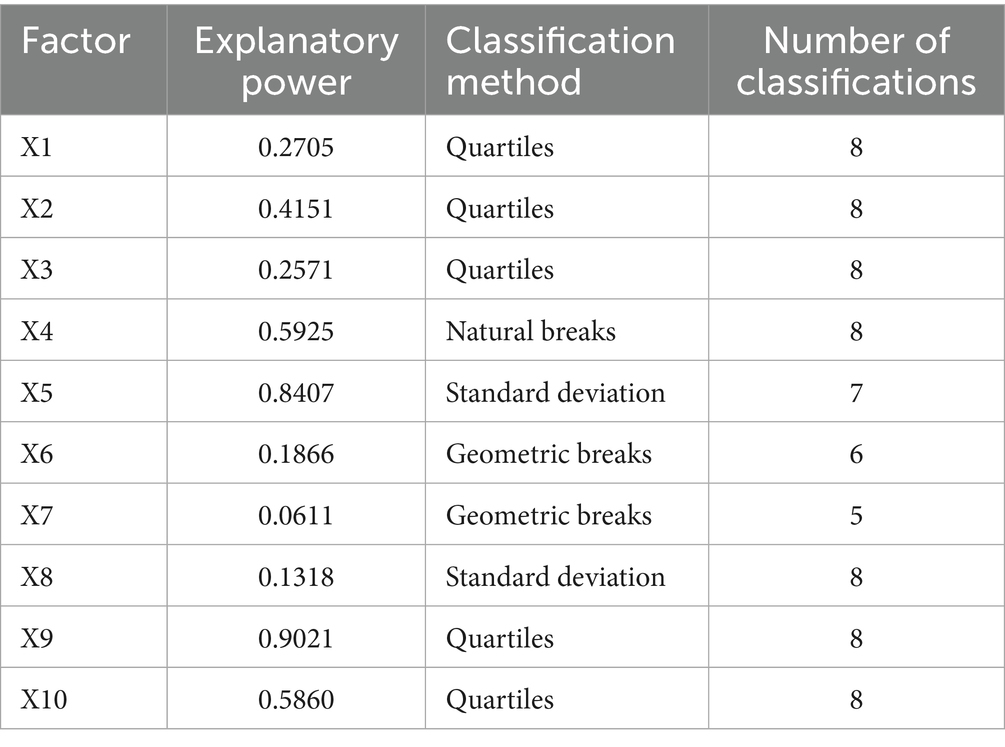
Table 6. Classification results of single factor detection by optimal geographic detector.
Since the value ranges and distribution characteristics of different influencing factors are significantly different, the classification method and the number of categories need to be adjusted according to the characteristics of the data. Optimized classification of parameters can effectively reduce the comparison error between factors and improve the rationality of the explanatory power of different factors on CWSI changes. In addition, the optimized classification method can also more accurately capture the dominant factors of CWSI variation, which provides a more scientific basis for exploring the spatial differentiation mechanism of CWSI.
The results of different climate zoning based on the single-factor detector are shown in Figure 8, with different levels of q-values of the drivers in the study area. The combined ranking of the q-values of the driving factors was: precipitation > NDVI > temperature > land use type > DEM. among them, the average q-values of precipitation and temperature were above 0.5, which belonged to the main driving factors of CWSI, and this result was closely related to the typical agricultural characteristics of irrigation areas in this region. Precipitation and NDVI among the natural factors had the most significant effect on CWSI, and this climatic region has a high evapotranspiration intensity and soil moisture is mainly dependent on atmospheric precipitation recharge. Since evaporation is much greater than precipitation in the desert climate of the study area, changes in precipitation directly determine soil moisture supply, which in turn affects the fluctuation of the CWSI. NDVI represents the greenness and growth of vegetation, which is an important variable affecting the evapotranspiration process. Vegetation types in the study area are mainly desert vegetation with low cover. Therefore, changes in NDVI can directly affect soil evapotranspiration, surface albedo and water cycling, which in turn trigger changes in CWSI.
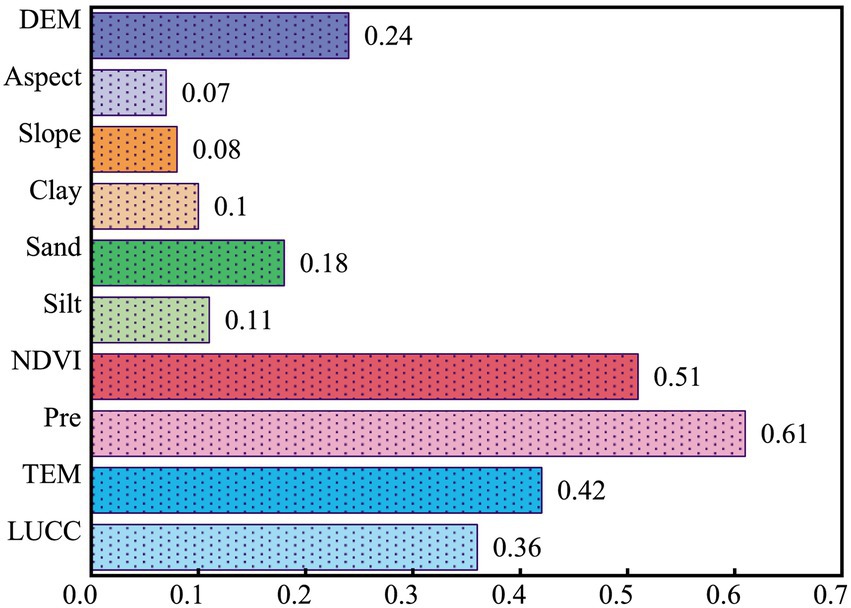
Figure 8. Single-factor detection results of geographic detectors in the Inner Mongolia section of the Yellow River Basin.
3.3.2 Interaction detection results
The results based on the interaction detector show that the interaction between different drivers enhances the explanatory power of the spatial heterogeneity of CWSI. As can be seen in Figure 9 although the explanatory power of DEM, slope and slope direction in the single-factor detector results is extremely limited, their q-values are improved to different degrees when they interact with factors such as precipitation and air temperature, and especially the q-values are significantly enhanced by the interaction between DEM and precipitation (0.78 ~ 0.93). Precipitation and temperature were the two factors with the most significant enhancement in the explanatory power of other factor interactions, and the q-values of the interactions between these two meteorological factors also reached the highest level (0.72 ~ 0.95). In the study area, the interaction between the pairs of precipitation and air temperature and precipitation and elevation had the most significant effect on the CWSI, respectively, with the q-values exceeding 0.81, indicating that natural precipitation recharge played a dominant role in the drought variability in the region. In addition, temperature is also a key driver of CWSI in the Central CWSI, and the q-values of its interactions with all the drivers are in the range of 0.82 to 0.95. This suggests that the form of action of these factors on the CWSI in the study area is not monolithic, and that they indirectly affect the drought conditions within the entire watershed by influencing the changes in the other drivers.
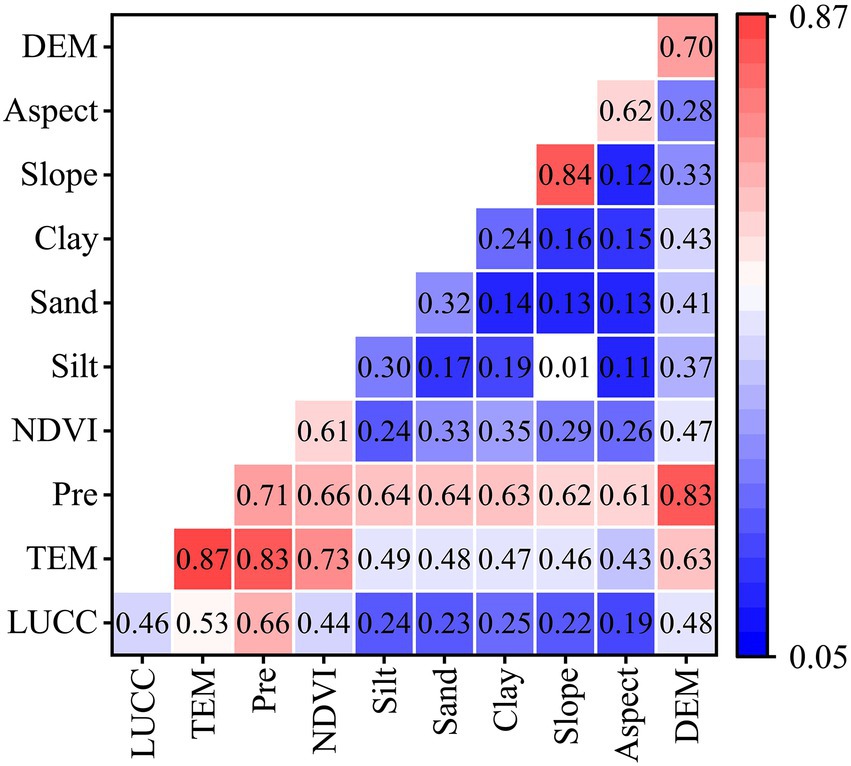
Figure 9. The multi-factor detection results of the geographic detector in the Mongolian section of the Yellow River Basin.
4 Discussion
In this study, we constructed the Crop Water Scarcity Index (CWSI) based on MOD16 evapotranspiration (ET) and potential evapotranspiration (PET) data from 2001 to 2024, systematically investigated the spatial and temporal dynamics of drought in the Inner Mongolia section of the Yellow River Basin, and elucidated the driving forces behind the spatial heterogeneity of the CWSI using geoprobes. The results reveal the complex interactions between climate and subsurface factors, which together shape the drought characteristics of the region.
4.1 Spatial and temporal dynamics of drought and its underlying mechanisms
Time series analysis indicates that the study area has experienced severe drought overall over the past two decades (average CWSI = 0.85), but more than 76% of the area has observed a significant downward trend in CWSI, suggesting that the severity of drought has generally decreased. The core physical mechanism lies in the fact that the growth rate of ET exceeds that of PET. The interannual variability of PET within the study area is relatively stable, while ET exhibits greater variability. This is primarily because the actual amount of water available for evapotranspiration is a more dynamic factor in determining water stress conditions, rather than atmospheric evaporation demand (Li et al., 2024a). The observed large-scale upward trend in PET (though not always statistically significant) aligns with predictions of increased evaporation demand under global warming scenarios (Wang W. et al., 2024). However, the concurrent decline in CWSI (where CWSI = 1-ET/PET) indicates that in some regions, the increase in evapotranspiration (ET) may have exceeded the increase in potential evaporation (PET), or the increase in PET was less than that of ET, or the decrease in ET was smaller than that of PET, leading to a net decrease in the water stress index (CWSI) (Zhang et al., 2024b). Combined with geographic detectors, human activities (particularly agricultural irrigation) are the dominant driver of ET growth, and the upward trend in evapotranspiration is more pronounced in cultivated land, which may reflect the combined effects of agricultural activities, improved irrigation practices, changes in crop structure, and vegetation greening (NDVI) on evapotranspiration, as supported by the lower CWSI values in the agricultural areas along the Yellow River (Afshar et al., 2022; Ding et al., 2024a; Ding et al., 2024b; Feng et al., 2025; Jin et al., 2024). Conversely, higher CWSI values in areas farther from rivers reflect the limited water resources in these regions dominated by arid and semi-arid landscapes (Du et al., 2024; Qin et al., 2024; Wang Y. et al., 2024). From a spatial distribution perspective, the pattern of lower CWSI values along the Yellow River basin and higher values in other regions highlights the critical role of the Yellow River as an irrigation water source, effectively alleviating drought in surrounding agricultural areas (Chen W. et al., 2024; Fan et al., 2024; Wang Z. et al., 2024). The spatial pattern of high evapotranspiration (ET) in the east and low ET in the west is particularly pronounced in agricultural areas such as the Hetao Irrigation District, consistent with land use patterns and water supply conditions. Spatial trend analysis shows that the CWSI overall exhibits a declining trend, with a significant decline observed in 62.11% of the regions. This widespread mitigation may be attributed to the combined effects of multiple factors, including potential changes in precipitation patterns, vegetation greening, and potentially effective water management strategies in irrigation areas (Shi et al., 2024; Wang et al., 2025; Yu et al., 2025). The continued increase in actual evapotranspiration (ET) in irrigated agricultural areas has outpaced changes in potential evapotranspiration (PET), reducing the ET/PET denominator and leading to an overall downward trend in the CWSI. Furthermore, precipitation in the region has rebounded in some years over the past two decades. This, combined with increased vegetation cover, adjustments to crop planting structures, and improved water resource management practices, has contributed to improved soil moisture conditions and a reduction in drought severity. These changes are particularly pronounced in irrigated farmland along the Yellow River, reflecting the combined effects of human activities and climatic factors.
4.2 Main drought drivers and their interactions
Geoprobe analyses provide quantitative findings on the drivers of spatial patterns of CWSI. The effect of precipitation (with the highest q-value) is relatively common for an arid and semi-arid region, as moisture input is the main limiting factor for vegetation growth and soil water content (Pei et al., 2024; Ren X. et al., 2024; Zhou et al., 2025). In the desert climate of a typical arid and semi-arid region, evapotranspiration is much greater than precipitation, allowing changes in precipitation to directly influence soil moisture availability and CWSI (Alasow et al., 2024; Li B. et al., 2024; Zhang Q. et al., 2024). The significant role played by NDVI, which represents the greenness and cover of vegetation, highlights the strong coupling between vegetation and drought. Dense vegetation can increase ET, but may also improve soil water retention and reduce evaporation from bare soil, which can have complex effects on CWSI. Temperature, which mainly affects PET, is also a key direct driver (Hassan et al., 2025; Li D. et al., 2024; Mohammadi et al., 2024). Meanwhile interaction probes showed that the combined effect of factors usually has a stronger explanatory power for the spatial variability of CWSI than a single factor (Xiao et al., 2024). The interaction between precipitation and DEM (q-values 0.78–0.93) is particularly strong. This suggests that although the direct effect of DEM alone is weak, its role becomes more important when considered in combination with precipitation (Yu'an, 2025), which may be related to the influence of topography on rainfall distribution, runoff generation, and moisture pooling in low-lying areas (Yan et al., 2024). Similarly, the strong interaction between precipitation and temperature (q values ranging from 0.72 to 0.95) highlights that the impact of precipitation on water stress is regulated by atmospheric evaporation demand, which is in turn significantly influenced by temperature. The interaction between temperature and all other factors is also notably high (q values ranging from 0.82 to 0.95), indicating its universal role in altering the influence of other environmental variables on drought conditions (Ahmad et al., 2024). Land use/cover change (LUCC) also significantly impacts drought patterns. The results show that water bodies generally have the highest CWSI values, while cultivated land has the lowest, a ranking opposite to evapotranspiration. This suggests that despite high evapotranspiration from cultivated land, drought intensity is mitigated by irrigation and vegetation cover, resulting in a lower CWSI. Grassland, which has some vegetation cover but lacks irrigation support, has a moderate CWSI. Bare land, however, has a relatively high CWSI due to its poor water retention and sparse vegetation. This demonstrates that LUCC plays a decisive role in regulating the balance between water supply and demand. For instance, the impact of land use type on CWSI may be influenced by temperature, as different land cover types respond differently to heat stress and evaporation demand (Ma et al., 2024). These findings are consistent with previous research, which suggests that drought is a complex phenomenon driven by multiple interacting factors, and single-factor analysis may underestimate these intricate relationships (He et al., 2025). The interaction between LUCC and temperature indicates that different land types respond differently to rising temperatures. Cultivated land can buffer heat stress through irrigation, while grassland and bare land are more susceptible to drought exacerbations due to increased evaporation. Similarly, the interaction between LUCC and NDVI suggests that vegetation dynamics across different land use types can amplify or mitigate drought effects, with areas with higher land cover exhibiting greater drought resistance. The application of the Geodetector has enabled the quantification of these synergistic effects, providing a more comprehensive understanding of drought formation in the Inner Mongolia section of the Yellow River Basin.
4.3 Uncertainties and limitations
The results of this study are of great significance for water resource management and ecological protection in the Inner Mongolia section of the Yellow River Basin. The identification of key drivers and their interactions can inform the development of targeted strategies. For example, the dominance of precipitation highlights the region’s vulnerability to climate variability and change, emphasizing the need for strong water conservation measures and the promotion of drought-resistant agricultural practices. The significance of NDVI suggests that vegetation restoration and conservation efforts can play a role in mitigating the effects of drought. The significant decline in CWSI in many areas is a positive sign, but given the upward trend in PET and the inherent aridity of the region, continued monitoring is critical. However, there are limitations to this study. The CWSI model, while widely used, relies on MOD16 estimates of ET and PET, which have inherent uncertainties and spatial resolution issues of their own. Although major natural factors were considered, direct quantitative impacts of human activities, such as specific irrigation schemes, groundwater extraction rates, or reservoir scheduling, were not explicitly incorporated into the geoprobe model, and human interventions can significantly alter local and regional hydrologic conditions and drought conditions. Additionally, the use of a simple univariate linear model to predict future CWSI represents a highly simplified trend extrapolation, whose results are indicative rather than precise scientific predictions. Future drought conditions will be influenced by complex nonlinear climate changes and human activity regulation, which exceed the predictive capabilities of this model. Future research should focus on combining higher-resolution remote sensing data with more detailed ground-based observations to predict future droughts using machine learning algorithms. Incorporating explicit data on human water use and management practices into driver analyses will contribute to a more comprehensive understanding of drought mechanisms.
5 Conclusion
In this study, the spatial and temporal characteristics of drought and its driving factors in the Inner Mongolia section of the Yellow River Basin from 2001 to 2024 were comprehensively assessed using methods such as CWSI and geoprobe models. The main conclusions are as follows:
1. The study area continues to be in a state of severe drought, with an average CWSI of 0.85. However, the CWSI shows a significant mitigating trend, and the CWSI shows a statistically significant decrease in more than 76.66% of the watershed area (of which 62.11% is a highly significant decrease and 14.55% is a significant decrease)
2. Spatially, droughts were less severe in irrigated agricultural areas along the Yellow River, demonstrating the key role of the Yellow River in alleviating water stress; areas far from the river had higher CWSI values and more severe droughts. ET was generally higher in the eastern agricultural areas, and PET was the highest in the southwestern and central parts of the country. There were differences in the spatial trends of the two, but the decreasing trend of CWSI was widely distributed. The CWSI of different land use types showed a decreasing trend, with the lowest CWSI value for arable land (the least stressful) and the highest for water bodies (the most stressful), which may be related to the way of calculating CWSI for the dynamics of ET and PET on the surface.
3. Precipitation is the most dominant influence in determining the spatial distribution of CWSI (with the highest q-value), followed by NDVI and air temperature. Together, these three factors constitute the main climate- and vegetation-related controls on regional aridity patterns, with average q-values exceeding 0.5. Land use type and DEM alone have relatively little direct influence.
4. The interaction of precipitation with temperature (q-values of 0.72–0.95) and precipitation with DEM (q-values of 0.78–0.93) is the strongest, with q-values consistently exceeding 0.81. Highlighting the fact that the influence of DEM is significantly stronger when it is considered in conjunction with climatic variables, reflecting how topography can modulate local climatic and hydrological conditions. Temperature also shows strong synergistic effects when interacting with other drivers.
Data availability statement
The original contributions presented in the study are included in the article/supplementary material, further inquiries can be directed to the corresponding author.
Author contributions
SW: Writing – original draft, Formal analysis. KX: Writing – original draft, Funding acquisition. XM: Formal analysis, Writing review & editing. WH: Funding acquisition, Writing – review & editing. JZ: Methodology, Writing – review & editing. FW: Methodology, Writing – review & editing. DS: Writing – review & editing, Software. ZZ: Software, Writing – review & editing, Methodology. YW: Writing – review & editing, Writing – original draft. ML: Writing – review & editing, Funding acquisition, Writing – original draft.
Funding
The author(s) declare that financial support was received for the research and/or publication of this article. This study was patronized by Key Research and Development and Technology Transfer Program Project of Inner Mongolia Autonomous Region (2022YFHH0069, 2025SYFHH0259); Natural Science Foundation of Inner Mongolia Autonomous Region of china (2023QN05003); National Key R&D Program of China (2023YFC3206505); The Special Training Program Project for Outstanding Young Talents under the “Talents Revitalizing Inner Mongolia” Project of the Inner Mongolia Autonomous Region The 2022 Scientific Research Support Project for the Introduction of High-level Talents at the Inner Mongolia Autonomous Region Level.
Conflict of interest
The authors declare that the research was conducted in the absence of any commercial or financial relationships that could be construed as a potential conflict of interest.
Generative AI statement
The authors declare that no Gen AI was used in the creation of this manuscript.
Any alternative text (alt text) provided alongside figures in this article has been generated by Frontiers with the support of artificial intelligence and reasonable efforts have been made to ensure accuracy, including review by the authors wherever possible. If you identify any issues, please contact us.
Publisher’s note
All claims expressed in this article are solely those of the authors and do not necessarily represent those of their affiliated organizations, or those of the publisher, the editors and the reviewers. Any product that may be evaluated in this article, or claim that may be made by its manufacturer, is not guaranteed or endorsed by the publisher.
Footnotes
References
Abu Arra, A., and Şişman, E. (2024). Innovative drought classification matrix and acceptable time period for temporal drought evaluation. Water Resour. Manag. 38, 2811–2833. doi: 10.1007/s11269-024-03793-0
Afshar, M. H., Bulut, B., Duzenli, E., Amjad, M., and Yilmaz, M. T. (2022). Global spatiotemporal consistency between meteorological and soil moisture drought indices. Agric. For. Meteorol. 316:108848. doi: 10.1016/j.agrformet.2022.108848
Ahmad, S. K., Holmes, T. R., Kumar, S. V., Lahmers, T. M., Liu, P.-W., Nie, W., et al. (2024). Droughts impede water balance recovery from fires in the Western United States. Nat. Ecol. Evol. 8, 229–238. doi: 10.1038/s41559-023-02266-8
Alasow, A. A., Hamed, M. M., Rady, M., Arab, M. A., Muhammad, M. K. I., and Shahid, S. (2024). Spatiotemporal analysis of soil moisture drought in the horn of Africa. Theor. Appl. Climatol. 155, 7165–7176. doi: 10.1007/s00704-024-05052-z
Alzurqani, S. A., Zurqani, H. A., White, D. Jr., Bridges, K., and Jackson, S. (2024). Google earth engine application for mapping and monitoring drought patterns and trends: a case study in Arkansas, USA. Ecol. Indic. 168:112759. doi: 10.1016/j.ecolind.2024.112759
Bai, J.-J., Yu, Y., and Di, L. (2017). Comparison between TVDI and CWSI for drought monitoring in the Guanzhong plain, China. J. Integr. Agric. 16, 389–397. doi: 10.1016/S2095-3119(15)61302-8
Chen, H., Chen, H., Zhang, S., Chen, S., Cen, F., Zhao, Q., et al. (2024). Comparison of CWSI and Ts-ta-VIs in moisture monitoring of dryland crops (sorghum and maize) based on UAV remote sensing. J. Integr. Agric. 23, 2458–2475. doi: 10.1016/j.jia.2024.03.042
Chen, W., Ju, H., Zhang, D., and Batchelor, W. D. (2024). Identification of thresholds and key drivers on water use efficiency in different maize ecoregions in Yellow River Basin of China. J. Clean. Prod. 482:144209. doi: 10.1016/j.jclepro.2024.144209
Ding, Y., Zhang, L., He, Y., Cao, S., Gusev, A., Guo, Y., et al. (2024a). Nonlinear effects of agricultural drought on vegetation productivity in the Yellow River Basin, China. Sci. Total Environ. 948:174903. doi: 10.1016/j.scitotenv.2024.174903
Ding, Y., Zhang, L., He, Y., Cao, S., Wei, X., Guo, Y., et al. (2024b). Spatiotemporal evolution of agricultural drought and its attribution under different climate zones and vegetation types in the Yellow River Basin of China. Sci. Total Environ. 914:169687. doi: 10.1016/j.scitotenv.2023.169687
Du, M., Huang, S., Singh, V. P., Leng, G., Huang, Q., and Li, Y. (2024). Quantifying the effects of direct human activities and climate change on the spatial propagation of hydrological drought in the Yellow River Basin, China. J. Hydrol. 643:131931. doi: 10.1016/j.jhydrol.2024.131931
Fan, J., Zhang, W., Xu, F., Zhou, X., Dong, W., Wu, C., et al. (2024). Multilevel drought-induced resistance and resilience analysis for vegetation in the Yellow River Basin. Atmosphere 15:979. doi: 10.3390/atmos15080979
Feng, J., Qin, T., Lv, X., Liu, S., Wen, J., and Chen, J. (2025). Frequent drought and flood events in the Yellow River Basin, increasing future drought trends in the middle and upper reaches. Int. J. Appl. Earth Obs. Geoinf. 139:104511. doi: 10.1016/j.jag.2025.104511
Ge, C., Sun, P., Yao, R., Wang, Y., Chen, W., Bian, Y., et al. (2024). Characteristics of propagation from meteorological drought to ecological drought in China: lag and cumulative effects. Atmos. Res. 304:107405. doi: 10.1016/j.atmosres.2024.107405
Han, W., Chen, D., Li, H., Chang, Z., Chen, J., Ye, L., et al. (2022). Spatiotemporal variation of NDVI in Anhui Province from 2001 to 2019 and its response to climatic factors. Forests 13:1643. doi: 10.3390/f13101643
Hassan, S. S., Goheer, M. A., Farah, H., Hafeez, F., Sheraz, K., Fahad, J., et al. (2025). Geospatial assessment of climate variability and drought patterns: a case study from Pakistan. Theor. Appl. Climatol. 156, 1–15. doi: 10.1007/s00704-025-05414-1
He, Z., Gu, X., Wang, M., and Xu, M. (2025). The coupled effect of climate change and LUCC on meteorological drought in a karst drainage basin, Southwest China. Sci. Rep. 15:9134. doi: 10.1038/s41598-025-93035-z
Irik, H. A., Kaymaz, E., Saban Polu, P., Beyzi, E., Varol, İ. S., Unlukara, A., et al. (2024). Potential use of crop water stress index (CWSI) and spectral vegetation indices for black cumin under deficit irrigation. Environ. Sci. Eur. 36:93. doi: 10.1186/s12302-024-00876-y
Jin, L., Chen, S., and Liu, M. (2024). Multiscale spatiotemporal dynamics of drought within the Yellow River Basin (YRB): an examination of regional variability and trends. Water 16:791. doi: 10.3390/w16050791
Khosravi, Y., Homayouni, S., and Ouarda, T. B. M. J. (2024). Spatio-temporal evaluation of MODIS temperature vegetation dryness index in the Middle East. Ecol. Inform. 84:102894. doi: 10.1016/j.ecoinf.2024.102894
Kim, H.-J., Rahman, M., Hammad, Z., Kim, H.-S., Lee, S.-J., Kim, T.-E., et al. (2025). Comprehensive analysis of coastal flood susceptibility, drought severity, and crop water stress using data fusion. Geomat. Nat. Hazards Risk 16:2483809. doi: 10.1080/19475705.2025.2483809
Kumar, V., and Chu, H.-J. (2024). Spatiotemporal consistency and inconsistency of meteorological and agricultural drought identification: a case study of India. Remote Sens. Appl. Soc. Environ. 33:101134. doi: 10.1016/j.rsase.2023.101134
Li, M., Abuduwaili, J., Liu, W., Feng, S., Saparov, G., and Ma, L. (2024a). Application of geographical detector and geographically weighted regression for assessing landscape ecological risk in the Irtysh River basin, Central Asia. Ecol. Indic. 158:111540. doi: 10.1016/j.ecolind.2023.111540
Li, D., An, L., Zhong, S., Shen, L., and Wu, S. (2024). Declining coupling between vegetation and drought over the past three decades. Glob. Chang. Biol. 30:e17141. doi: 10.1111/gcb.17141
Li, M., Feng, Z., Zhang, M., and Yao, Y. (2024b). Influence of large-scale climate indices and regional meteorological elements on drought characteristics in the Luanhe River basin. Atmos. Res. 300:107219. doi: 10.1016/j.atmosres.2024.107219
Li, L., Peng, Q., Wang, M., Cao, Y., Gu, X., and Cai, H. (2024). Quantitative analysis of vegetation drought propagation process and uncertainty in the Yellow River Basin. Agric. Water Manag. 295:108775. doi: 10.1016/j.agwat.2024.108775
Li, B., Wang, R., and Chen, J. M. (2024). Responses of phenology to preseason drought and soil temperature for different land cover types on the Mongolian plateau. Sci. Total Environ. 926:171895. doi: 10.1016/j.scitotenv.2024.171895
Liu, X., Shao, S., and Zhang, C. (2025). A landslide susceptibility modeling method using an optimal parameters-based geographical detector. Adv. Space Res. 75, 8561–8582. doi: 10.1016/j.asr.2025.04.019
Ma, Z., Dong, C., Tang, Z., and Wang, N. (2024). Altitude-dependent responses of dryland mountain ecosystems to drought under a warming climate in the Qilian Mountains, NW China. J. Hydrol. 630:130763. doi: 10.1016/j.jhydrol.2024.130763
Mohammadi, M., Salarijazi, M., Ghorbani, K., and Dehghani, A.-A. (2024). Improvement of daily pan-evaporation calculation in arid and semi-arid regions by limited climatic data. J. Water Clim. Chang. 15, 305–324. doi: 10.2166/wcc.2023.459
Mukhtar, A., Ali, Z., Kartal, V., Karakoyun, E., Yousaf, M., and Sammen, S. S. (2024). Development of divergence and interdependence-based hybrid weighting scheme (DIHWS) for accurate assessment of regional drought. Theor. Appl. Climatol. 155, 6473–6490. doi: 10.1007/s00704-024-05018-1
Niazkar, M., Piraei, R., and Zakwan, M. (2025). Application of machine learning models for short-term drought analysis based on streamflow drought index. Water Resour. Manag. 39, 91–108. doi: 10.1007/s11269-024-03959-w
Pei, W., Hao, L., Fu, Q., Liu, H., Ren, Y., and Li, T. (2024). Analysis of spring drought in Northeast China from the perspective of atmosphere, snow cover, and soil. Catena 236:107715. doi: 10.1016/j.catena.2023.107715
Peng, L., Sheffield, J., Wei, Z., Ek, M., and Wood, E. F. (2024). An enhanced standardized precipitation–evapotranspiration index (SPEI) drought-monitoring method integrating land surface characteristics. Earth Syst. Dynam. 15, 1277–1300. doi: 10.5194/esd-15-1277-2024
Qin, G., Wang, N., Wu, Y., Zhang, Z., Meng, Z., and Zhang, Y. (2024). Spatiotemporal variations in eco-environmental quality and responses to drought and human activities in the middle reaches of the Yellow River basin, China from 1990 to 2022. Ecol. Inform. 81:102641. doi: 10.1016/j.ecoinf.2024.102641
Ren, H., Du, L., Peng, C., Yang, J., and Gao, W. (2024). The composite drought index incorporated solar-induced chlorophyll fluorescence enhances the monitoring capability of short-term drought. J. Hydrol. 637:131361. doi: 10.1016/j.jhydrol.2024.131361
Ren, X., Li, P., Wang, D., Zhang, Q., and Ning, J. (2024). Drivers and characteristics of groundwater drought under human interventions in arid and semiarid areas of China. J. Hydrol. 631:130839. doi: 10.1016/j.jhydrol.2024.130839
Shi, X., Wang, L., Ding, H., Liu, S., and Lv, W. (2024). Assessment the impact of drought on vegetation carbon source/sink at a spatial scale and identify the dominant factors in the middle reaches of the Yellow River Basin, China. Hum. Ecol. Risk. Assess. 30, 546–569. doi: 10.1080/10807039.2024.2387056
Suo, N., Xu, C., Cao, L., Song, L., and Lei, X. (2024). A copula-based parametric composite drought index for drought monitoring and applicability in arid Central Asia. Catena 235:107624. doi: 10.1016/j.catena.2023.107624
Usman, U., Yelwa, S. A., Gulumbe, S. U., Danbaba, A., and Nir, R. (2013). Modelling relationship between NDVI and climatic variables using geographically weighted regression. J. Math. Sci. Appl. 1, 24–28. doi: 10.12691/jmsa-1-2-2
Wang, L., Jia, B., Yang, F., Huang, Q., Peng, Q., Wu, R., et al. (2025). Anthropogenic coal mining reducing groundwater storage in the Yellow River Basin. Sci. Total Environ. 958:178120. doi: 10.1016/j.scitotenv.2024.178120
Wang, Z., Li, J., Hou, J., Zhao, K., Wu, R., Sun, B., et al. (2024). Enhanced evapotranspiration induced by vegetation restoration may pose water resource risks under climate change in the Yellow River Basin. Ecol. Indic. 162:112060. doi: 10.1016/j.ecolind.2024.112060
Wang, S., Li, R., Wu, Y., and Zhao, S. (2022a). Effects of multi-temporal scale drought on vegetation dynamics in Inner Mongolia from 1982 to 2015, China. Ecol. Indic. 136:108666. doi: 10.1016/j.ecolind.2022.108666
Wang, S., Li, R., Wu, Y., and Zhao, S. (2022b). Vegetation dynamics and their response to hydrothermal conditions in Inner Mongolia, China. Glob. Ecol. Conserv. 34:e02034. doi: 10.1016/j.gecco.2022.e02034
Wang, S., Wang, W., Wu, Y., Li, W., Zhao, S., and Chen, Z. (2023). Effects of a changing climate and anthropogenic impacts on net primary production in Yinshanbeilu, Inner Mongolia, China. Environ. Impact Assess. Rev. 102:107185. doi: 10.1016/j.eiar.2023.107185
Wang, Y., Wang, J., and Zhang, Q. (2024). Analysis of ecological drought risk characteristics and leading factors in the Yellow River Basin. Theor. Appl. Climatol. 155, 1739–1757. doi: 10.1007/s00704-023-04720-w
Wang, W., and Yang, Y. (2024). Spatial-temporal differentiation characteristics and driving factors of China's energy eco-efficiency based on geographical detector model. J. Clean. Prod. 434:140153. doi: 10.1016/j.jclepro.2023.140153
Wang, W., Yang, H., Huang, S., Wang, Z., Liang, Q., and Chen, S. (2024). Trivariate copula functions for constructing a comprehensive atmosphere-land surface-hydrology drought index: a case study in the Yellow River basin. J. Hydrol. 642:131784. doi: 10.1016/j.jhydrol.2024.131784
Wei, W., Yan, P., Zhou, L., Zhang, H., Xie, B., and Zhou, J. (2024). A comprehensive drought index based on spatial principal component analysis and its application in northern China. Environ. Monit. Assess. 196:193. doi: 10.1007/s10661-024-12366-y
Wu, F., Yang, X., Yuan, X., Ren, L., Yuan, S., Yuan, F., et al. (2024). How will drought evolve in global arid zones under different future emission scenarios? Journal of Hydrology: Regional Studies 51:101661. doi: 10.1016/j.ejrh.2024.101661
Wu, J., Zhang, X., Wang, G., Wu, W., Zhang, D., and Lan, T. (2024). Impacts of hydrometeorological regime shifts on drought propagation: the meteorological to hydrological perspective. J. Hydrol. 638:131476. doi: 10.1016/j.jhydrol.2024.131476
Wu, H., Zhou, P., Song, X., Sun, W., Li, Y., Song, S., et al. (2024). Dynamics of solar-induced chlorophyll fluorescence (SIF) and its response to meteorological drought in the Yellow River Basin. J. Environ. Manag. 360:121023. doi: 10.1016/j.jenvman.2024.121023
Xiao, L., Zhou, J., Wu, X., Khan, M. A., Zhao, S., and Wu, X. (2024). The dominant influence of terrain and geology on vegetation mortality in response to drought: exploring resilience and resistance. Catena 243:108156. doi: 10.1016/j.catena.2024.108156
Yan, S., Weng, B., Yan, D., Fu, Q., and Wang, H. (2024). Evaluation of adaptive capacity of slope regulation and storage measures on the loess plateau under drought stress. Agric. Water Manag. 306:109184. doi: 10.1016/j.agwat.2024.109184
Yi, Z., and Wenjiao, S. U. O. (2024). Spatialtemporal variation characteristics of drought in the Fenhe River basin based on CWSI. Arid Zone Res. 41, 191–199.
Yin, G., He, W., Liu, X., Xia, Y., and Zhang, H. (2024). Wetting or greening? Probing the global trends in vegetation condition index (VCI). Int. J. Appl. Earth Obs. Geoinf. 129:103822. doi: 10.1016/j.jag.2024.103822
Yu, H., Li, B., Zhang, H., Ren, Z., Zhao, M., and An, X. (2025). Exploring coupled coordination and synergistic evolution in a multi-dimensional water system of the Yellow River Basin. Ecol. Indic. 176:113687. doi: 10.1016/j.ecolind.2025.113687
Yu'an, W. (2025). Plant biodiversity and drought resilience: insights from a resilience model study in North America. Ecol. Front. 45, 507–513. doi: 10.1016/j.ecofro.2024.12.013
Zhang, L., Chang, J., Guo, A., Zhou, K., Yang, G., and Zou, D. (2024a). Ecological drought evolution characteristics under different climatic regions in the Yangtze River basin. J. Hydrol. 629:130573. doi: 10.1016/j.jhydrol.2023.130573
Zhang, L., Deng, C., Kang, R., Yin, H., Xu, T., and Kaufmann, H. J. (2024b). Assessing the responses of ecosystem patterns, structures and functions to drought under climate change in the Yellow River Basin, China. Sci. Total Environ. 929:172603. doi: 10.1016/j.scitotenv.2024.172603
Zhang, Q., Li, Y. P., Huang, G. H., Wang, H., and Shen, Z. Y. (2024). Bayesian analysis of variance for quantifying multi-factor effects on drought propagation. J. Hydrol. 632:130911. doi: 10.1016/j.jhydrol.2024.130911
Zhao, X., Tan, S., Li, Y., Wu, H., and Wu, R. (2024). Quantitative analysis of fractional vegetation cover in southern Sichuan urban agglomeration using optimal parameter geographic detector model, China. Ecol. Indic. 158:111529. doi: 10.1016/j.ecolind.2023.111529
Zhao, W., Wu, J., Du, E., Deng, X., Sun, G., and Wang, G. (2024). Deciphering the influence of climate change and human activities on the drought propagation. J. Hydrol. Reg. Stud. 51:101654. doi: 10.1016/j.ejrh.2024.101654
Keywords: Inner Mongolia section of the Yellow River Basin, CWSI, geodetector, drivingfactors, drought monitoring
Citation: Wang S, Xu K, Ma X, Hu W, Zhao J, Wang F, Su D, Zhang Z, Wu Y and Li M (2025) Characteristics of spatial and temporal changes of drought in the Inner Mongolia section of the Yellow River Basin based on geodetector. Front. Clim. 7:1656424. doi: 10.3389/fclim.2025.1656424
Edited by:
Jose Antonio Rodriguez Martin, Instituto Nacional de Investigación y Tecnología Agroalimentaria (INIA), SpainReviewed by:
Fang Wan, North China University of Water Conservancy and Electric Power, ChinaYunqian Wang, Qufu Normal University, China
Copyright © 2025 Wang, Xu, Ma, Hu, Zhao, Wang, Su, Zhang, Wu and Li. This is an open-access article distributed under the terms of the Creative Commons Attribution License (CC BY). The use, distribution or reproduction in other forums is permitted, provided the original author(s) and the copyright owner(s) are credited and that the original publication in this journal is cited, in accordance with accepted academic practice. No use, distribution or reproduction is permitted which does not comply with these terms.
*Correspondence: Xiaoming Ma, bWF4aWFvbWluZ0BlbWFpbHMuaW1hdS5lZHUuY24=