 Jie Chen
 Sanmang Wu1*
- 1School of Economics and Management, China University of Geosciences Beijing, Beijing, China
- 2School of Management, Zhaotong University, Zhaotong, China
- 3School of Economics, Zhejiang University, Hangzhou, China
This study systematically examines the evolution and driving factors of embodied CO2 emission transfers in trade between Chinese provinces and ASEAN countries from 2002 to 2017. Employing a global multi-regional input–output (MRIO) model embedded with Chinese provincial data and structural decomposition analysis (SDA), we quantify the CO2 emissions embodied in exports (EEE) from 30 Chinese provinces to 10 ASEAN member countries. The analysis explores temporal trends, provincial and sectoral distribution, export routes, and driving forces. The key findings are as follows: (1) As China-ASEAN economic ties have strengthened, China’s EEE to ASEAN have shown a sustained upward trend, with Indonesia, Malaysia, Thailand, and Vietnam being the primary recipients. Heavy industries such as electricity, metal smelting, non-metallic mineral products, and chemicals are the dominant sources of these embodied emissions. (2) Coastal provinces such as Guangdong, Jiangsu, and Zhejiang have consistently served as major contributors to EEE. However, the contribution from several inland provinces has increased in later periods, revealing a spatial pattern of “coastal dominance and inland indirect participation” in interprovincial carbon transfer. (3) The export routes have shifted from predominantly international circulation toward a coexistence of domestic and international dual circulation, indicating the growing resilience of China’s domestic market and supply chains under the “dual circulation” strategy. (4) The expansion of final demand in ASEAN countries is identified as the primary driver behind China’s increasing EEE, whereas reductions in carbon intensity and structural upgrading of exports have partially offset the growth in emissions. This study highlights the importance of holistically considering inter-provincial disparities in emission transfers and advocates for improving regional and sectoral coordination in carbon mitigation policies, aiming to facilitate a green transition in China–ASEAN trade relations.
1 Introduction
In the context of global climate change, the equitable allocation of carbon reduction responsibilities has become a critical issue of international concern. Due to the geographical separation between production and consumption, a substantial amount of CO2 emissions is transferred across borders through international trade (Spaiser et al., 2019). As the “world’s factory,” China plays a central role in the embodied CO2 emissions transfer (Baumert et al., 2019). With the continued expansion of global trade, the volume of embodied CO2 emissions associated with China’s export activities has increased rapidly. China now accounts for over one-fifth of global trade-related carbon transfers and has become a prominent net exporter of embodied carbon (Tang et al., 2022). As early as 2005, emissions from the production of export goods already accounted for nearly one-third of China’s total emissions (Weber et al., 2008). This growing trend in embodied emissions has imposed substantial pressure on China’s efforts to reduce emissions. In 2022, China’s CO2 emissions reached 11.4 billion tons, representing 30.68% of global emissions (Wang et al., 2025). Environmental and resource constraints have long been key obstacles to the country’s sustainable development. China’s export-oriented growth model is a major driver of rising emissions (Zhao et al., 2024). While this model has generated significant economic benefits, it has also incurred considerable environmental costs, particularly in the form of embodied emissions in export goods (Li Q. et al., 2022). This underscores the urgency for China to restructure its economy and trade patterns, enhance carbon efficiency in trade, and achieve the decoupling of economic growth from carbon emissions.
In recent years, China’s trade relationship with ASEAN countries has deepened significantly, not only in terms of trade volume but also through greater integration within regional value chains (Tang et al., 2024). In 2020, ASEAN surpassed the EU to become China’s largest trading partner, with bilateral trade reaching 4.74 trillion RMB, reflecting a 7% year-on-year increase. This growing trade relationship has profound implications for embodied carbon transfer. Studies have shown that China’s net embodied carbon exports to ASEAN peaked after ASEAN became its top trading partner (Yi et al., 2023), suggesting that a substantial portion of China’s emissions is driven by final consumption in ASEAN countries, thus reallocating carbon responsibilities across borders. Embodied CO2 emissions in exports (EEE) refers to the total CO₂ emissions generated throughout export products’ life cycle—from raw material extraction, manufacturing, and transportation to final consumption (Steinberger et al., 2012). When a country satisfies domestic demand through imports, the associated emissions from production are effectively outsourced to the exporting country. Existing literature highlights that developed countries often transfer high-emission, energy-intensive production to developing economies, and this is one of the key factors driving China’s increase in embodied CO2 emissions (Li Q. et al., 2022). A comprehensive understanding of China–ASEAN embodied carbon transfer dynamics is therefore essential to support China’s decarbonization agenda.
Current studies on embodied emissions in international trade primarily focus on accounting methods, responsibility allocation, and decomposition of driving forces (Deng et al., 2021). Multi-Regional Input–Output (MRIO) models are widely used to assess embodied carbon flows between countries and to explore the “pollution haven” effect and carbon leakage (Ali and Wang, 2024). For China, extensive research has examined its trade-related carbon emissions with developed economies such as the United States and the European Union. For instance, in 2019, China was responsible for 3.8, 3.5, 2.3, and 1.2% of the production-side CO2 emissions associated with the consumption of the U.S., EU, ASEAN, and Japan, respectively (Zhang et al., 2021). However, studies specifically addressing China–ASEAN embodied carbon trade remain relatively limited. Existing works tend to treat China as a single aggregate unit and analyze the volume and change of China’s EEE to ASEAN, using structural decomposition analysis (SDA) to identify key drivers (Zhang et al., 2020). In contrast, few studies focus on the provincial-level interactions between China and ASEAN countries. This overlooks substantial differences among Chinese provinces in terms of industrial structure, energy efficiency, and emission profiles. In fact, there is significant heterogeneity in energy and industrial structures across provinces (Qu et al., 2020). Ignoring such regional disparities by using national aggregates may obscure the true pattern of interregional carbon flows and lead to misinterpretations of provincial carbon responsibilities (Li C. et al., 2022). Therefore, a province-level analysis is needed to reveal the distinct roles of different regions in China’s EEE to ASEAN.
Furthermore, China’s “dual circulation” strategy, proposed in 2020, emphasizes the interaction between domestic and international economic cycles, offering a new lens to study the carbon transfer of trade and industrial linkages (Yifu and Wang, 2022). Recent studies indicate that inland provinces tend to transfer emissions to coastal provinces via domestic trade, which then export goods to international markets—implying that coastal regions serve as key hubs linking domestic and global carbon flows (Han et al., 2020). Several recent studies have explored China’s dual circulation development strategy in the context of carbon emissions. For example, Liu examined how boosting domestic demand can impact CO2 outputs (Liu et al., 2024), while Zhang analyzed inter-provincial carbon transfers under a domestic circulation model (Zhang et al., 2024). Additionally, the Hypothetical Extraction Method (HEM) has been applied to identify key emission linkages in trade (Wang et al., 2013; Zhao et al., 2016). However, these works either treat domestic and international supply-chain effects separately or focus on broader national trends. Our study differs by integrating provincial-level data into a global input–output model that explicitly tracks embodied CO2 flows via both domestic and international routes. We capture the dual-circulation pathways within one framework and provide a more granular understanding of how China’s provinces contribute to and are affected by ASEAN-bound emissions transfers. This approach allows us to uncover province-specific dynamics and policy implications that were not addressed in previous studies.
This paper develops a nested province-to-country analytical framework to investigate the spatiotemporal dynamics and driving factors of embodied CO2 emissions transfer from Chinese provinces to ASEAN countries through both domestic and international channels. By integrating Chinese provincial input–output tables with OECD’s MRIO data, we construct a comprehensive MRIO model covering 30 Chinese provinces and 10 ASEAN member countries, and estimate EEE flows from 2002 to 2017. The study first analyzes the temporal trends and spatial-sectoral distribution of EEE transfers, then identifies distinct pathways under the dual circulation strategy, and finally employs Structural Decomposition Analysis (SDA) to quantify the contribution of key drivers to EEE changes. Compared with previous research, this study contributes in several novel ways: (1) It introduces a province-level perspective to global value chain (GVC) analysis, offering a more granular understanding of the origins and flows of embodied emissions in China’s exports. (2) It focuses on the rapidly evolving China–ASEAN trade relationship, filling a critical gap in the literature on South–South trade and carbon transfer. (3) It distinguishes between direct exports and emissions embedded in interprovincial industrial chains under the dual circulation framework, thus deepening the understanding of inter-regional carbon transfer mechanisms. (4) It uses SDA to identify the main drivers of emissions changes across different periods and provinces, providing empirical insights into the dynamics behind provincial emission changes. This study not only enriches the literature on embodied CO2 emissions in trade but also offers valuable evidence for developing regionally coordinated mitigation policies and assessing the environmental impacts of regional trade agreements.
2 Methodology and data
2.1 Multi-regional input–output model
The Multi-Regional Input–Output (MRIO) model enables the tracking and quantification of environmental impacts associated with interregional economic activities, making it a widely adopted framework for calculating embodied CO2 emissions in trade (Meng et al., 2013). In this study, we construct a MRIO table comprising G countries and P Chinese provinces, each with n industrial sectors. The structure of the table is shown in Table 1.
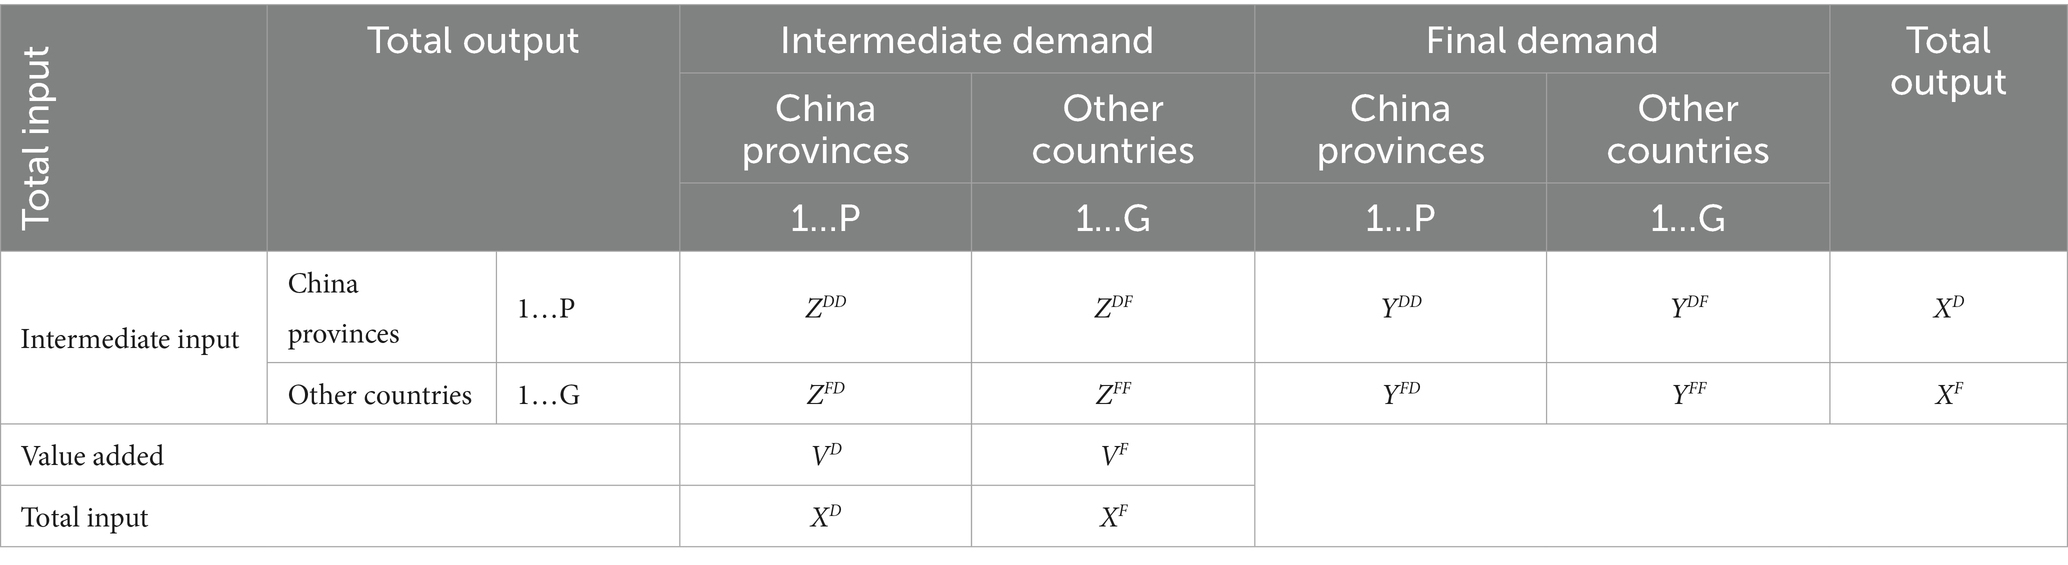
Table 1. The structure of MRIO table with Chinese provinces embedded in the world.
In this framework, the total output of each Chinese province is used to meet intermediate and final demands arising from local consumption, interprovincial trade, and international trade. Let Z denotes the intermediate input matrix, and X denotes the total output vector; inv(·) refers to the generalized inverse. The matrix of direct input coefficients captures the intermediate inputs required per unit of sectoral output, while the Leontief inverse (total requirement coefficients) reflects both direct and indirect effects of changes in final demand on the entire production system. Y is the final demand vector, which comprises all final demand categories (Household consumption, Government consumption, fixed capital formation, and Changes in inventories). Let s index a Chinese source province and r an ASEAN destination country. C represent the CO2 emission intensity (kilotons per unit of output) of each sector, and represent the final demand of ASEAN country r. The CO2 emissions embodied in Chinese province s’s production driven by final demand from ASEAN country r is given by Equation 1:
is the row vector of CO2 emission intensities for province s (i.e., emissions per unit of output by sector). denotes final demand in province s due to country r. u can be any province or country. Similarly, VA denotes the value-added coefficient per unit output, the value added in each Chinese province induced by the final demand of ASEAN country r is calculated by Equation 2:
We define the local value chain inverse matrix , which reflects the endogenous impact of the local (provincial) production system. The embodied CO2 emissions from province s’s direct export of final products to ASEAN country r are calculated by Equation 3:
The embodied CO2 emissions from province s’s exports to ASEAN country r through the intermediate product are calculated by Equation 4:
indicates the block of the Leontief inverse linking province s’s output to province t’s inputs through domestic connections. is the global Leontief inverse matrix, accounting for production that occurs via intermediate inputs from province t to country u. Equation 1 can be written in the form of Equation 5.
The embodied CO2 emissions from province s’s exports to ASEAN country r through the domestic value chain (inter-provincial intermediate product circulation) are calculated by Equation 6:
P is the number of Chinese provinces, G is the number of countries, and t represents countries other than Chinese provinces (reflecting international production linkages). The CO2 emissions from Chinese provinces exported to ASEAN countries through the international value chain (non-domestic part) are calculated by Equation 7:
Thus, we distinguishing three trade routes of embodied CO2 emission. Direct final goods export route (R1): This represents emissions from province s to r via goods that province s produces and directly exports as final products to r. Domestic value chain route (R3): This term aggregates emissions from province s that are embodied in intermediate goods sent to other Chinese provinces t, which in turn produce final goods exported to ASEAN r. International value chain route (R4): This term quantifies emissions from s that enter supply chains involving foreign countries before reaching ASEAN r.
The hypothetical extraction method (HEM) is used to calculate the impact of ASEAN countries on the embodied CO2 emissions of various Chinese provinces. Assuming the removal of ASEAN countries, the change in CO2 emissions for each Chinese province is calculated by Equation 8:
Where B1 is the Leontief inverse matrix after removing ASEAN countries, and YT2 is the final demand after removing ASEAN countries. Finally, the proportional impact of ASEAN country r on the CO2 emissions of each Chinese province is calculated by Equation 9:
Where represents CO2 emissions when ASEAN countries are included, used to indicate the degree of contribution of ASEAN countries to CO2 emissions in each Chinese province.
2.2 Structural decomposition analysis
To investigate the driving forces behind changes in embodied carbon flows under the dual circulation framework, we divide economic interactions into domestic and international cycles, i.e., Equation 10:
Where BD represents the relationship within the domestic economic system (domestic circulation), and BG represents the input–output relationship generated by international trade (international circulation).
Let YTdm represent the total final demand of the ten ASEAN countries, and YSdm denote the structure of the final demand of ASEAN. . Subscripts 1 and 2 represent the initial and final year, respectively. Structural Decomposition Analysis (SDA) is employed to break down changes in embodied CO2 emissions from Chinese provinces to ASEAN into five driving factors (Equation 11).
We adopt a two-polar decomposition for the change in embodied CO2 emission, because of the symmetric decomposition, the factor contributions are unique. All factors are calculated by holding other factors constant at both endpoints and averaging the two extreme estimates, as shown in Equation 12:
The five driving factors are: Changes in carbon intensity (ΔCO₁), Changes in domestic value chain effects (ΔCO₂), Changes in international value chain effects (ΔCO₃), Changes in the structure of final demand (ΔCO₄), Changes in the scale of final demand (ΔCO₅).
2.3 Data sources
This study relies on a nested MRIO table embedding Chinese provinces into the global economy. To construct this, we first develop a non-competitive MRIO framework that disaggregates China’s national input–output structure into 30 provinces. Due to data constraints, we assume that the export structure of sector i in province r mirrors that of the national export structure for the same sector. This assumption is used to allocate sectoral exports (and imports) at the provincial level. This simplification may introduce biases for provinces with atypical economic profiles. For instance, a province heavily specialized in high-tech manufacturing or resource extraction might export a mix of products that diverges from the national average for that sector, leading to under- or over-estimation of its embodied carbon exports. Although the assumption of structural homogeneity between national and provincial export patterns has limitations, it preserves the integrity of interregional input–output linkages and remains a widely accepted approach in the literature (Meng and Yamano, 2017). Any imbalances between total input and output during this process are adjusted using the RAS balancing method. The provincial input–output tables and sector-level carbon emissions data for China are sourced from the China Emission Accounts and Datasets (CEADs) (Guan et al., 2021). The global MRIO table is obtained from the OECD database, while national carbon emissions inventories by sector are drawn from the International Energy Agency (IEA). The final dataset integrates information across 67 regions, including 30 Chinese provinces (excluding Tibet, Hong Kong, Macao, and Taiwan), 35 major countries, and one aggregated Rest of the World (ROW) region. Each region contains 20 sectors. The ASEAN region includes 10 countries: Brunei, Cambodia, Indonesia, Laos, Malaysia, Myanmar, the Philippines, Singapore, Thailand, and Vietnam.
3 Results and discussion
3.1 Evolution of embodied CO2 emissions in China’s exports to ASEAN
Figure 1 illustrates the evolution of China’s EEE to the ten ASEAN countries from 2002 to 2017. Overall, China’s embodied CO2 emissions exports to ASEAN exhibited a significant upward trend, expanding rapidly with the scale of trade. In 2002, China’s exports to ASEAN were responsible for 25.58 Mt. of CO2 emissions. Subsequently, with the establishment of the China–ASEAN Free Trade Area and the deepening of bilateral economic and trade ties, the scale of embodied carbon transfers continuously climbed, reaching 117.17 Mt. by 2017—an increase of 4.58 times. During this period, China’s export structure shifted from low value-added primary and semi-finished goods toward higher value-added mechanical, electrical, and chemical products. However, given China’s fossil fuel-dominated energy mix, the carbon intensity of exports remained relatively high, leading to a synchronous increase in total embodied carbon emissions with trade volume (Yi et al., 2023).
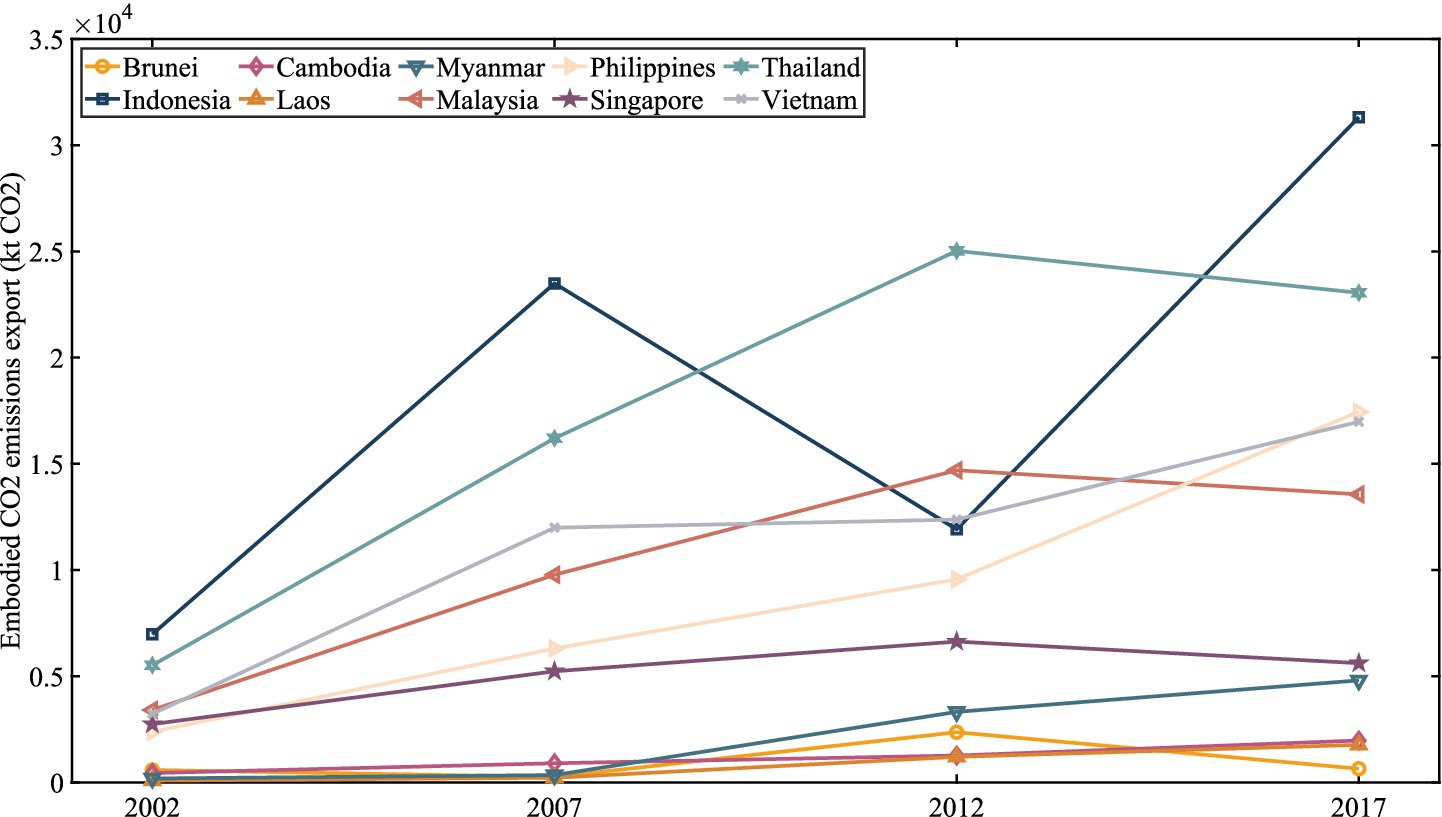
Figure 1. Evolution of China’s EEE to the 10 ASEAN countries from 2002 to 2017.
From the perspective of individual ASEAN countries, there are noticeable differences in the scale of embodied CO2 emissions from China’s exports to different nations. Among the ten ASEAN countries, Indonesia, Thailand, Vietnam, and Malaysia are the primary destinations for China’s EEE, indicating a high degree of economic complementarity with China. These countries may be significant importers of China’s carbon-intensive intermediate products for their own reprocessing and re-export, or they may represent major consumer markets for China’s final carbon-intensive products, reflecting the increasing integration of supply chains between China and key ASEAN economies. In recent years, Vietnam has emerged as one of China’s largest trading partners within ASEAN, and substantial exports of electromechanical equipment and construction materials from China to Vietnam are associated with high carbon emissions. Thailand and Malaysia, as middle-income ASEAN countries, have close industrial divisions of labor with China, and manufactured goods such as machinery and chemicals exported from China to these countries also embody significant carbon emissions. In contrast, China’s EEE to smaller ASEAN economies like Brunei and Laos are relatively minor. This suggests that the intra-ASEAN trade-related carbon transfer from China is also uneven, largely concentrated among a few major trading nations.
Figure 2 further illustrates the relationship between value-added exports and their embodied CO2 emissions for each Chinese province exporting to ASEAN. It can be observed that for most provinces, there is a positive correlation between the value of their exports and the corresponding embodied CO2 emissions, meaning that larger volumes of value-added exports are associated with greater embodied CO2 emissions. Across all years, coastal provinces such as Guangdong, Jiangsu, Shandong, and Zhejiang consistently ranked high in both value-added exports and embodied CO2 exports, which aligns with their status as China’s major manufacturing and export hubs. This indicates that export scale is one of the factors determining the magnitude of provincial CO2 emission transfers. However, differing industrial and energy structures lead to significant variations in the carbon intensity per unit of value-added exports across provinces, reflected by the varying sizes of scatter points in Figure 2. Some central and western provinces, such as Shanxi and Inner Mongolia, whose industries are dominated by coal, power, and raw materials, exhibit “small exports but large carbon emissions” in the figure. This is because, even if their direct export volume to ASEAN is not large, the carbon emissions per unit of value added are very high. Products from these provinces often enter coastal export sectors as intermediate goods through domestic supply chains, with their embodied carbon emissions ultimately being transferred to ASEAN. Conversely, some coastal provinces like Guangdong and Jiangsu exhibit relatively lower carbon emissions per unit of output, which is related to their export product structure leaning towards high-tech manufacturing such as electronics and appliances. These provinces use relatively less energy and generate fewer emissions per unit of value-added export, appearing as “high exports, low carbon emissions” in Figure 2. Overall, embodied CO2 emissions from Chinese provinces’ exports to ASEAN are influenced by both export scale and industrial carbon intensity: eastern coastal provinces, with their enormous export volumes, contribute the majority of embodied CO2 emissions, while some energy-intensive provinces in the central and western regions transfer emissions to ASEAN through indirect channels due to their higher carbon intensity. This highlights the need to consider both scale and efficiency when analyzing trade-related carbon emissions.
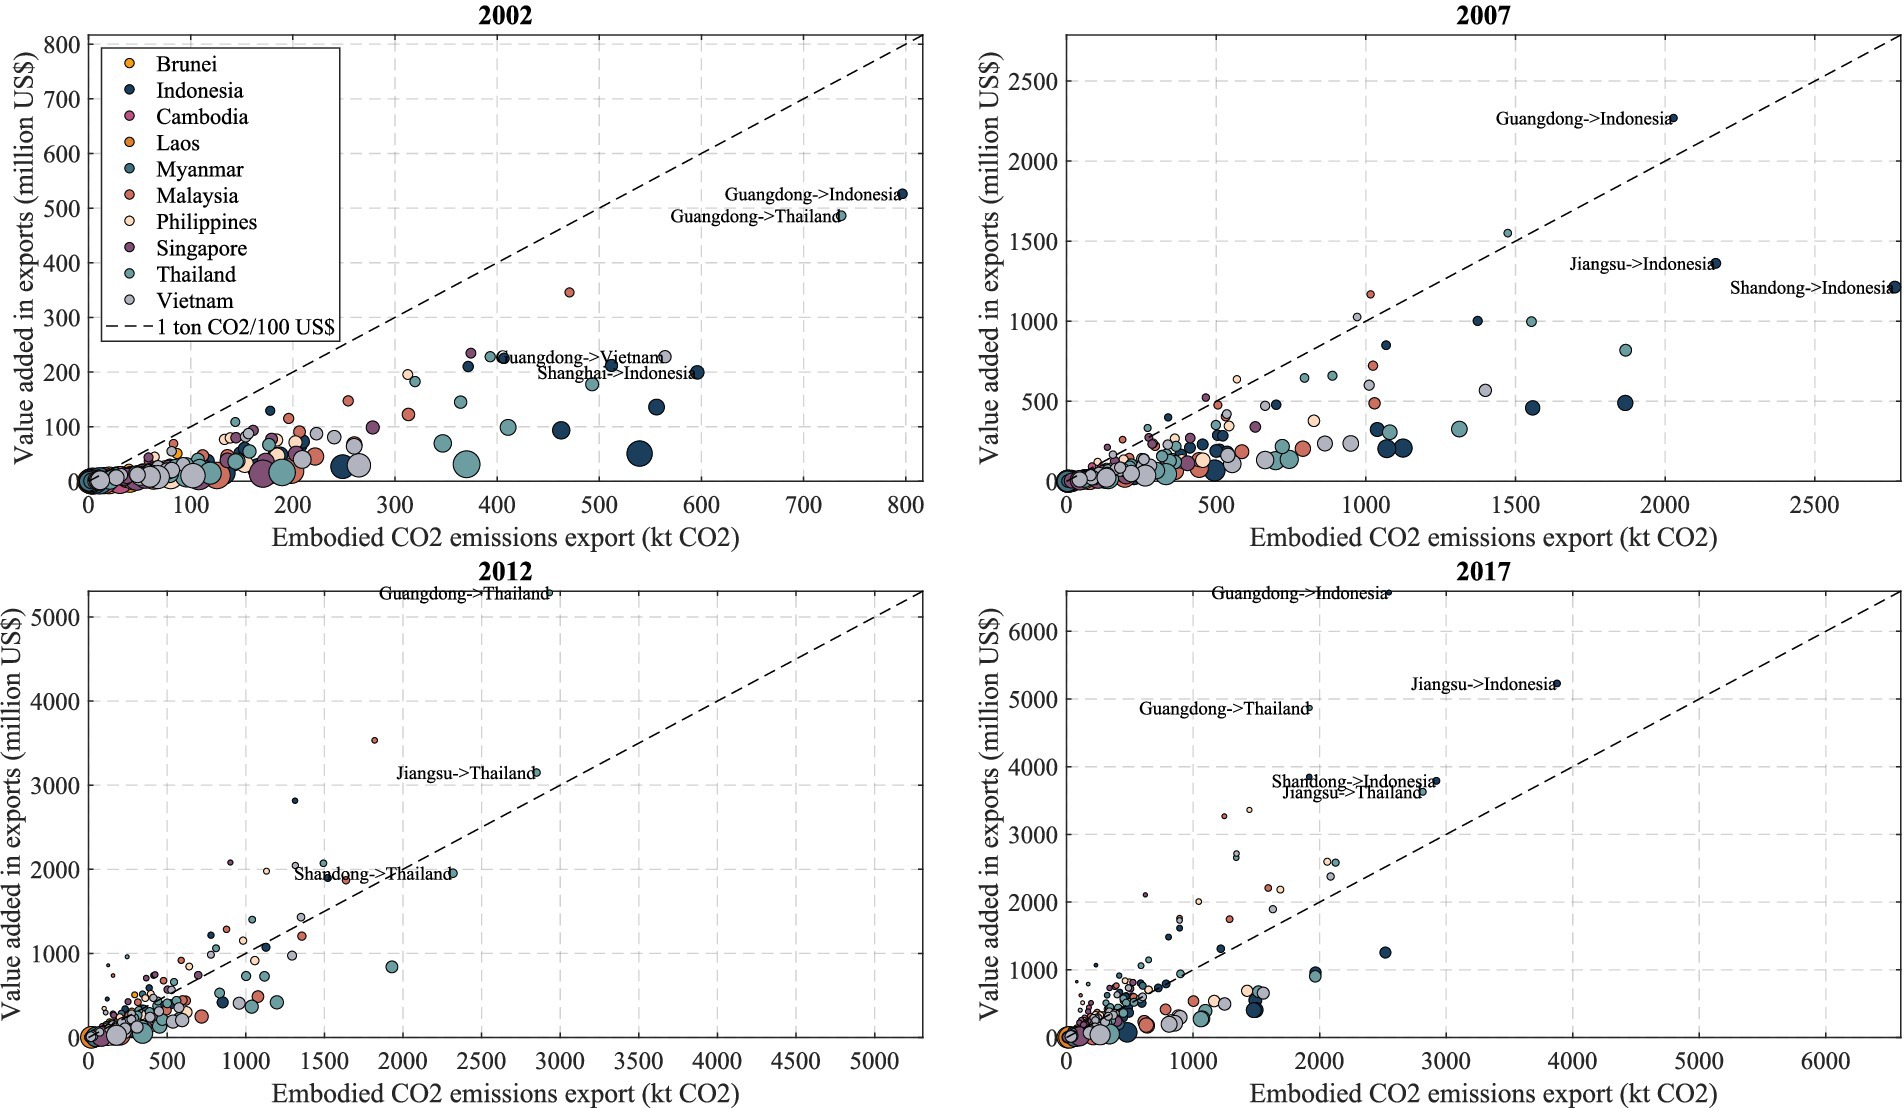
Figure 2. Distribution of embodied CO2 emissions exports and value-added exports from Chinese provinces to ASEAN countries. The size of the circle represents the carbon emissions per unit of exported value added.
3.2 Provincial-level carbon emission transfer patterns
Figures 3, 4 depict the distribution of embodied CO2 emissions from Chinese provinces’ exports to various ASEAN countries in 2002 and 2017, respectively. It can be observed that China’s trade-related CO2 emission transfers to ASEAN exhibit a significant regional concentration, which further intensified during the study period. In 2002, embodied carbon exports were primarily concentrated in a few coastal provinces. Among them, Guangdong’s exports to ASEAN accounted for the highest embodied CO2 emissions (3.47 Mt), significantly exceeding other provinces. This is consistent with Guangdong’s status as a major foreign trade province in China: in 2002, the large volume of light industrial and processing manufactured products exported from Guangdong to ASEAN generated substantial energy consumption and carbon emissions. Shanghai (2.23 Mt) and Liaoning (1.97 Mt) followed, with their exports of steel, chemicals, and other manufactured goods to ASEAN also contributing a large amount of carbon emissions. In contrast, most central and western provinces exhibited relatively low embodied carbon transfers to ASEAN. For instance, many inland provinces in the northwest and southwest (e.g., Ningxia, Qinghai, Shaanxi) had weak trade ties with ASEAN due to geographical location and industrial structure limitations.
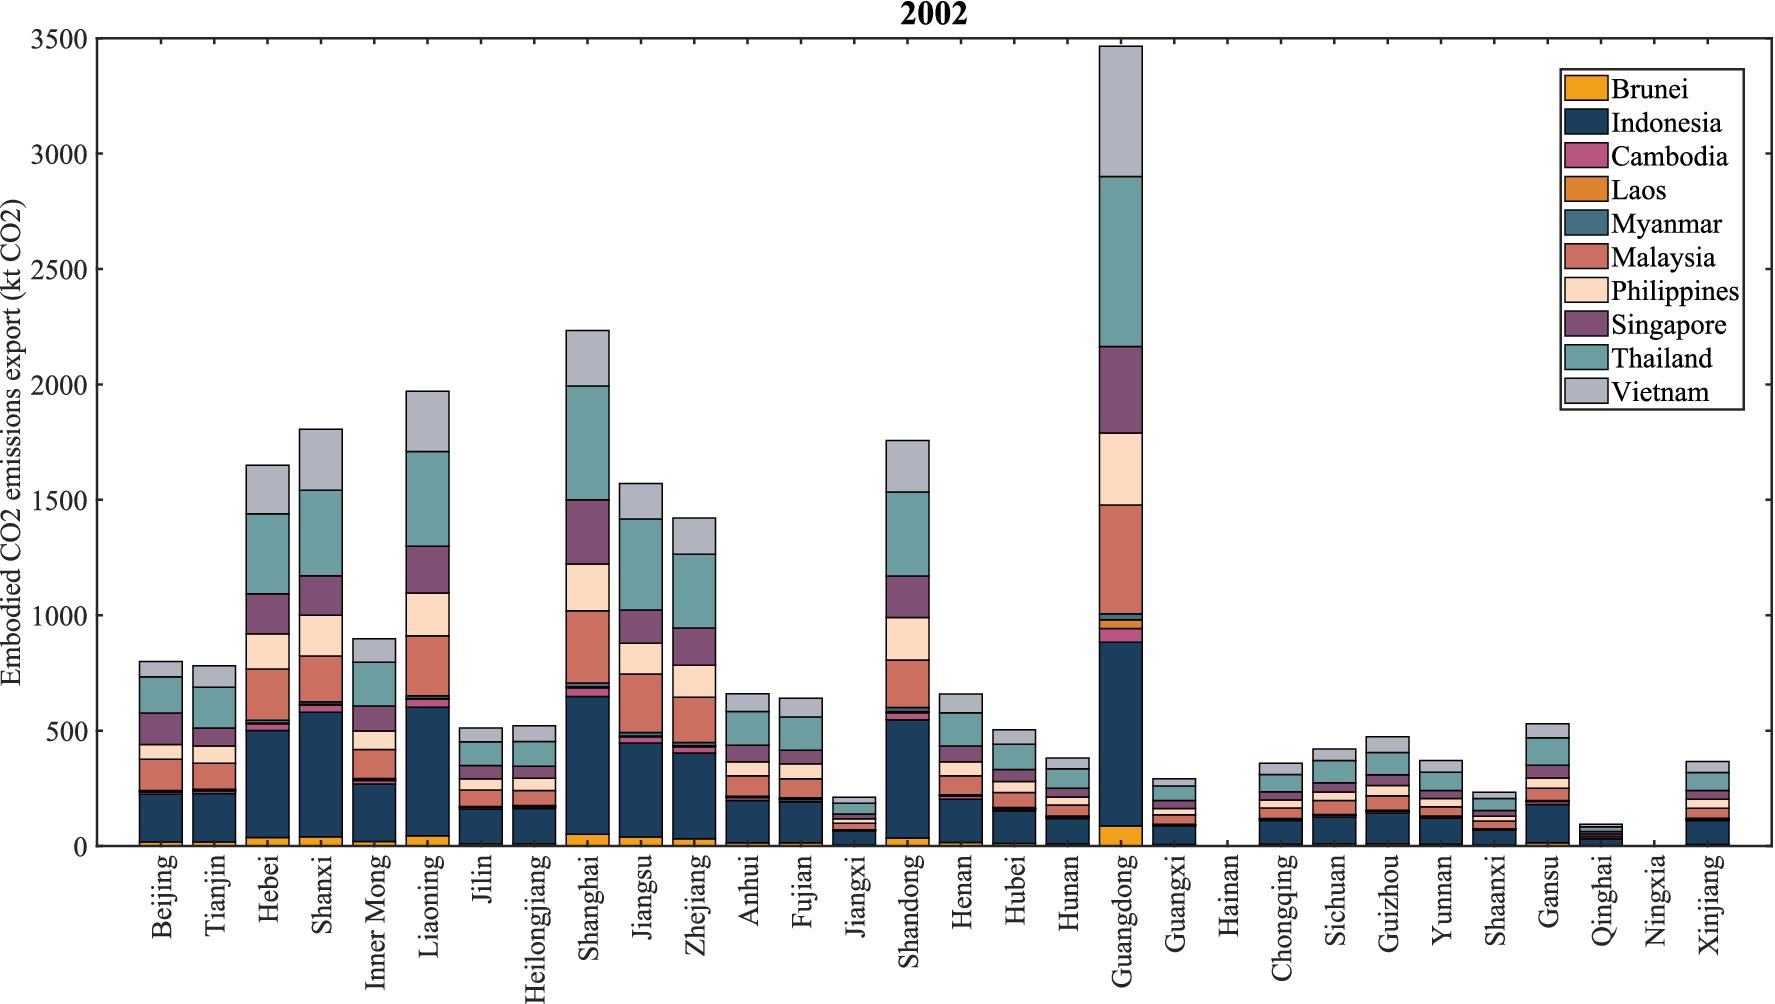
Figure 3. Embodied CO2 emissions exports from Chinese provinces to ASEAN countries in 2002.
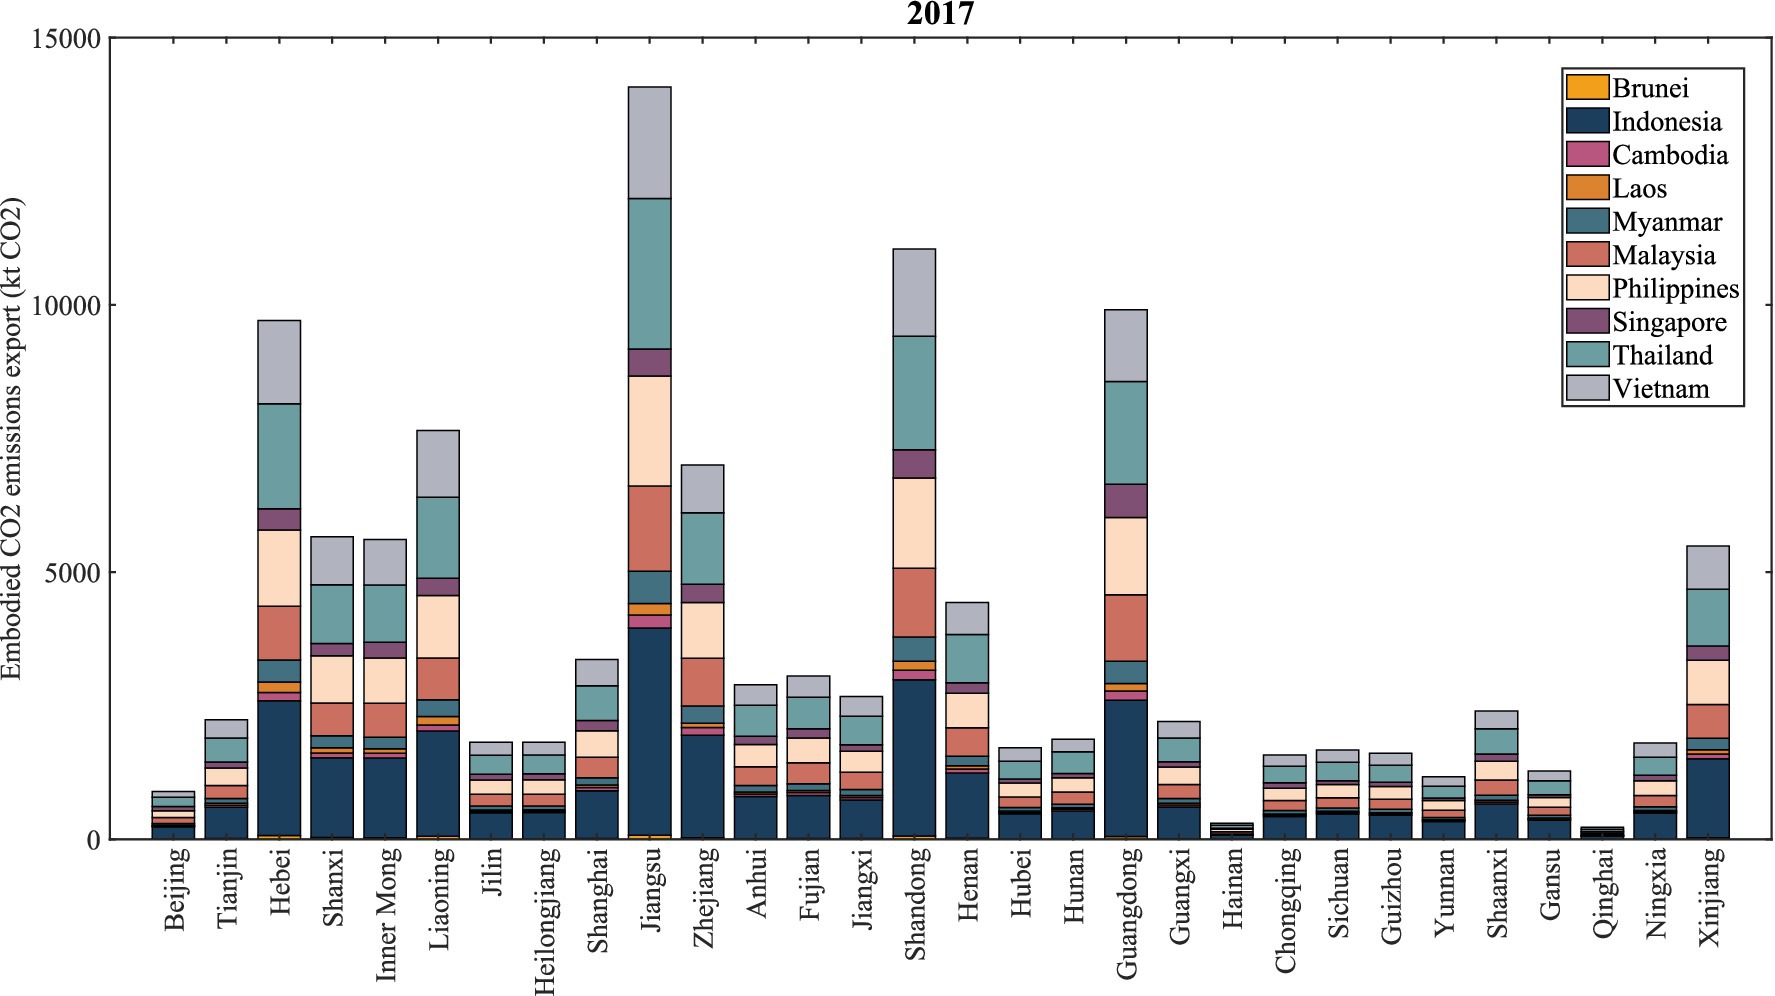
Figure 4. Embodied CO2 emissions exports from Chinese provinces to ASEAN countries in 2017.
By 2017, the overall level of embodied CO2 emissions from provinces’ exports to ASEAN had significantly increased, but the regional imbalance remained prominent. Coastal regions continued to be the main sources of China’s export-related carbon emissions. Jiangsu, as a major manufacturing and export province, ranked first nationwide in EEE to ASEAN in 2017 (14.08 Mt), representing an 8.97-fold increase compared to 2002. Shandong (11.04 Mt) and Guangdong (9.91 Mt) followed closely, with both provinces significantly expanding their exports in heavy industry and manufacturing to ASEAN, leading to a substantial increase in corresponding carbon emission transfers (Han et al., 2020). With the development of border trade and cross-border industrial cooperation, Guangxi and Yunnan exported some embodied emissions from energy raw materials and primary products to ASEAN. However, compared to developed coastal provinces, the volume of carbon emissions exported from central and western provinces to ASEAN remained relatively low. Overall, the eastern coastal provinces are the core regions for China’s carbon emissions to ASEAN, while the central and western regions play a relatively minor role in ASEAN trade-related carbon emissions. This pattern is closely related to domestic industrial layout and reliance on foreign trade: coastal areas concentrate export-oriented industries and possess port advantages, becoming the front-line for domestic carbon emissions transferred abroad; inland areas participate more indirectly in international carbon transfer by providing intermediate inputs to coastal regions. In terms of carbon reduction policies, this implies a need to focus on emission reductions in the major export provinces along the coast, as their export sector reductions play a crucial role in lowering nationwide trade-embodied carbon. Concurrently, inland regions should be guided to strengthen clean production when undertaking industrial transfers, to prevent them from becoming recipients of high-carbon industries.
3.3 Sectoral characteristics of carbon transfers
Figures 5, 6 illustrate the sectoral composition of EEE from China to ASEAN in 2002 and 2017, respectively. The results indicate that China’s EEE to ASEAN are highly concentrated in a few high-emission sectors, with the electricity and heat production and supply industry being the largest source of emissions. In 2017, a substantial portion of China’s EEE transferred to ASEAN originated from the electricity sector (accounting for 45.52%). This is because manufacturing products consume large amounts of electricity during production, and China’s power generation sector heavily relies on coal, resulting in high carbon emission intensity (Xu et al., 2024). As a result, emissions from the power sector are embedded across all export products, regardless of their industry classification. According to IEA statistics, the electricity and heat production sector accounts for approximately 57% of China’s domestic energy-related CO2 emissions. This demonstrates that the high-carbon nature of the electricity sector, through its transmission via foreign trade, becomes the primary source of EEE.
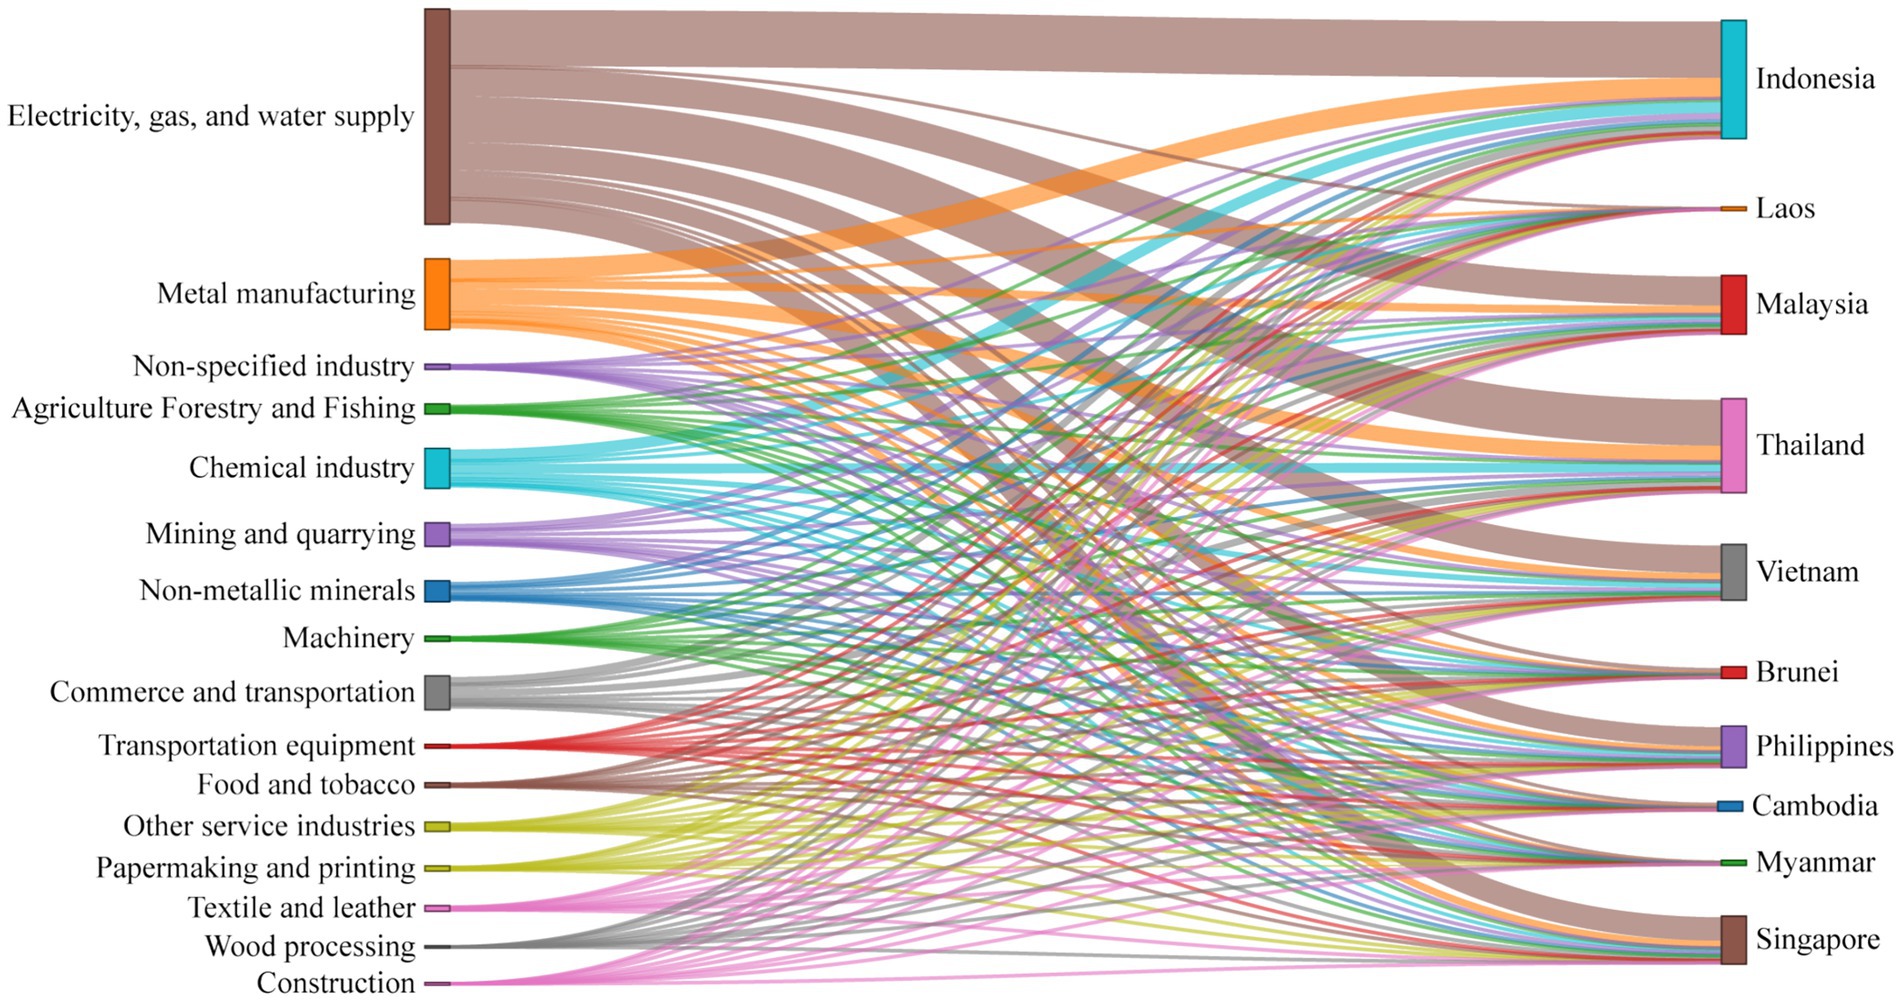
Figure 5. Embodied CO2 emissions of various sectors from China’s exports to ASEAN countries in 2002.
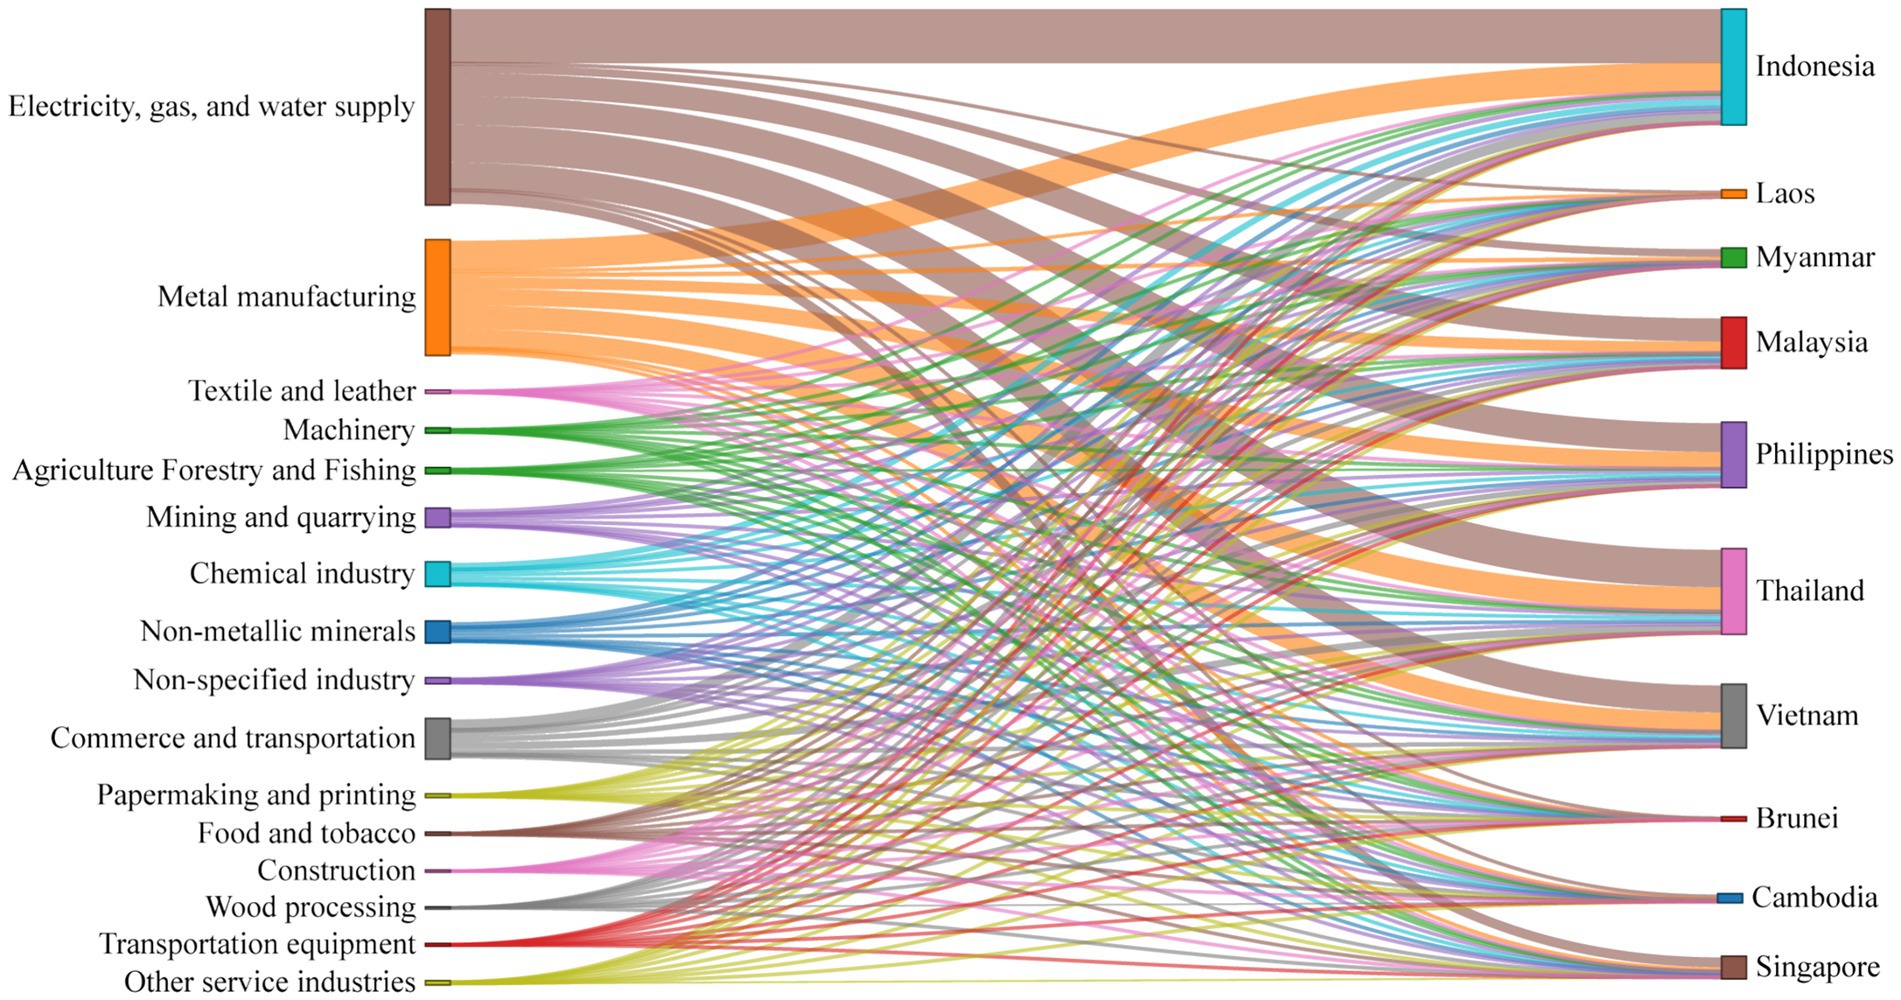
Figure 6. Embodied CO2 emissions of various sectors from China’s exports to ASEAN countries in 2017.
In addition to electricity, China’s EEE to ASEAN mainly originate from several heavy industrial manufacturing sectors. First, the metal smelting and pressing industry contributed 26.75% of EEE. China is a major producer and exporter of steel, and ASEAN countries have a significant demand for steel in infrastructure development. The large volume of steel products exported from China to ASEAN generates high-intensity energy consumption and carbon emissions during their production process. Second, the chemical industry is also an important source, including the production of basic chemical raw materials, fertilizers, and plastics. The production of these products typically requires fuel combustion and high-temperature processes, resulting in high emission intensity, and China’s bulk chemical exports to ASEAN embody substantial emissions. Third, the non-metallic mineral products industry (e.g., cement, glass, ceramics) also accounts for a certain share of export-related CO2 emissions. Cement and glass manufacturing processes emit large amounts of CO2, and as a construction material exporter, China ships considerable building materials to ASEAN. In contrast, light industries and high-tech manufacturing contribute less to carbon emissions. For instance, despite China’s large export volume of textiles and apparel to ASEAN, their production processes have relatively lower energy intensity, resulting in lower emissions per unit of output. While the production of high-tech products like electronic communication equipment requires electricity, their high added value means lower carbon emissions apportioned per unit of output.
Compared to 2002, the export sector emission structure in 2017 largely maintained its characteristic of being dominated by electricity and heavy industries, but some changes also emerged. In 2002, China’s exports to ASEAN were predominantly labor-intensive and primary industrial manufactured goods, and the EEE were similarly concentrated in the electricity, utilities, and primary manufacturing sectors. By 2017, with the upgrading of China’s export structure, the proportion of high value-added manufacturing, such as electromechanical products, in exports increased. However, this did not significantly alter the fact that the bulk of emissions still originated from upstream energy-intensive industries. This is because regardless of the final product, energy-intensive sectors like electricity, steel, and cement play a role as raw material and energy suppliers in the production chain, and their emissions are ultimately reflected in exported products through input–output relationships. Nevertheless, it also showed a decrease in carbon emissions per unit of export output value, indicating that technological progress and industrial upgrading have played a role in emission reduction. This also suggests that by improving energy efficiency and optimizing the structure of export goods, it is possible to reduce embodied CO2 emission intensity while maintaining trade growth, achieving a certain degree of “decoupling.” Some scholars have pointed out that trade openness can facilitate technology diffusion and industrial upgrading, thereby reducing the carbon intensity induced by exports under certain conditions (Shahzad and Miao, 2025). Therefore, continuing to promote the low-carbon transformation of export industries will play an important role in mitigating China’s EEE.
Interestingly, despite the upgrade in final export products by 2017 (with more high-value goods being exported), a large share of the carbon embodied in those exports still originates from a few carbon-intensive upstream sectors. Our analysis reveals that sectors such as electricity, metal smelting, chemicals, and other raw materials remain the predominant sources of CO2 that is ultimately exported to ASEAN. In other words, even when the final exported goods are electronics or machinery, much of their supply chain emissions can be traced back to electricity, steel, cement, and similar fundamental industries in the provinces. This finding reinforces our explanation that China’s heavy industries underpin its export emissions. It also aligns with recent research by (Pan et al., 2025), who, in an accounting of Chinese provincial emissions in global supply chains, found that a substantial portion of emissions crossing the border are rooted in traditional energy and material sectors.
3.4 Export routes of EEE from a dual circulation perspective
Figures 7, 8 present the different pathways of inter-provincial carbon emissions transferred to ASEAN, for 2002 and 2017, respectively. Here, we categorize EEE into three routes: international value chain, domestic value chain, and final product exports. The international value chain refers to CO2 emissions occurring in a province and then transferred to ASEAN through that province’s direct export of products abroad. The domestic value chain, on the other hand, means that CO2 emissions first occur in a province, then move to another province’s export products through inter-provincial goods circulation, and are finally exported to ASEAN by the latter. In short, the domestic value chain corresponds to the indirect transfer pattern of “inland production, coastal export.” In 2002, the transfer of China’s CO2 emissions to ASEAN was primarily accomplished through the international value chain (accounting for 64.59%). Most provinces engaged in export activities directly exported their own products, with their emissions embodied in final or intermediate goods exported to ASEAN. At that time, China’s domestic regional division of labor was still underdeveloped, and export industries were mainly concentrated in coastal areas, with a dominant model of local production and local export. By 2017, although international circulation remained the primary pathway, the importance of domestic circulation had increased compared to the past (rising from 14.62 to 17.23%), particularly for non-coastal inland provinces. Many inland provinces themselves did not have many direct exports to ASEAN, but they participated in indirect exports to ASEAN through domestic industrial chains, leading to the transfer of their CO2 emissions via the domestic circulation pathway. For instance, resource-rich provinces like Shanxi and Shaanxi had very few direct exports to ASEAN in 2017. However, the large quantities of basic products they produced, such as coal, electricity, and steel, were transferred to coastal areas through inter-provincial trade for the production of export-oriented manufactured goods. The CO2 emissions generated from this upstream production were ultimately shipped to ASEAN in the form of manufactured goods from coastal areas, effectively representing CO2 emissions exported by inland provinces through the domestic circulation pathway. In contrast, coastal provinces primarily relied on international circulation, while also bearing a portion of emissions from other provinces through domestic circulation. For example, Guangdong not only directly exported a large volume of goods and their embodied CO2 emissions to ASEAN but also bore a significant amount of intermediate product emissions from inland regions, exhibiting characteristics of both domestic and international circulation.
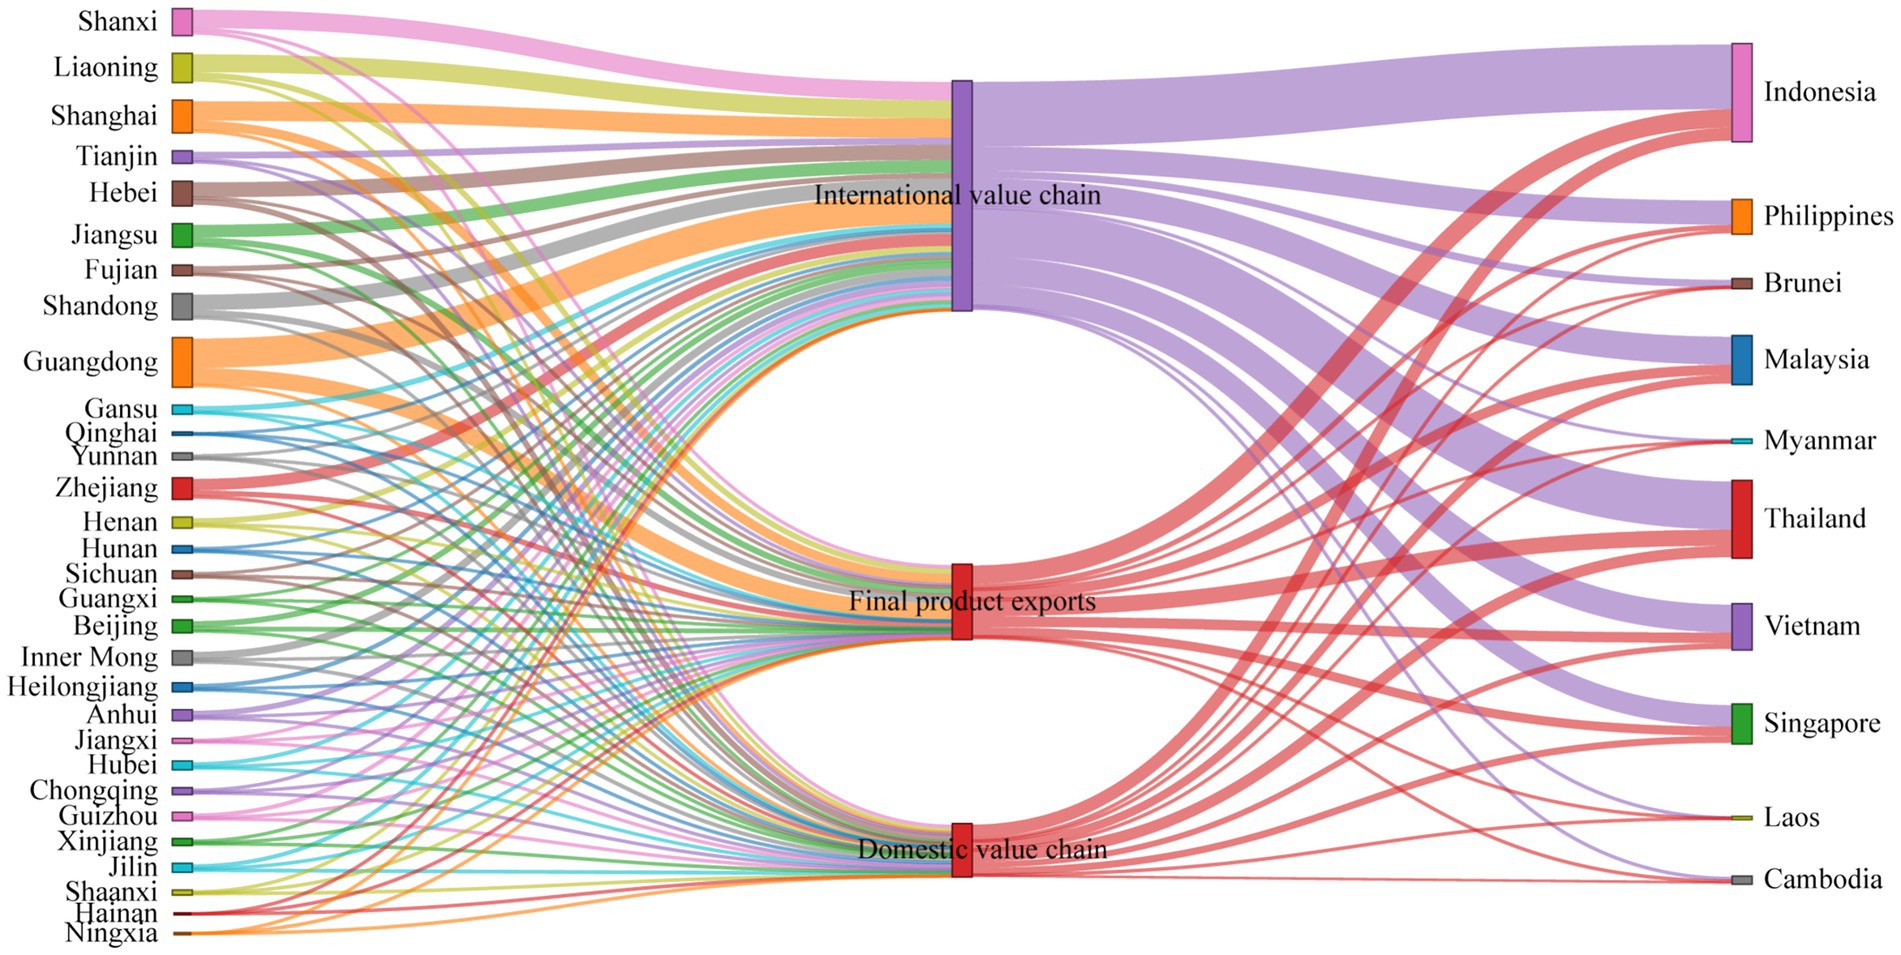
Figure 7. Export routes of CO2 emissions from Chinese provinces to ASEAN countries in 2002.
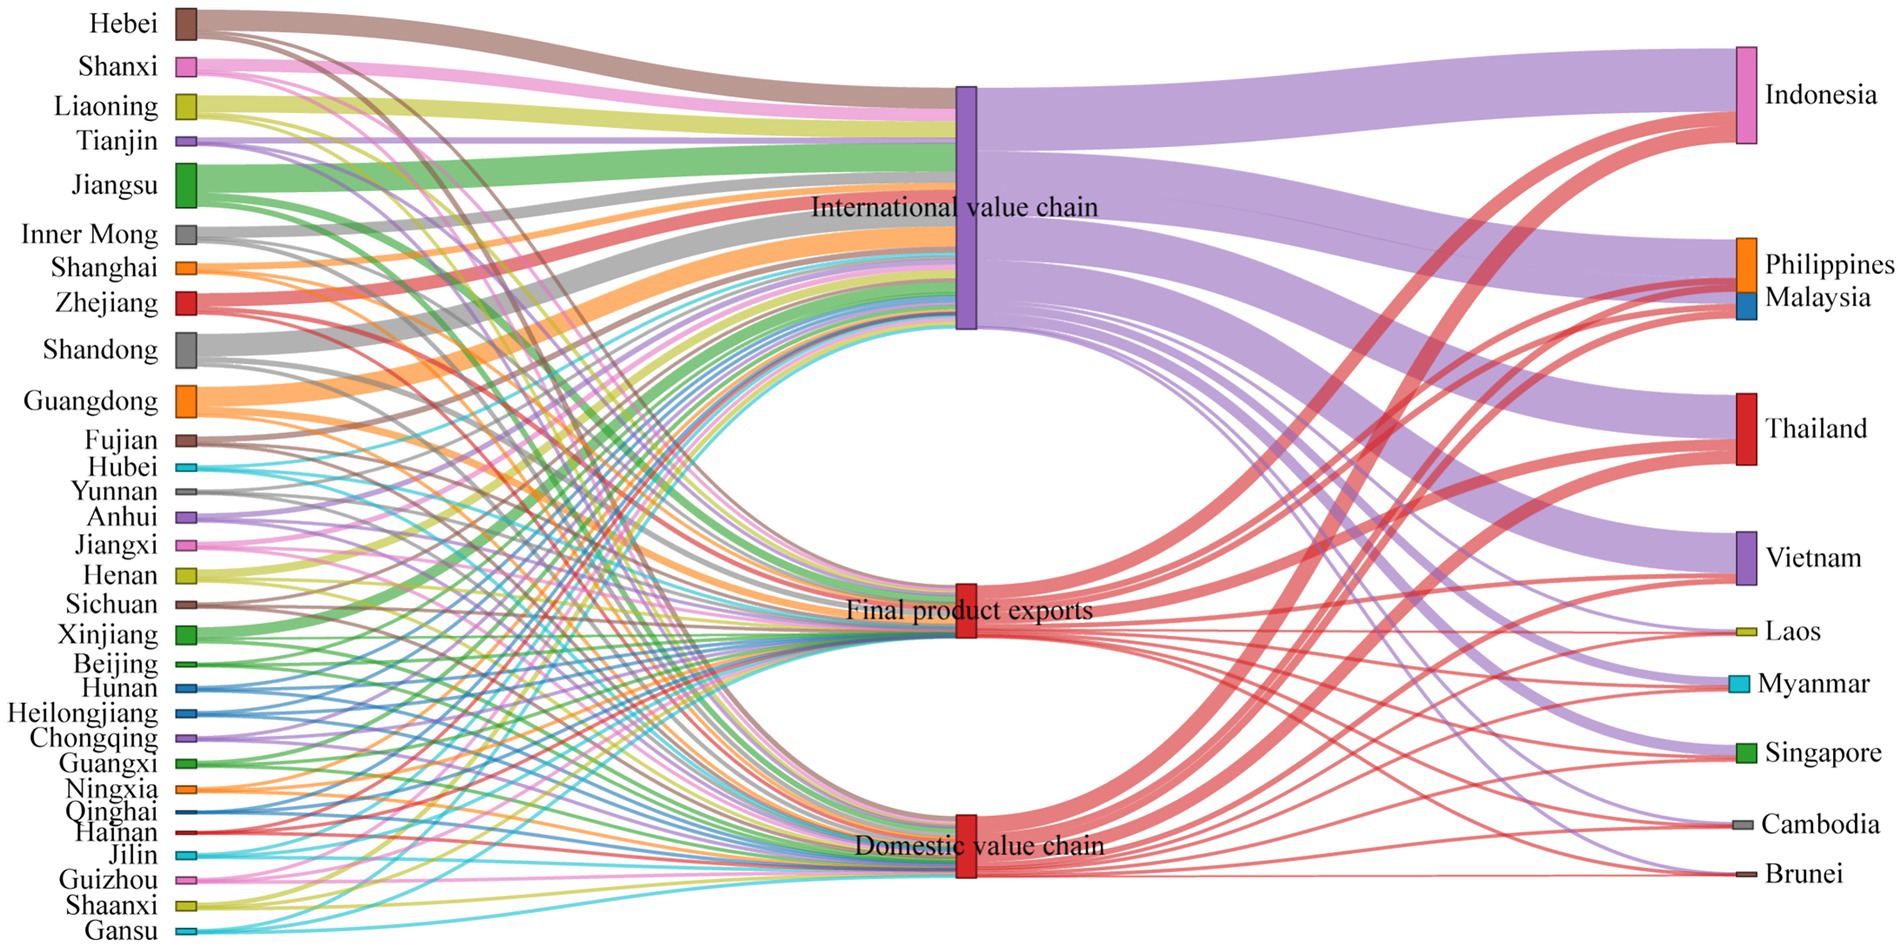
Figure 8. Export routes of CO2 emissions from Chinese provinces to ASEAN countries in 2017.
Therefore, under the “dual circulation” framework, the spatial flow of China’s EEE is more complex: coastal provinces serve as both direct exporters of local emissions and as export hubs for inland emissions; inland provinces participate more indirectly in export embodied CO2 emission transfers. This study finds that international circulation remains the primary mode of carbon emission transfer, but the role of domestic circulation is increasing with deepening regional collaboration. Coastal regions, as the dominant players in international circulation, should consider the emission contributions of their domestic supply chains when accounting for their export CO2 emissions, promoting a mechanism of “shared responsibility between producers and consumers, and joint emission reduction between export regions and source regions.” Simultaneously, while inland regions do not directly face the international market, they indirectly bear international carbon transfers and should enhance the cleanliness of their own production processes, reduce the output of high-carbon products, and thus reduce emissions transferred through domestic circulation from the source (Mo and Wang, 2022). At the national level, regional coordinated emission reduction should be strengthened, such as establishing cross-regional carbon trading and compensation mechanisms to encourage developed coastal regions to assist inland regions in achieving green transformation, thereby realizing nationwide carbon reduction synergy under the dual circulation framework.
The increasing prominence of the domestic circulation route in the results aligns with China’s policy trajectory. The Chinese government has pursued the “internal circulation” component of the dual circulation strategy by implementing measures to stimulate domestic consumption and foster intra-national supply chains. For instance, policies under the 13th and 14th Five-Year Plan encouraged strengthening domestic markets and reducing reliance on exports. These measures include consumption incentive programs, support for domestic technological innovation, and infrastructure investments to better connect inland provinces with coastal economic hubs. Such policies likely contributed to the observed rise of embodied CO2 transfers via domestic routes, as provinces increasingly traded among themselves to meet growing internal demand.
3.5 Driving factors for changes in embodied CO2 emissions exports
Figure 9 presents the decomposition of factors influencing changes in embodied CO2 emissions from Chinese provinces’ exports to ASEAN between 2002 and 2017. The results indicate that the CO2 emission changes in different provinces are influenced to varying degrees by different factors, with significant differences in the dominant driving forces among provinces. Overall, the growth in final demand scale is the primary factor driving the increase in embodied CO2 emissions. Between 2002 and 2017, the rapid expansion of ASEAN’s final demand for Chinese products significantly boosted the export scale of various provinces, consequently leading to substantial new CO2 emissions. Holding other factors constant, an increase in export volume inevitably drives up CO2 emissions, which is particularly evident in major coastal export provinces. For example, provinces like Guangdong and Jiangsu experienced a significant jump in exports to ASEAN over the 15-year period, with the CO2 emission increase attributable to scale effects far exceeding other factors (Deng et al., 2021). In contrast, a decrease in carbon intensity played a role in curbing CO2 emission growth in most provinces. On one hand, China’s industrial sector experienced continuous improvements in energy efficiency during this period, with a year-on-year decrease in carbon intensity per unit of GDP; on the other hand, the proportion of clean energy in the energy mix increased. These factors collectively reduced the CO2 emitted per unit of output produced in many provinces, partially offsetting the emission growth resulting from scale expansion. For example, in Beijing and Shanghai, carbon intensity significantly decreased due to technological upgrades and industrial upgrading, with the intensity effect offsetting a considerable proportion of the scale effect; whereas in energy-dependent provinces like Shanxi and Inner Mongolia, the decrease in carbon intensity was smaller, and their intensity effect contribution was limited.
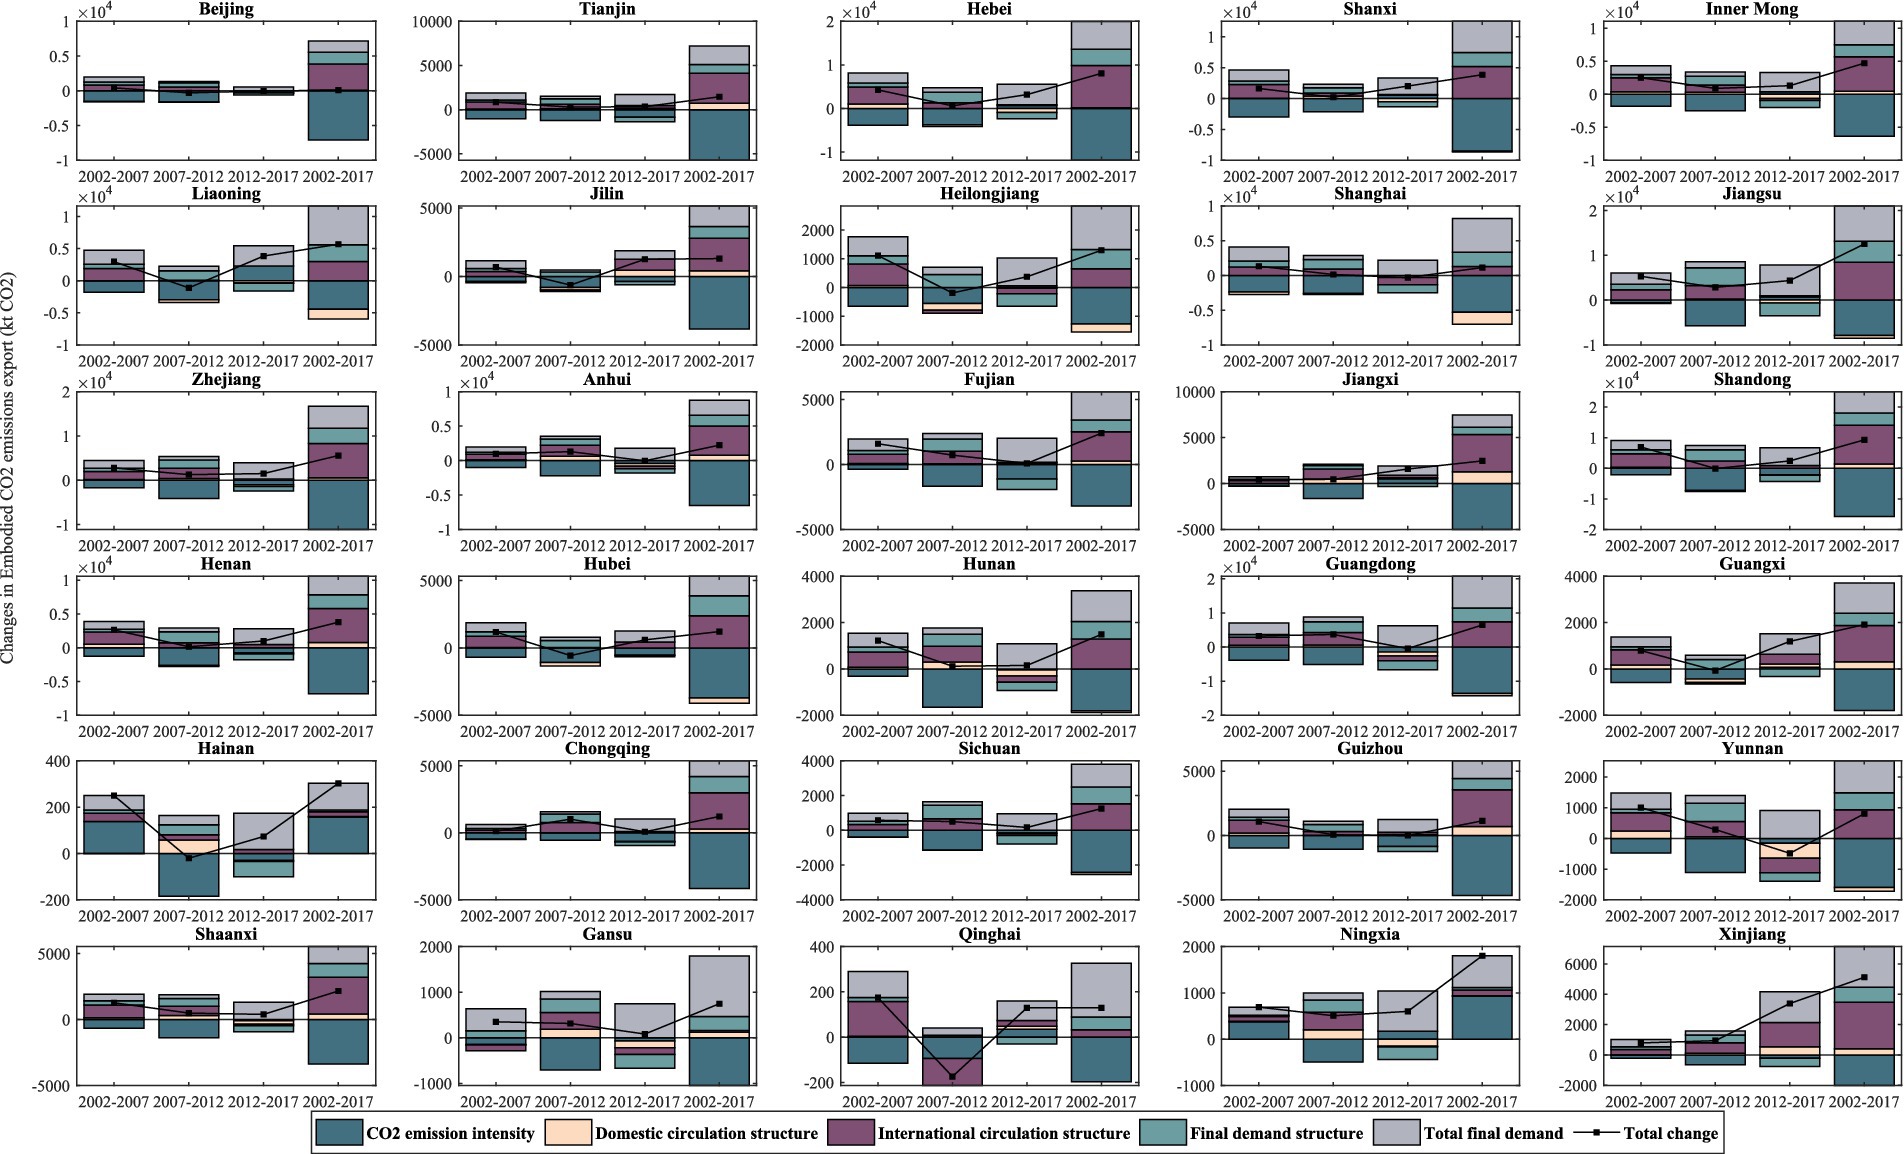
Figure 9. Driving factors for changes in CO2 emissions exports from Chinese provinces to ASEAN.
The impact of export structure effects on changes in CO2 emission transfers showed clear differences across provinces. Some provinces shifted their export product structure towards lower carbon intensity, thereby mitigating CO2 emission growth. For example, Guangdong’s exports gradually transitioned from labor-intensive products to higher value-added electronic and electromechanical products, reducing the proportion of energy-intensive products. Consequently, the structural effect was negative, contributing to the reduction of CO2 emissions. Conversely, provinces like Liaoning and Shanxi experienced a “heavy industrialization” of their export structure during the study period, increasing the export of products from high-emission industries such as metallurgy and chemicals. The rising proportion of these products caused the structural effect to drive an increase in CO2 emissions. The domestic supply chain effect reflects changes in the proportion of local versus external inputs used by each province in its export production. If a province uses more intermediate goods produced within its own province for export production, its direct emission burden increases, and the domestic supply chain effect is positive; conversely, it is negative. The domestic supply chain effect had a minor impact on total emission changes for most provinces but was more significant in a few individual provinces. For example, Zhejiang, as a major coastal manufacturing province, strengthened its local supporting capacity, reducing its reliance on external inputs for export production, which meant more emissions remained within the province, resulting in a positive domestic supply chain effect. Shanghai, on the other hand, reduced its local emission burden through industrial outsourcing, leading to a negative domestic supply chain effect.
Overall, the increase or decrease in embodied CO2 emissions from Chinese provinces’ exports is the result of the combined action of multiple factors. Among these, the driving force of demand scale expansion and the suppressing effect of decreasing carbon intensity are present in almost all provinces, though their relative strengths vary by region. Furthermore, industrial structure adjustments and the evolution of regional division of labor played either positive or negative auxiliary roles in different provinces. This implies that when formulating emission reduction policies, differentiated strategies should be adopted to address the main contradictions in different provinces: for coastal provinces with rapid export growth and dominant scale effects, the focus should be on controlling the growth of high-energy-consuming product exports and encouraging industrial upgrading towards low-carbon directions to reduce emission pressure from scale expansion; for provinces with a significant carbon intensity effect, efforts should continue to intensify technological transformation and energy clean-up to consolidate the achievements of carbon intensity reduction; for provinces with a significantly positive export structure effect, it is necessary to prevent the problem of industrial structure tending towards high-carbonization, and if necessary, guide them to optimize their export product structure. Generally, while technological progress and industrial upgrading have, to some extent, offset the push of trade growth on carbon emissions, they have not yet been sufficient to reverse the upward trend in total emissions. This is consistent with the conclusions of other studies on the driving factors of China’s EEE, namely that economic growth remains the primary driver of increased CO2 emissions, while technology-led carbon intensity reduction is the most important mitigating factor.
4 Conclusion and policy recommendations
This study thoroughly analyzed the evolving characteristics and influencing factors of embodied carbon transfers in exports from Chinese provinces to ASEAN countries during 2002 to 2017. A detailed exploration was conducted across multiple dimensions, including provinces, sectors, value chain routes, and influencing factors. The research reveals a significant upward trend in the total embodied CO2 emissions from China’s exports to ASEAN, indicating that trade expansion has brought increasing pressure on CO2 emissions.
At the provincial level, coastal provinces such as Guangdong, Jiangsu, Shandong, and Zhejiang are the primary contributors to China’s embodied carbon exports to ASEAN, consistent with their status as major manufacturing and export centers. However, significant differences exist in the embodied carbon intensity per unit of value added across provinces, indicating substantial heterogeneity in CO2 emission growth rates and carbon intensity among provinces. This necessitates that policymakers formulate differentiated and customized carbon reduction policies based on each province’s development stage, industrial structure, and its position within domestic and international value chains. Effective carbon reduction strategies must consider the entire domestic supply chain, encourage inter-provincial collaboration in low-carbon transition, and ensure the equitable distribution of carbon reduction responsibilities (Li Q. et al., 2022).
At the sectoral level, heavy industrial sectors, including electricity, gas and water production and supply, metal smelting and pressing, chemical industry, and non-metallic mineral products, consistently dominate China’s embodied carbon exports to ASEAN. This reflects China’s continued reliance on energy-intensive processes for export production. Notably, many high-emission sectors primarily produce intermediate products, indicating that a significant portion of carbon transfers occurs through intermediate product trade. Therefore, decarbonization efforts require targeted interventions for these high-emission sectors, including promoting cleaner production technologies, enhancing energy efficiency, and encouraging China’s transition towards high value-added, low-carbon-intensive industries (Xie et al., 2025). Policymaking should not only focus on final product exports but also on the carbon efficiency of intermediate product production and trade.
In the dual circulation analysis, the study found that the “international value chain” is the dominant pathway for China’s embodied carbon exports to ASEAN. This highlights China’s important position as a producer of intermediate products in global supply chains. Consequently, decarbonization efforts must focus on improving the carbon efficiency of intermediate product production and enhancing the efficiency of the international supply chains through which they are transferred (Liu et al., 2025). Simultaneously, there are significant differences in the reliance of various provinces on international versus domestic value chains, suggesting that policy interventions should be tailored to each province’s specific value chain integration patterns.
Structural decomposition analysis reveals that the factors influencing changes in export-related CO2 emissions vary across provinces. The expansion of total final demand (scale effect) is generally the primary factor driving emission increases, while improvements in carbon intensity (technological effect) contribute to emission reductions. Our province-level dual-circulation analysis adds critical nuance to the general finding that final demand growth is the dominant driver of emissions. Not all provinces conform equally to this pattern. For instance, in some coastal provinces heavily engaged in export manufacturing, improvements in carbon intensity (through technology upgrades) made a more noticeable dent in emissions growth than in other regions. Meanwhile, in certain inland provinces, changes in economic structure (e.g., a shift from heavy industry toward services) played a larger role in mitigating emissions increases. These heterogeneities underscore that a one-size-fits-all policy may not be optimal.
Based on these conclusions, this study proposes the following policy recommendations:
First, implement sector-specific benchmarks for carbon intensity in key export industries. For example, the central government could set progressively stricter CO2-per-output targets for energy-intensive sectors (such as metallurgy, cement, and chemicals) that contribute heavily to inter-provincial or international embodied emissions. Meeting these benchmarks could be tied to economic incentives or recognition, pushing industries to adopt cleaner technologies.
Second, strengthen inter-provincial collaboration for carbon reduction. Given the significant heterogeneity in carbon emission characteristics among Chinese provinces and the phenomenon of carbon transfer within domestic value chains, inter-provincial collaboration should be enhanced, and mechanisms for shared regional carbon emission responsibilities should be established. For instance, establish inter-provincial carbon trading or adjustment funds. Provinces that reduce embodied emissions in traded products could earn tradable carbon credits or fiscal transfers from provinces (or central funds) that benefit from those reductions. This carbon fiscal transfer mechanism would financially incentivize regions to collaborate on lowering trade-related emissions.
Third, optimize the trade structure under the “dual circulation” development paradigm. Under the “dual circulation” strategy, a balance should be struck between domestic and international markets, gradually reducing reliance on carbon-intensive exports. By distinguishing domestic and international circulation, we uncover different governance implications for each loop. Emissions driven by domestic final demand suggest the need for internal policies, such as promoting low-carbon consumption and inter-provincial coordination of clean energy use. In contrast, emissions driven by international demand (exports) highlight the importance of trade policies and international cooperation (e.g., green supply-chain initiatives and carbon border adjustments). This dual-perspective enables us to propose more targeted governance strategies. National policymakers might focus on boosting local green consumption and inter-regional grid integration for the domestic circuit, while simultaneously negotiating greener trade agreements and technology transfers for the international circuit.
Fourth, promote green trade cooperation between China and ASEAN. Given the increasingly close trade relationship between China and ASEAN countries, green trade policy coordination should be strengthened at the regional level to collectively improve the carbon efficiency of supply chains. China should be encouraged to invest in renewable energy and green infrastructure in ASEAN countries, helping them optimize their energy structures and achieve synergistic development of regional economies and environments. Meanwhile, optimize the trade structure by encouraging a move up the value chain. Policies can promote the export of high-tech and service-oriented products (with lower carbon footprints) while phasing down exports of basic commodities with high embodied carbon. Such structural shifts, guided by industrial policy and carbon pricing, would reduce the carbon intensity of China’s trade with ASEAN and beyond.
Data availability statement
The original contributions presented in the study are included in the article/supplementary material, further inquiries can be directed to the corresponding author.
Author contributions
JC: Data curation, Formal analysis, Investigation, Methodology, Software, Writing – original draft. SW: Conceptualization, Funding acquisition, Project administration, Resources, Supervision, Writing – review & editing. QL: Methodology, Validation, Visualization, Writing – review & editing.
Funding
The author(s) declare that financial support was received for the research and/or publication of this article. The authors are grateful for financial support from the National Natural Science Foundation of China under grant nos. 71773118, 71733003, and 72373136.
Conflict of interest
The authors declare that the research was conducted in the absence of any commercial or financial relationships that could be construed as a potential conflict of interest.
Generative AI statement
The author(s) declare that no Gen AI was used in the creation of this manuscript.
Any alternative text (alt text) provided alongside figures in this article has been generated by Frontiers with the support of artificial intelligence and reasonable efforts have been made to ensure accuracy, including review by the authors wherever possible. If you identify any issues, please contact us.
Publisher’s note
All claims expressed in this article are solely those of the authors and do not necessarily represent those of their affiliated organizations, or those of the publisher, the editors and the reviewers. Any product that may be evaluated in this article, or claim that may be made by its manufacturer, is not guaranteed or endorsed by the publisher.
References
Ali, M. U., and Wang, Y. (2024). Pollution haven or pollution halo? The role of global value chains in belt and road economies. Rev. Dev. Econ. 28, 168–189. doi: 10.1111/rode.13041
Baumert, N., Kander, A., Jiborn, M., Kulionis, V., and Nielsen, T. (2019). Global outsourcing of carbon emissions 1995–2009: a reassessment. Environ. Sci. Pol. 92, 228–236. doi: 10.1016/j.envsci.2018.10.010
Deng, G., Lu, F., and Yue, X. (2021). Research on China’s embodied carbon import and export trade from the perspective of value-added trade. Plo S one 16:e0258902. doi: 10.1371/journal.pone.0258902
Guan, Y., Shan, Y., Huang, Q., Chen, H., Wang, D., and Hubacek, K. (2021). Assessment to China's recent emission pattern shifts. Earths Future 9:e2021EF002241. doi: 10.1029/2021EF002241
Han, M., Yao, Q., Lao, J., Tang, Z., and Liu, W. (2020). China’s intra-and inter-national carbon emission transfers by province: a nested network perspective. Sci. China Earth Sci. 63, 852–864. doi: 10.1007/s11430-019-9598-3
Li, C., Li, H., and Qin, X. (2022). Spatial heterogeneity of carbon emissions and its influencing factors in China: evidence from 286 prefecture-level cities. Int. J. Environ. Res. Public Health 19:1226. doi: 10.3390/ijerph19031226
Li, Q., Wu, S., and Li, S. (2022). Weighing China's embodied CO2 emissions and value added under global value chains: trends, characteristics, and paths. J. Environ. Manag. 316:115302. doi: 10.1016/j.jenvman.2022.115302
Liu, J., Ma, X., Zhao, B., and Dang, Z. (2024). Steering toward sustainability: can dual circulation development mitigate CO2 emissions?—evidence from China. J. Clean. Prod. 474:143548. doi: 10.1016/j.jclepro.2024.143548
Liu, J., Ning, Y., Bai, S., and Zhang, B. (2025). The Characteristics of Carbon Emissions Embodied in China’s International Economic Circulation Based on Global Value Chains. Sustainability 17, 2071–1050. doi: 10.3390/su17073054
Meng, B., Wang, Z., and Koopman, R. (2013). How are global value chains fragmented and extended in China’s domestic production networks? (No. 424). Institute of Developing Economies, Japan External Trade Organization (JETRO).
Meng, B., and Yamano, N. (2017). Compilation of a regionally extended inter-country input–output table and its application to global value chain analyses. J. Econ. Struct. 6:23. doi: 10.1186/s40008-017-0081-z
Mo, S., and Wang, T. (2022). Spatial-temporal evolution and peak prediction of embodied carbon emissions in China's interregional trade. Front. Public Health 10:1010521. doi: 10.3389/fpubh.2022.1010521
Pan, C., He, J., Zhu, L., Li, S., and Zhou, D. (2025). Tracing Chinese provincial CO2 emissions in cross-border production–an accounting base for decarbonizing production chains. Energy 322:135509. doi: 10.1016/j.energy.2025.135509
Qu, S., Yang, Y., Wang, Z., Zou, J.-P., and Xu, M. (2020). Great divergence exists in Chinese provincial trade-related CO2 emission accounts. Environ. Sci. Technol. 54, 8527–8538. doi: 10.1021/acs.est.9b07278
Shahzad, U., and Miao, C. (2025). Mitigating CO2 emissions: China-East Asia trade, digitalization, and geography's impact on sustainable environmental development. Food Energy Secur. 14:e70085. doi: 10.1002/fes3.70085
Spaiser, V., Scott, K., Owen, A., and Holland, R. (2019). Consumption-based accounting of CO2 emissions in the sustainable development goals agenda. Int. J. Sustain. Dev. World Ecol. 26, 282–289. doi: 10.1080/13504509.2018.1559252
Steinberger, J. K., Roberts, J. T., Peters, G. P., and Baiocchi, G. (2012). Pathways of human development and carbon emissions embodied in trade. Nat. Clim. Chang. 2, 81–85. doi: 10.1038/nclimate1371
Tang, C., Rosland, A., Li, J., and Yasmeen, R. (2024). The comparison of bilateral trade between China and ASEAN, China and EU: from the aspect of trade structure, trade complementarity and structural gravity model of trade. Appl. Econ. 56, 1077–1089. doi: 10.1080/00036846.2023.2174940
Tang, Z., Yu, H., and Zou, J. (2022). How does production substitution affect China's embodied carbon emissions in exports? Renew. Sust. Energ. Rev. 156:111957. doi: 10.1016/j.rser.2021.111957
Wang, R., Hanwen, Z., Yin, F., Jing, W., and Yang, T. (2025). A long-term and heterogeneous study on the impact of carbon emission trading policy on financial performance. Carbon Manag. 16:2486627. doi: 10.1080/17583004.2025.2486627
Wang, Y., Wang, W., Mao, G., Cai, H., Zuo, J., Wang, L., et al. (2013). Industrial CO2 emissions in China based on the hypothetical extraction method: linkage analysis. Energy Policy 62, 1238–1244. doi: 10.1016/j.enpol.2013.06.045
Weber, C. L., Peters, G. P., Guan, D., and Hubacek, K. (2008). The contribution of Chinese exports to climate change. Energy Policy 36, 3572–3577. doi: 10.1016/j.enpol.2008.06.009
Xie, X., Li, H., Cheng, B., Li, F., and Mikkilä, M. (2025). Global value chain embedding and total factor productivity in carbon emission reduction: a multi-country analysis of the paper industry. Forests 16:222. doi: 10.3390/f16020222
Xu, J., Guan, Y., Oldfield, J., Guan, D., and Shan, Y. (2024). China carbon emission accounts 2020-2021. Appl. Energy 360:122837. doi: 10.1016/j.apenergy.2024.122837
Yi, Y., Geng, Y., and Yang, M. (2023). Has China-ASEAN trade opening increased China’s carbon emissions? Chin. J. Popul. Resour. Environ. 21, 52–59. doi: 10.1016/j.cjpre.2023.06.002
Yifu, L. J., and Wang, X. (2022). Dual circulation: a new structural economics view of development. J. Chin. Econ. Bus. Stud. 20, 303–322. doi: 10.1080/14765284.2021.1929793
Zhang, B., Li, L., Zhao, J., and Zhang, L. (2021). Analysis on the Responsibility of Embodied Carbon in Trade and Its Driving Force. Journal of Eco-civilization Studies, 4, 61–75. (in Chinese)
Zhang, J., Fan, Z., Chen, Y., Gao, J., and Liu, W. (2020). Decomposition and decoupling analysis of carbon dioxide emissions from economic growth in the context of China and the ASEAN countries. Sci. Total Environ. 714:136649. doi: 10.1016/j.scitotenv.2020.136649
Zhang, W., Yang, M., Ge, J., and Wang, G. (2024). Inter-provincial embodied carbon emission space and industrial transfer paths in China. PLoS One 19:e0300478. doi: 10.1371/journal.pone.0300478
Zhao, Y., Liu, Y., Wang, S., Zhang, Z., and Li, J. (2016). Inter-regional linkage analysis of industrial CO2 emissions in China: an application of a hypothetical extraction method. Ecol. Indic. 61, 428–437. doi: 10.1016/j.ecolind.2015.09.044
Keywords: embodied carbon in trade, China–ASEAN trade, global value chains, dual circulation, structural decomposition
Citation: Chen J, Wu S and Li Q (2025) The evolution and influencing factors of trade-embodied CO2 emissions transfer from China’s provinces to ASEAN countries. Front. Clim. 7:1679132. doi: 10.3389/fclim.2025.1679132
Edited by:
Muhammad Jawad Sajid, China University of Mining and Technology, ChinaReviewed by:
Inayat Khan, China University of Mining and Technology, ChinaWei Li, Taiyuan University of Technology, China
Chen Pan, Chinese Academy of Social Sciences (CASS), China
Copyright © 2025 Chen, Wu and Li. This is an open-access article distributed under the terms of the Creative Commons Attribution License (CC BY). The use, distribution or reproduction in other forums is permitted, provided the original author(s) and the copyright owner(s) are credited and that the original publication in this journal is cited, in accordance with accepted academic practice. No use, distribution or reproduction is permitted which does not comply with these terms.
*Correspondence: Sanmang Wu, d3VzYW5tYW5nQHNpbmEuY29t