 Davide Faranda1,2,3*
- 1Laboratoire des Sciences du Climat et de l’Environnement, UMR 8212 CEA-CNRS-UVSQ, Université Paris-Saclay & IPSL, CEA Saclay l’Orme des Merisiers, Gif-sur-Yvette, France
- 2London Mathematical Laboratory, London, United Kingdom
- 3LMD/IPSL, ENS, Université PSL, École Polytechnique, Institut Polytechnique de Paris, Sorbonne Université, CNRS, Paris, France
ClimaMeter is a real-time platform designed to provide rapid, science-based assessments of extreme weather events and their links to climate change. ClimaMeter’s methodology relies on identifying large-scale atmospheric circulation patterns and comparing them to historical data, analyzing how the intensity of extreme weather events have changed because of anthropogenic climate change or natural climate variability. By leveraging historical climate data, machine learning, and real-time weather observations, ClimaMeter delivers near-instantaneous attribution results, enabling informed decision-making in a time when media cycles and public attention are brief. This speed is crucial for climate action, as it helps policymakers, emergency responders, and the public understand the role of climate change in specific extreme events and take timely, effective measures. This allows for quicker, data-driven responses to disasters, such as the October 2024 Valencia floods or the Medicane Daniel, by informing disaster response, infrastructure planning, and resilience-building efforts. ClimaMeter also plays a key role in countering climate change misinformation, offering evidence-based explanations to the public and media. By bridging the gap between scientific research and policy applications, ClimaMeter supports climate action, promotes public awareness, and aids in the development of adaptation and mitigation strategies to address the growing risks posed by climate change.
1 Introduction
Extreme event attribution (EEA) is a rapidly advancing scientific discipline that seeks to determine the influence of climate change on individual extreme weather events (Trenberth et al., 2015; Vautard et al., 2016; Otto, 2023). By comparing observed meteorological conditions to historical climate records and model simulations, EEA enables scientists to quantify how human-induced greenhouse gas emissions have altered the probability and intensity of specific events. From the seminal work of Allen and Stott (2003) who proposed the first methodological basis for attributing extreme events to climate change, hundreds of studies have shown that climate change has made heatwaves more frequent and intense, increased the likelihood of extreme precipitation, and contributed to the strengthening of tropical cyclones and wildfires (Masson-Delmotte et al., 2021). These findings have provided essential scientific evidence for policymakers and the public, reinforcing the need for mitigation and adaptation strategies to address the growing risks posed by extreme weather (Newman and Noy, 2023). However, while EEA has significantly improved our understanding of climate change’s role in extreme weather, traditional attribution studies often take weeks or months to complete. Recognizing this challenge, several scientific initiatives have emerged to accelerate the process of extreme event attribution. The World Weather Attribution (WWA) initiative, a collaboration between international research institutions, was among the first efforts to provide rapid assessments of climate change’s role in extreme weather (Otto et al., 2016; Stott et al., 2016). WWA has developed a streamlined methodology that allows for event attribution within days to weeks after an event (Philip et al., 2020). Their studies have demonstrated that climate change has made extreme events more intense and frequent (see. e.g., Otto et al., 2022). Other initiatives, such as the Berkeley Earth group (Paciorek and Wehner, 2016; Reed and Wehner, 2023), various national or international meteorological agencies such as Copernicus Climate Services (Buontempo et al., 2022), The Climate Shift index (Thomas-Walters et al., 2024) have proposed complementary approaches. However, despite these advancements, some of the attribution efforts remain too slow to meet the demands of modern communication and crisis response.
The time lag in extreme event attribution presents a challenge for climate communication, risk assessment, and disaster preparedness. When a major heatwave, flood, or storm occurs, journalists, policymakers, and the public immediately seek answers about whether climate change played a role (Osaka and Bellamy, 2020). In the absence of fast and reliable scientific assessments, discussions often become dominated by speculation, with some downplaying the influence of climate change and others making exaggerated claims without supporting evidence (Zanocco et al., 2024). This can create confusion among the public and weaken the effectiveness of climate communication. For instance, if a rapid attribution study were available immediately after an extreme event, it could help inform policy debates as well as, emergency relief efforts. Without timely attribution, the lessons learned from a given extreme event often arrive too late to shape policy decisions or public perception effectively.
Traditional EEA studies involve using or running multiple climate models under different greenhouse gas emission scenarios to compare the probability of an event in today’s climate versus a world without human-induced warming (Shepherd, 2016). While this approach provides robust and scientifically rigorous results, it also means that even the fastest existing attribution efforts still take days to weeks to complete. In contrast, media cycles and public attention spans operate on much shorter timeframes. When a major disaster occurs, initial news reports dominate headlines for generally 24–48 h, after which public attention often shifts to other topics (El Khaled and Mcheick, 2019). The media attention, however, can depend on various factors such as socio-economic-political conditions and concurrent events. By the time an attribution study is released, the media narrative has often already been established, and its findings struggle to gain the visibility needed to influence public discourse.
To address these challenges, the scientific community must continue developing even faster attribution methods that can deliver credible, science-based assessments within hours or days after an extreme event occurs (Schiermeier, 2018). Recent advances in artificial intelligence, machine learning, and statistical climate modeling offer promising pathways toward achieving this goal. Instead of relying solely on new climate model simulations, researchers are exploring methods that leverage precomputed model simulations, historical analogs, and statistical techniques to provide near-instantaneous assessments of whether climate change influenced a specific event. While some progress has been made in this area, there is still no widely accepted, operational system capable of producing extreme event attribution results within a time frame that matches the speed of modern news cycles. Given the growing urgency of rapid climate attribution, ClimaMeter was developed as a real-time tool designed to bridge the gap between climate science and public communication (Faranda et al., 2024a), ClimaMeter operates using precomputed climate model data, statistical methods, and real-time weather observations to provide faster assessments of extreme weather events. By leveraging historical climate data and machine learning techniques, it aims to evaluate whether human-induced climate change has influenced the probability or intensity of an extreme event almost as it unfolds. This approach is intended to provide immediate reports that can inform the public, policymakers, and media professionals at the crucial moment when public discourse on an event is at its peak.
The main objective of this article is to present ClimaMeter, explain its methodology, and discuss how it fits within the broader landscape of extreme event attribution. By comparing its capabilities with existing initiatives, we will highlight the advantages and challenges of fast attribution methods and their implications for climate communication and decision-making. The article will also examine case studies where ClimaMeter has been applied to recent extreme weather events, showing its potential impact in shaping public understanding and informing policy responses. To structure this discussion, the next section will provide a detailed explanation of the ClimaMeter methodology, including the datasets it uses, the statistical techniques it applies, and how it compares observed weather conditions with historical climate variability. Following this, we will present examples of past events analyzed by ClimaMeter and evaluate how its results have contributed to climate discourse. The article will then discuss the strengths and limitations of this approach, particularly in comparison to other attribution initiatives. We will conclude by outlining potential improvements and discussing the broader role of real-time attribution in climate science and policy-making.
2 Methods
ClimaMeter employs a methodology that focuses on analyzing atmospheric circulation patterns, particularly surface-pressure configurations, to assess extreme weather events (Faranda et al., 2022). The process begins by identifying a specific surface-pressure pattern over a defined region and time frame that has led to the extreme weather conditions under investigation. We use surface pressure as a circulation variable because it enables a fast, operationally efficient analog search and is correlated with mid-tropospheric patterns such as 500 hPa geopotential height, as shown in Faranda et al. (2024a). This allows us to capture synoptic-scale circulation features that drive extreme weather events while maintaining the rapid nature of the analysis. The surface pressure pattern is then compared to historical data, typically divided into two equal periods: an earlier “past” period and a more recent “present” period. ClimaMeter searches for analogous weather conditions in these datasets to determine how the frequency or intensity of such patterns has changed in two distinct periods. This approach allows for the assessment of whether observed changes are attributable to natural climate variability or anthropogenic influences. ClimaMeter’s methodology does not rely on numerical model simulations; instead, it leverages historical data, enabling rapid and reproducible analyses. This reliance on historical analogs can present challenges when encountering unprecedented extreme events, as the absence of similar past occurrences may limit the analysis.
2.1 Analogs methodology
ClimaMeter relies on analogs as a core component of its methodology to provide rapid and scientifically robust attribution of extreme weather events. The analog approach is based on identifying past occurrences of similar large-scale atmospheric circulation patterns and comparing their frequency and intensity over different climate periods (Yiou et al., 2014; Faranda et al., 2023a; Faranda et al., 2023b; Dong et al., 2024). By conditioning the analysis on circulation rather than on specific meteorological variables such as temperature or precipitation alone, ClimaMeter can directly assess how climate change has influenced the broader atmospheric conditions that drive extreme weather. More in details, the ClimaMeter analog search is based on identifying patterns in sea-level pressure fields over a user-defined spatial domain and time window. For the analyses conducted before December 6, 2024, we use data from MSWX (Beck et al., 2022). For analyses after December 6, 2024, we use ERA5 reanalysis (Hersbach et al., 2023), complemented with Global Forecast System (GFS) forecasts for up-to-date coverage. Pattern similarity is computed using an Euclidean distance metric, and circulation states whose distance falls below a percentile-based threshold (optimized seasonally and regionally) are retained as analogs. This allows the method to objectively identify past atmospheric configurations similar to the one responsible for the event. Thermodynamic changes embedded within similar circulation states are captured through differences in temperature and precipitation between past and present analogs, while the frequency of the circulation reflects dynamical changes. Local processes, such as land–atmosphere interactions, are indirectly reflected in the thermodynamic signal but are not explicitly isolated in the current methodology. ClimaMeter also uses machine learning to assist the analog search and optimize the analog pool. A chatbot interface is optionally used to provide a rapid first guess of the geographical domain, the cities of interest, and the timing of the event based on the available meteorological data, thereby accelerating the setup of the analysis. This machine learning component optimizes the analog search parameters (domain, percentile threshold, seasonal window) but does not influence the physical definition of analogs. The chatbot interface only accelerates the initial event setup. All final analog selections are based on physically defined similarity metrics.
Uncertainty in ClimaMeter is explicitly quantified through a non-parametric bootstrap approach applied to the analog pool. The attribution signal (e.g., changes in temperature or precipitation between present and past climate) is resampled 500 times, and it is considered physically significant if the gridpoint changes are outside two standard deviations of the bootstrap sample calculated from the resulting empirical distribution. This accounts for sampling variability and provides a robust measure of uncertainty associated with each attribution estimate. The confidence intervals are systematically reported together with the attribution statements. This approach is described in detail in Faranda et al. (2022) and ensures statistical robustness while retaining the operational speed of the methodology. To account for the possible influence of low-frequency modes of natural variability in explaining the differences between the two periods, we also consider the possible roles of the El Niño-Southern Oscillation (ENSO), the Atlantic Multidecadal Oscillation (AMO), and the Pacific Decadal Oscillation (PDO).
One of the primary reasons for using analogs is their ability to provide a direct link between climate variability and extreme events without requiring climate model simulations. Instead of generating new model runs for each individual event, ClimaMeter searches within historical reanalysis datasets for instances of comparable atmospheric configurations. These analogs are then employed to assess whether these configurations are occurring for the first time, how rare they are, and whether associated variables like temperature, wind speed, and rainfall have intensified. This allows for a rapid assessment of how climate change may have altered the likelihood or severity of an extreme event. An additional feature of conditioning on circulation is that it enables the study of multiple hazards simultaneously (Jézéquel et al., 2018). Because large-scale atmospheric patterns often govern several types of extreme weather at once, the analog approach allows ClimaMeter to analyze compound events—situations where multiple extreme weather events occur simultaneously or in close succession. For example, a persistent blocking high-pressure system over Europe might lead to concurrent heatwaves, droughts, and wildfires in southern regions while contributing to intense storms and flooding in northern areas.
2.2 Writing protocol
ClimaMeter employs a structured protocol to ensure that its reports on extreme weather events are both objective and scientifically rigorous. This protocol is designed to minimize personal bias and provide clear, data-driven insights into the relationship between specific weather events and climate change. The report-writing process begins with the collection of relevant data, including meteorological measurements, scientific analyses, and pertinent news reports. To assist in compiling and interpreting this information, ClimaMeter uses conversational tools. These tools aid in synthesizing complex data into coherent narratives, ensuring that the information is both accurate and accessible. Each report follows a standardized structure to maintain consistency and clarity. This structure includes sections such as an event description, climate and data background, analysis, and conclusions. By adhering to this format, ClimaMeter ensures that all relevant aspects of an event are thoroughly examined and presented in a logical sequence. A key aspect of ClimaMeter’s protocol is the emphasis on data-driven analysis. The reports focus on presenting statistical findings and empirical evidence without inferring personal opinions or speculative conclusions. This approach ensures that the assessments are grounded in observable data, enhancing their credibility and reliability. Furthermore, ClimaMeter’s methodology relies on historical data and avoids the use of numerical model simulations. This reliance on observed data allows for rapid and reproducible analyses. However, it also means that in cases where extreme events are unprecedented, the lack of historical analogs can pose challenges for analysis. Finally, ClimaMeter’s collaborative approach, involving international research teams, enhances the scientific community’s capacity to understand and address the complexities of climate change (Brinkmann, 2020).
2.3 ClimaMeter through an example
We explain here how the ClimaMeter methodology works through a concrete example: the DANA (Depresión Aislada en Niveles Altos) of 29 October 2024, which affected southeastern Spain with intense rainfall, strong winds, and local flooding (Faranda et al., 2024e). This event was analyzed using the MSWX data and results are reported in Figure 1. First, we identify the synoptic situation by analyzing the surface pressure anomalies. In the case of the October 2024 DANA, this corresponds to a deep upper-level low over the western Mediterranean, with surface pressure anomalies of about −5 hPa over southeastern Spain—a typical autumn DANA pattern. We note that, the synoptic circulation identified represents the large-scale environment conducive to the event but does not fully explain the flood magnitude. The relatively moderate circulation intensity indicates that mesoscale convective processes and local moisture convergence likely amplified the impacts, which ClimaMeter does not explicitly resolve. Once the reference pattern is determined, the historical dataset is split into two equal halves: the first half is defined as the “past” and the second as the “present.” ClimaMeter then searches for similar circulation patterns in both periods and compares the associated thermodynamic fields (such as temperature and precipitation) to assess how background conditions have changed over time. For this event, present-day analogs show temperatures approximately 3 °C warmer than in the past and an increase in precipitation of up to 7 mm day−1 along the coast, indicating that the same type of circulation now occurs in a warmer and moister atmospheric context. The methodology also allows estimating impacts in urban areas: in Valencia, the analysis indicates a warming of around 3 °C and a precipitation increase exceeding 4 mm day−1, while Albacete and Málaga show lower but still significant changes. Wind speed variations remain moderate relative to thermodynamic changes. ClimaMeter further quantifies changes in the seasonal frequency of such circulation patterns, showing an increased occurrence in October and November in the present period compared to 1979–2001, which indicates a shift in the timing of DANA events. Figure 1 shows, in the upper panels, the anomalies of pressure, temperature, precipitation and wind during the event. In the middle panels, the colored patterns display the difference between the average of all analog days in the present period and the average of all analog days in the past period for pressure, temperature, precipitation and wind speed, respectively. To determine whether these differences are meaningful, a bootstrap procedure is applied: dates from both periods are pooled together, then 15 dates are randomly extracted 100 times, and corresponding difference maps are generated. Only grid points where the observed change is more than two standard deviations above or below the mean of the bootstrap sample are marked as significant. This allows highlighting regions where the thermodynamic environment has shifted in a way that cannot be explained by sampling variability alone. While the bootstrap uncertainty test provides statistical confidence in the observed circulation frequency differences, their physical interpretation is beyond the scope of this work and may reflect decadal variability or broader circulation changes under warming.
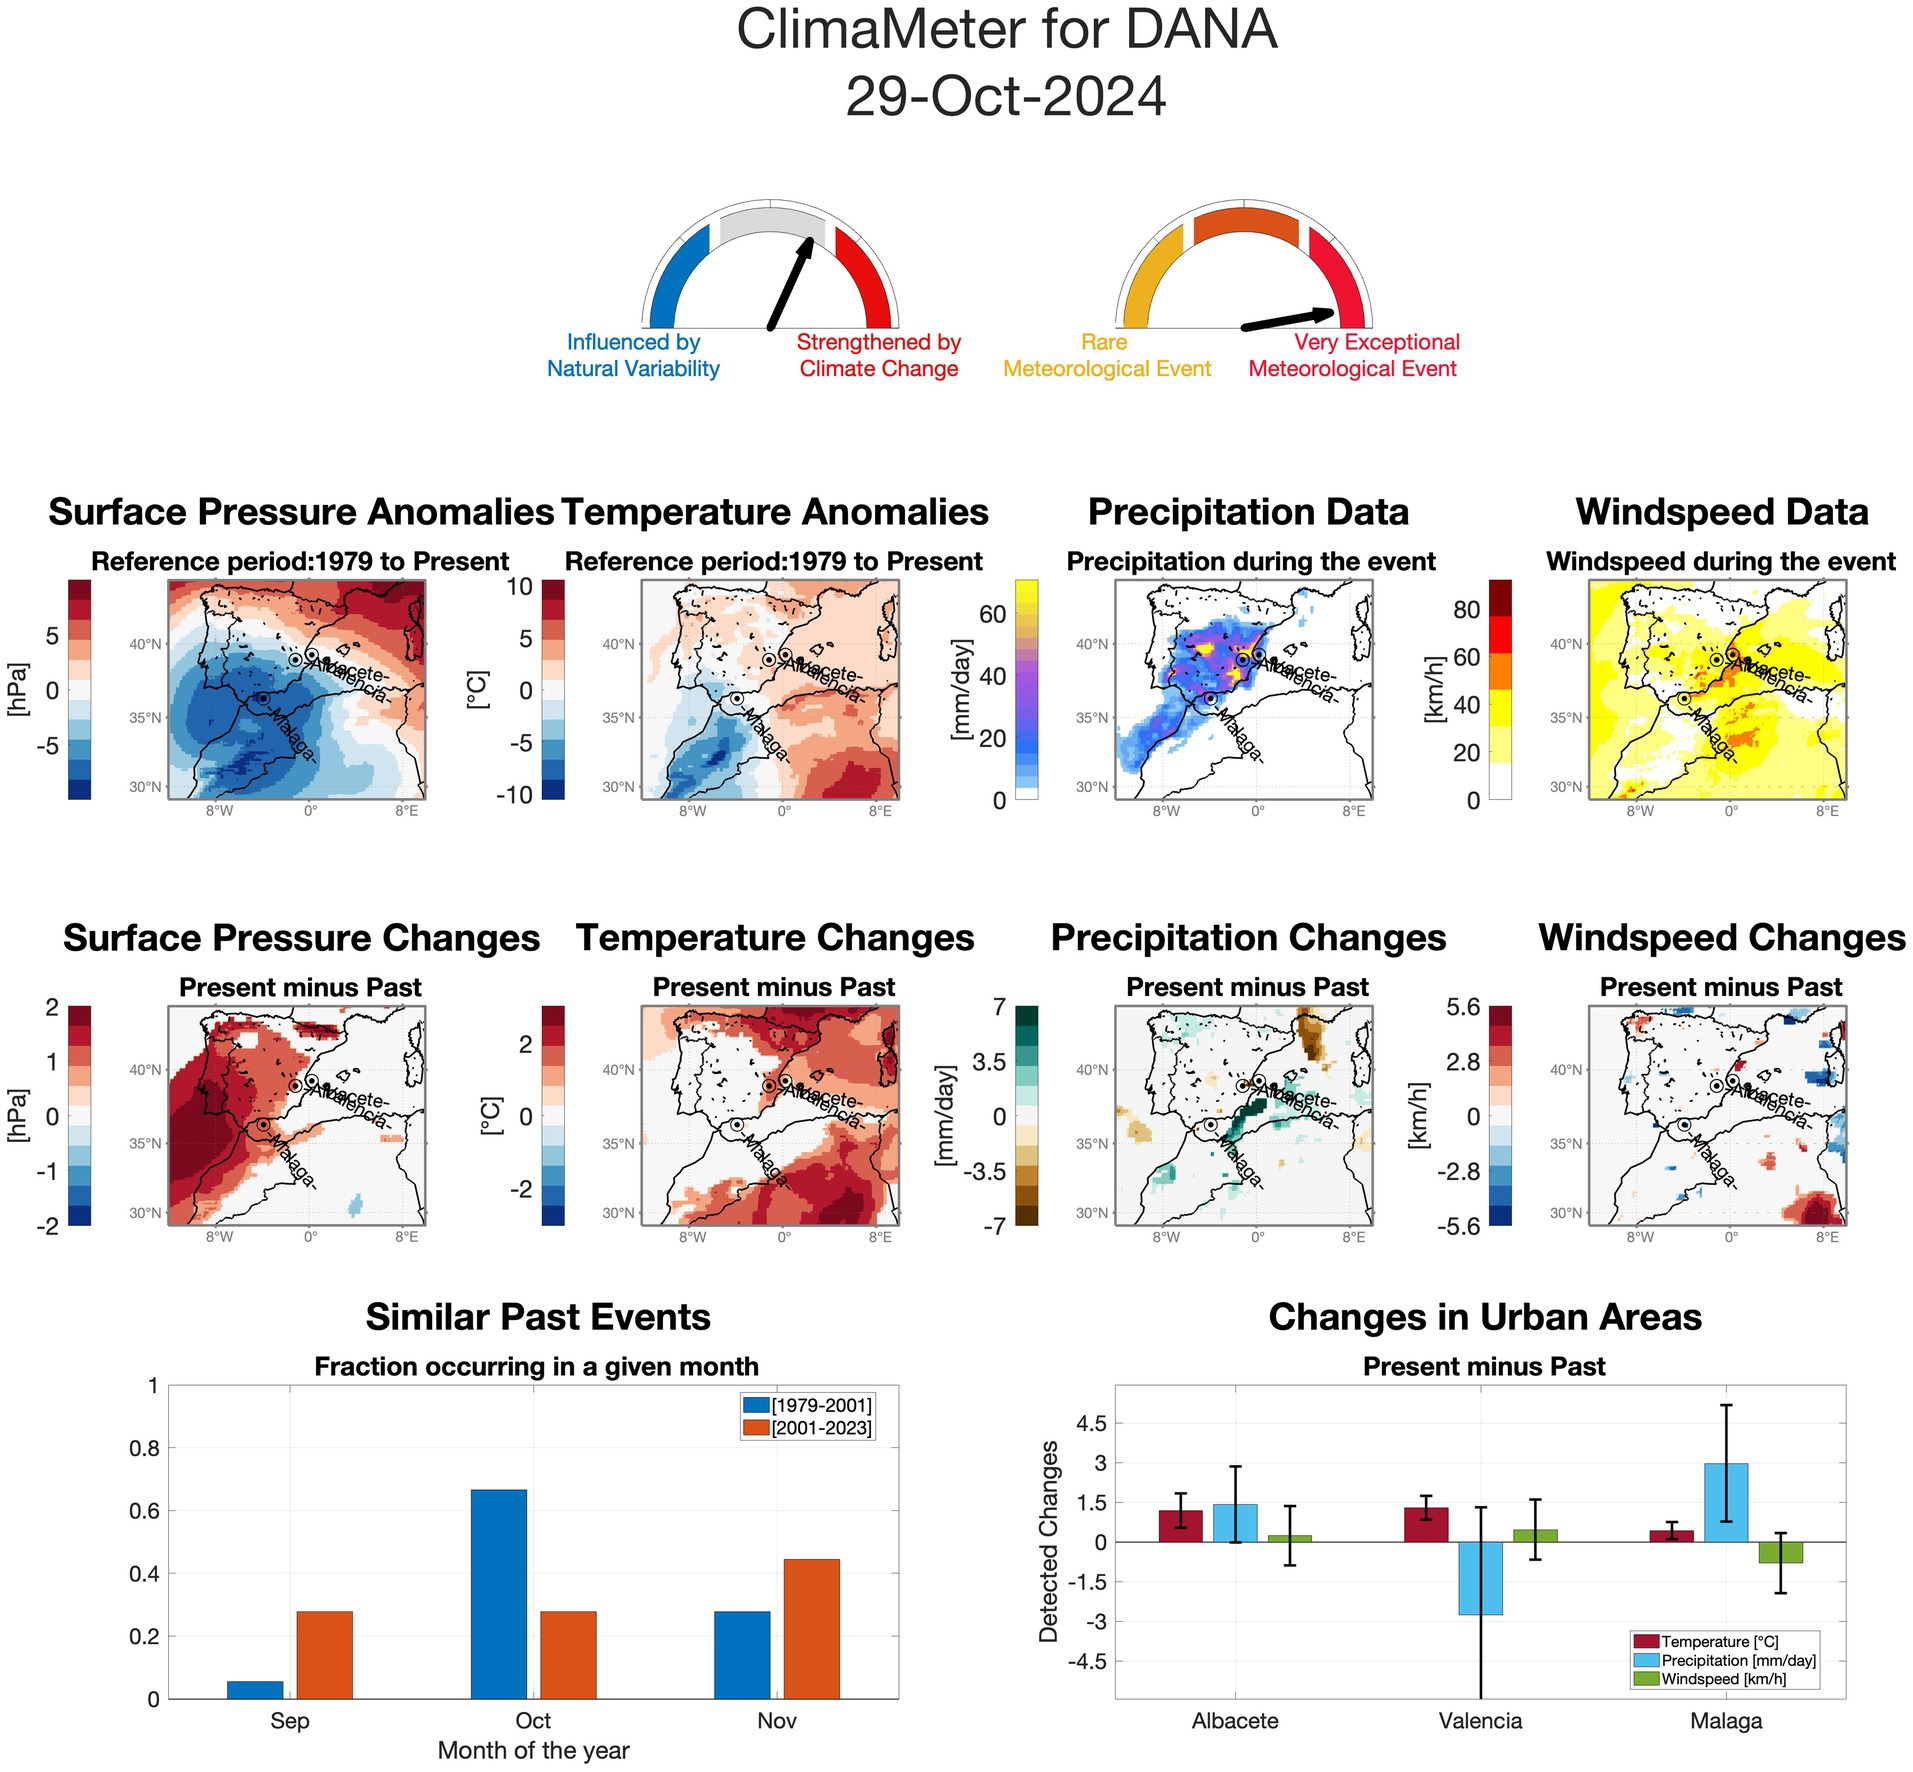
Figure 1. ClimaMeter attribution analysis for the DANA event of 29 October 2024. The top panels show surface pressure anomalies, temperature anomalies, precipitation, and wind speed during the event. The middle panels display the differences between the mean of all analog days in the present period (2001–2023) and the mean of all analog days in the past period (1979–2001) for the same variables. Significant differences are identified through a bootstrap procedure: dates from the two periods are pooled, 15 dates are randomly sampled 500 times, and grid point changes exceeding two standard deviations from the bootstrap mean are marked as significant. The lower panels show the seasonal frequency shift of similar circulation patterns between the two periods (left) and the detected changes in temperature, precipitation, and wind speed for three urban areas (Albacete, Valencia, Málaga) (right).
At the bottom of the figure, the bar chart shows how the seasonal frequency of similar circulation patterns has changed between the two periods, with a clear increase in October and November. The box plot on the right summarizes the detected changes in temperature, precipitation, and wind speed for three urban areas—Albacete, Valencia, and Málaga—providing an estimate of the local impacts associated with the event. The negative precipitation anomaly observed for Valencia is not statistically significant and is associated with high variability and uncertainty. This does not imply a suppression of heavy precipitation by climate change but reflects the strong local variability of the signal and the limited analog sample size for this event. Changes between the distributions of variables in the past and present periods are also tested using a two-tailed Cramér–von Mises test at the 0.05 significance level. If the p-value is smaller than 0.05, the null hypothesis that both samples come from the same distribution is rejected, meaning the distributions are interpreted as significantly different. This test is used to assess the role of natural variability and ensure that the detected shifts reflect climatic changes rather than random fluctuations.
The two top gages provide additional information. The top-left gauge quantifies the role of natural variability versus human-induced climate change. It takes values between 0% (pointing left) and 100% (pointing right). To assign the gauge value, we assess whether the analog events occurred during statistically different phases of the El Niño–Southern Oscillation (ENSO), the Atlantic Multidecadal Oscillation (AMO), or the Pacific Decadal Oscillation (PDO). If significant differences between phases are found, we subtract 30% from a reference value of 95%. We avoid using 0% or 100% to reflect analysis and data uncertainty. The top-right gauge quantifies the rarity of the event, also ranging between 0 and 100%. To compute it, we use the analog quality Q, which measures the average Euclidean distance between the event and its closest analogs. If Q for the event is below the 75th percentile of the Q distribution for both periods, the gauge is set to 5% (rare meteorological event). If Q is below the 95th percentile, we set 30%. If the condition does not hold for one of the two periods, we assign 60%. If Q exceeds the 95th percentile for both periods, we assign 95% (very exceptional meteorological event). We do not use 0% or 100% to acknowledge data and methodological uncertainties.
Overall, we remark that for the 2024 Spanish rainfall event, the analog pool was small, reflecting the exceptional character of the circulation pattern. This leads to reduced statistical robustness, which is explicitly indicated as low confidence in the attribution. Such limitations are inherent to analog-based methods when dealing with very rare events.
3 Comparison with existing attribution studies
ClimaMeter has been used to attribute several recent extreme weather events, analyzing the influence of climate change on their characteristics (see Figure 2 for an ensemble of the events analyzed since July 2023).
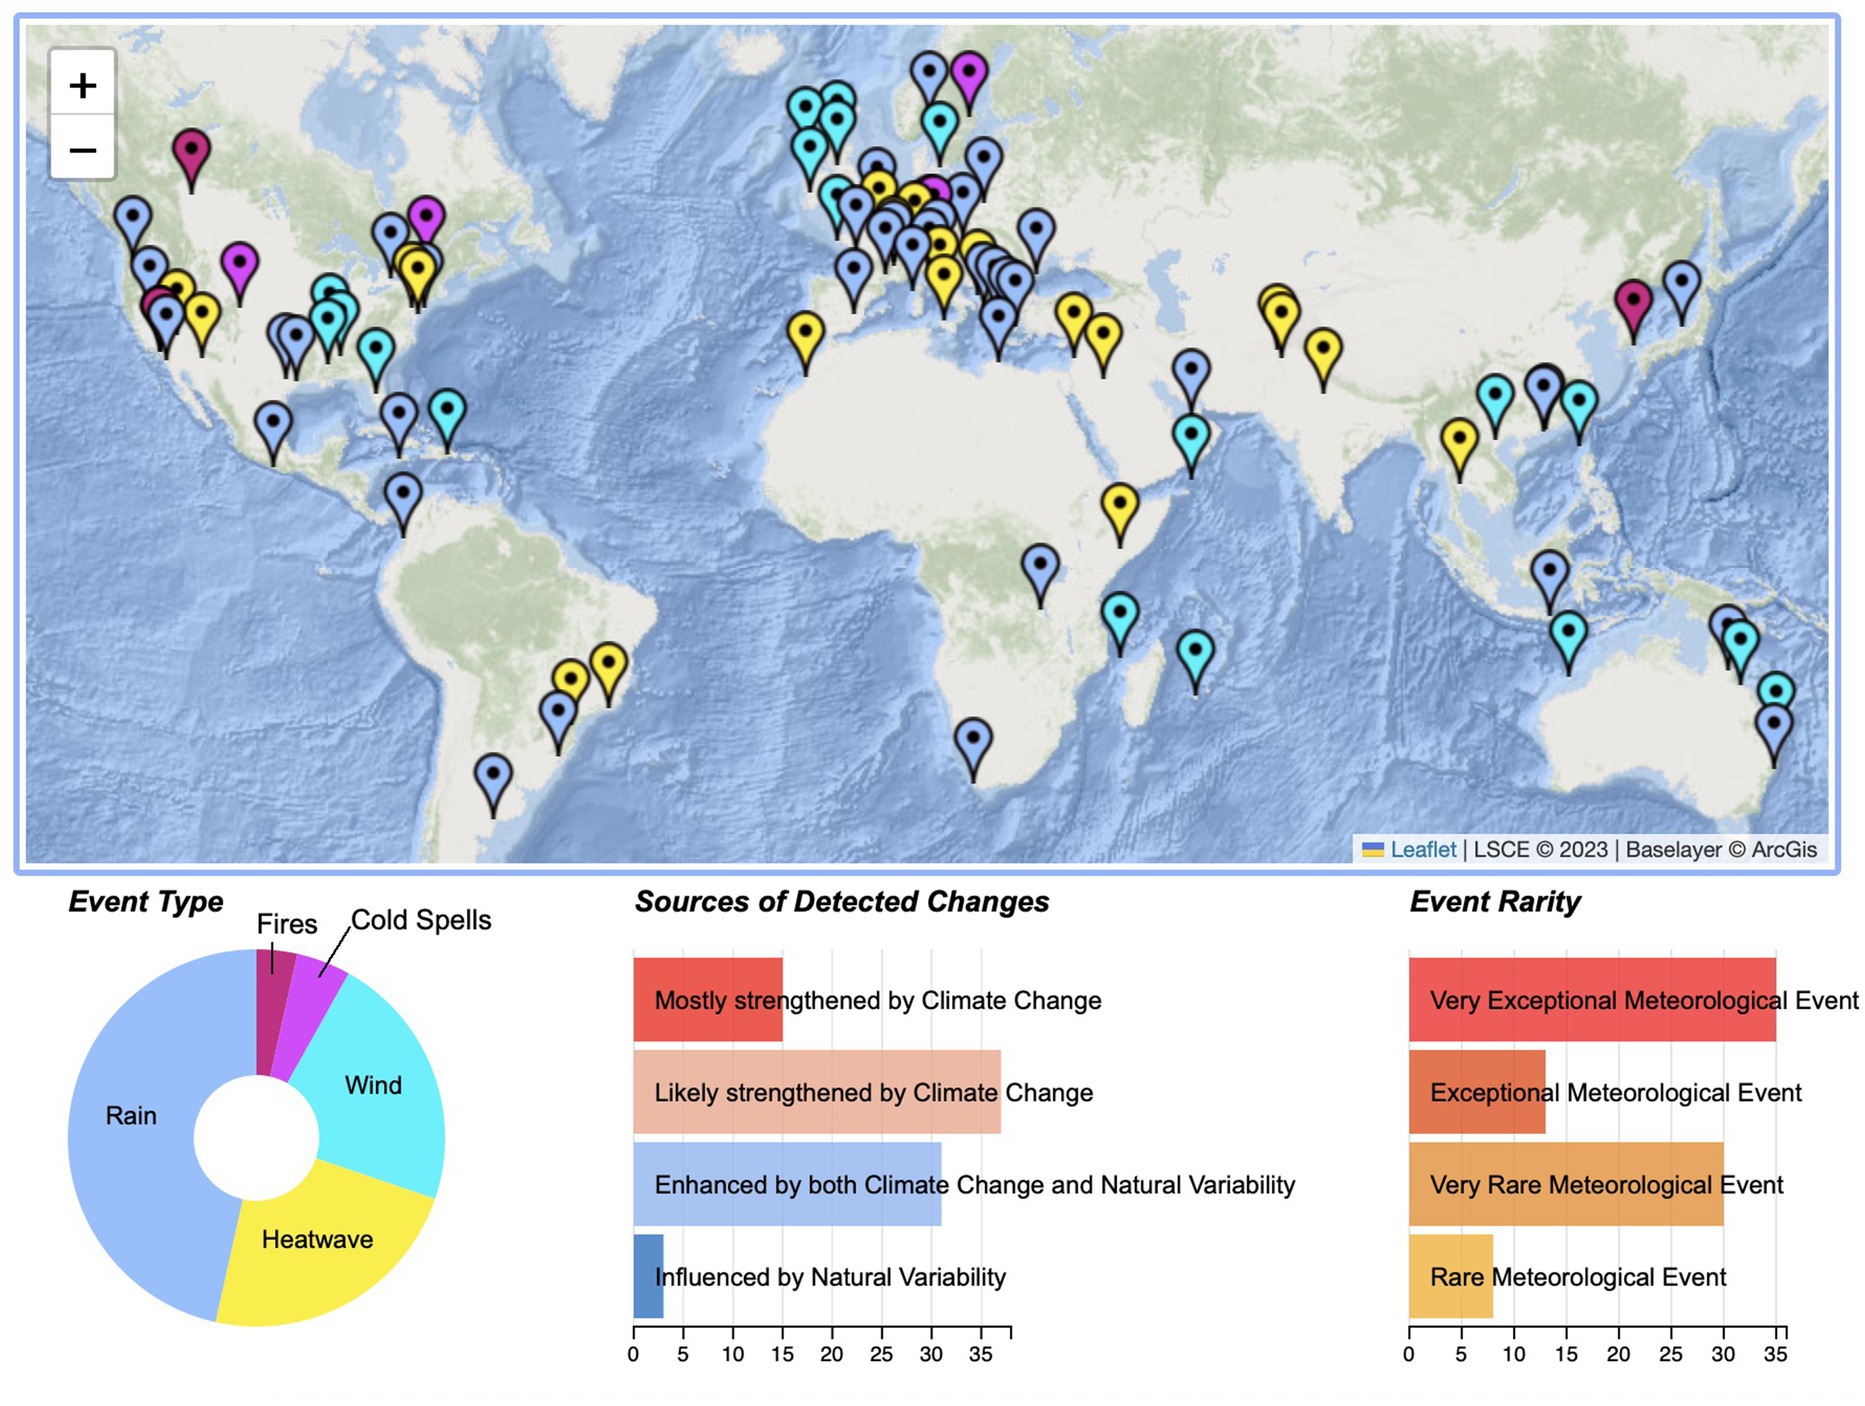
Figure 2. Events covered in ClimaMeter since July 2023. Geographic distribution of extreme weather events analyzed with ClimaMeter, including heatwaves (yellow), windstorms (cyan), heavy rainfall events (blue), cold spells (magenta), and fires (red). The lower panels summarize the classification of events according to type (left), detected sources of changes (center), and rarity (right). Results show that most events were either likely or mostly strengthened by climate change, with several also influenced by natural variability. The rarity analysis highlights that many events fall into the categories of “exceptional” or “very exceptional” meteorological events, underscoring the growing role of climate change in shaping impactful extremes worldwide.
To assess the performance and added value of ClimaMeter’s near-real-time attribution analyses, we compared its outputs with those produced by the World Weather Attribution (WWA) consortium for three recent high-impact precipitation events: the Dubai floods of April 2024, Medicane Daniel in September 2023, and the Valencia (South-East Spain) floods of October 2024. These cases were selected because they represent distinct meteorological settings—desert flash flooding, Mediterranean cyclone, and autumnal DANA event—while being covered by both ClimaMeter and WWA, allowing a direct, event-by-event comparison in terms of timing, attribution signal, and overall agreement (Table 1).
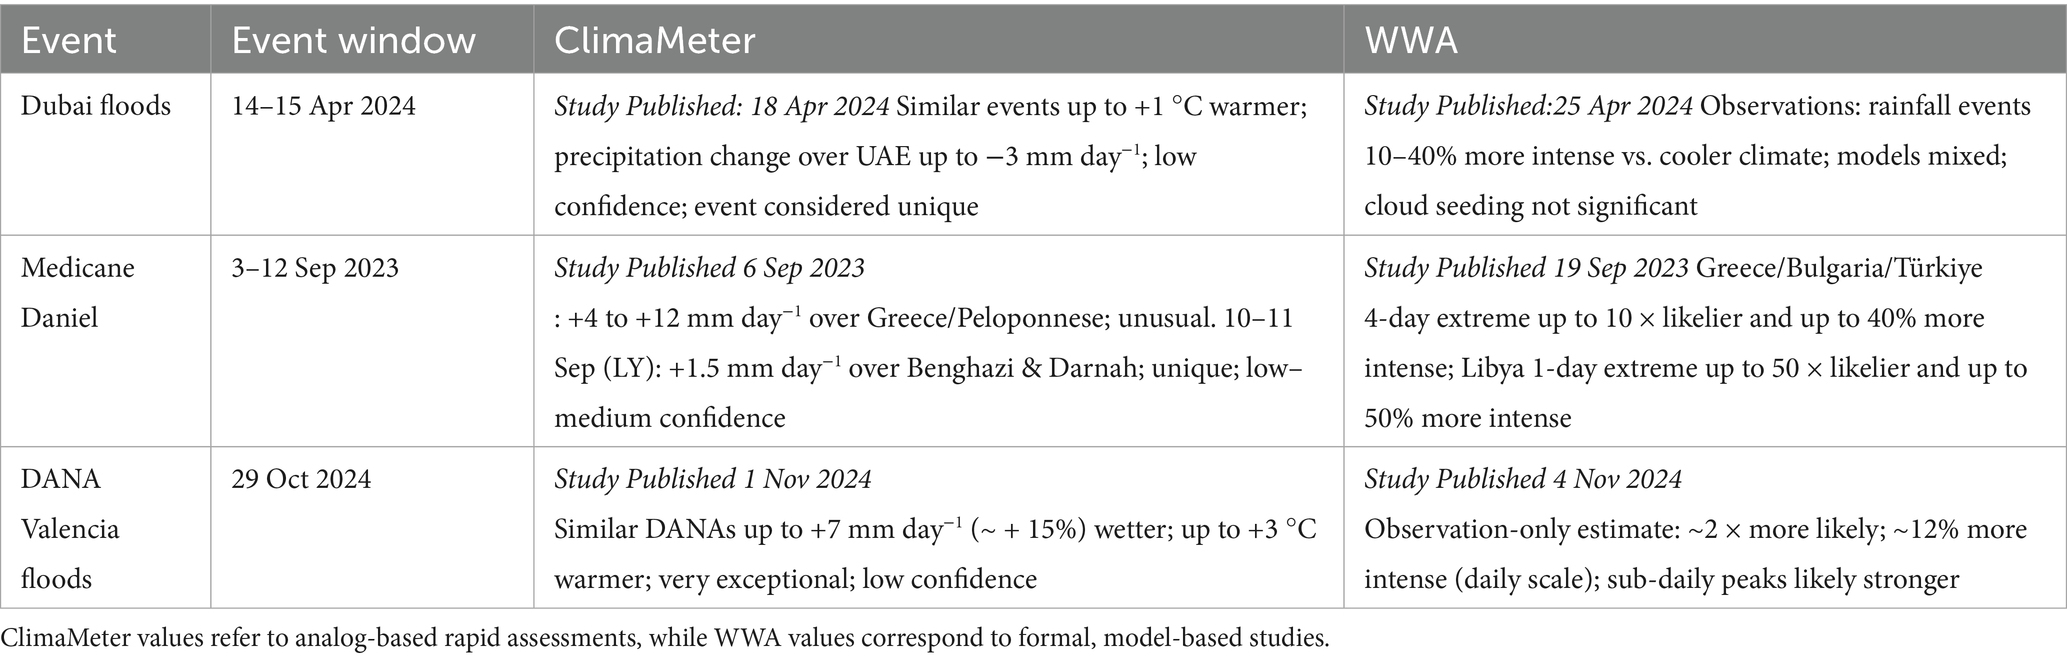
Table 1. The table summarizes event dates, publication lags, and key attribution metrics.
The Dubai floods, which struck the UAE and Oman on 14–15 April 2024, represent one of the most extreme rainfall episodes ever observed in the region. ClimaMeter released its first assessment on 18 April, approximately 3 days after the event (Faranda et al., 2024d). The analysis highlighted that similar synoptic situations in the present climate are associated with temperatures up to 1 °C warmer than in the past, and with precipitation changes up to −3 mm day−1, albeit with low confidence due to the singularity of the event in the historical record. WWA published its analysis on 25 April—around 10 days after the event—concluding that observed rainfall during such events is currently 10–40% more intense than it would have been in a cooler climate, while model-based estimates were mixed and associated with high uncertainty (Zachariah et al., 2025). Both groups stressed the exceptional character of the event and the strong influence of local exposure and urban infrastructure. In this case we highlight the discrepancy of the ClimaMeter report—which has anyway provided the results with a low confidence—with the WWA study. This stresses the importance of other assessments like WWA can strengthen the general consensus of climate change’s influence on the Dubai floods.
The second case concerns Medicane Daniel, which unfolded between 3 and 12 September 2023 and impacted Greece, Türkiye, Bulgaria, and later Libya with catastrophic flooding. ClimaMeter issued its first report for Greece on 6 September, during the peak of the event, and updated it around 10–11 September to include the Libyan landfall (Pons and Faranda, 2024). The analysis showed precipitation anomalies of +4 to +12 mm day−1 over Greece and approximately +1.5 mm day−1 over Benghazi and Darnah compared to the historical baseline. The event was characterized as unusual and partially unique, with medium–low confidence in the analog signal due to its extreme intensity. WWA released its assessment on 19 September—8–16 days after the event depending on the location (Zachariah et al., 2023). Its results indicated that the 4-day extreme over Greece, Bulgaria, and Türkiye was up to 10 times more likely and up to 40% more intense because of climate change, while the Libyan one-day extreme was up to 50 times more likely and up to 50% more intense. Despite the very different methodologies—rapid analog-based analysis versus detailed model-based attribution—both assessments pointed in the same direction, identifying a strong anthropogenic signal that increased the likelihood and intensity of the precipitation extremes. The timing difference illustrates how ClimaMeter can deliver robust early indications that are later corroborated by more resource-intensive studies.
The third example is the South-East Spain DANA, which triggered destructive floods around Valencia on 29 October 2024. ClimaMeter published its report on 1 November, about 3 days after the event, identifying similar DANAs in the present climate as up to 7 mm day−1 (around 15%) wetter and up to 3 °C warmer than in the past (Faranda et al., 2024e). The analysis also noted the exceptional rarity of the event and a corresponding low confidence in analog sampling. WWA released a “super-rapid” observational attribution on 4 November—approximately 6 days after the event. Their initial estimate indicated that such events are now about twice as likely and roughly 12% more intense at current levels of warming (+1.3 °C), with the caveat that sub-daily intensities may be even more affected than the daily aggregates. Here too, both ClimaMeter and WWA agreed on the direction and approximate magnitude class of the climate signal, with ClimaMeter providing early scientific evidence that was later complemented by more refined quantifications.
These three case studies demonstrate that ClimaMeter delivers qualitatively consistent conclusions regarding the influence of anthropogenic warming. The differences in timing reflect methodological design: ClimaMeter leverages circulation analogs from reanalysis for rapid, transparent assessments, whereas WWA applies formal detection and attribution approaches requiring more data.
4 First implications of ClimaMeter for climate action
ClimaMeter contributes to countering misinformation on climate change by providing scientifically grounded explanations for extreme weather patterns. In an era where climate-related misinformation can spread rapidly, the platform serves as a reliable source of information, distinguishing between natural variability and climate change-driven trends. By engaging with journalists, educators, and the general public, ClimaMeter helps foster a nuanced and fact-based understanding of extreme weather attribution, reducing the risk of misinterpretation or politicization of climate science. ClimaMeter has been cited in various press articles across multiple countries, highlighting its contributions to understanding the connection between extreme weather events and climate change. Some of the key countries involved in this media coverage include Australia, the United States, France, Spain, the United Kingdom, Italy, Germany, Colombia, India, Brazil, Turkey, and Mexico. Key media outlets citing ClimaMeter include prominent news outlets such as The Independent, BBC News, France 24, Le Monde, Futura-Sciences, NBC News, Al Jazeera, Reuteurs, AP, El Pais, La Vanguardia. Additionally, various local media outlets, such as Mediapart, RTS, and El Espectador, have also reported on ClimaMeter’s contribution in extreme weather analysis (for an overview please visit).1 This media coverage reflects the recognition of ClimaMeter’s impact in both scientific and public discourse on climate change and its effects on extreme weather events. Part of this success is due to the platform’s standardized reports, the use of a single, clear figure to present the results, and the fact that the reports avoid overstating their findings or the implications of the analyses. This approach helps maintain the platform’s credibility while effectively contributing to discussions around climate change and its impacts.
ClimaMeter’s real-time analyses offer benefits for climate political action. By providing rapid assessments of extreme weather events, it enables policymakers to make timely and informed decisions regarding disaster response and mitigation strategies (Adams et al., 2020). Indeed ClimaMeter’s impact goes beyond media attention, as the platform plays an active role in collaborating with the scientific community and policymakers to enhance climate event attribution methods. For instance, the ClimaMeter report on the 2023 floods in France (Faranda et al., 2024b) was instrumental in compiling a report for the Prefect of the Hauts-de-France region, aimed at strengthening the resilience of flood-affected territories (Palhol et al., 2024). This request for ClimaMeter analyses came directly from the Inspection Générale de l’Environnement et du Développement Durable (the French Ministry for Ecological Transition) after the minister’s office saw the study featured in the media. Similar interactions occurred following the Valencia Floods, when ClimaMeter’s findings were communicated to regional authorities in the Mediterranean basin as part of early adaptation and emergency planning discussions. These examples show that ClimaMeter’s outputs are not only used to inform public debate but can also be incorporated into policy and operational frameworks, bridging the gap between science and decision-making.
Beyond its role in media and scientific communication, ClimaMeter also serves as a educational tool. The platform’s results have been used to engage PhD students in attribution studies and to provide rapid reports on past phenomena. For example, during the TROPICANA (Tropical Cyclones in the Anthropocene: Physics, Simulations, and Attribution) program held at Paris-Saclay in June 2024 (Faranda et al., 2024c), participants and students collaborated to produce a report on Medicane Ianos (Gonzalez Aleman et al., 2024). They also explored best practices for communicating findings and motivating climate action to mitigate the impact of Mediterranean cyclones. These efforts have contributed to recognition, including mentions in public platforms like Wikipedia (see, e.g., the Wikipedia citation on California wildfires).2 ClimaMeter’s open-access reports and interactive analyses are used by educators, students, and researchers, providing resources for understanding the complexities of climate change attribution. By making climate science more accessible to a broader audience, ClimaMeter empowers individuals and communities to engage more deeply with climate action, fostering awareness and advocacy grounded in scientific evidence.
5 Limitations
While ClimaMeter and similar initiatives provide useful tools for understanding the relationship between extreme weather events and climate change, there are several limitations that need to be considered. One of the primary challenges is the complexity of accurately attributing specific weather events to climate change (Van Oldenborgh et al., 2021). Despite advancements in modeling and data collection, the chaotic nature of weather systems means that it is often difficult to pinpoint a direct cause-and-effect relationship between climate change and any individual event. All attribution efforts rely on methods, models and datasets, the accuracy of their conclusions depends heavily on the quality of the input data. In regions where data is sparse or unreliable, the assessments may be less robust. Furthermore, there are still gaps in understanding how various climate drivers interact at different scales, which can affect the precision of attribution analyses (Slater et al., 2021; Clarke et al., 2022). Additionally, the time scales involved in climate change and extreme weather events are vastly different. Climate change occurs gradually over decades or centuries, while extreme weather events happen on shorter time scales, sometimes within a matter of hours or days (Fan et al., 2021). This mismatch in time frames can make it challenging to link specific events directly to long-term climate trends, even with advanced attribution techniques (Clarke et al., 2023).
Another limitation of ClimaMeter lies in its exclusive use of reanalysis data as the basis for analog searching and statistical inference. While this provides the advantage of relying on physically consistent, observationally constrained datasets and enables rapid analyses, it also restricts the tool to the range of atmospheric circulation patterns observed since 1950. Rare configurations, particularly those associated with compound or unprecedented extremes, may not be captured. A natural future extension of ClimaMeter involves coupling the current analog framework with precomputed millennial-scale climate model simulations. Such simulations—covering historical (e.g., 1900s) and present/future climates (e.g., 2020s)—would provide a much broader sampling of atmospheric variability while preserving the near-real-time operational capability of the tool. This would allow a better quantification of event rarity, particularly for circulation patterns that may be absent or underrepresented in the historical reanalysis. This approach could also help assess whether a given event was ‘statistically implausible’ in a pre-industrial climate or simply not realized in the observed period by chance. Integrating such long simulations into ClimaMeter will be a central element of its next development phase.
Finally, while national attribution services are expected to provide more localized analyses, they also face challenges related to computational resources, expertise, and political or institutional constraints (Lahsen and Ribot, 2022). These factors can limit their capacity to deliver timely or comprehensive assessments, especially in countries with fewer resources to dedicate to climate research.
6 Conclusion
By leveraging historical data and machine learning techniques, ClimaMeter complements traditional attribution methods, which often require weeks or months to produce results. This quasi real-time approach has the potential to improve public understanding and support more timely decision-making by policymakers, emergency responders, and the general public. However, despite these advantages, ClimaMeter and similar initiatives face several challenges. The complex nature of extreme weather events, combined with data limitations and the inherent difficulty of attributing individual events to long-term climate trends, presents ongoing hurdles (Callaghan et al., 2021). Indeed while ClimaMeter contributes to more efficient climate action, the need for broader collaboration and continued methodological improvements remains.
A possible direction for ClimaMeter’s future development includes expanding its focus to model not only the attribution of extreme weather events but also their impacts, exposure, and vulnerability (Drakes and Tate, 2022), thereby providing a more comprehensive understanding of how climate change affects different regions and communities as outlined in Faranda et al. (2023b) and Jézéquel et al. (2024). This would allow for a better assessment of the broader consequences of climate change and support more targeted adaptation and mitigation strategies. The work of ClimaMeter highlights the importance of making climate science more accessible and actionable, with the aim of fostering better preparedness and response to the growing risks posed by climate change. As more national attribution services come online and other initiatives like WWA and Copernicus continue to develop, a more integrated and comprehensive approach to climate event attribution can and should be achieved.
Data availability statement
Publicly available datasets were analyzed in this study. This data can be found at: https://cds.climate.copernicus.eu/datasets/reanalysis-era5-single-levels?tab=overview doi: 10.1175/BAMS-D-21-0145.1.
Author contributions
DF: Investigation, Conceptualization, Funding acquisition, Software, Resources, Writing – original draft, Project administration, Writing – review & editing, Visualization, Methodology, Data curation, Formal analysis, Validation, Supervision.
Funding
The author(s) declare that financial support was received for the research and/or publication of this article. This work was supported by the COST Action CA22162 FutureMed (European Cooperation in Science and Technology), the ANR project PowDev (Strategic Development of the power grids of the future, ANR reference: ANR-22-PETA-0016), and the ANR project Templex (ANR-23-CE56-0002).
Acknowledgments
I acknowledge useful discussions and comments of Ignacio Amigo, Samia Khoder and all the ClimaMeter team members (see the website https://www.climameter.org/consortium for the full list). I acknowledge the COST Action FutureMed CA22162, supported by COST (European Cooperation in Science and Technology); the European Union Horizon 2020 Research and Innovation Programme under grant agreement no. 101003469 (XAIDA) and Marie Skłodowska-Curie grant agreement no. 956396 (EDIPI).
Conflict of interest
The author declares that the research was conducted in the absence of any commercial or financial relationships that could be construed as a potential conflict of interest.
Generative AI statement
The author declares that no Gen AI was used in the creation of this manuscript.
Any alternative text (alt text) provided alongside figures in this article has been generated by Frontiers with the support of artificial intelligence and reasonable efforts have been made to ensure accuracy, including review by the authors wherever possible. If you identify any issues, please contact us.
Publisher’s note
All claims expressed in this article are solely those of the authors and do not necessarily represent those of their affiliated organizations, or those of the publisher, the editors and the reviewers. Any product that may be evaluated in this article, or claim that may be made by its manufacturer, is not guaranteed or endorsed by the publisher.
Footnotes
References
Adams, K. M., Klein, R. J., Pulquério, M., Bachofen, C., Barrott, J., Bentz, J., et al. (2020) Adapting to extremes: key insights for bridging climate change adaptation and disaster risk reduction in the European green Deal. Placard manifesto. Available online at: https://www.placard-network.eu/wp-content/PDFs/PLACARD-manifesto-May2020.pdf
Allen, M. R., and Stott, P. A. (2003). Estimating signal amplitudes in optimal fingerprinting, part I: theory. Clim. Dyn. 21, 477–491. doi: 10.1007/s00382-003-0313-9
Beck, H. E., van Dijk, A. I. J. M., Larraondo, P. R., McVicar, T. R., Pan, M., Dutra, E., et al. (2022). MSWX: global 3-hourly 0.1° bias-corrected meteorological data including near-real-time updates and forecast ensembles. Bull. Am. Meteorol. Soc. 103:E710–E732. doi: 10.1175/BAMS-D-21-0145.1
Brinkmann, R. (2020). “Wicked problems and disasters” in Environmental sustainability in a time of change, 55–82.
Buontempo, C., Burgess, S. N., Dee, D., Pinty, B., Thépaut, J. N., Rixen, M., et al. (2022). The copernicus climate change service: climate science in action. Bull. Am. Meteorol. Soc. 103, E2669–E2687. doi: 10.1175/BAMS-D-21-0315.1
Callaghan, M., Schleussner, C. F., Nath, S., Lejeune, Q., Knutson, T. R., Reichstein, M., et al. (2021). Machine-learning-based evidence and attribution mapping of 100,000 climate impact studies. Nat. Clim. Chang. 11, 966–972. doi: 10.1038/s41558-021-01168-6
Clarke, B., Otto, F., and Jones, R. (2023). When don’t we need a new extreme event attribution study? Clim. Chang. 176:60. doi: 10.1007/s10584-023-03521-4
Clarke, B., Otto, F., Stuart-Smith, R., and Harrington, L. (2022). Extreme weather impacts of climate change: an attribution perspective. Environ. Res. 1:012001. doi: 10.1088/2752-5295/ac6e7d
Dong, C., Noyelle, R., Messori, G., Gualandi, A., Fery, L., Yiou, P., et al. (2024). Indo-Pacific regional extremes aggravated by changes in tropical weather patterns. Nat. Geosci. 17, 979–986. doi: 10.1038/s41561-024-01537-8
Drakes, O., and Tate, E. (2022). Social vulnerability in a multi-hazard context: a systematic review. Environ. Res. Lett. 17:033001. doi: 10.1088/1748-9326/ac5140
El Khaled, Z., and Mcheick, H. (2019). Case studies of communications systems during harsh environments: a review of approaches, weaknesses, and limitations to improve quality of service. Int. J. Distrib. Sens. Netw. 15:155014771982996. doi: 10.1177/1550147719829960
Fan, J., Meng, J., Ludescher, J., Chen, X., Ashkenazy, Y., Kurths, J., et al. (2021). Statistical physics approaches to the complex earth system. Phys. Rep. 896, 1–84. doi: 10.1016/j.physrep.2020.09.005
Faranda, D., Alberti, T., Coppola, E., and Anzidei, M. (2023b). Attributing Venice Acqua Alta events to a changing climate and evaluating the efficacy of MoSE adaptation strategy. NPJ Clim. Atmos. Sci. 6:181. doi: 10.1038/s41612-023-00513-0
Faranda, D., Alvarez-Castro, M. C., Ginesta, M., Coppola, E., and Pons, F. M. E. (2024e). Heavy precipitations in October 2024 south-eastern Spain DANA mostly strengthened by human-driven climate change. Paris: Institut Pierre Simon Laplace, CNRS. doi: 10.5281/zenodo.14052042
Faranda, D., Bourdin, S., Camargo, S. J., Lee, C. Y., and Fromang, S. (2024c). Understanding tropical cyclones in the Anthropocene: physics, simulations, and attribution. Bull. Am. Meteorol. Soc. 105, E2307–E2315. doi: 10.1175/BAMS-D-24-0252.1
Faranda, D., Bourdin, S., Ginesta, M., Krouma, M., Noyelle, R., Pons, F., et al. (2022). A climate-change attribution retrospective of some impactful weather extremes of 2021. Weather Clim. Dynam. 3, 1311–1340. doi: 10.5194/wcd-3-1311-2022
Faranda, D., Messori, G., Coppola, E., Alberti, T., Vrac, M., Pons, F., et al. (2024a). ClimaMeter: contextualizing extreme weather in a changing climate. Weather Clim. Dynam. 5, 959–983. doi: 10.5194/wcd-5-959-2024
Faranda, D., Messori, G., Jezequel, A., Vrac, M., and Yiou, P. (2023a). Atmospheric circulation compounds anthropogenic warming and impacts of climate extremes in Europe. Proc. Natl. Acad. Sci. 120:e2214525120. doi: 10.1073/pnas.2214525120
Faranda, D., Pons, F. M. E., Alberti, T., and Coppola, E. (2024d). Low confidence prevents ascribing April 2024 Dubai floods changes in intensity to human-driven climate change. Paris: Institut Pierre Simon Laplace, CNRS. doi: 10.5281/zenodo.14163557
Faranda, D., Yiou, P., and Alberti, T. (2024b). High precipitation in autumn 2023 France and Italy floods likely enhanced by human-driven climate change and natural variability. Paris: Institut Pierre Simon Laplace, CNRS. doi: 10.5281/zenodo.14164143
Gonzalez Aleman, J. J., Portal, A., Cazzaniga, G., Lu, C., Reale, M., Alvarez-Castro, M. C., et al. (2024). Heavy precipitation in Medicane Ianos mostly strengthened by human-driven climate change. Paris: Institut Pierre Simon Laplace, CNRS. doi: 10.5281/zenodo.14169392
Hersbach, H., Bell, B., Berrisford, P., Biavati, G., Horányi, A., Muñoz Sabater, J., et al. (2023). European Centre for Medium-Range Weather Forecasts (ECMWF), Reading, United Kingdom: Copernicus Climate Change Service (C3S). doi: 10.24381/cds.adbb2d47
Jézéquel, A., Bastos, A., Faranda, D., Kimutai, J., Le Grix, N., Wilson, A. M., et al. (2024). Broadening the scope of anthropogenic influence in extreme event attribution. Environ. Res. 3:042003. doi: 10.1088/2752-5295/ad7527
Jézéquel, A., Yiou, P., and Radanovics, S. (2018). Role of circulation in European heatwaves using flow analogues. Clim. Dyn. 50, 1145–1159. doi: 10.1007/s00382-017-3667-0
Lahsen, M., and Ribot, J. (2022). Politics of attributing extreme events and disasters to climate change. WIREs Clim. Change 13:e750. doi: 10.1002/wcc.750
Masson-Delmotte, V., Zhai, P., Pirani, A., Connors, S. L., Péan, C., Berger, S., et al. (2021). Climate change 2021: the physical science basis. Contribution of working group I to the sixth assessment report of the intergovernmental panel on climate change. Cambridge, United Kingdom and New York, NY, USA: Cambridge University Press. doi: 10.1017/9781009157896
Newman, R., and Noy, I. (2023). The global costs of extreme weather that are attributable to climate change. Nat. Commun. 14:6103. doi: 10.1038/s41467-023-41888-1
Osaka, S., and Bellamy, R. (2020). Natural variability or climate change? Stakeholder and citizen perceptions of extreme event attribution. Glob. Environ. Chang. 62:102070. doi: 10.1016/j.gloenvcha.2020.102070
Otto, F. (2023). Attribution of extreme events to climate change. Annu. Rev. Environ. Resour. 48, ISSN:1543-5938, 813–828. doi: 10.1146/annurev-environ-112621-083538
Otto, F. E., Kew, S., Philip, S., Stott, P., and Van Oldenborgh, G. J. (2022). How to provide useful attribution statements: lessons learned from operationalizing event attribution in Europe. Bull. Am. Meteorol. Soc. 103, S21–S25. doi: 10.1175/BAMS-D-21-0267.1
Otto, F., van Oldenborgh, G., Eden, J., Stott, P. A., Karoly, D. J., and Allen, M. R. (2016). The attribution question. Nat. Clim. Chang. 6, 813–816. doi: 10.1038/nclimate3089
Paciorek, C. J., and Wehner, M. F. (2016). Quantile-based bias correction and uncertainty quantification of extreme event attribution statements Soyoung Jeon earth sciences division, Lawrence Berkeley National Laboratory Berkeley, California, USA. arXiv preprint arXiv. 1602.04139
Palhol, F., Tourjansky, L., Beucher, S., Philizot, F., Bour-Poitrinal, E., and Locqueville, B. (2024) Mission d’appui au préfet de la région des Hauts-de-France pour renforcer la résilience des territoires touchés par des inondations. Available online at: https://www.igedd.developpement-durable.gouv.fr/IMG/pdf/015477-01_rapport-publie_cle5fc923.pdf
Thomas-Walters, L., Goldberg, M. H., Lee, S., Lyde, A., Rosenthal, S. A., and Leiserowitz, A. (2024). Communicating the links between climate change and heat waves with the climate shift index. Weather, Climate, and Society, 16, 511–520. doi: 10.1175/WCAS-D-23-0147.1
Philip, S., Kew, S., van Oldenborgh, G. J., Otto, F., Vautard, R., van Der Wiel, K., et al. (2020). A protocol for probabilistic extreme event attribution analyses. Adv. Stat. Climatol. Meteorol. Oceanogr. 6, 177–203. doi: 10.5194/ascmo-6-177-2020
Pons, F. M. E., and Faranda, D. (2024). Heavy precipitation in Medicane Daniel mostly strengthened by human-driven climate change. Paris: ClimaMeter, Institut Pierre Simon Laplace. doi: 10.5281/zenodo.14164832
Reed, K. A., and Wehner, M. F. (2023). Real-time attribution of the influence of climate change on extreme weather events: a storyline case study of hurricane Ian rainfall. Environ. Res. 2:043001. doi: 10.1088/2752-5295/acfd4e
Shepherd, T. G. (2016). A common framework for approaches to extreme event attribution. Curr. Clim. Chang. Rep. 2, 28–38. doi: 10.1007/s40641-016-0033-y
Slater, L. J., Anderson, B., Buechel, M., Dadson, S., Han, S., Harrigan, S., et al. (2021). Nonstationary weather and water extremes: a review of methods for their detection, attribution, and management. Hydrol. Earth Syst. Sci. 25, 3897–3935. doi: 10.5194/hess-25-3897-2021
Stott, P. A., Christidis, N., Otto, F. E., Sun, Y., Vanderlinden, J. P., Van Oldenborgh, G. J., et al. (2016). Attribution of extreme weather and climate‐related events. Wiley Interdisciplinary Reviews: Climate Change, 7, 23–41.
Trenberth, K., Fasullo, J., and Shepherd, T. (2015). Attribution of climate extreme events. Nat. Clim. Chang. 5, 725–730. doi: 10.1038/nclimate2657
Van Oldenborgh, G. J., van Der Wiel, K., Kew, S., Philip, S., Otto, F., Vautard, R., et al. (2021). Pathways and pitfalls in extreme event attribution. Clim. Chang. 166:13. doi: 10.1007/s10584-021-03071-7
Vautard, R., Yiou, P., Otto, F., Stott, P., Christidis, N., van Oldenborgh, G. J., et al. (2016). Attribution of human-induced dynamical and thermodynamical contributions in extreme weather events. Environ. Res. Lett. 11:114009. doi: 10.1088/1748-9326/11/11/114009
Yiou, P., Boichu, M., Vautard, R., Vrac, M., Jourdain, S., Garnier, E., et al. (2014). Ensemble meteorological reconstruction using circulation analogues of 1781–1785. Clim. Past 10, 797–809. doi: 10.5194/cp-10-797-2014
Zachariah, M., Kimutai, J., Barnes, C., Gryspeerdt, E., Seneviratne, S. I., Almazroui, M., et al. (2025). Heavy precipitation hitting vulnerable communities in the UAE and Oman becoming an increasing threat as the climate warms. London: Imperital College.
Zachariah, M., Kotroni, V., Kostas, L., Barnes, C., Kimutai, J., Kew, S., et al. (2023). Interplay of climate change-exacerbated rainfall, exposure and vulnerability led to widespread impacts in the Mediterranean region. London: Centre for Environmental Policy. doi: 10.25561/106501
Keywords: climate dynamics, climate change, climate hazards, climate communication, climate detection and attribution
Citation: Faranda D (2025) Enhancing public understanding of extreme weather events in a changing climate through ClimaMeter. Front. Clim. 7:1688221. doi: 10.3389/fclim.2025.1688221
Edited by:
Victor Ongoma, Mohammed VI Polytechnic University, MoroccoReviewed by:
Haosu Tang, The University of Sheffield, United KingdomDaris Correia Dos Santos, Federal University of Rio Grande do Norte, Brazil
Alexander James Thompson, University of Colorado Boulder, United States
Copyright © 2025 Faranda. This is an open-access article distributed under the terms of the Creative Commons Attribution License (CC BY). The use, distribution or reproduction in other forums is permitted, provided the original author(s) and the copyright owner(s) are credited and that the original publication in this journal is cited, in accordance with accepted academic practice. No use, distribution or reproduction is permitted which does not comply with these terms.
*Correspondence: Davide Faranda, ZGF2aWRlLmZhcmFuZGFAY2VhLmZy