 Houraa Daher*
 Ben P. Kirtman
- Department of Atmospheric Sciences, University of Miami Rosenstiel School for Marine, Atmospheric, and Earth Science, Miami, FL, United States
Due to the anthropogenic increase in greenhouse gas and aerosol forcing, the Mediterranean has been labeled a “climate change hot spot.” Previous studies have shown that climate change has dire consequences on socioeconomic situations in the Mediterranean region. Ten high-resolution global coupled climate models and two climate emissions scenarios are analyzed from the Bias Correction Constructed Analogs with Quantile mapping reordering dataset, which is downscaled CMIP6 data. Daily precipitation and air-temperature data from both the wet and dry season is used to calculate droughts and heatwaves in the Mediterranean region, including the Middle East and North Africa countries. As expected, larger impacts are observed in the high emissions scenario and during the dry season for both droughts and heatwaves. Comparing the wet season to the dry season droughts, there is a northward shift in the positive signal as most of the values are seen over the Mediterranean Sea in the wet season and over the northern Mediterranean and Europe in the dry season. For the heatwaves, the dry season shows a response stronger than the one observed by the wet season by nearly two times, and there is a strong signal located over the Mediterranean Sea during the dry season that is not seen during the wet season.
1 Introduction
The Mediterranean region has been labeled a “climate change hot spot” as a result of the anthropogenic increase in greenhouse gas concentrations and aerosol forcing (Giorgi, 2006; Giorgi and Lionello, 2008; Lionello et al., 2012; Lionello and Scarascia, 2018; Tuel and Eltahir, 2020; Cos et al., 2022). There has been a substantial warming observed in the Mediterranean over the last few decades, and this is expected to continue into the future with a warming larger than the global mean (Lionello and Scarascia, 2018) and the greatest drying among 26 regions globally (Giorgi, 2006). This warming will be greater in summer than in winter, but will still occur year-round, with reduced precipitation and an increase in drought in the region (Giorgi and Lionello, 2008; Déqué et al., 2012; Lionello et al., 2012; Ulbrich et al., 2012, 2013). This will have dire consequences on a region where climate change has a great impact on socioeconomic situations and relies heavily on rainfall (Barros et al., 2014; Gleick, 2014; Cramer et al., 2018; Cos et al., 2022).
Agriculture in the Mediterranean is responsible for consuming most of the water supply in the region with most of the land areas depleting between 60 and 80% of the supply (Hoerling et al., 2012), especially in the southern and eastern countries, also known as the Middle East and North Africa (MENA) region. With the drought observed over the past few decades and the increased risk of drought into the future, this is of great concern as it poses a threat to the future of food security in the region (Nelson et al., 2010). The large demand of water in a water scarce region has led to a shift from the traditional Mediterranean diet, considered one of the healthiest in the world and required a large amount of water to sustain, thus leading to increased risks of obesity, diabetes, and other serious health concerns (Koehring and Dougall, 2017). In addition to food security, increased drought and climate change in the region are expected to have a negative impact on urbanization, tourism, infrastructure, the economy, and in certain cases, conflict, as seen in Syria with the effects of climate change influencing the recent civil war (Gleick, 2014; Kelley et al., 2015; Tramblay et al., 2020; Tuel and Eltahir, 2020).
Geographically in the Mediterranean, the north is known to be temperate and damp, and the south is known to be hot and arid (Lionello et al., 2006; Hoerling et al., 2012; Cramer et al., 2018; Batibeniz et al., 2020). The region experiences its rainy season in the winter months and its dry season in the summer months, with the winter rainfall being more than three times the summer rainfall, when it is nearly zero. The rainy season occurs from October until the spring, after the summer Azores high pressure cell collapses, leading to more cold fronts and low-pressure systems. These low-pressure systems and cyclonic activity are determined by the Polar Front Jet Stream and the European trough, influenced by land-sea temperature contrast, which favors cyclogenesis in the region (Barlow et al., 2016; Batibeniz et al., 2020; Kelebek et al., 2021; Lionello et al., 2014; Lionello and Scarascia, 2018; Kim and Raible, 2020; Russo et al., 2015; Zittis et al., 2022). With an increase in greenhouse concentrations however, these cyclones and storm tracks are experiencing a poleward shift through the poleward expansion of the Hadley cell (Yin, 2005; Previdi and Liepert, 2007; Lu et al., 2007), leading to an increase in drought conditions. In addition to the increased drying, this region is experiencing increased sea surface temperatures and an increase in heatwaves as a result of anthropogenic climate change (Molina et al., 2020; Pastor et al., 2020; Pisano et al., 2020).
This paper aims to provide an interpretation on the impact climate change will have on the Mediterranean region and on the largest coastal cities that will be most impacted by anthropogenic climate change into the future. Using 10 high-resolution climate models and two climate emissions scenarios, precipitation and air-temperature data is analyzed in the Mediterranean, including in the MENA countries, a region typically omitted from previous Mediterranean climate studies. The focus of this project is on the changes in droughts and heatwaves for the entire Mediterranean region as a whole, as well as the individual coastal cities to see the urban coastal impacts attributed to changes in the climate. Additionally, the examination of coastal cities throughout the Mediterranean allows for interpretation of climate change impacts for countries that do not necessarily contribute the most to climate change emissions but may feel the impacts the most (Lange, 2020). This is the first time the BCCAQ dataset will be used to study the Mediterranean region as a whole including a close look at the largest coastal cities with regards to droughts and heatwaves.
2 Materials and methods
The data used in this study comes from the Bias Correction Constructed Analogs with Quantile mapping reordering (BCCAQ) dataset (Gebrechorkos et al., 2023). This dataset takes output from the Global Climate Models (GCMs) used in the Coupled Model Intercomparison Project Phase 6 (CMIP6; Eyring et al., 2016) and downscales them to a higher resolution by using different downscaling techniques to accurately replicate extreme events and daily climate variables (Werner and Cannon, 2016; Sobie and Murdock, 2017). The spatial resolution of the data increases from 1° to 0.25° attempting to remove a lot of the uncertainty and biases that came with the coarse resolution. The coarse resolution of these GCMs is what often limited their usability, especially on the local scale, therefore the downscaled data of BCCAQ can be used to improve on local and regional climate scales.
Daily precipitation and air-temperature data are used in this study from 10 CMIP6 models (one ensemble member for each model) in the BCCAQ dataset (Table 1). These variables have been previously validated against the Multi-Source Weighted-Ensemble Precipitation (MSWEP) and Multi Source Weather (MSWX) observational data sources (Beck et al., 2017, 2019, 2022; Gebrechorkos et al., 2023). Data is selected from the Mediterranean region only (0–40°E, 30–45°N) for the time-period, 1981–2,100. The data is split into a historical (1981–2014) and future time-period (2015–2,100), with two future climate change projections used from the Shared Socioeconomic Pathway (SSP) scenarios found in the sixth IPCC assessment report (Kikstra et al., 2022). SSP2-4.5 keeps CO2 emissions relatively low and is used as a lower bound of global warming and SSP5-8.5 is the extreme case with high CO2 emissions and is reliant on fossil fuels (O'Neill et al., 2016).
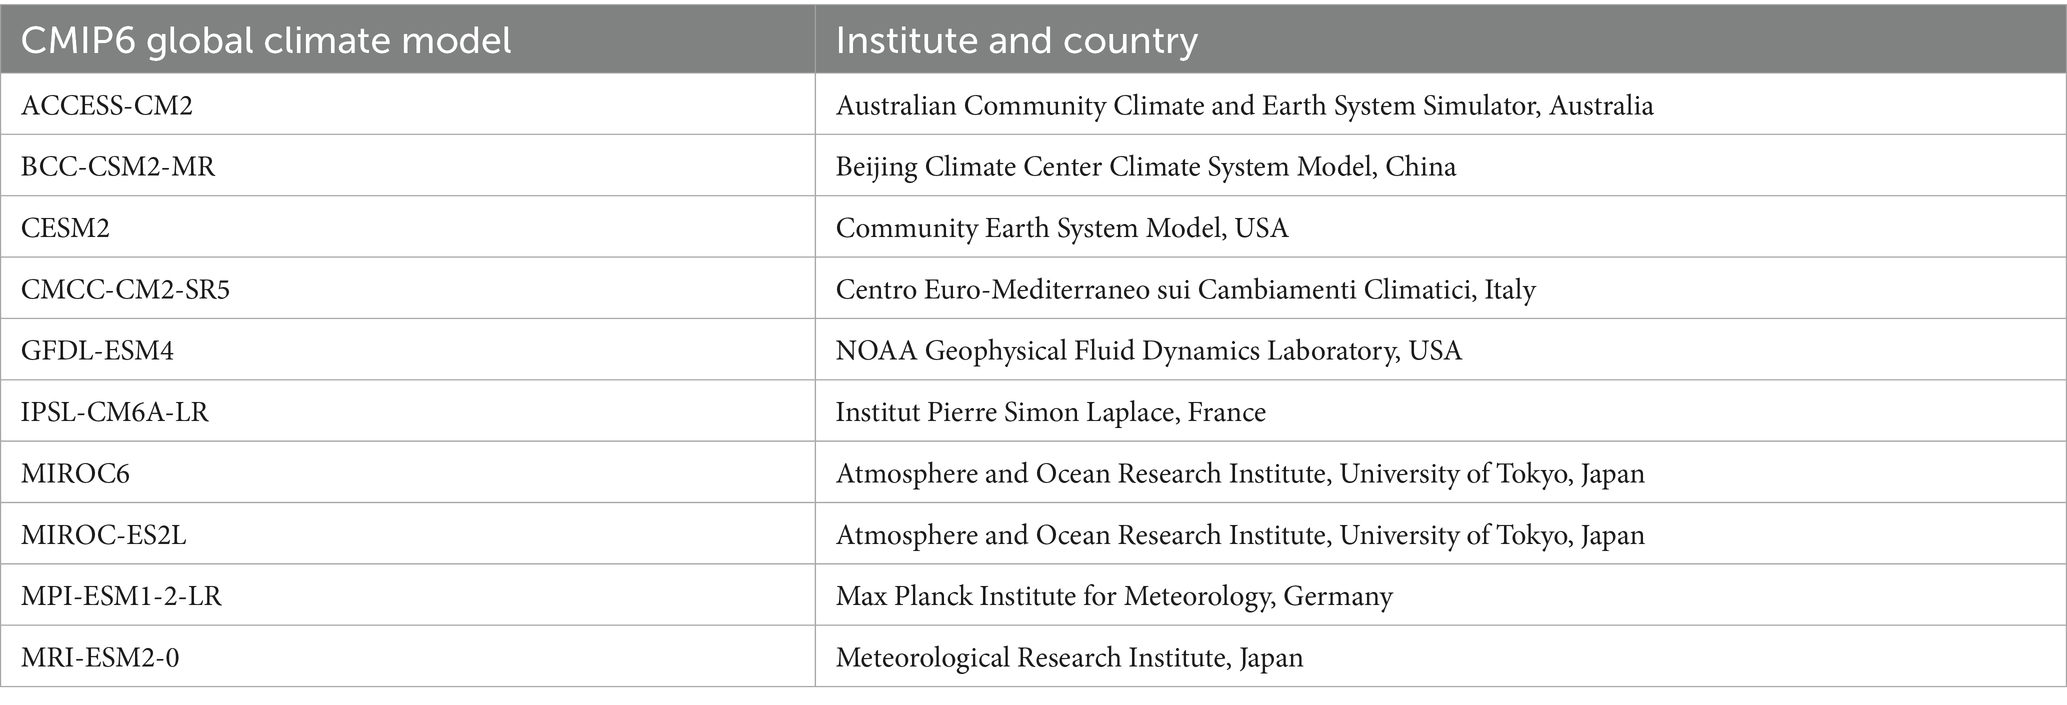
Table 1. List of the 10 CMIP6 models used in this study from the BCCAQ dataset.
Because of the large contrast between the seasons, the data is split into a winter season from October to March (ONDJFM) and a summer season (AMJJAS) from April to September, to be analyzed separately. Both droughts and heatwaves are calculated using precipitation and air-temperature data. Droughts are calculated by looking at the total amount of precipitation for the day at each grid point in the model. If the grid point has less than 0.1 mm/day of precipitation (Saaroni et al., 2015; Yang et al., 2025), that grid point on that day is considered to be in a drought. From this, the percentage of days that are in a drought for the time-period considered is determined (named “% of days in drought” in this paper). Additionally, if there are seven consecutive days in a drought, that is considered a consecutive drought until there is a day with more than 0.1 mm/day of precipitation. From this, the average length of days in a consecutive drought (“average length of drought”) and the average number of consecutive droughts that are at least 7 days for the time-period considered is calculated (“average number of droughts”). The same is done for heatwaves using the air-temperature data but for days where the air-temperature is greater than one standard deviation in place of the 0.1 mm/day precipitation threshold (“% of days in heatwave,” “average length of heatwave,” and “average number of heatwaves”). Heatwaves previously have been shown difficult to define and that there is no complete or perfect definition, especially in the Mediterranean (Molina et al., 2020; Ouzeau et al., 2016; Perkins, 2015; Zhang et al., 2011). This is completed for each of the 10 CMIP6 models and the multi-model mean is shown.
Lastly, to determine the impact on the urban coast communities, the coastal cities with the largest population from each Mediterranean country are selected (Figure 1) and split into three regions geographically, Europe (red), Middle East (blue), and North Africa (green). The populations of each of these cities are shown in Figure 2A (Brinkhoff, 2025) and compared to their respective country’s CO2 emissions in Figure 2B (Ritchie et al., 2023). This is to highlight that global warming will have a large impact on these coastal communities, despite not being a large contributor to global CO2 emissions and climate change.
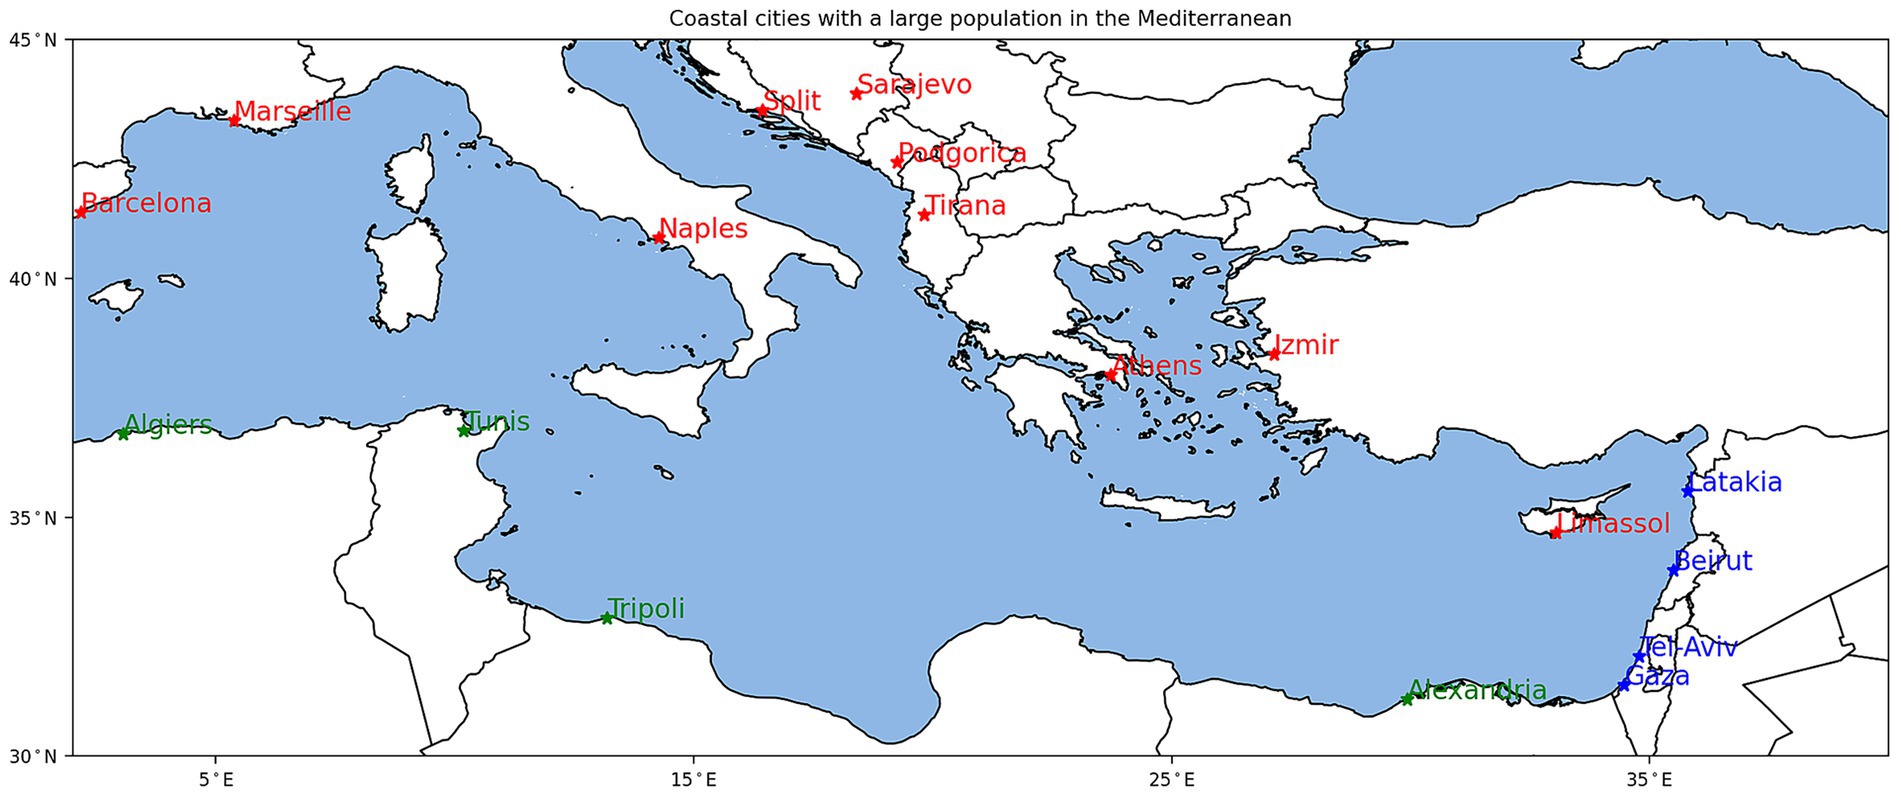
Figure 1. Map of the largest coastal cities from each of the Mediterranean countries selected. Cities from Europe are in red, from the Middle East are in blue, and from North Africa are in green.
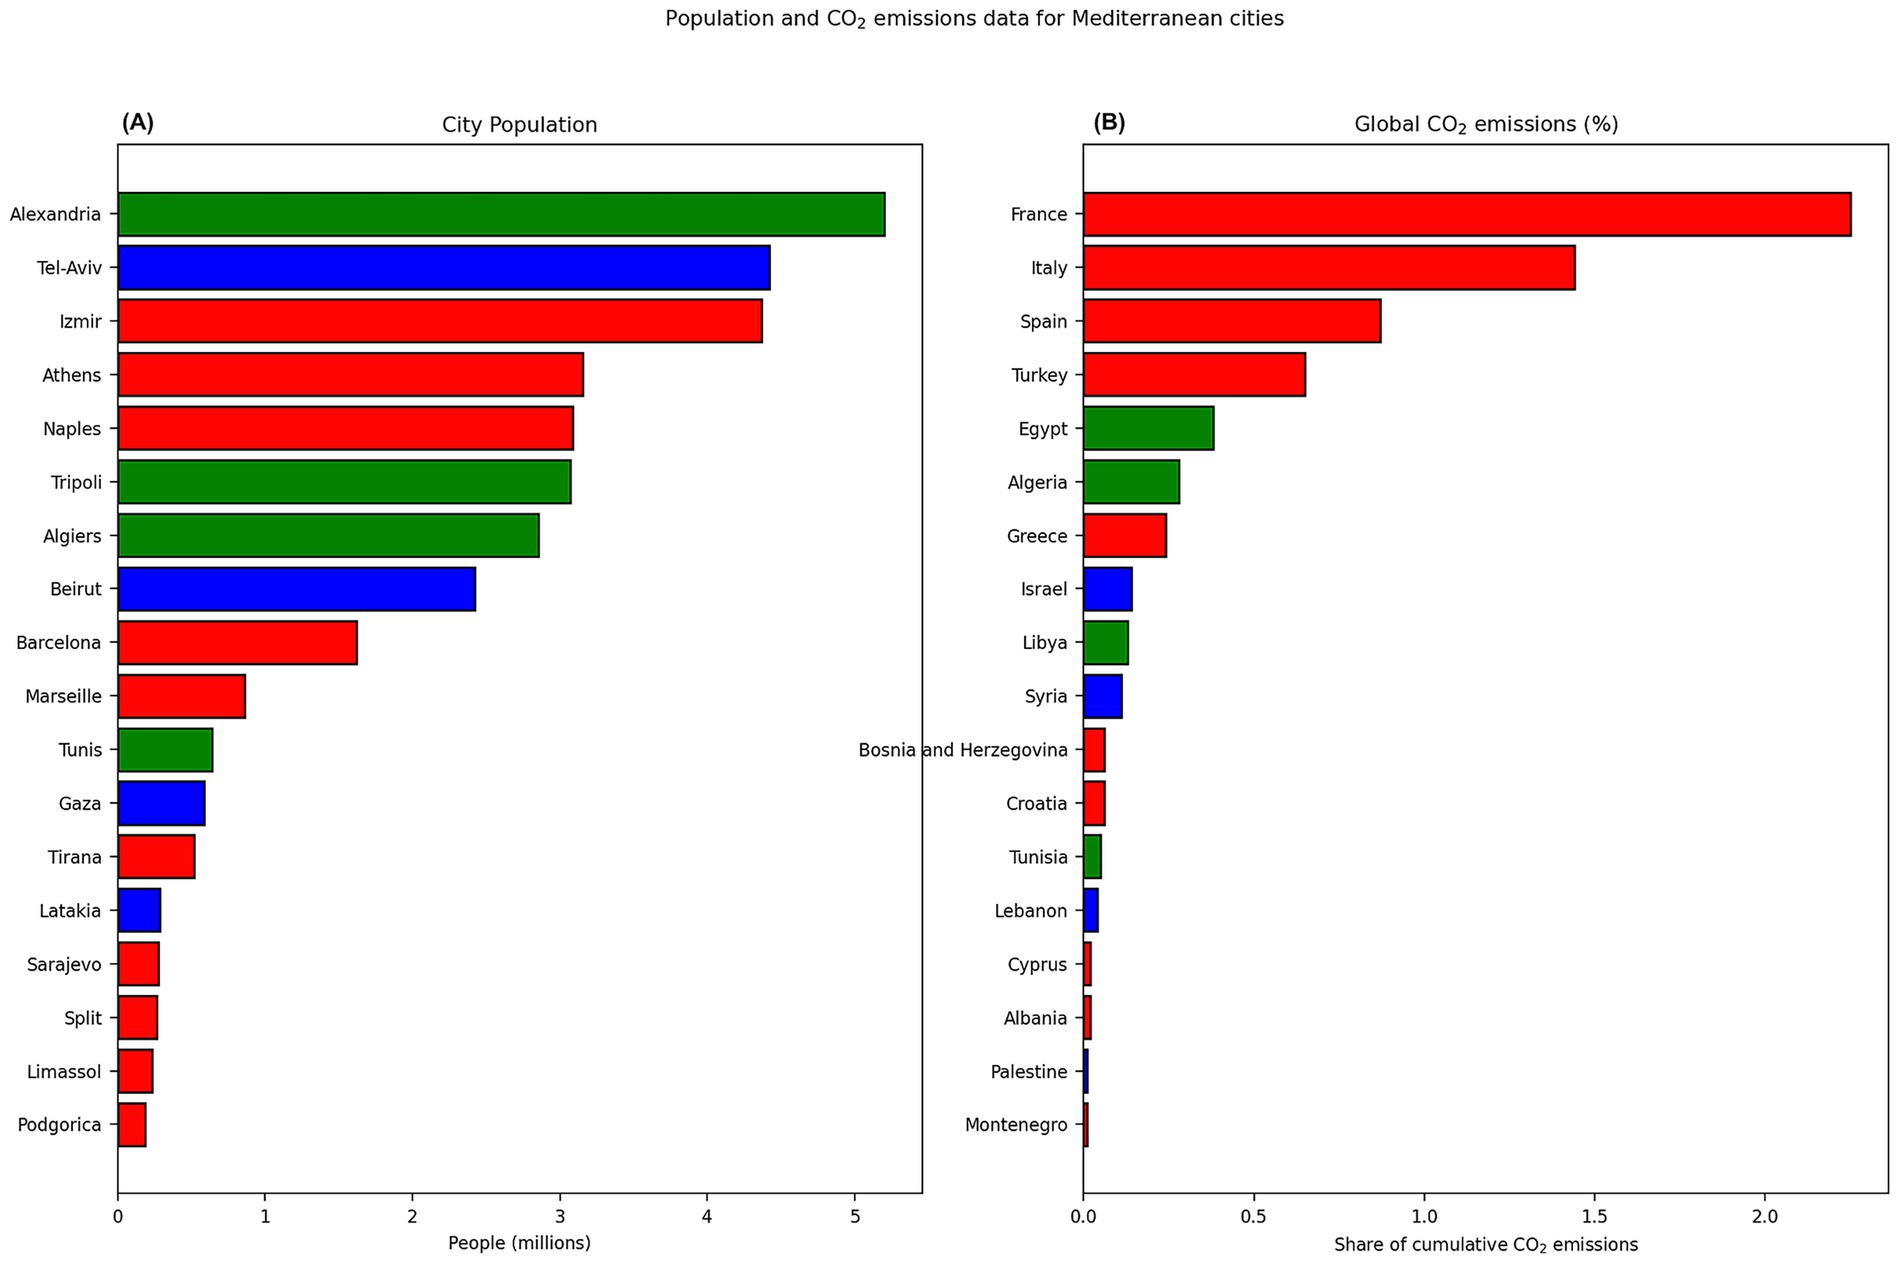
Figure 2. Population of each of the coastal cities selected (A) and the CO2 emissions that each Mediterranean country emits (B).
3 Results
3.1 Mediterranean composite maps
The multi-model mean difference between the last 10 years of data (2090–2,100) and first 10 years of data (1981–1991) are shown in the next four figures (Figures 3–6) for droughts and heatwaves during the wet winter (ONDJFM) and dry summer (AMJJAS) seasons for both SSP2-4.5 and SSP5-8.5.
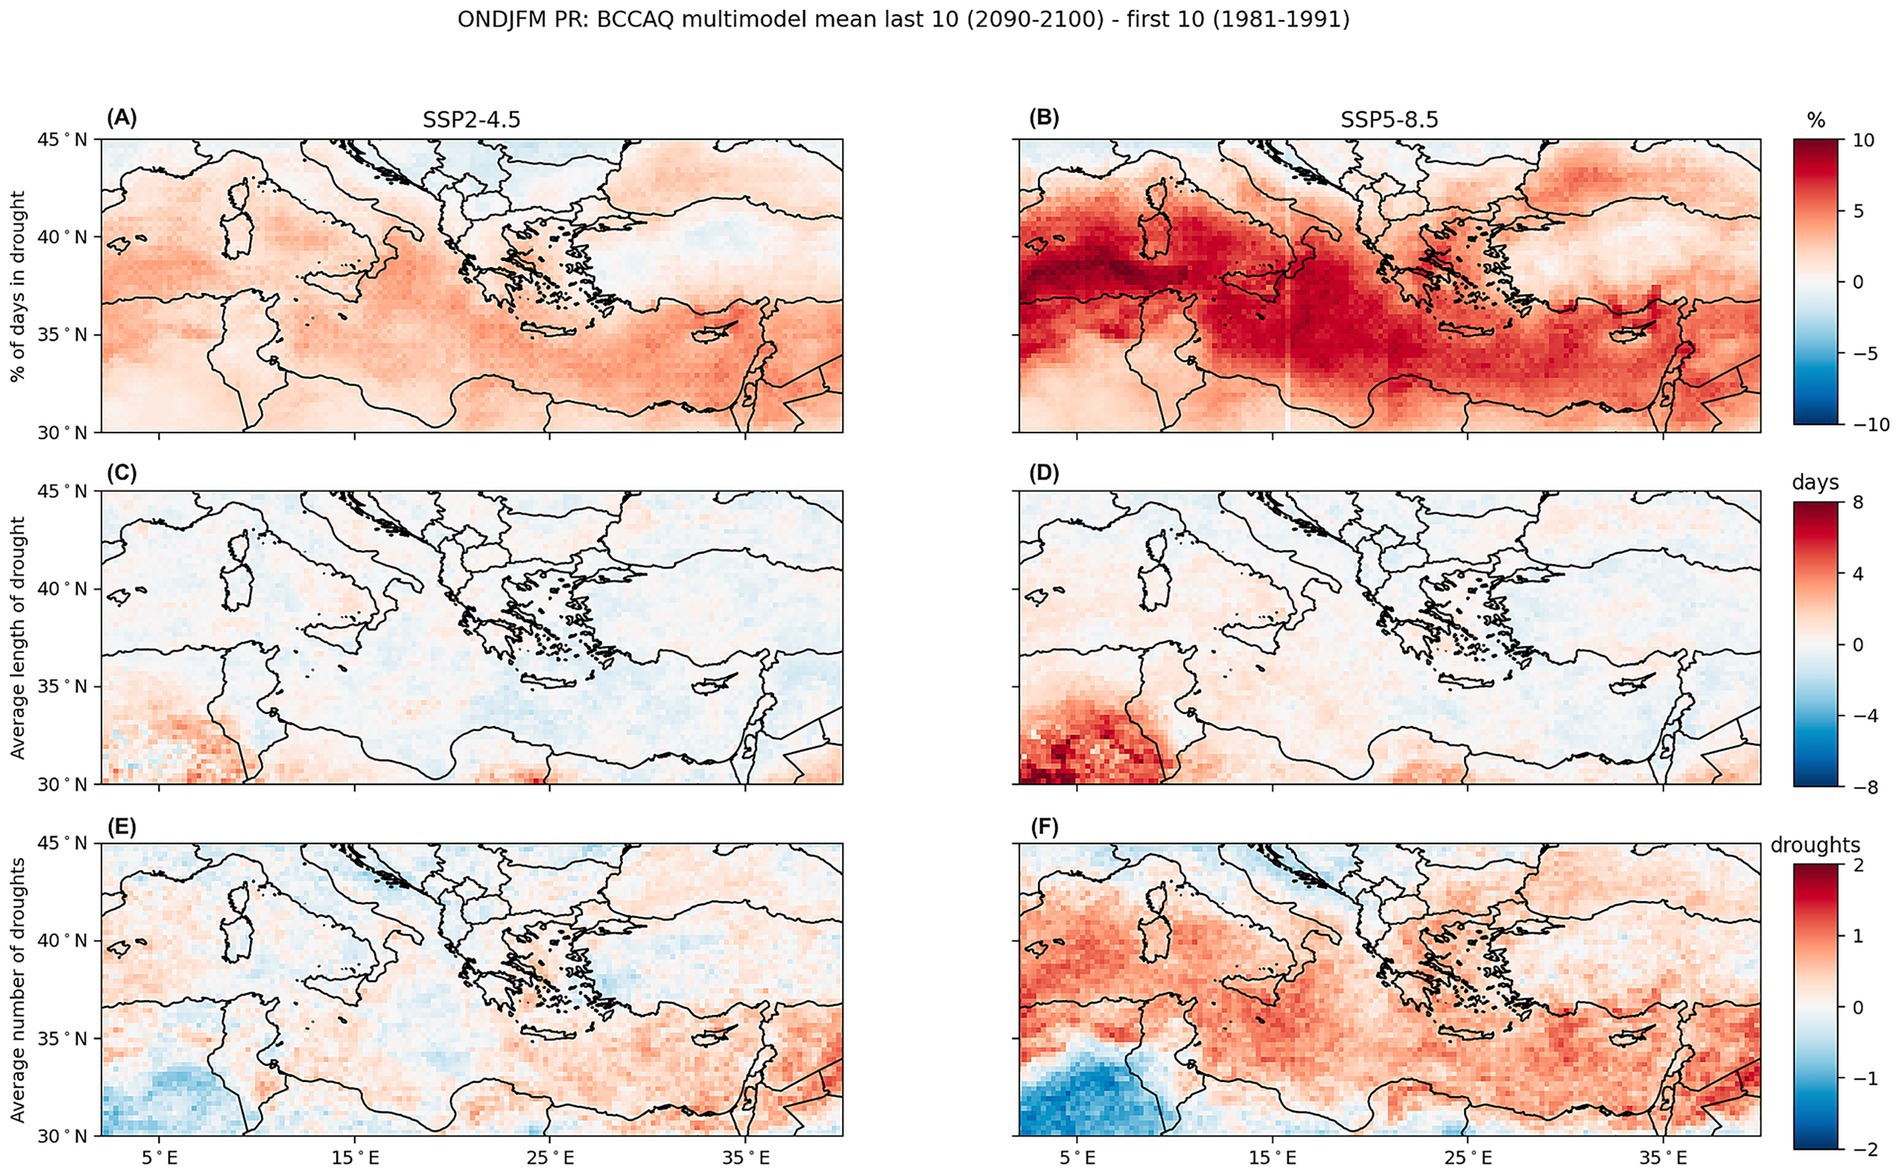
Figure 3. The difference in precipitation for the multi-model mean for ONDFJM from the last 10 years of data (2090–2,100) and first 10 years of data (1981–1991). Percent of days in a drought (A,B), average length of consecutive drought (C,D), and average number of droughts (E,F). The results from SSP2-4.5 are shown in the first column (A,C,E) and results from SSP5-8.5 are shown in the second column (B,D,F).
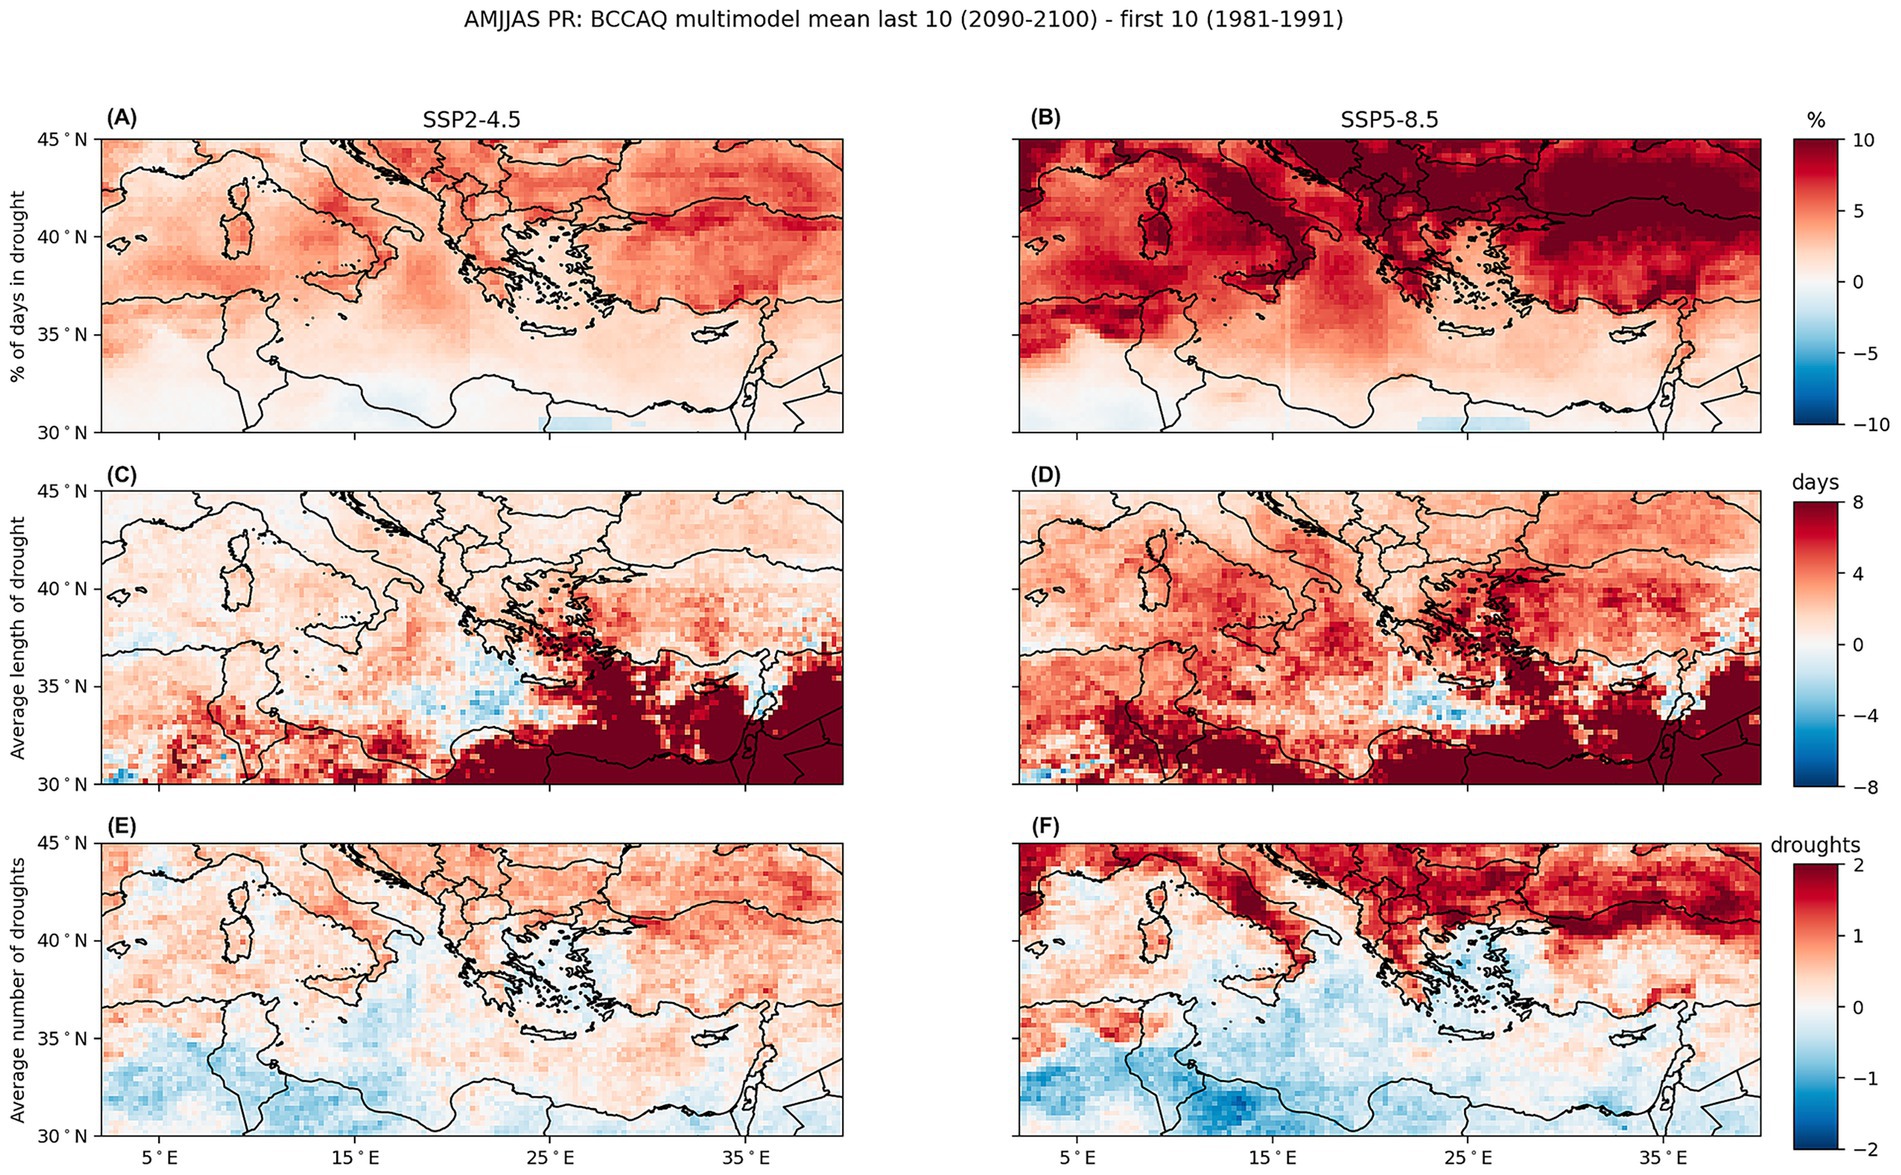
Figure 4. The difference in precipitation for the multi-model mean for AMJJAS from the last 10 years of data (2090–2,100) and first 10 years of data (1981–1991). Percent of days in a drought (A,B), average length of consecutive drought (C,D), and average number of droughts (E,F). The results from SSP2-4.5 are shown in the first column (A,C,E) and results from SSP5-8.5 are shown in the second column (B,D,F).
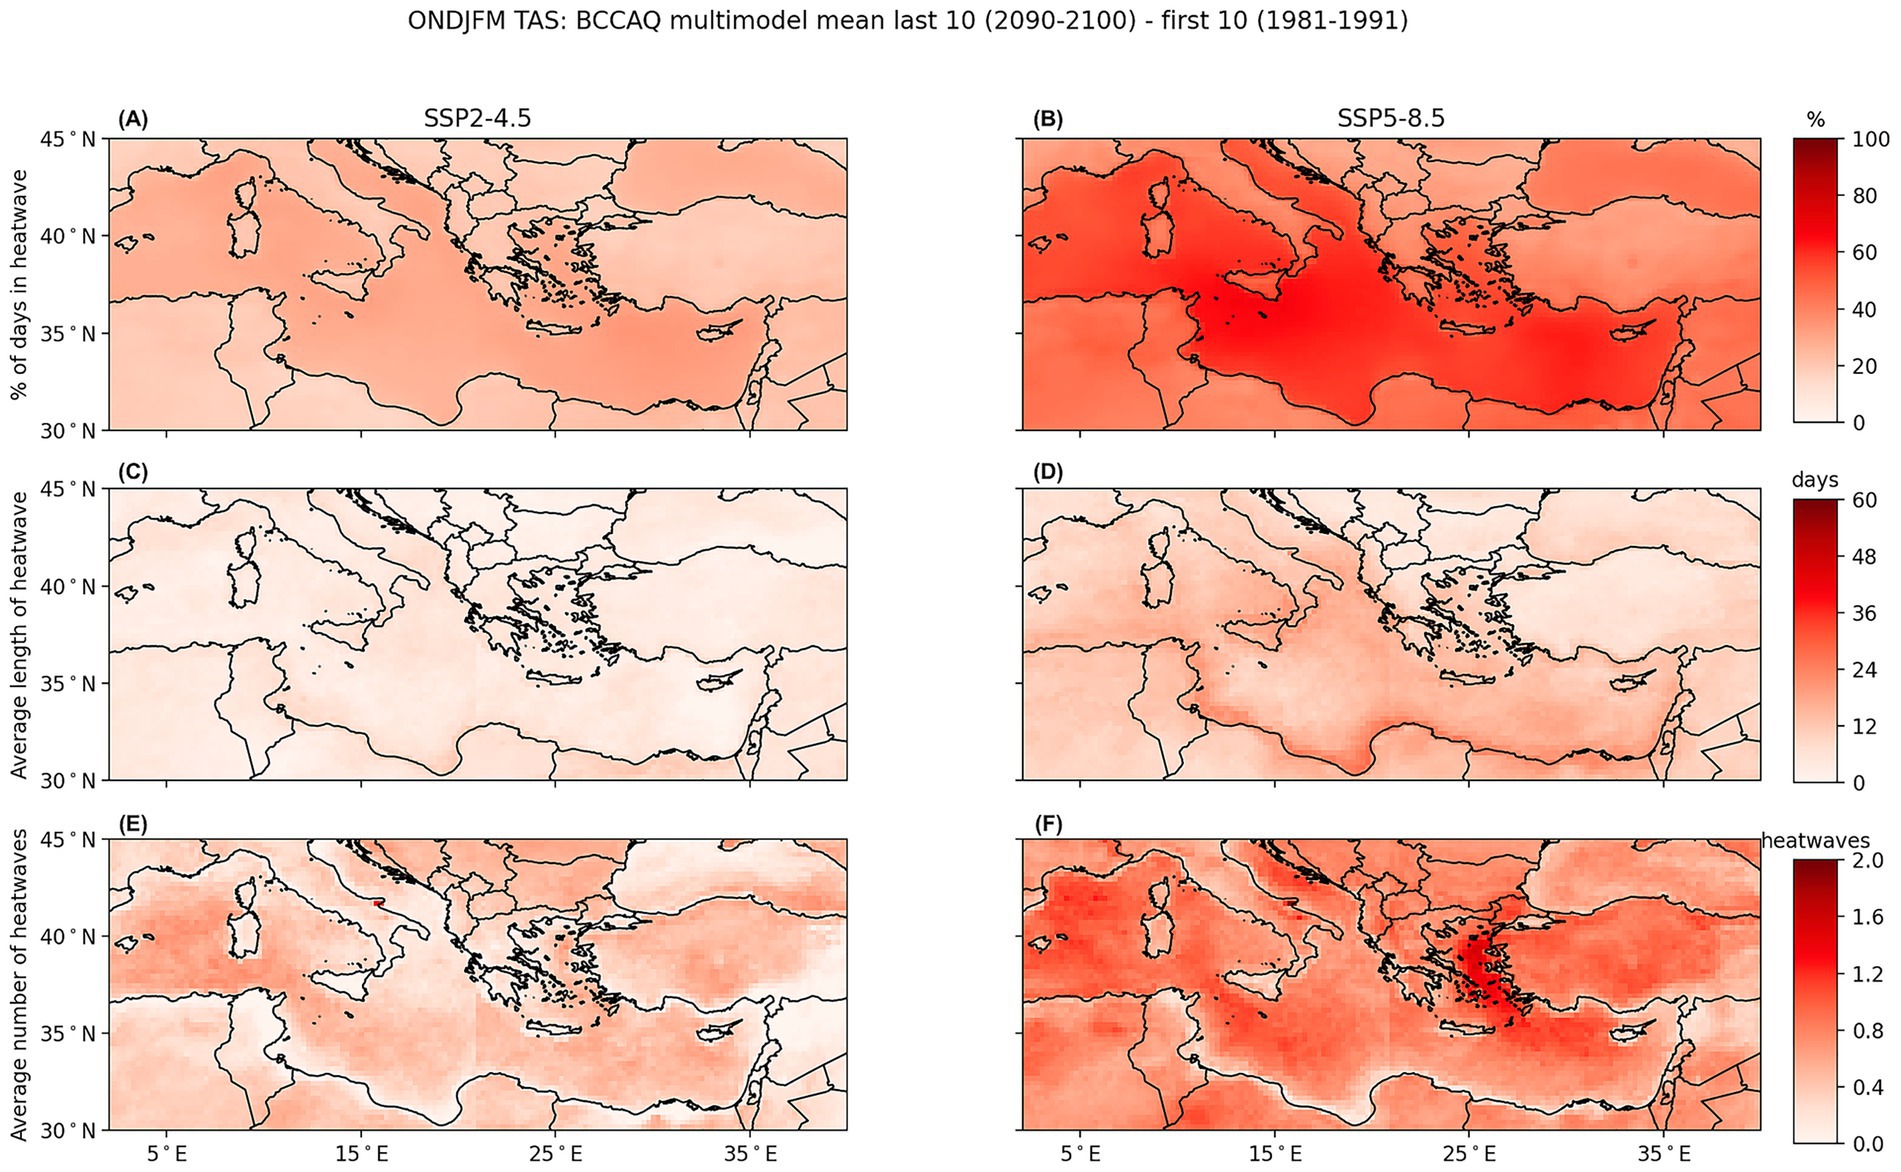
Figure 5. The difference in air-temperature for the multi-model mean for ONDFJM from the last 10 years of data (2090–2,100) and first 10 years of data (1981–1991). Percent of days in a heatwave (A,B), average length of consecutive heatwave (C,D), and average number of heatwaves (E,F). The results from SSP2-4.5 are shown in the first column (A,C,E) and results from SSP5-8.5 are shown in the second column (B,D,F).
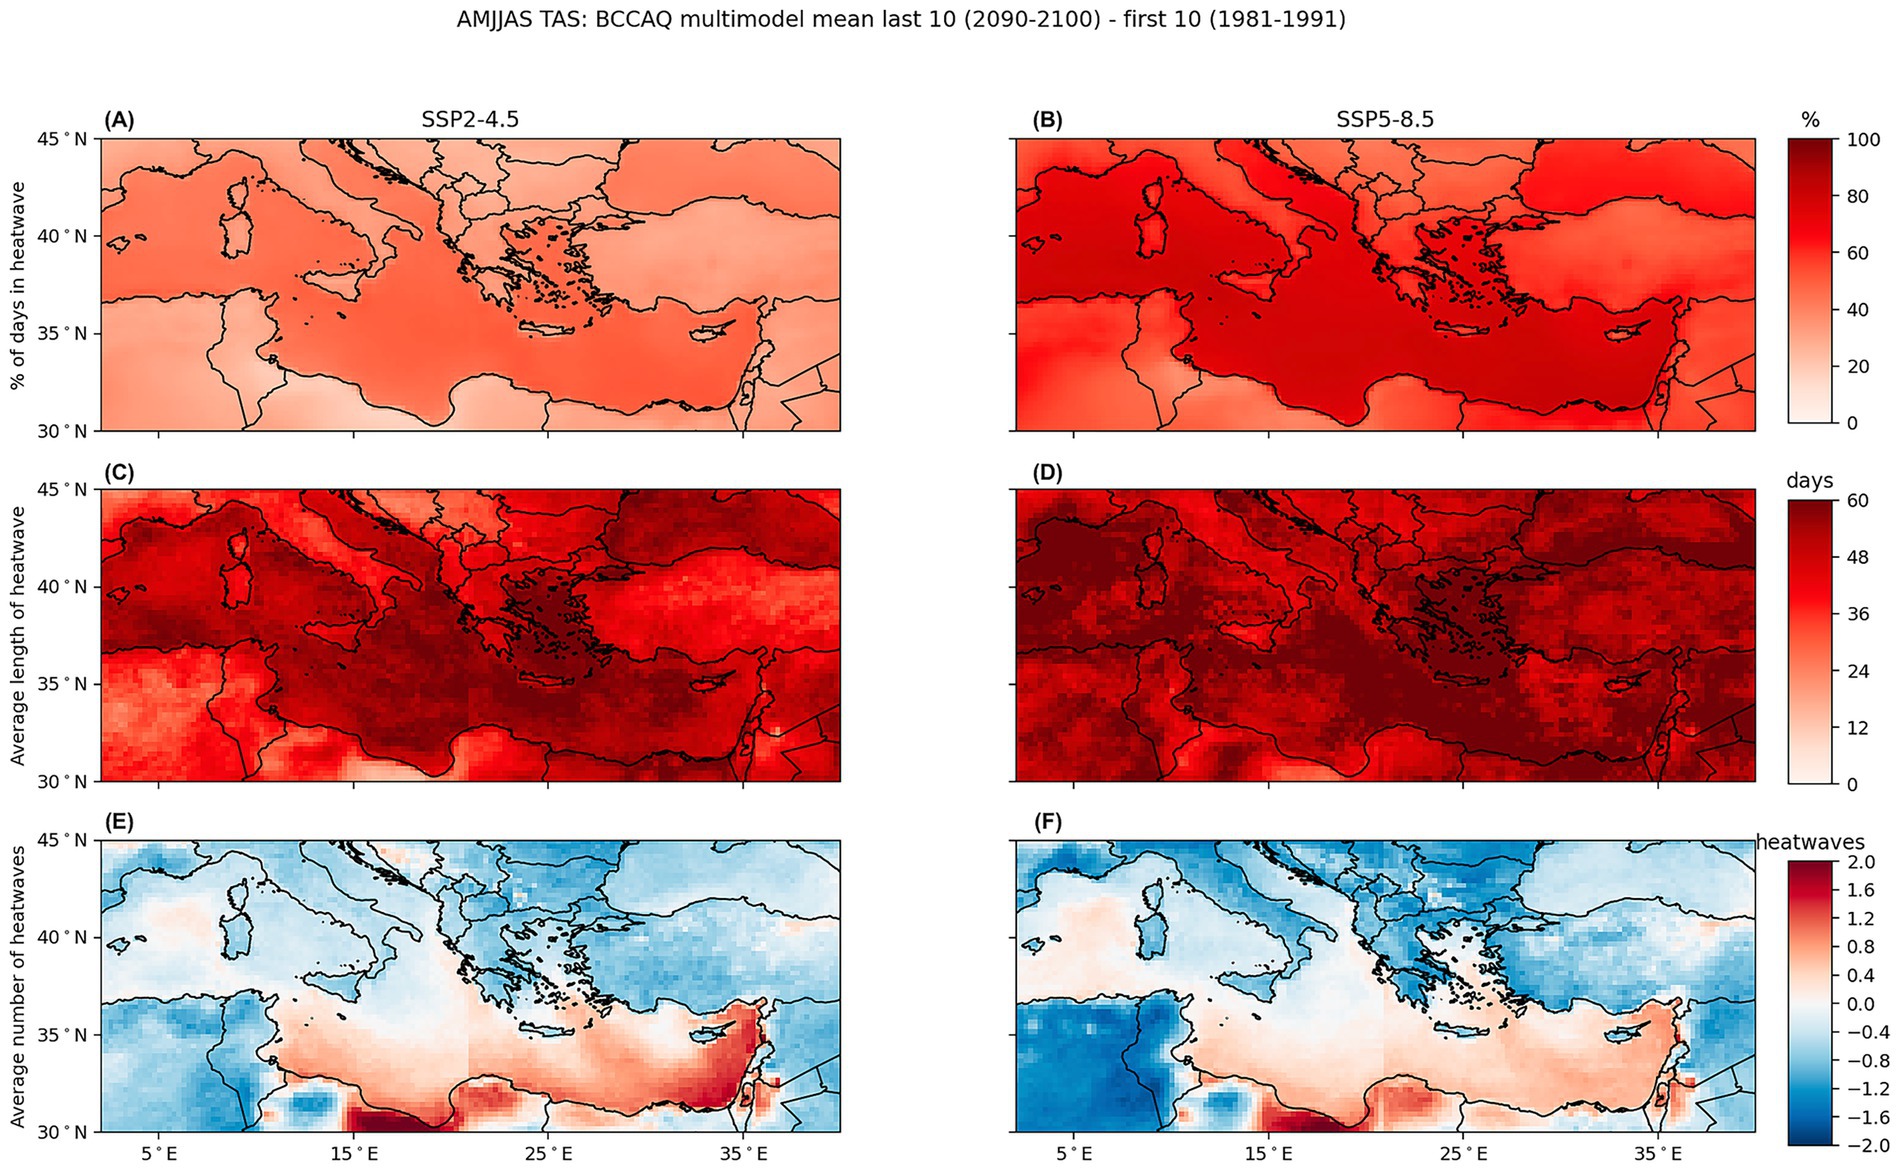
Figure 6. The difference in air-temperature for the multi-model mean for AMJJAS from the last 10 years of data (2090–2,100) and first 10 years of data (1981–1991). Percent of days in a heatwave (A,B), average length of consecutive heatwave (C,D), and average number of heatwaves (E,F). The results from SSP2-4.5 are shown in the first column (A,C,E) and results from SSP5-8.5 are shown in the second column (B,D,F).
3.1.1 Droughts
3.1.1.1 Wet season (ONDJFM)
The next two figures show the drought results for the wet season, ONDJFM (Figure 3), and the dry season, AMJJAS (Figure 4), over the Mediterranean. During ONDJFM for SSP2-4.5 (Figure 3A), there is an increase in the percentage of days in a drought in most of the Mediterranean region, with the exception of the northern latitudes where there is a decrease found. The overall scale shows roughly a 5% or less change in all areas, with the greatest change found over the eastern Mediterranean. For SSP5-8.5 (Figure 3B), a similar pattern is found but on a much larger scale overall, with some areas showing an increase of greater than 10% of days in drought comparing the last 10 years and first 10 years of the dataset. This signal is especially evident over the Mediterranean Sea. Additionally, some areas where there was previously a decrease found in northern Europe are found to have an increase in SSP5-8.5.
The average length of consecutive drought during ONDJFM shows an overall decrease over the Mediterranean for SSP2-4.5 (Figure 3C). At the end of the century, most of the region experiences droughts that are shorter on average by roughly 4 days compared to the first 10 years. The exception to this being western North Africa over Algeria, a signal that is seen in SSP5-8.5 as well (Figure 3D). Here there is a clear pattern that shows an increase in the length of drought over the North Africa region with some areas experiencing droughts longer by at least 8 days. The rest of the region shows negligible change, similar to what was seen in SSP2-4.5 (Figure 3C).
Lastly, the average number of these consecutive droughts is examined for ONDJFM, and for SSP2-4.5 (Figure 3E), the largest increase in frequency of drought is found over the eastern Mediterranean and the Middle East, and the largest decrease is found over the same North Africa area in Algeria seen previously. For SSP5-8.5 (Figure 3F), however, there is a significant increase in signal found over the Mediterranean Sea and the surrounding coastal areas, similar to what was seen with the percentage of days in a drought (Figure 3B). In these areas, there is an increase of at least two droughts per season that last at least 7 days during the wet season of ONDJFM. Additionally, there is a strong decrease in frequency of drought seen Algeria coinciding with the increase in the length of drought seen previously in SSP5-8.5 (Figure 3D).
3.1.1.2 Dry season (AMJJAS)
For the dry season, AMJJAS (Figure 4), the signal is much more amplified as expected as the region experiences much less rainfall during this period on average. Additionally, the pattern of change for SPS2-4.5 and SSP5-8.5 are similar, with SSP5-8.5 showing a stronger signal. For the percentage of days in a drought during SSP2-4.5 (Figure 4A), there is an overall increase throughout the Mediterranean region from the first 10 years to the last 10 years. The largest change is seen over the northern Mediterranean in Europe, a signal seen in SSP5-8.5 (Figure 4B) on a much larger scale. The large change observed over the northern Mediterranean suggests that the external forcing experienced in SSP2-4.5 and SSP5-8.5 will have drastic effects on the European summer. For the MENA region however, there is insignificant change, likely as this region is typically in a drought during AMJJAS regardless of external forcing.
Similar to what was seen for the percentage of days in drought, there is a predominately positive signal in the Mediterranean for the average length of consecutive drought for SSP2-4.5 (Figure 4C) and SSP5-8.5 (Figure 4D). For both forcing scenarios, the largest increase in length of drought is observed over the southeastern Mediterranean, where there is an increase of more than 8 days to the average length of drought. In SSP5-8.5 (Figure 4D), the signal is stronger than what was observed for SSP2-4.5 (Figure 4C) with the entire Mediterranean region, including Europe experiencing longer droughts during AMJJAS.
The average number of droughts for AMJJAS shows a similar pattern once more for SSP2-4.5 (Figure 4E) and SSP5-8.5 (Figure 4F), with SSP5-8.5 having a stronger signal. Overall, the Mediterranean region experiences more average number of droughts per dry season (AMJJAS) in the north over Europe and less in the south over the MENA region. Over most areas in the northern Mediterranean, there is an increase of more than two droughts during the last 10 years of the century. This signal is confined mostly to the areas with land as a negative effect is observed over the Mediterranean.
Comparing the wet season (ONDJFM; Figure 3) and dry season (AMJJAS; Figure 4) for the drought variables, the signal differs greatly in intensity and in location. As mentioned previously, the dry season shows a much stronger change in drought from the last 10 years to the first 10 years. Additionally, there is a northward shift in the positive signal from the wet season to the dry season. During the wet season, ONDJFM, most of the positive values are seen over the Mediterranean Sea and in the dry season, AMJJAS, the positive values are seen over the northern Mediterranean above Europe.
3.1.2 Heatwaves
3.1.2.1 Wet season (ONDJFM)
The following two figures show the heatwave results for the wet season, ONDJFM (Figure 5), and dry season, AMJJAS (Figure 6), over the Mediterranean. Differing from the previous results shown for the droughts in the Mediterranean, the heatwave results for the wet season show only positive change from the in the last 10 years compared to the first 10 years for both forcing scenarios. For SSP2-4.5 (Figure 5A), there is an increase in the percentage of days in a heatwave throughout the entire Mediterranean with the signal over the Mediterranean Sea being the largest, nearly double what is observed over land. A similar pattern is seen in SSP5-8.5 (Figure 5B), but on a greater scale, especially in the MENA region, indicating that the high emissions from SSP5-8.5 will have a large effect on the future of the region.
Surprisingly for SSP2-4.5 (Figure 5C), however, there is very little change observed from the last 10 years and the first 10 years for the average length of consecutive heatwaves. The heatwaves on average tend to last about 10 days longer at the tail end of the century. This is small when comparing the results to what is observed in SSP5-8.5 (Figure 5D). Here, there is an increase in length of the heatwaves across all the Mediterranean especially along the coast of Northern Africa with some areas increasing by nearly 50 days.
Similar to there not being a large increase in length of the heatwaves in SSP2-4.5 (Figure 5C), there is also only a slight increase in frequency of heatwaves lasting at least 7 days experienced in ONDJFM (Figure 5E). Throughout the Mediterranean, there is an increase of less than one heatwave per season on average observed with the greatest increase observed over the Eastern European region. For SSP5-8.5 (Figure 5F), however, the signal doubles compared to SSP2-4.5, with there being less than two heatwaves on average per season. The greatest increase in the number of heatwaves observed occurs over the Aegean Sea, and Turkey and Greece. The smallest change is observed along the North African coast, coinciding with the large increase in the length of heatwave observed previously (Figure 5D). With the length of the heatwaves increasing by nearly 2 months on average, this gives less room for more heatwaves to occur in the six-month period of ONDJFM.
3.1.2.2 Dry season (AMJJAS)
Once again, as expected, the signal for the dry season (AMJJAS; Figure 6) is a much more amplified one of the wet season (ONDJFM; Figure 5). Both forcing scenarios result in more extreme temperatures, and therefore more days experiencing heatwave conditions. There is an increase observed between SSP2-4.5 (Figure 6A) and SSP5-8.5 (Figure 6B), as the percentage of days in a heatwave is nearly doubled. Both scenarios show the region experiencing more heatwave days over the Mediterranean Sea than over land at the end of the century, with there being between 50 and 80% increase in days with heatwave conditions.
For the average length of heatwave, both SSP2-4.5 (Figure 6C) and SSP5-8.5 (Figure 6D), show strong changes over the entire region and especially over the Mediterranean Sea. For SSP2-4.5 (Figure 6C), the greatest change is observed over the Mediterranean Sea with an increase of over 50 days for the average length of heatwave observed whereas the regions over land experience an increase of roughly 30 days or less on average. This signal is much stronger in SSP5-8.5 (Figure 6D) with the entire Mediterranean region, both over sea and land, experiencing an increase in the average length of heatwave by over 60 days. This means that by the last 10 years of the century for the dry season (AMJJAS), the Mediterranean is experiencing periods of 30 consecutive days or more where the air temperature is greater than one standard deviation and a constant warming observed.
Lastly, for the average number of heatwaves observed in the season, a unique pattern is found for both SSP2-4.5 (Figure 6E) and SSP5-8.5 (Figure 6F), where there is a negative change found over much of the entire region with the exception of the Eastern Mediterranean Sea and parts of Egypt and Libya. In SSP2-4.5 (Figure 6E), there is a decrease of roughly one heatwave of at least 7 days observed during the dry season. And a slightly stronger signal is observed for SSP5-8.5 (Figure 6F), with nearly two heatwaves less per season. As mentioned previously, the decrease in number of heatwaves observed could be due to the significant increase observed in the length of heatwaves per season (Figures 6C,D). One feature that is interesting to note is there is a stronger increase in the eastern Mediterranean Sea in SSP2-4.5 (Figure 6E) that disappears in SSP5-8.5 (Figure 6F).
Again, comparing the wet season (ONDJFM; Figure 5) and the dry season (AMJJAS; Figure 6) heatwave variables, the largest difference between the two is the intensity and location. The dry season (Figure 6) shows a much stronger change of nearly 2–3 times that seen during the wet season (Figure 5) due to the extreme heat from both forcing scenarios. Additionally, the dry season shows a very strong signal located over the Mediterranean Sea that is not observed during the wet season. And unlike the previous drought maps (Figures 3, 4), there is no negative change from the last 10 years and the first 10 years, except for the number of heatwaves observed in the dry season (Figures 6E,F), where there is a negative change observed over land. Additionally, there is a negligible difference observed over the land areas as seen previously contrasting the northern Mediterranean/Europe and the southern Mediterranean/MENA region.
3.2 Impact on coastal cities
The next four figures (Figures 7–10) show the multi-model mean percentage change between the last 10 years (2090–2,100) and first 10 years (1981–1991) for each Mediterranean city selected for droughts and heatwaves during the wet winter (ONDJFM) and dry summer (AMJJAS) season for both SSP2-4.5 and SSP5-8.5.
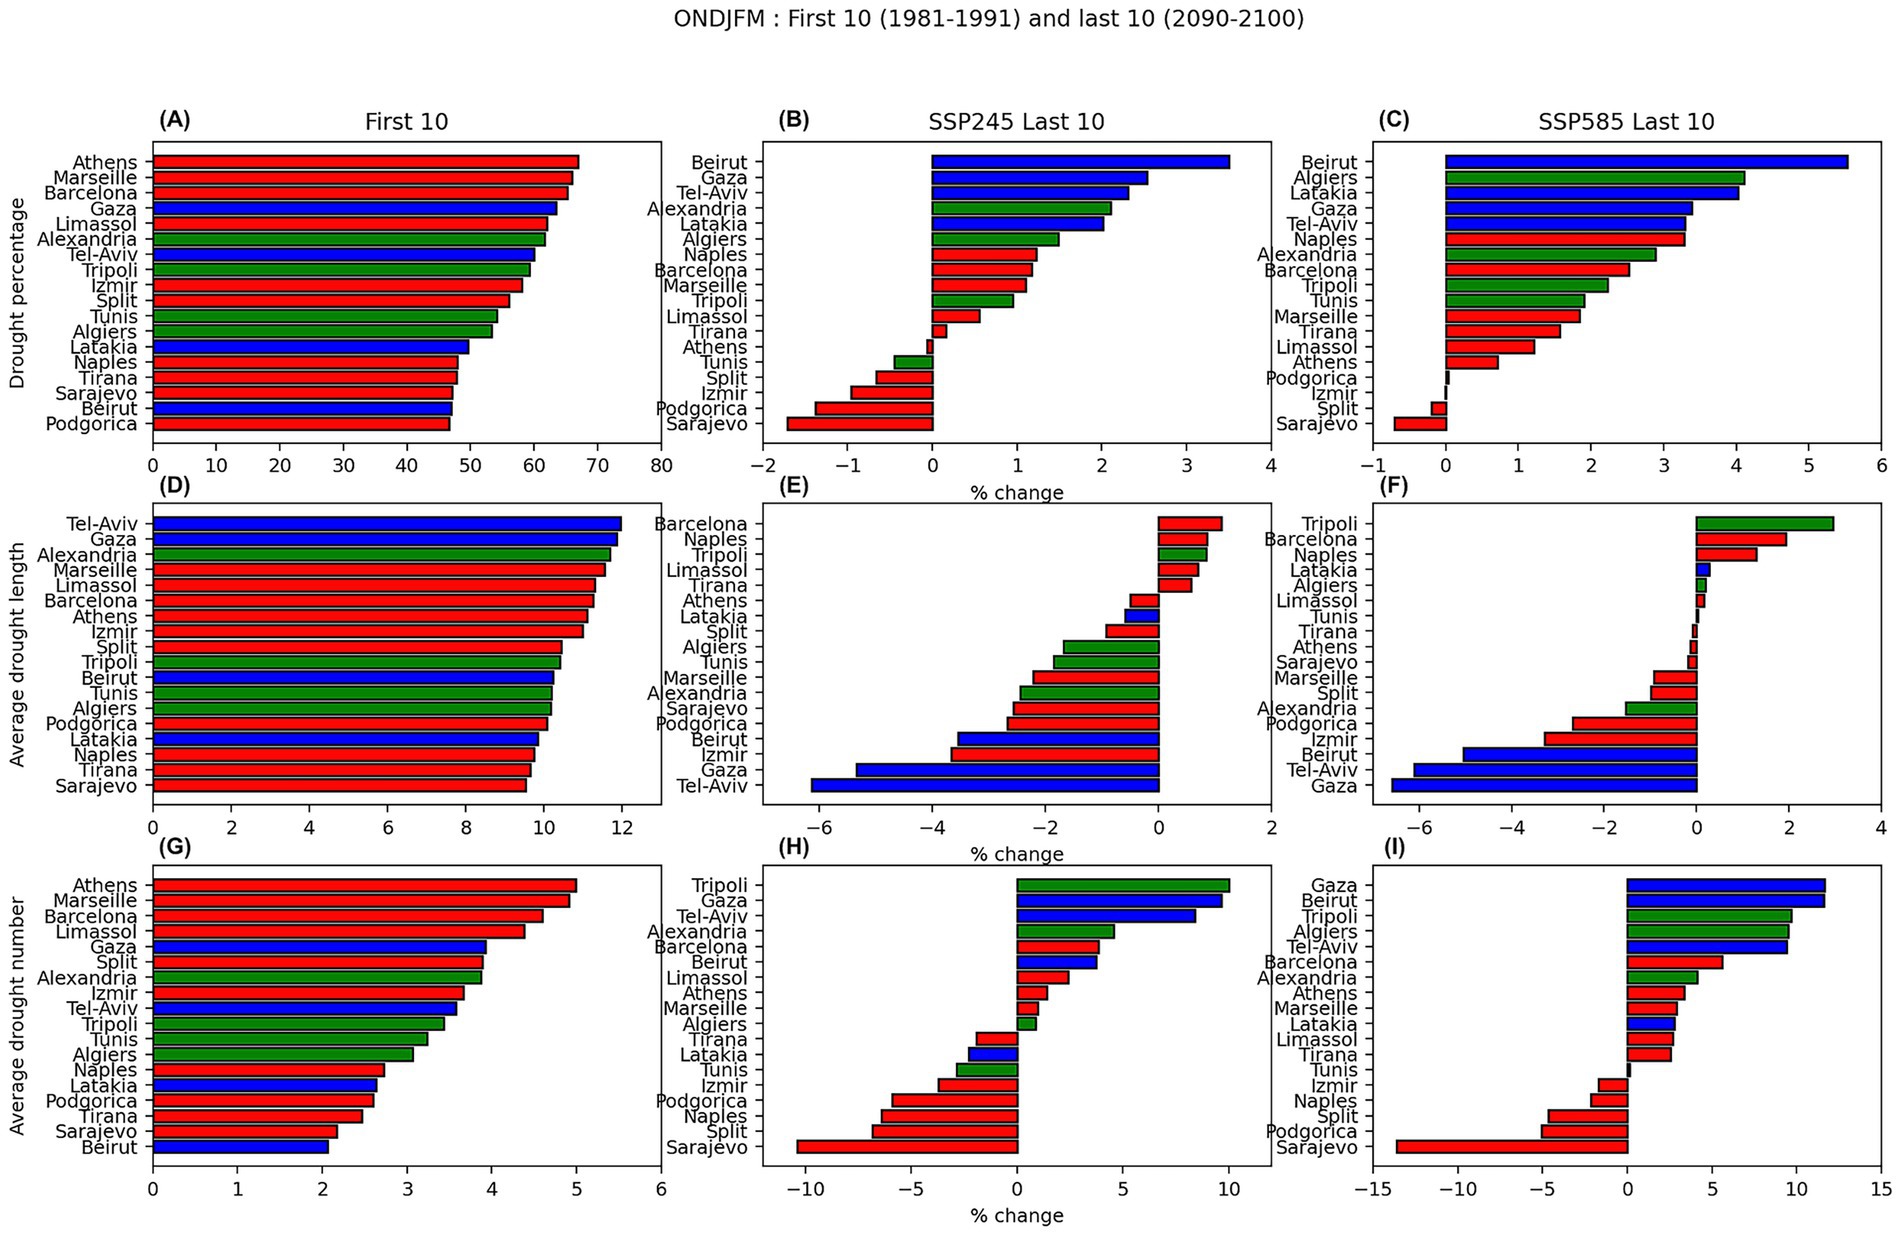
Figure 7. The changes in precipitation for ONDJFM for each of the coastal cities for (A–C) drought percentage, (D–F) average drought length, and (G–I) average number of droughts. The first column (A,D,G) shows the results for the first 10 years, the second column (B,E,H) shows the percentage change from the first column to the last 10 years of SSP2-4.5, and the last column (C,F,I) show the percentage from the first column to the last 10 years of SSP5-8.5. The European cities are shown in red, the Middle Eastern cities are shown in blue, and the North African cities are shown in green.
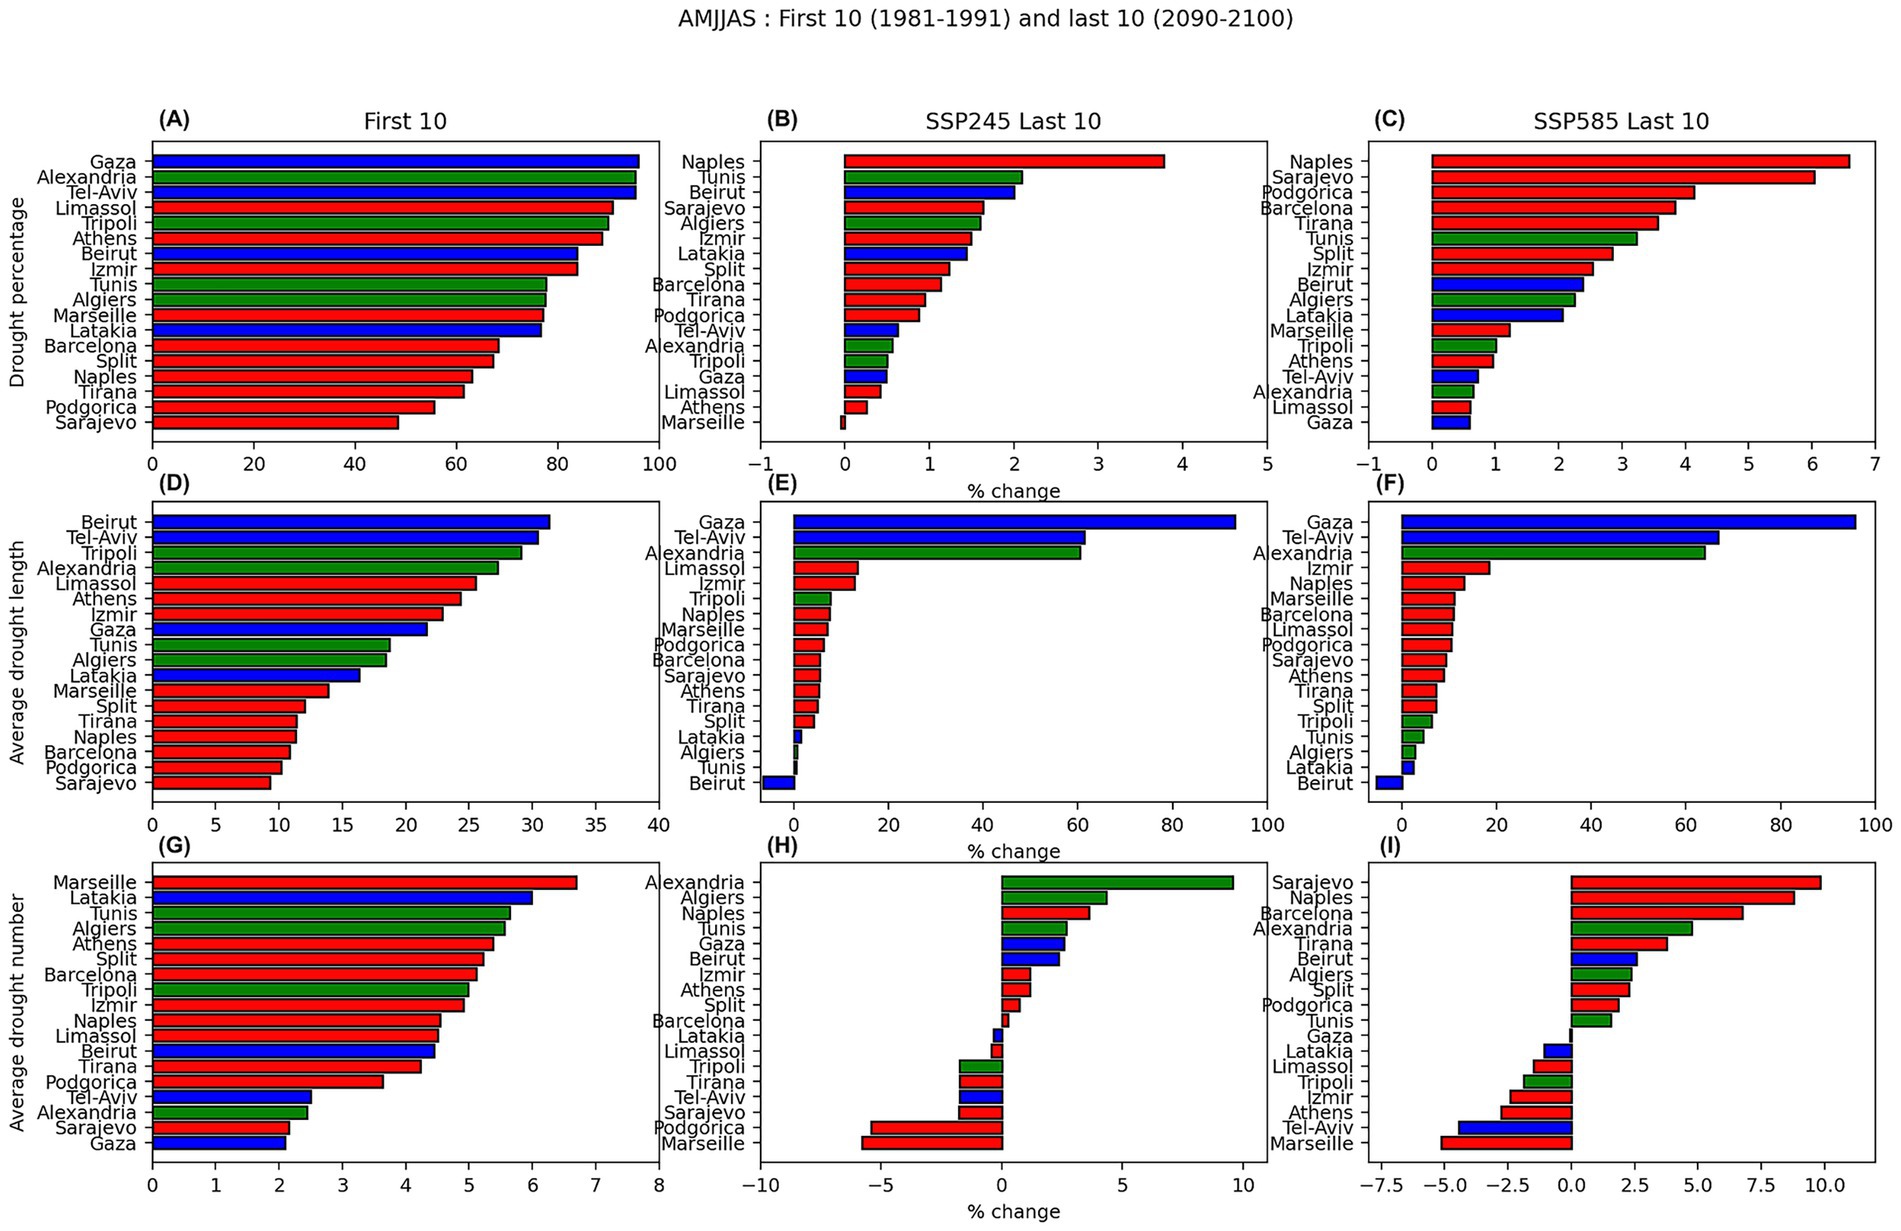
Figure 8. The changes in precipitation for AMJJAS for each of the coastal cities for (A–C) drought percentage, (D–F) average drought length, and (G–I) average number of droughts. The first column (A,D,G) shows the results for the first 10 years, the second column (B,E,H) shows the percentage change from the first column to the last 10 years of SSP2-4.5, and the last column (C,F,I) show the percentage from the first column to the last 10 years of SSP5-8.5. The European cities are shown in red, the Middle Eastern cities are shown in blue, and the North African cities are shown in green.
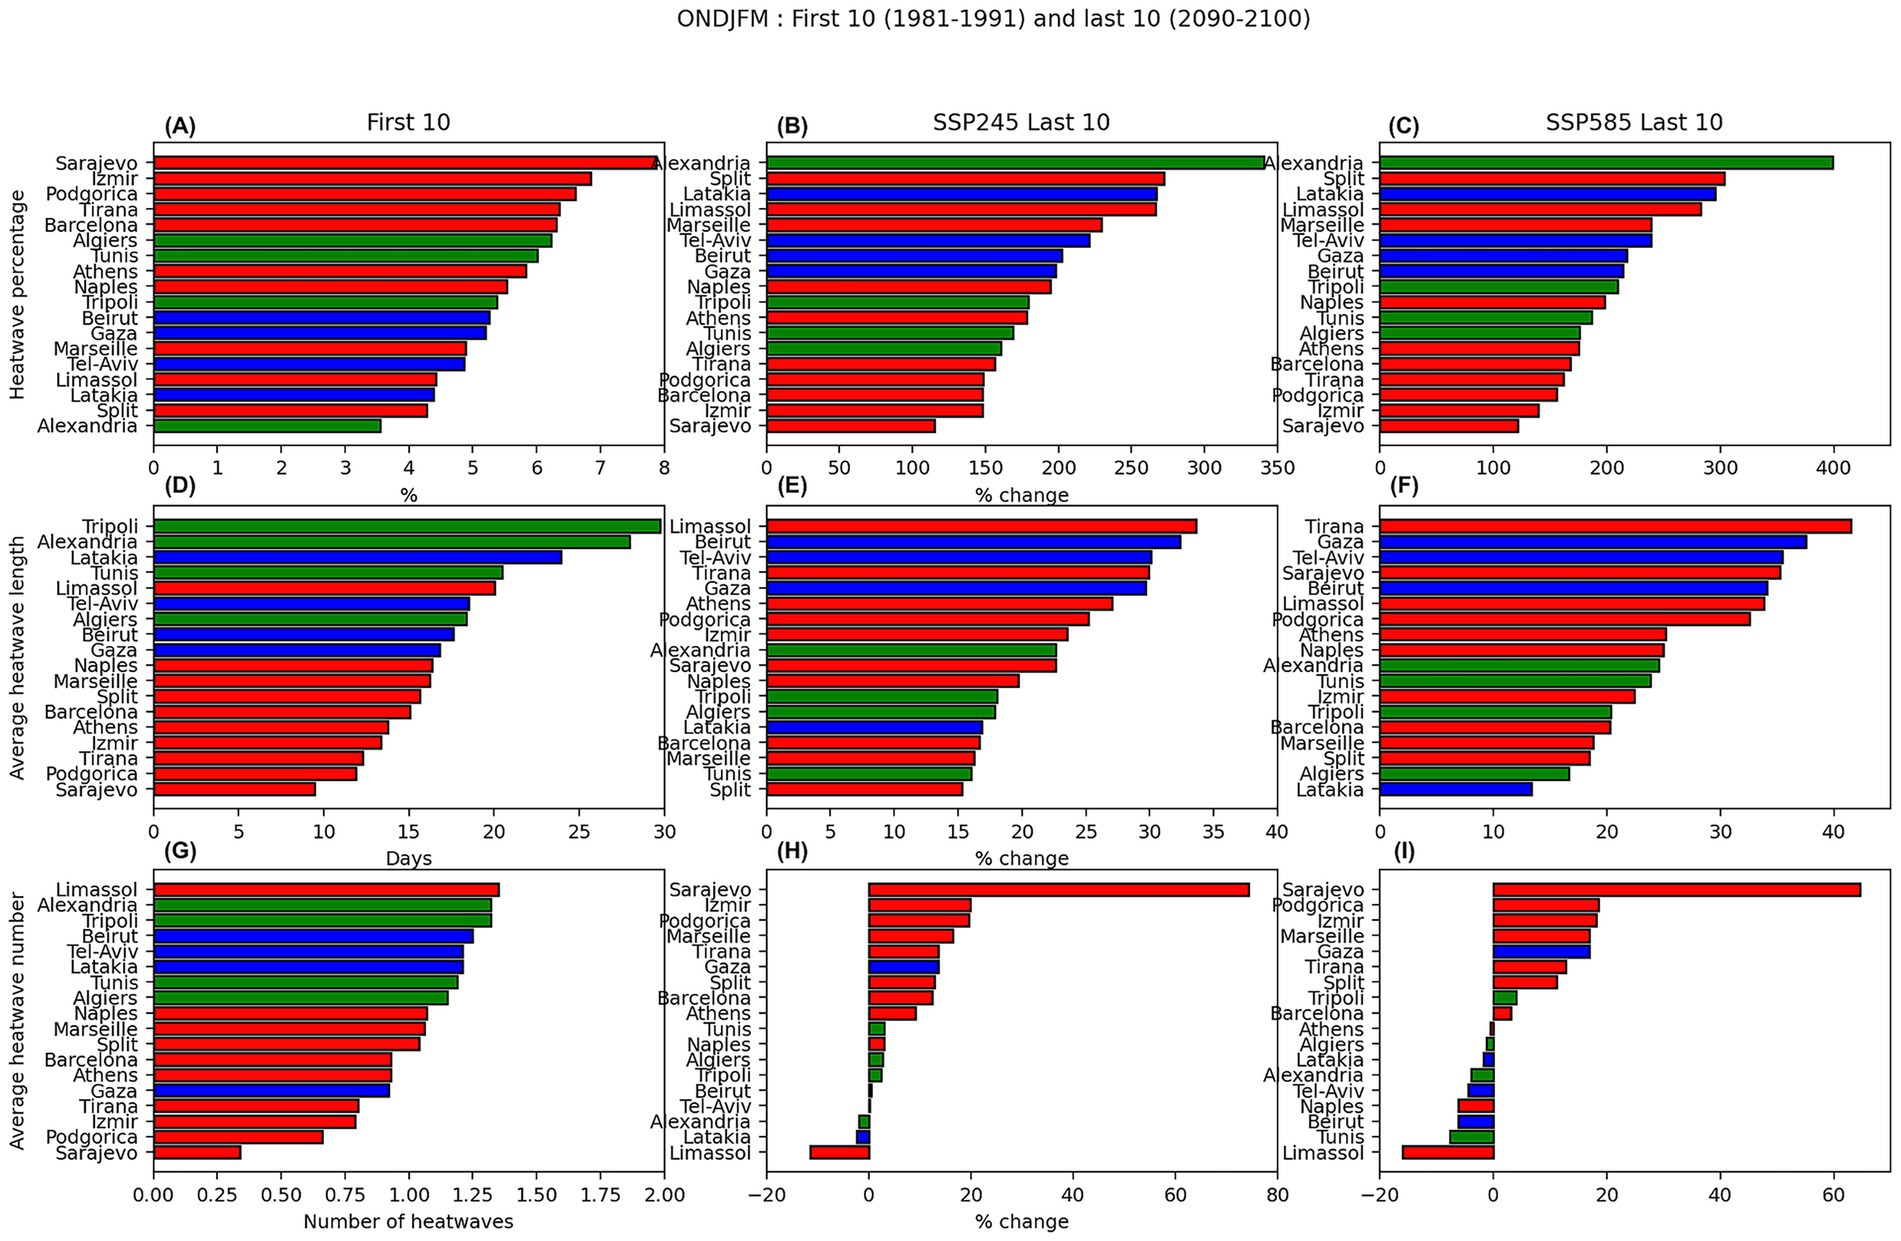
Figure 9. The changes in air-temperature for ONDJFM for each of the coastal cities for (A–C) heatwave percentage, (D–F) average heatwave length, and (G–I) average number of heatwaves. The first column (A,D,G) shows the results for the first 10 years, the second column (B,E,H) shows the percentage change from the first column to the last 10 years of SSP2-4.5, and the last column (C,F,I) show the percentage from the first column to the last 10 years of SSP5-8.5. The European cities are shown in red, the Middle Eastern cities are shown in blue, and the North African cities are shown in green.
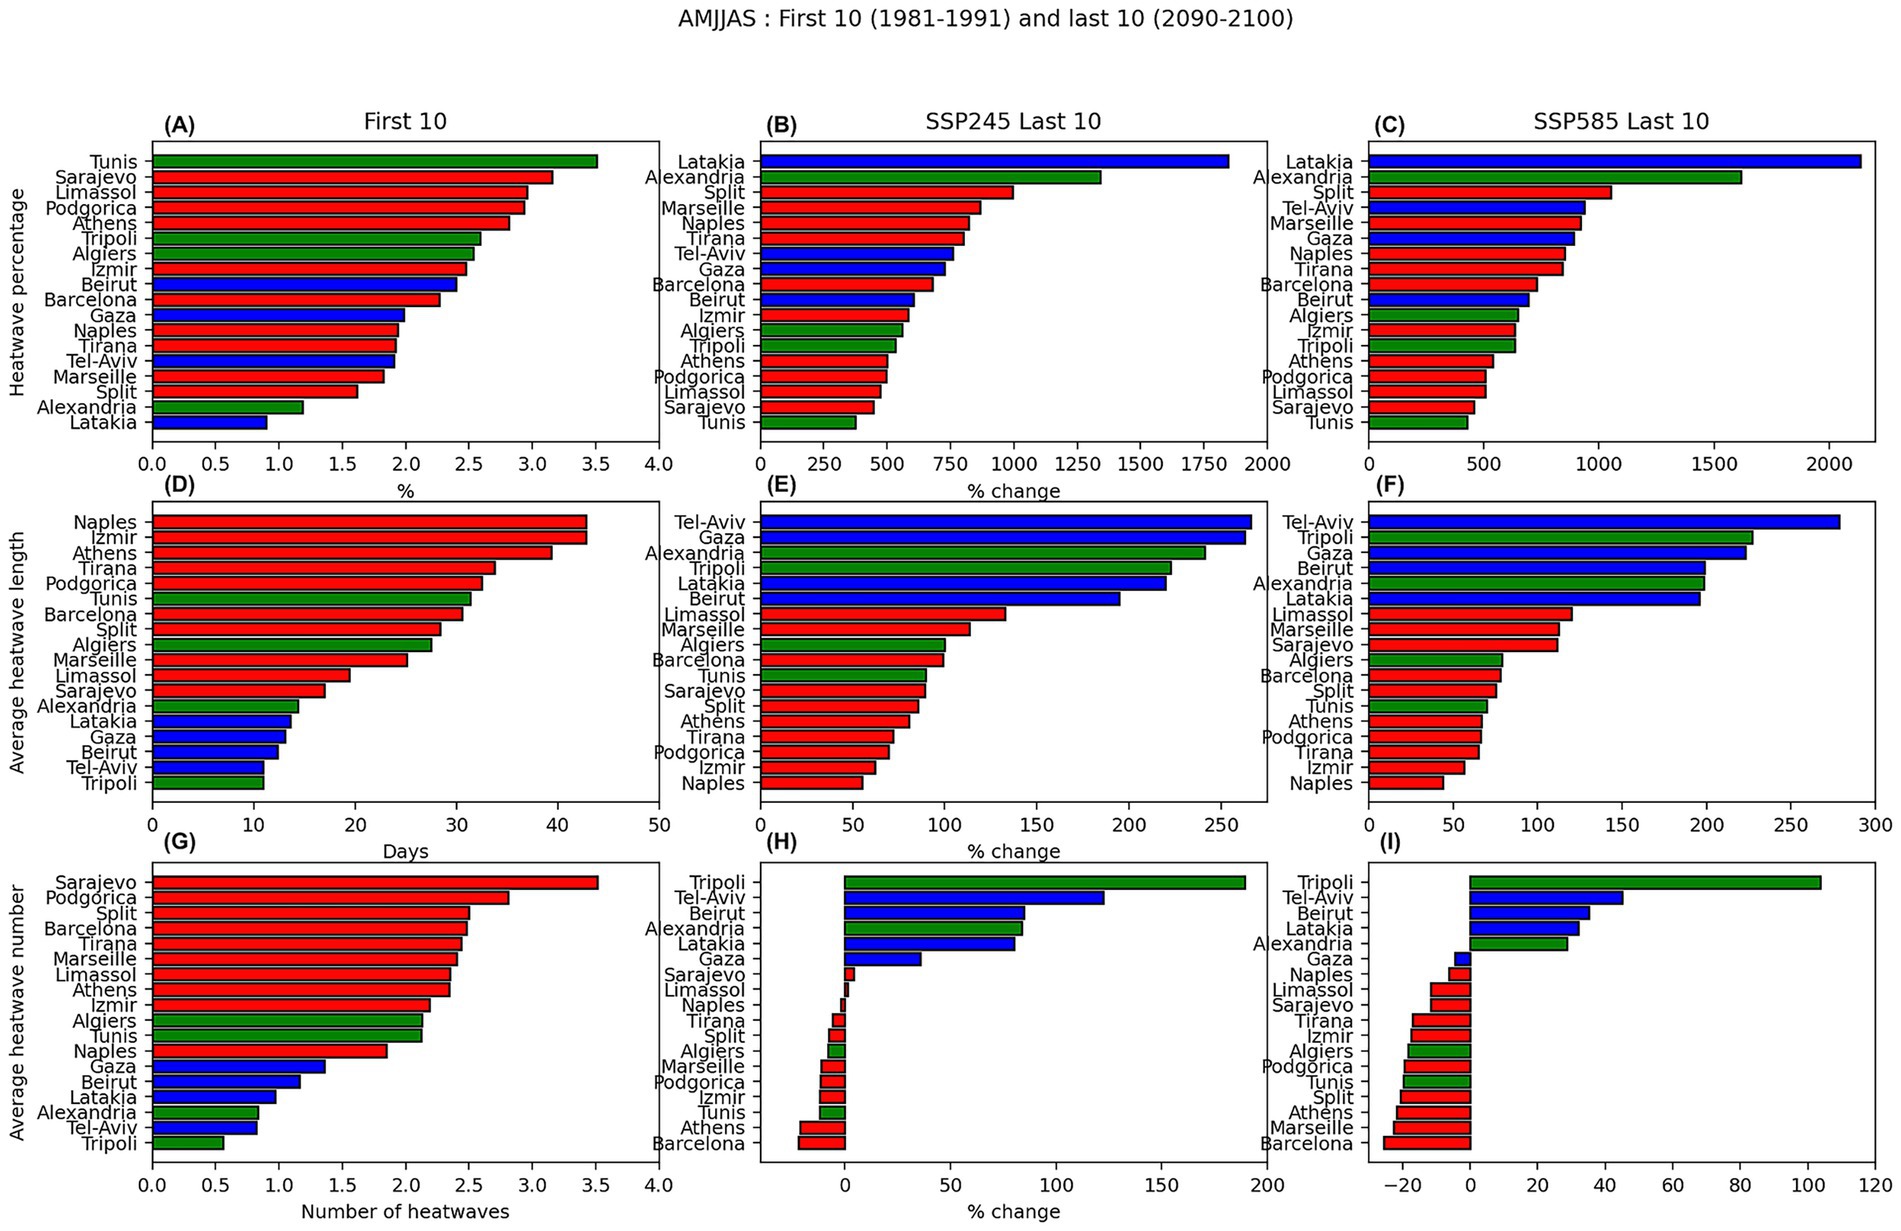
Figure 10. The changes in air-temperature for AMJJAS for each of the coastal cities for (A–C) heatwave percentage, (D–F) average heatwave length, and (G–I) average number of heatwaves. The first column (A,D,G) shows the results for the first 10 years, the second column (B,E,H) shows the percentage change from the first column to the last 10 years of SSP2-4.5, and the last column (C,F,I) show the percentage from the first column to the last 10 years of SSP5-8.5. The European cities are shown in red, the Middle Eastern cities are shown in blue, and the North African cities are shown in green.
3.2.1 Droughts
3.2.1.1 Wet season (ONDJFM)
The following two figures show the drought results for the wet season (ONDJFM; Figure 7) and dry season (AMJJAS; Figure 8) for the 18 coastal cities selected throughout the Mediterranean for Europe (red), the Middle East (blue), and North Africa (green). Beginning with the first 10 years of the historical data (1981–1991) the top three cities that experience the highest percentage of days in a drought are in Europe (Athens, Marseille, and Barcelona), with 65% of the days of the wet season experiencing less than 0.1 mm/day of rainfall (Figure 7A). The bottom three cities (Sarajevo, Beirut, and Podgorica) experience slightly less than 50% of days that have drought conditions. For SSP2-4.5 (Figure 7B), the cities that increase the most in percentage of days in a drought are located near one another in the Middle East (Beirut, Gaza, and Tel-Aviv), with a 3–4% increase in days in a drought. The top six cities undergoing an increase in drought at the end of the century are all located in the Middle East or North Africa region, whereas the bottom four cities that show a decrease in days in a drought are all located in Europe (Split, Izmir, Podgorica, and Sarajevo). Similar results are observed for SSP5-8.5 (Figure 7C) but on a stronger scale with the top cities being roughly the same (from the MENA) and Beirut experiencing the largest increase in percentage of days in a drought with a near 6% increase. The European cities once again experience the least change in percentage of days in a drought.
For the average length of consecutive drought (Figure 7D), Tel-Aviv and Gaza are the two cities with the longest average drought length during the wet season at 12 days long, however, the shortest drought length is just roughly 3 days shorter at 9 days in Sarajevo. For SSP2-4.5 (Figure 7E), 13 out of the 18 cities experience a decrease in the average length of drought at the end of the century with the largest change in percentage found in Gaza and Tel-Aviv with a 6% decrease. A similar result is shown for SSP5-8.5 (Figure 7F) with 11 out of the 18 cities showing a decrease in the average length of the drought, but with Tripoli showing a 3% increase, up from 1% shown in SSP2-4.5.
Lastly, the average number of droughts per wet season (ONDJFM) is shown with the first 10 years of the historical data (Figure 7G) similar to what was shown for the percentage of days in a drought (Figure 7A) in terms of city order. The top four cities are from Europe (Athens, Marseille, Barcelona, and Limassol) with 4–6 droughts of at least seven consecutive days occurring in the ONDJFM season and Beirut experiencing the least with only two. For SSP2-4.5 (Figure 7H), the cities undergoing the largest increase (10%) in the number of droughts per season are from the MENA, including Gaza and Tel-Aviv that underwent the biggest decrease in length of drought (Figure 7E). The cities experiencing the biggest decrease (10%) in the number of droughts per wet season (ONDJFM) over the last 10 years are all located in Europe (Izmir, Podgorica, Naples, Split, and Sarajevo). Again, a similar result is shown for SSP5-8.5 (Figure 7I) but on a larger scale (15%) with the MENA cities showing the largest increase and the European cities showing the largest decrease.
3.2.1.2 Dry season (AMJJAS)
For the dry season (AMJJAS; Figure 8), a much different result is shown expectedly as it is normal for many of the cities, especially those in the MENA, to experience drought conditions on a daily basis. The percentage of days in drought during the first 10 years of the historical time-period (Figure 8A) ranges from 45 to 95% with the cities located in the eastern Mediterranean experiencing the most drought compared to the western Mediterranean. Gaza, Alexandria, and Tel-Aviv have the highest percentage of days in a drought at 95% and Sarajevo has the lowest at 45%. Over the last 10 years of the century for SSP2-4.5 (Figure 8B), every city experiences an increase in percentage of days in a drought except for Marseille, which experiences an insignificant negative change (nearly 0%). Naples experiences the largest change at 4%. SSP5-8.5 (Figure 8C), every city has an increase in percentage of days in drought with Naples once again having the highest at 7% and seven of the top eight cities being in Europe.
For the average length of consecutive drought (Figure 8D), the top four cities are located in the MENA in the eastern Mediterranean and have an average drought length of 25–30 consecutive days with less than 0.1 mm/day of rainfall. The bottom seven cities are all European cities that have an average drought length of roughly 10 days. Three of the top four cities from first 10 years of the historical data also experience the greatest increase in the average length of drought with a 60–90% increase found in Gaza, Tel-Aviv, and Alexandria while the rest of the cities experience less than 20% change. For SSP5-8.5 (Figure 8F), a similar result is seen as most of the cities considered are expected to have an increase in the number of dry days. Beirut, which had the longest length of drought for the first 10 years (over 30 days), is the only city to show a decrease in length of drought by the last 10 years for both SSP2-4.5 and SSP5-8.5.
The average number of droughts per dry season (AMJJAS) ranges between 2 and 7 droughts of at least seven consecutive days with Marseille having the most and Gaza having the least for the first 10 years of the historical data (Figure 8G). For SSP2-4.5 (Figure 8H), the MENA cities show the largest increase in number of droughts per season with Alexandria having a 10% increase. The cities showing the smallest change in number of droughts are found in Europe with Marseille having a 5% decrease. For SSP5-8.5 (Figure 8I), however, it is the European cities that show the greatest increase in number of droughts per dry season with Sarajevo showing a 10% increase. For both SSP2-4.5 (Figure 8H) and SSP5-8.5 (Figure 8I), slightly more than half of the cities (10) show a positive change and slightly less than half (8) show a negative change.
Comparing the wet season (ONDJFM, Figure 7) to the dry season (AMJJAS, Figure 8), there are a few things to note. The first is that during the wet season there is both positive and negative change observed for the drought variables from the first 10 years to the last 10 years, whereas for the dry season, overall, there is mostly a strong positive change observed due to the effect of increased forcing. Additionally, there is a bit of a flipped response observed between the two seasons with the MENA cities and the European cities switching places as the seasons change, as the MENA cities experiencing the largest increase in drought during the wet season and the European cities experiencing the largest increase in drought during the dry season.
3.2.2 Heatwaves
3.2.2.1 Wet season (ONDJFM)
The next two figures show the heatwave results for the wet season (ONDJFM; Figure 9) and the dry season (ONDJFM; Figure 10) for the 18 Mediterranean cities selected. The percentage of days in a heatwave for the first 10 years of the historical data (Figure 9A) show that the overall, European cities have the highest percentage of days in a heatwave, however all 18 cities range from 3–8% showing there is not much of a difference between them. For the last 10 years of both SSP2-4.5 (Figure 9B) and SSP5-8.5 (Figure 9C), the change in the percentage of days in a heatwave for ONDJFM is inverse of what was seen in the first 10 years with the biggest change seen among the MENA cities overall (100–450% increase) with Alexandria seeing an increase in over 350% and the European cities experiencing the smallest change between (100–200%). There is no negative change in percentage of days in a heatwave from the first 10 years to the last 10 years as well.
For the average length of heatwave in the Mediterranean for ONDJFM (Figure 9D), all the MENA cities have the longest heatwave length, between 15 and 30 days long and the European cities have the shortest (with the exception of Limassol) with heatwaves lasting between 10–15 days. Over the last 10 years, there is not much difference between SSP2-4.5 (Figure 9E) and SSP5-8.5 (Figure 9F) as all 18 cities range between roughly 14–45%. The order of the cities, however, differs between the two with Limassol showing the largest change (~35%) and Split showing the smallest change (15%) in SSP2-4.5 (Figure 9E), and Tirana (45%) and Latakia (13%) for SSP5-8.5 (Figure 9F). For both SSP2.4–5 and SSP5-8.5, the North African cities can be found in the lower half of the 18 cities overall.
For the average number of heatwaves in ONDJFM (Figure 9G), a similar pattern to what was seen for the average length of heatwaves (Figure 9D) is observed. The cities experiencing the highest number of heatwaves are located in the MENA with the exception of the top city, Limassol, and the cities experiencing the least are in Europe. For the wet season in the Mediterranean, there is not a large range among the 18 cities, as all range from 0.25–1.50 heatwaves over the first 10 years, with again, the most in Limassol and the least in Sarajevo. For SSP2-4.5 (Figure 9E) and SSP5-8.5 (Figure 9F), the order of the cities is essentially inversed from the first 10 years with Sarajevo experiencing the largest change (over 60%) and Limassol undergoing the smallest change (−15%). Inverse from the first 10 years, most of the European cities show the largest change and most of the MENA cities show the smallest change. For the average number of heatwaves, there is a negative change observed in three cities in SSP2-4.5 and nine cities (half of the 18 considered) in SSP5-8.5, indicating that over the last 10 years some of the Mediterranean cities (mostly in the MENA region) can expect a decrease in the number of heat waves over the wet season (ONDJFM).
3.2.2.2 Dry season (AMJJAS)
The dry season (AMJJAS) for heatwaves (Figure 10) shows no clear pattern for the first 10 years of the historical data with the European and MENA cities in no particular order. The percentage of days in a heatwave (Figure 10A) range between 1 and 4%, with Tunis and Latakia having the highest and lowest percentage of days in a heatwave. Like what was observed for the wet season, there is little difference between SSP2-4.5 (Figure 10B) and SSP5-8.5 (Figure 10C) with a similar order of cities (both Latakia and Tunis having the largest and smallest change, opposite to the first 10 years) and a similar scale of change (250–2000%).
The average heatwave length for the dry season for the first 10 years of the historical data (Figure 10D) differentiates significantly between the 18 cities with a range found between 10 and 50 days. For the most part, the European cities are experiencing the longest heatwave with Naples and Izmir experiencing the longest at roughly 50 days, and Tripoli the shortest at roughly 10 days long. For the last 10 years of both SSP2-4.5 (Figure 10E) and SSP5-8.5, an increase between 50 and 250% is found with the largest and smallest changes found in Tel-Aviv and Naples. In both scenarios, the cities that experience the largest change in length of heatwave from the first 10 years to the last 10 years in SSP2-4.5 and SSP5-8.5 are found in the MENA region and the cities that experience the smallest change in the length of heatwave are found in Europe.
The number of heatwaves found in the dry season (< 4 heatwaves; Figure 10G), is roughly double than what was found for the wet season (2 heatwaves; Figure 9G). Similarly to what was shown previously with the length of heatwaves (Figure 9D), the European cities have more heatwaves than the MENA cities over this time-period (with Sarajevo having the most and Tripoli having the least). And once more, the cities experiencing the greatest change for SSP2-4.5 (Figure 10H) and SSP5-8.5 (Figure 10I) are inversely correlated to what was shown for the first 10 years (Figure 10G) with the MENA cities experiencing the greatest change (Tripoli, the most) and the European cities the smallest (Barcelona, the least). Differing from the wet season, however, is the scale of change observed during the dry season where a change between −20–200% is found for SSP2-4.5 (Figure 10H) and a change of between −20-120% is found for SSP5-8.5 (Figure 10I). Over half of the cities experience a negative change in the number of heatwaves, with 10 cities in SSP2-4.5 and 13 in SSP5-8.5, with the majority of them being cities in Europe, suggesting that the European cities can expect a decrease in the number of heatwaves per season going into the future and the MENA cities can expect an increase in number of heatwaves coinciding with an increase in the length of heatwaves as well.
Comparing the wet season (ONDJFM; Figure 9) to the dry season (AMJJAS; Figure 10), the wet season tends to lack a significant pattern for the order of the cities whereas the dry season clearly shows the European cities with the largest values and the MENA cities experiencing the largest change for each variable. Additionally, the dry season has a significantly larger scale for both the first 10 years as well as the change from the last 10 years, especially for the heatwave percentage where it increases by nearly a magnitude. The cities experiencing the most and least number of changes between the two seasons differs as well, highlighting the importance of the seasonality.
3.3 Regional changes
Lastly, the multi-model mean regional changes over time for the droughts and heatwaves are shown in the next four figures (Figures 11–14) for the wet season (ONDJFM) and dry season (AMJJAS) for just SSP5-8.5, to highlight the extreme changes expected over the century. The multi-city means are shown for Europe (red), the Middle East (blue), and North Africa (green). The range of the model trend is shown in the box and whisker plot for the corresponding region with the minimum, first quartile, median (orange line), mean (white dot), third quartile, and maximum trend among the 10 models.
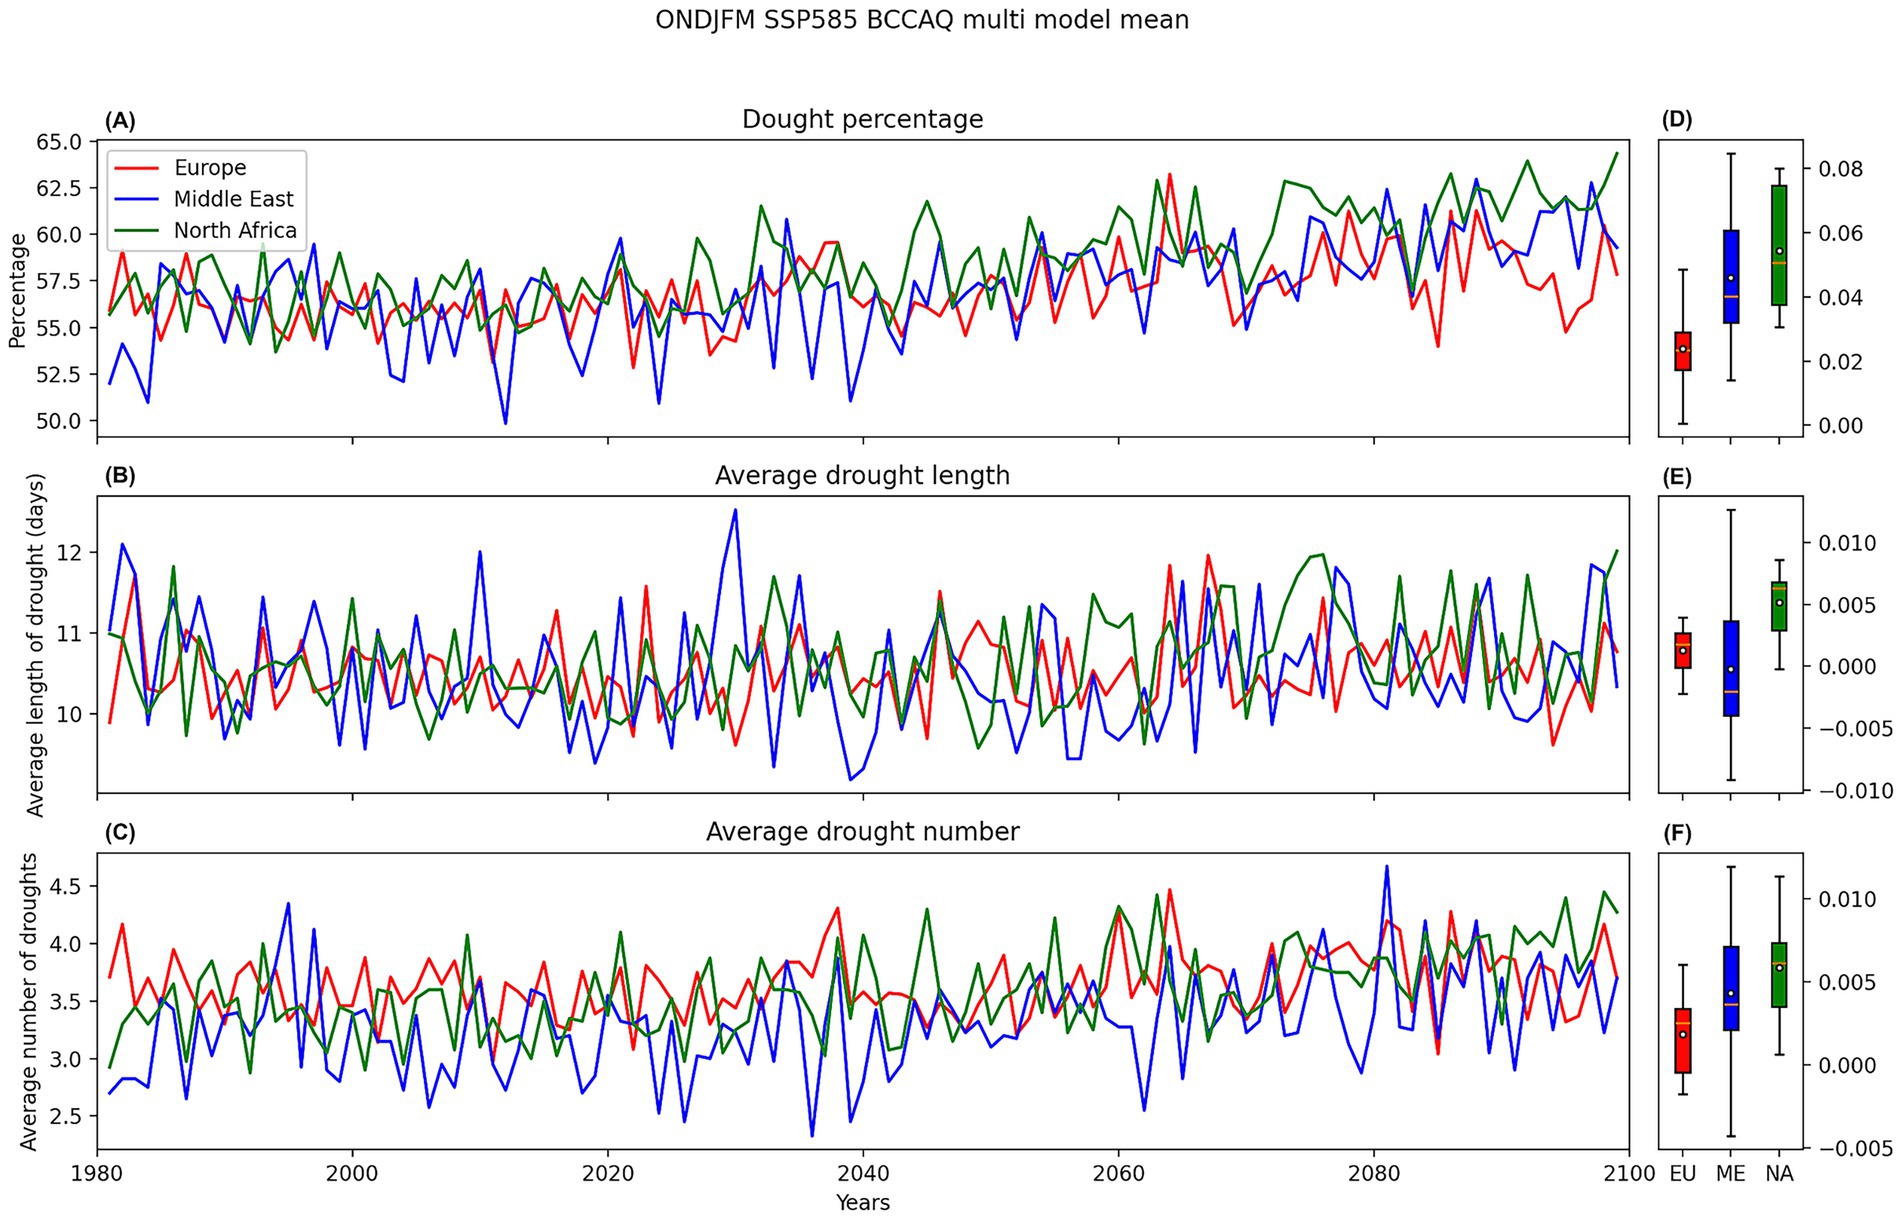
Figure 11. The regional change of precipitation for ONDJFM for (A) drought percentage, (B) average drought length, and (C) average number of droughts for the entire time period of SSP5-8.5. The average of the European cities is shown in red, the Middle Eastern cities in blue, and the North African cities in green. (D–F) The range of trends for the models are shown for the minimum, first quartile, median (orange line), mean (white dot), third quartile, and maximum trend values.
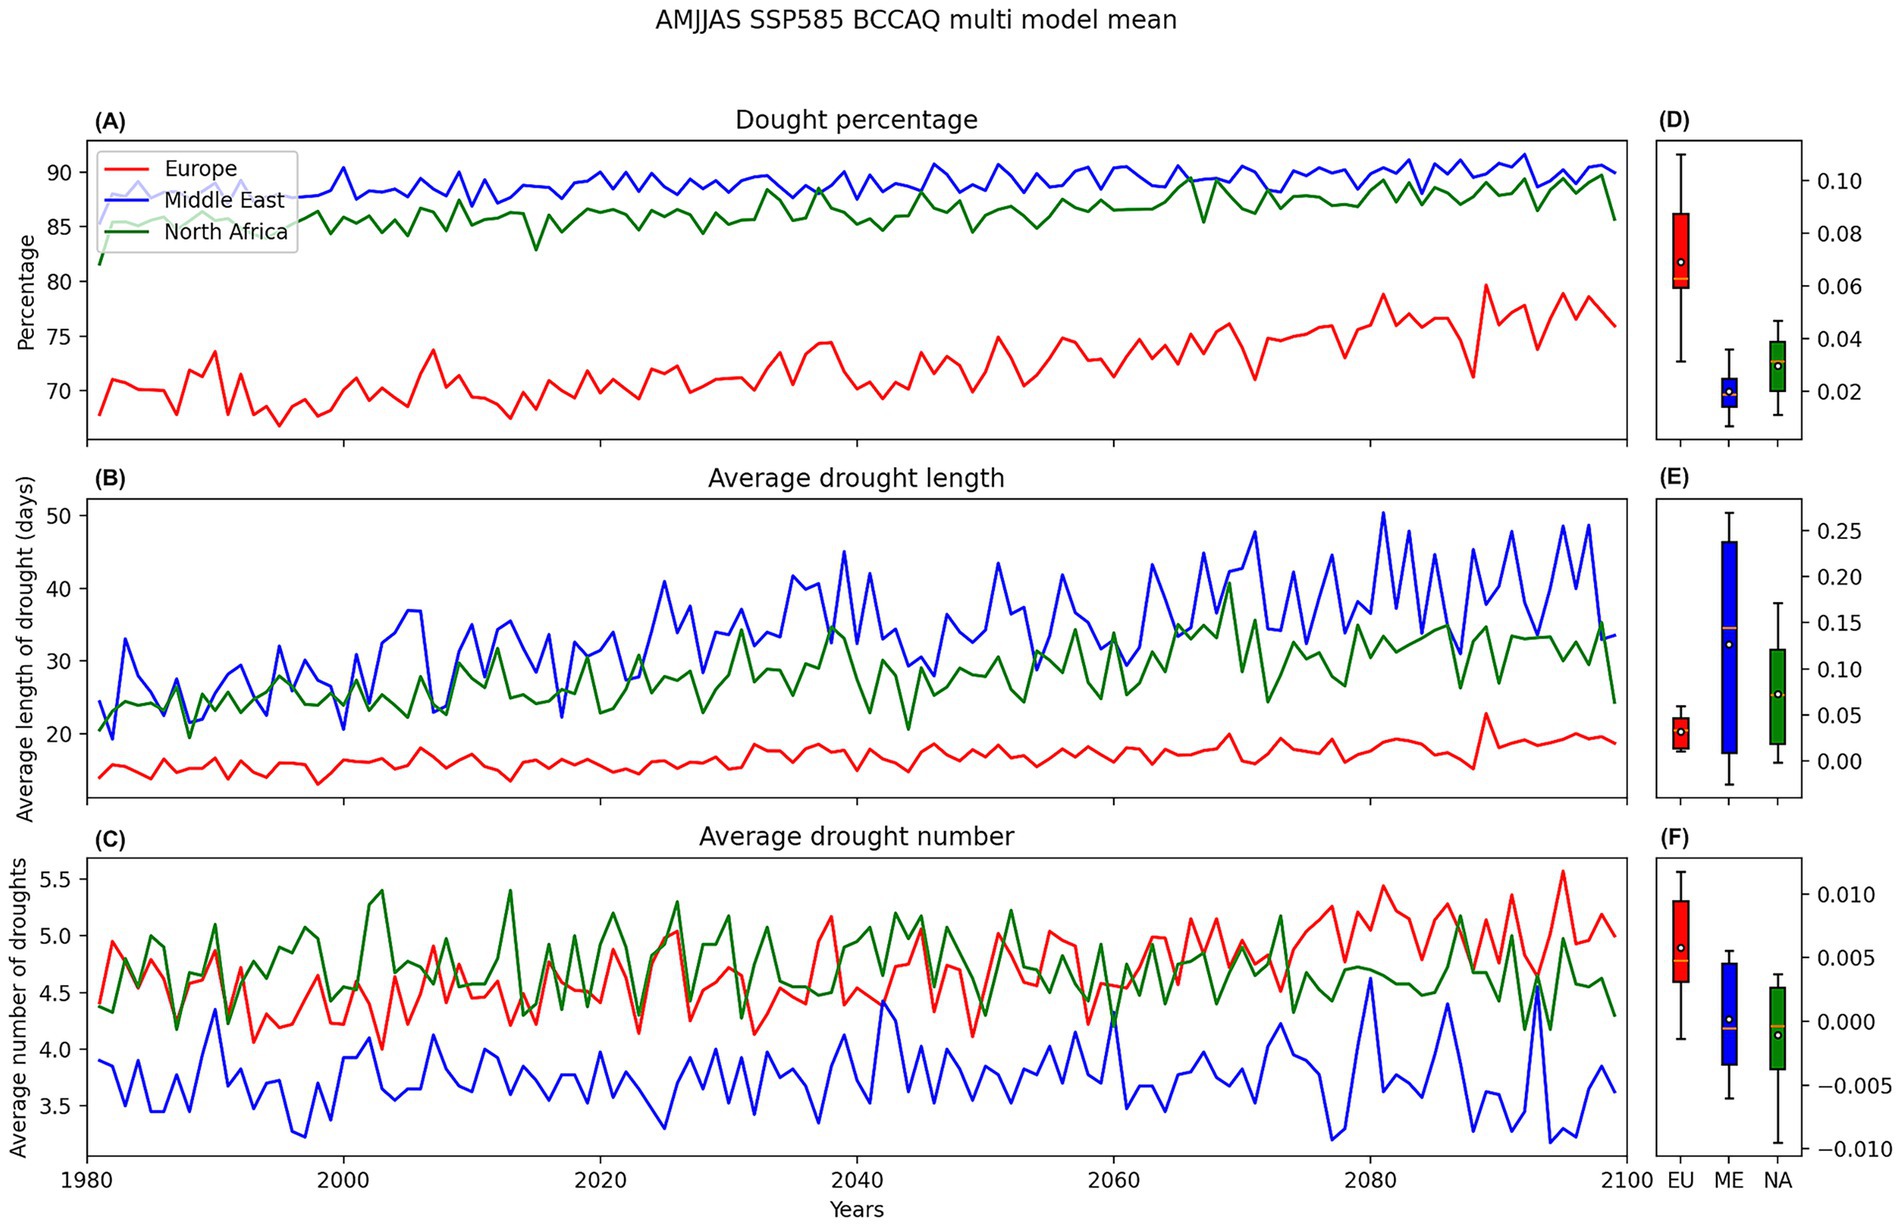
Figure 12. The regional change of precipitation for AMJJAS for (A) drought percentage, (B) average drought length, and (C) average number of droughts for the entire time period of SSP5-8.5. The average of the European cities is shown in red, the Middle Eastern cities in blue, and the North African cities in green. (D–F) The range of trends for the models are shown for the minimum, first quartile, median (orange line), mean (white dot), third quartile, and maximum trend values.
Figure 13. The regional change of air-temperature for ONDJFM for (A) heatwave percentage, (B) average heatwave length, and (C) average number of heatwaves for the entire time period of SSP5-8.5. The average of the European cities is shown in red, the Middle Eastern cities in blue, and the North African cities in green. (D–F) The range of trends for the models are shown for the minimum, first quartile, median (orange line), mean (white dot), third quartile, and maximum trend values.
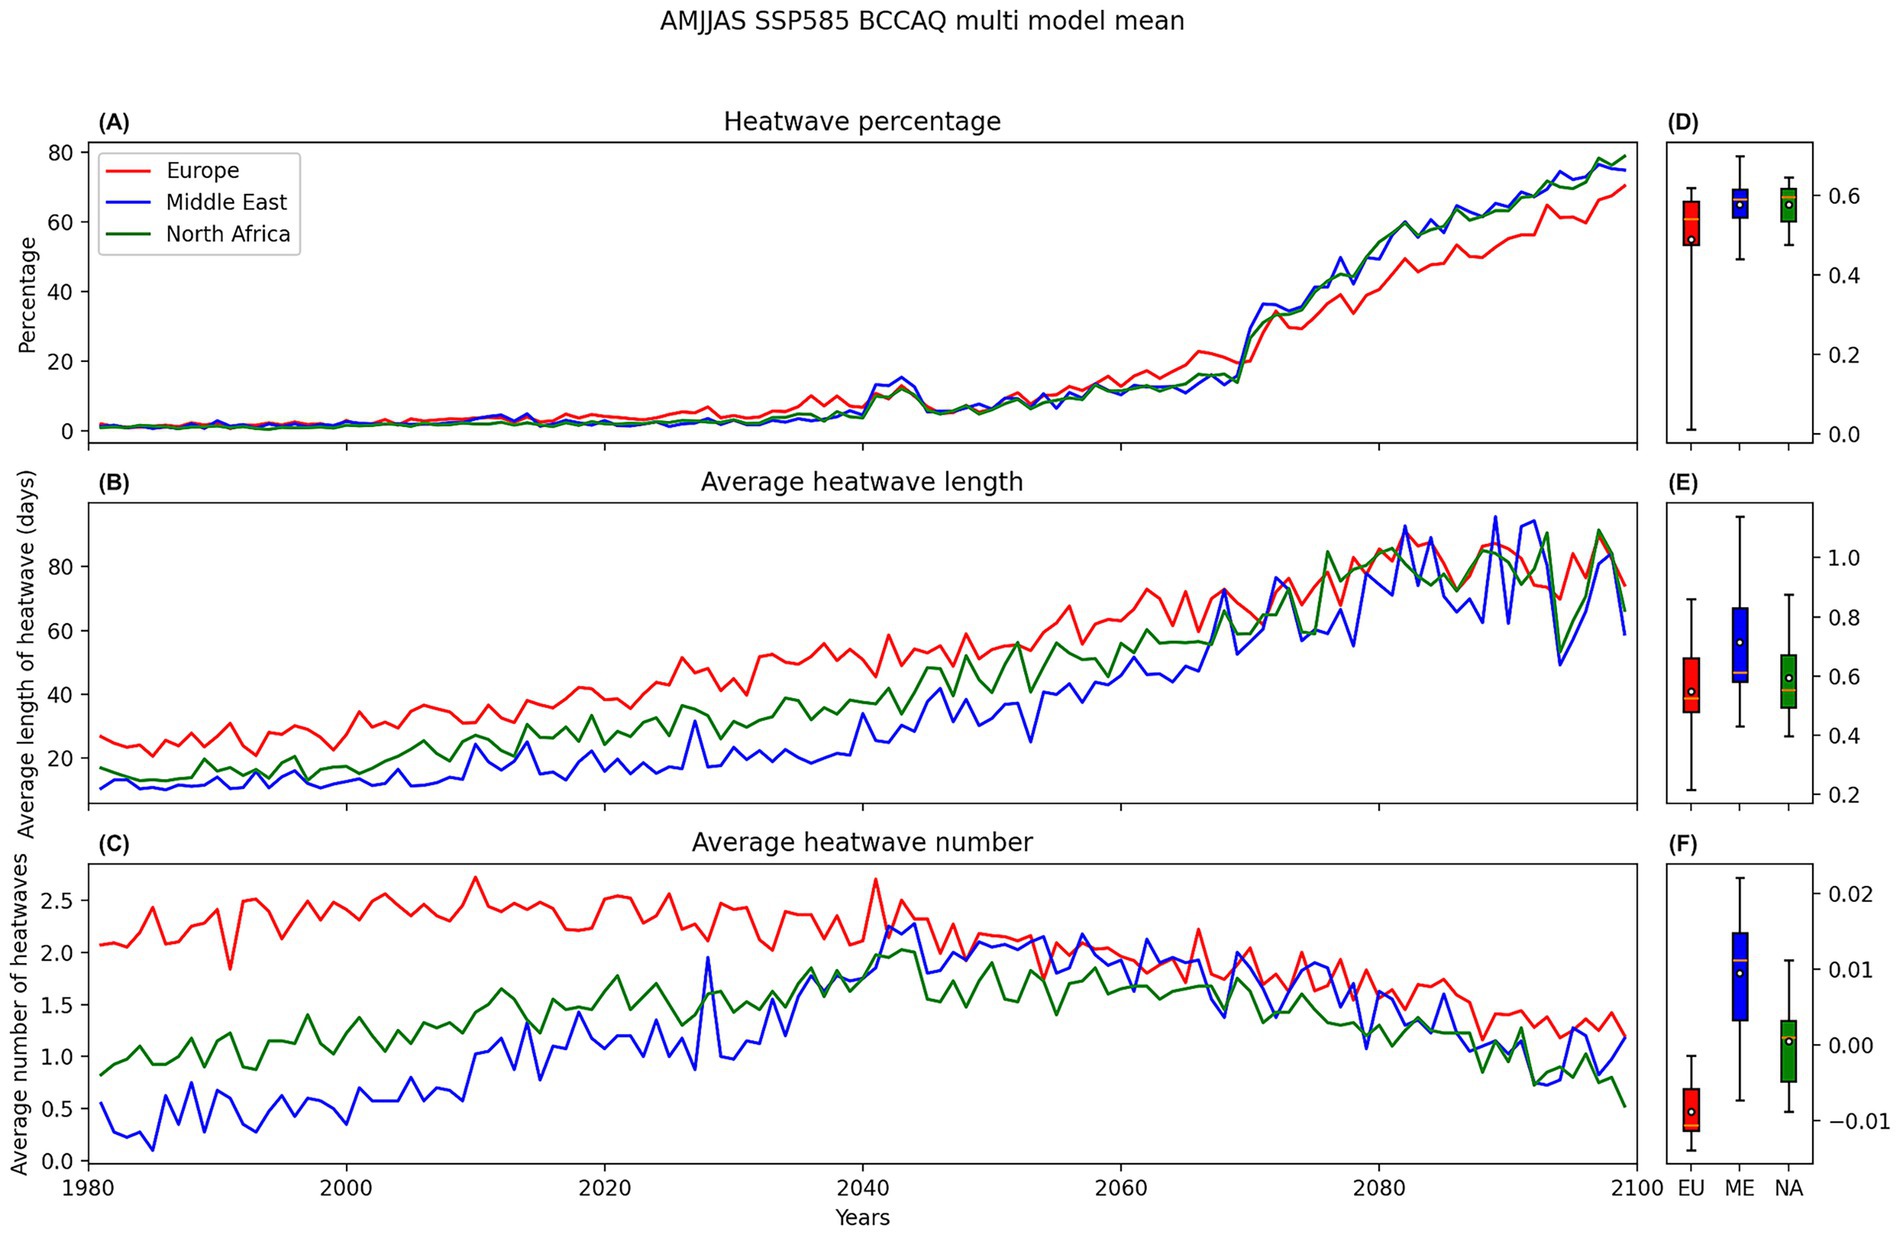
Figure 14. The regional change of air-temperature for AMJJAS for (A) heatwave percentage, (B) average heatwave length, and (C) average number of heatwaves for the entire time period of SSP5-8.5. The average of the European cities is shown in red, the Middle Eastern cities in blue, and the North African cities in green. (D–F) The range of trends for the models are shown for the minimum, first quartile, median (orange line), mean (white dot), third quartile, and maximum trend values.
3.3.1 Droughts
The percentage of days in a drought for the wet season (ONDJFM; Figure 11A) does not vary substantially across the three regions as they all follow similar patterns. However, by the mid-century, there is a slight increase observed until the tail-end of the century. The three regions begin with roughly 55% of the days experiencing drought conditions and increase to end with roughly 60% of the days in drought conditions. The multi-model mean of the trend (Figure 11B) is found to be positive for each region with North Africa (green) having the largest value, followed by the Middle East (blue), and lastly Europe (red). The region with the largest range in trend across all the models is the Middle East and the region with the smallest is Europe although similar to the range for North Africa. For the average length of consecutive drought (Figure 11C), however, there is no clear change in pattern observed nor is there much of a difference between the three regions for the wet season as the average length of drought is about 11 days throughout the entire time-period. The multi-model mean of the trend (Figure 11D) is found to have positive and negative values with North Africa once again having the largest value, followed by Europe and then the Middle East. Similar to before, the Middle East once again has the largest range in model trend values, whereas Europe has the smallest. All three regions have mean trends close to zero as there is a lot of noise in the timeseries showing the change in length of drought over time. Lastly, for the average number of droughts (Figure 11E), a slight increase is once again observed from the mid-century to the end of the century, similar to what was seen for the percentage of days in a drought (Figure 11A). The number of droughts per wet season increases just slightly from about 3.5 to 4 droughts. Again, similar to what was shown previously with the model trends, North Africa has the largest multi-model mean (Figure 11F), followed by the Middle East, and then the Europe, but as mentioned previously, the values are close to zero due to the noise from the timeseries. And once more, the Middle East has the largest range of trends across the three and Europe the smallest. There are both positive and negative trend values found showing the large model uncertainty, especially with respect the Middle Eastern cities.
The drought results for the dry season (Figure 12), however, changes drastically compared to the wet season (Figure 11). The percentage of days in a drought for AMJJAS (Figure 12A) show the MENA region following a similar stable timeseries centered near 85%, whereas the European region shows a slight increase in the mid-century as the percentage of days in a drought increases from 70 to 75%, suggesting that the external forcing will have a larger impact on the European region than the MENA region during the dry season. The trend for the models (Figure 12B) also differentiates from the wet season to the dry season as Europe has the largest trend, followed by North Africa, and then the Middle East. Europe also has the largest range of values, and the Middle East has the smallest, inverse of what was seen previously. As for the average length of drought (Figure 12C), again the MENA has a longer drought length than the European region by nearly double (30 days compared to 15). But this time, it is the MENA region that shows a slight increase at the end of the century for the average length of drought. The Middle East shows the strongest multi-model mean trend as well as the largest range in trend values across all the models (Figure 12D). And Europe shows both the smallest trend and smallest range in values in the models. For the average number of droughts in the dry season (Figure 12E), Europe once again shows a slight increase at the end of the century with a small increase from 4.5 droughts to 5 over the entire time-period. And rather than the MENA region converging on a similar pattern and scale as previously shown, North Africa and Europe region do while the Middle East shows the lowest number of droughts over the entire time-period. The range of the trends (Figure 12F) for the average number of droughts shows Europe having the largest multi-model mean trend value, followed by the Middle East and then North Africa. All three regions have a similar range in trend values across all the models.
3.3.2 Heatwaves
For the percentage of days in heatwave during ONDJFM (Figure 13A), all the regions follow similar values as they steadily increase over the entire time-period from roughly 5 to 60% by the end of the century, with a strong increase in the trend starting around year 2060. All three regions show similar values for the multi-model mean trend values (Figure 13B), with all having a large range in values as well across the models, although North Africa has the smallest range among the three regions. It is interesting to note, that despite the large range in trend, the range from the first quartile to the third quartile is very small. For the average length of the heatwave (Figure 13C), all three regions follow similar patterns and steadily double in value from the beginning of the time-period to the end of the century. North Africa and the Middle East begin at roughly 20-day long heatwaves and end at nearly 40 days, whereas Europe beginning at 12 days, ends the century near 20-day long heatwaves. This means that the regions are experiencing at least 20 consecutive days where the temperature is greater than one standard deviation. The similar pattern for North Africa and the Middle East is shown again with regards to the multi-model mean trend (Figure 13D) as they both have similar values and a similar range of values across the models. The trend for Europe is much smaller however, as is the range of values. Lastly, for the number of heatwaves that last at least 7 days in the wet season (Figure 13E), all three regions follow a similar pattern to what was seen for the average length of heatwave (Figure 13C), with North Africa and the Middle East having similar values to each other and Europe having slightly less values. The values across all three regions are small as they are less than two heatwaves for the entire time-period. The values of the trends (Figure 13F) show the inverse for what was seen for the average length of heatwave (Figure 13D) with Europe having the largest multi-model mean value and the largest range of values, and North Africa having the smallest mean and range of values.
The results for the dry season (AMJJAS, Figure 14) differ from the wet season with the exception of the percentage of days in a heatwave. For the percentage of days in a heatwave for the dry season (Figure 14A), the results are similar for what was seen for the wet season with all three regions increasing from roughly 5–80%, with a sharp increase found slightly after 2060. The multi-model mean trends (Figure 14B) across all three regions are similar as well, but Europe has a large range in the trends across the models that is not seen in North Africa or the Middle East. The average length of the heatwaves during the AMJJAS season (Figure 14C) shows Europe having the largest values (roughly 30 days) at the beginning of the time-period and the Middle East and North Africa having smaller values (less than 20 days). All three regions steadily increase with time and end with values close to 70 days. As for the trends (Figure 14D), the Middle East has the largest multi-model mean trend value and the largest range in values. The difference in trend values between Europe and North Africa is small. Lastly, for the number of heatwaves in the dry season (Figure 14E), Europe begins with the largest values (roughly 2 heatwaves per season) and stays steady until about year 2040 where the values then slowly decline (to roughly 1 heatwave per season). The Middle East and North Africa, however, begin with less heatwaves (less than one), slowly increase until year 2040 (reaching 2 heatwaves per season on average), and then following a similar pattern to what was seen for Europe, steadily decline over the tail-end of the century to roughly one heatwave per season. The decrease observed over the tail-end of the century is likely due to the increase in length of heatwave seen previously (Figure 14C) as the heatwaves reach values close to 70 days long, it is unlikely to have multiple heatwaves averaging 70 days in a season. The Middle East once again has the largest multi-model mean trend value (Figure 14F) as well as the largest range of values across the models. Europe has the smallest, and the only negative trend value as it is the only region that ends with less heatwaves at the end of the century than it began with at the beginning of the time-period. It also has the smallest range in trend values. North Africa, since it began with roughly one heatwave and ended with roughly one heatwave has a multi-mean trend value close to zero.
4 Discussion
Precipitation and air-temperature data from 10 CMIP6 global climate models are downscaled to a higher resolution to create the BCCAQ dataset that is used in this study to evaluate drought and heatwave conditions in the Mediterranean region. Two external forcing scenarios, SSP2-4.5 (low-emissions) and SSP5-8.5 (high-emissions), are considered to provide a range of results for the future projection in the region. The data is split into two seasons, a wet season (ONDJFM), and a dry season (AMJJAS), due to the large variability identified in previous studies as well as the difference in the physical phenomena observed in the region during these seasons. Drought and heatwave conditions are examined across the Mediterranean region as a whole as well as in 18 of the largest coastal cities in the region. The aim of this study is to provide an assessment of the impact anthropogenic climate change will have on the Mediterranean and how that will impact urban environments. Especially in countries that do not necessarily contribute a large amount to CO2 emissions but may feel the largest impacts globally because of the Mediterranean being a climate change hot spot as it warms at a rate higher than the rest of the world. The Mediterranean is expanded beyond what some previous studies have considered to include the Middle East and North Africa (MENA). This is also the first time the BCCAQ dataset will be used in the Mediterranean region to investigate droughts and heatwaves.
For the regional drought results, it is evident there is a larger impact on the region during SSP5-8.5 compared to SSP2-4.5 for both seasons, but especially for the dry season (AMJJAS) where a greater change is observed between the first 10 years (1981–1991) and the last 10 years (2090–2,100). Comparing the wet season to the dry season, there is a northward shift in the positive signal as most of the positive values are seen over the Mediterranean Sea in the wet season and over the northern Mediterranean and Europe in the dry season. For the heatwave results, SSP5-8.5 again shows a stronger response in the Mediterranean in both seasons as a result of the increased external forcing. Between the two seasons, the dry season shows a response greater than the one observed in the wet season by nearly 2–3 times. Additionally, there is a strong signal located over the Mediterranean Sea during the dry season that is not seen during the wet season. For the heatwave results, there is only positive change observed for both the percentage of days under heatwave conditions and for the length of heatwave, unlike the drought results, suggesting that into the future the entire region will be subjected to heatwave conditions. The negative values seen for the average number of heatwaves suggests that there will be less heatwaves per season due to the increase in length of heatwaves observed.
The results for droughts and heatwaves on the coastal cities again show that the emissions from SSP5-8.5 are going to have a more significant impact than SSP2-4.5. For drought conditions, the wet season shows strong variability of positive and negative change across the 18 cities, whereas overall for the dry season, there is mostly an intense positive change observed. During the wet season, the MENA cities experience the largest increase in drought going into the future and the European cities the least and the opposite is seen during the dry season with the European cities experiencing the largest change and MENA cities experiencing the smallest. For the heatwave results, there is a lack of a pattern observed during the wet season with regards to the order of the cities, whereas the dry season shows the MENA cities experiencing the largest change in the future and the European cities the smallest. Comparing the scale between the two seasons, however, the percentage change into the future for the dry season is significantly larger than what is observed for the wet season.
Lastly, the impact SSP5-8.5 has on the regional level (Europe, Middle East, and North Africa) is addressed for both drought and heatwave conditions during the wet and dry seasons. For the drought conditions during the wet season, there is little change observed between the three regions as there is strong variability seen. For the dry season, the scale is significantly larger and the MENA region converges on similar values while the European region tends to have smaller values. Across both seasons, however, there is a slight increase in drought conditions observed at the mid-century in all three regions. The heatwave conditions for the wet and dry season are similar for the percentage of change as the values across all three regions are the same and sharply increase toward the tail-end of the century. The dry season shows a slightly larger scale range. The average length of heatwave and average number of heatwaves for the wet season shows a minimal and slight increase in value from the beginning of the time-period to the end of the century. For the dry season, however, there is a large increase in the length of heatwave over time, and this coincides with a decrease in the number of heatwaves observed in a season over the second half of the century. The model uncertainty is also examined by looking at the trend in each model across all the variables and overall, there is a large range across all three regions with the Middle East showing the most substantial range in model trend.
Although this study is the first to use the BCCAQ dataset in the Mediterranean, the results found in this study agree with other studies of the Mediterranean region using CMIP6 models. Babaousmail et al. (2022) also use a bias-corrected CMIP6 dataset and find a reduction in precipitation levels and an increase in drying in the Mediterranean and Sahara region. Additionally, they find more extreme signals in SSP5-8.5 versus SSP2-4.5. Ayt Ougougdal et al. (2024) and Babaousmail et al. (2021) use CMIP6 to investigate the impact global emissions have on North Africa and similarly find a significant decrease in precipitation levels in the region. With regards to heatwaves in the Mediterranean region, most previous studies converge on a similar finding as this study does, with a significant increase in heatwaves and warming in the region. Additionally, an accelerated warming and increase in heatwaves into the future is found in the MENA and western Mediterranean region (Malik et al., 2024; Tejedor et al., 2024). These changes are consistent across the Euro-CORDEX regional climate model ensemble as well (Molina et al., 2020), emphasizing the robustness of the CMIP6 ensemble with regards to air-temperature data.
Understanding the impact anthropogenic climate change has on the future of the Mediterranean is important for many reasons as it influences socioeconomic situations in the region and because it is a region that relies heavily on rainfall for agricultural purposes. The increased risk of drought and heatwaves in the Mediterranean poses a large threat to food stability, water scarcity, and urbanization and tourism. This study provides a small assessment of the future climate situation in the region, and the results can be interpreted to understand the impact climate change will have on the area. It is important to note that because the region was assessed as a whole, rather than at each individual grid point, there is some sensitivity in the results. The first being the with criteria that defines the length of droughts and heatwaves (7 days) as changing this length would change the results obtained. Additionally, some areas rely on snowfall in addition to rainfall for water resources and this study only considers the rainfall data from the models used. Including snowfall would likely change the results, especially in the northern Mediterranean and mountainous regions. The range in the results across the models is significant as well and highlights the sensitivity both climate models and downscaled data can have when used on a regional scale. Tarín-Carrasco et al. (2025), using CMIP6 ensembles, conclude that the Mediterranean region continues to be one of the most sensitive regions globally, despite the substantial improvements to CMIP6 and these uncertainties must be taken into account going forward.
Data availability statement
The original contributions presented in the study are included in the article/supplementary material, further inquiries can be directed to the corresponding author.
Author contributions
HD: Formal analysis, Visualization, Data curation, Writing – original draft, Conceptualization, Investigation, Writing – review & editing, Validation, Methodology. BK: Supervision, Writing – review & editing, Methodology, Conceptualization, Resources, Funding acquisition, Project administration.
Funding
The author(s) declare that financial support was received for the research and/or publication of this article. The authors acknowledge support from NOAA (NA20OAR4320472, NA22OAR4310603, NA23OAR4590384 & NA23OAR4310457) and NSF (AGS2241538 & AGS2223263). BK is the William R Middelthon Chair of Earth Sciences and is grateful for the associated support.
Conflict of interest
The authors declare that the research was conducted in the absence of any commercial or financial relationships that could be construed as a potential conflict of interest.
Generative AI statement
The author(s) declare that no Gen AI was used in the creation of this manuscript.
Any alternative text (alt text) provided alongside figures in this article has been generated by Frontiers with the support of artificial intelligence and reasonable efforts have been made to ensure accuracy, including review by the authors wherever possible. If you identify any issues, please contact us.
Publisher’s note
All claims expressed in this article are solely those of the authors and do not necessarily represent those of their affiliated organizations, or those of the publisher, the editors and the reviewers. Any product that may be evaluated in this article, or claim that may be made by its manufacturer, is not guaranteed or endorsed by the publisher.
References
Ayt Ougougdal, H., Bounoua, L., Ech-chatir, L., and Yacoubi-Khebiza, M. (2024). Evaluation of the performance of CMIP6 models in simulating precipitation over Morocco. Mediterr. Geosci. Rev. 6, 145–158. doi: 10.1007/s42990-024-00121-x
Babaousmail, H., Hou, R., Ayugi, B., Ojara, M., Ngoma, H., Karim, R., et al. (2021). Evaluation of the performance of CMIP6 models in reproducing rainfall patterns over North Africa. Atmos. 12:475. doi: 10.3390/atmos12040475
Babaousmail, H., Hou, R., Ayugi, B., Sian, K. T. C. L. K., Ojara, M., Mumo, R., et al. (2022). Future changes in mean and extreme precipitation over the Mediterranean and Sahara regions using bias-corrected CMIP6 models. Int. J. Climatol. 42, 7280–7297. doi: 10.1002/joc.7644
Barlow, M., Zaitchik, B., Paz, S., Black, E., Evans, J., and Hoell, A. (2016). A review of drought in the Middle East and Southwest Asia. J. Clim. 29, 8547–8574. doi: 10.1175/JCLI-D-13-00692.1
Barros, V., Field, C., Dokken, D., Mastrandrea, M., Mach, K., and Bilir, T. Impacts, adaptation, and vulnerability. Part B: regional aspects. Contribution of working group II to the fifth assessment report of the intergovernmental panel on climate change, Tech. Rep. Available online at: https://www.ipcc.ch/site/assets/uploads/2018/02/WGIIAR5-PartB_FINAL.pdf (Accessed on February 2022, 2014) (2014).
Batibeniz, F., Ashfaq, M., Önol, B., Turuncoglu, U. U., Mehmood, S., and Evans, K. J. (2020). Identification of major moisture sources across the Mediterranean Basin. Clim. Dyn. 54, 4109–4127. doi: 10.1007/s00382-020-05224-3
Beck, H. E., Van Dijk, A. I., Larraondo, P. R., McVicar, T. R., Pan, M., Dutra, E., et al. (2022). MSWX: global 3-hourly 0.1 bias-corrected meteorological data including near-real-time updates and forecast ensembles. Bull. Am. Meteorol. Soc. 103, E710–E732. doi: 10.1175/BAMS-D-21-0145.1
Beck, H. E., Van Dijk, A. I., Levizzani, V., Schellekens, J., Miralles, D. G., Martens, B., et al. (2017). MSWEP: 3-hourly 0.25 global gridded precipitation (1979–2015) by merging gauge, satellite, and reanalysis data. Hydrol. Earth Syst. Sci. 21, 589–615. doi: 10.5194/hess-21-589-2017
Beck, H. E., Wood, E. F., Pan, M., Fisher, C. K., Miralles, D. G., Van Dijk, A. I., et al. (2019). MSWEP V2 global 3-hourly 0.1 precipitation: methodology and quantitative assessment. Bull. Am. Meteorol. Soc. 100, 473–500. doi: 10.1175/BAMS-D-17-0138.1
Brinkhoff, T. (2025) Major agglomerations of the world. Available online at: https://www.citypopulation.de/en/world/agglomerations/ (Accessed April 28, 2024).
Cos, J., Doblas-Reyes, F., Jury, M., Marcos, R., Bretonnière, P. A., and Samsó, M. (2022). The Mediterranean climate change hotspot in the CMIP5 and CMIP6 projections. Earth Syst. Dynam. 13, 321–340. doi: 10.5194/esd-13-321-2022
Cramer, W., Guiot, J., Fader, M., Garrabou, J., Gattuso, J. P., Iglesias, A., et al. (2018). Climate change and interconnected risks to sustainable development in the Mediterranean. Nat. Clim. Chang. 8, 972–980. doi: 10.1038/s41558-018-0299-2
Déqué, M., Somot, S., Sanchez-Gomez, E., Goodess, C. M., Jacob, D., Lenderink, G., et al. (2012). The spread amongst ensembles regional scenarios: regional climate models, driving general circulation models and interannual variability. Clim. Dyn. 38, 951–964. doi: 10.1007/s00382-011-1053-x
Eyring, V., Bony, S., Meehl, G. A., Senior, C. A., Stevens, B., Stouffer, R. J., et al. (2016). Overview of the coupled model intercomparison project phase 6 (CMIP6) experimental design and organization. Geosci. Model Dev. 9, 1937–1958. doi: 10.5194/gmd-9-1937-2016
Gebrechorkos, S., Leyland, J., Slater, L., Wortmann, M., Ashworth, P. J., Bennett, G. L., et al. (2023). A high-resolution daily global dataset of statistically downscaled CMIP6 models for climate impact analyses. Sci Data 10:611. doi: 10.1038/s41597-023-02528-x
Giorgi, F., and Lionello, P. (2008). Climate change projections for the Mediterranean region. Glob. Planet. Chang. 63, 90–104. doi: 10.1016/j.gloplacha.2007.09.005
Gleick, P. H. (2014). Water, drought, climate change, and conflict in Syria. Weather Clim. Soc. 6, 331–340. doi: 10.1175/WCAS-D-13-00059.1
Hoerling, M., Eischeid, J., Perlwitz, J., Quan, X., Zhang, T., and Pegion, P. (2012). On the increased frequency of Mediterranean drought. J. Clim. 25, 2146–2161. doi: 10.1175/JCLI-D-11-00296.1
Kelebek, M. B., Batibeniz, F., and Önol, B. (2021). Exposure assessment of climate extremes over the Europe–Mediterranean region. Atmos. 12:633. doi: 10.3390/atmos12050633
Kelley, C. P., Mohtadi, S., Cane, M. A., Seager, R., and Kushnir, Y. (2015). Climate change in the Fertile Crescent and implications of the recent Syrian drought. Proc. Natl. Acad. Sci. 112, 3241–3246. doi: 10.1073/pnas.1421533112
Kikstra, J. S., Nicholls, Z. R., Smith, C. J., Lewis, J., Lamboll, R. D., Byers, E., et al. (2022). The IPCC sixth assessment report WGIII climate assessment of mitigation pathways: from emissions to global temperatures. Geosci. Model Dev. 15, 9075–9109. doi: 10.5194/gmd-15-9075-2022
Kim, W. M., and Raible, C. C. (2020). Dynamics of the Mediterranean droughts from 850 to 2099 AD in the community earth system model. Clim. Past Discuss. 2020, 1–28. doi: 10.5194/cp-17-887-2021
Lange, M. A. (2020). “Climate change in the Mediterranean: environmental impacts and extreme events” in IEMed Mediterranean yearbook, Barcelona, Spain. 224–229.
Lionello, P., Abrantes, F., Congedi, L., Dulac, F., Gacic, M., Gomis, D., et al. (2012). “Introduction: Mediterranean climate—background information” in The climate of the Mediterranean region: From the past to the future. ed. P. Lionello (New York, NY, USA: Elsevier Inc).
Lionello, P., Abrantes, F., Gacic, M., Planton, S., Trigo, R., and Ulbrich, U. (2014). The climate of the Mediterranean region: research progress and climate change impacts. Reg. Environ. Chang. 14, 1679–1684. doi: 10.1007/s10113-014-0666-0
Lionello, P., Malanotte-Rizzoli, P., Boscolo, R., Alpert, P., Artale, V., Li, L., et al. (2006). The Mediterranean climate: an overview of the main characteristics and issues. Develop Earth Environ Sci 4, 1–26. doi: 10.1016/S1571-9197(06)80003-0
Lionello, P., and Scarascia, L. (2018). The relation between climate change in the Mediterranean region and global warming. Reg. Environ. Chang. 18, 1481–1493. doi: 10.1007/s10113-018-1290-1
Lu, J., Vecchi, G. A., and Reichler, T. (2007). Expansion of the Hadley cell under global warming. Geophys. Res. Lett. 34. doi: 10.1029/2006GL028443
Malik, A., Stenchikov, G., Mostamandi, S., Parajuli, S., Lelieveld, J., Zittis, G., et al. (2024). Accelerated historical and future warming in the Middle East and North Africa. J. Geophys. Res. Atmos. 129:e2024JD041625. doi: 10.1029/2024JD041625
Molina, M. O., Sánchez, E., and Gutiérrez, C. (2020). Future heat waves over the Mediterranean from an Euro-CORDEX regional climate model ensemble. Sci. Rep. 10:8801. doi: 10.1038/s41598-020-65663-0
Nelson, G. C., Rosegrant, M. W., Palazzo, A., Gray, I., Ingersoll, C., Robertson, R., et al. (2010). Food security, farming, and climate change to 2050: scenarios, results, policy options. Int Food Policy Res Inst 172.
O'Neill, B. C., Tebaldi, C., Van Vuuren, D. P., Eyring, V., Friedlingstein, P., Hurtt, G., et al. (2016). The scenario model intercomparison project (ScenarioMIP) for CMIP6. Geosci. Model Dev. 9, 3461–3482. doi: 10.5194/gmd-9-3461-2016
Ouzeau, G., Soubeyroux, J. M., Schneider, M., Vautard, R., and Planton, S. (2016). Heat waves analysis over France in present and future climate: application of a new method on the EURO-CORDEX ensemble. Clim. Serv. 4, 1–12. doi: 10.1016/j.cliser.2016.09.002
Pastor, F., Valiente, J. A., and Khodayar, S. (2020). A warming Mediterranean: 38 years of increasing sea surface temperature. Remote Sens 12:2687. doi: 10.3390/rs12172687
Perkins, S. E. (2015). A review on the scientific understanding of heatwaves—their measurement, driving mechanisms, and changes at the global scale. Atmos. Res. 164-165, 242–267. doi: 10.1016/j.atmosres.2015.05.014
Pisano, A., Marullo, S., Artale, V., Falcini, F., Yang, C., Leonelli, F. E., et al. (2020). New evidence of Mediterranean climate change and variability from sea surface temperature observations. Remote Sens 12:132. doi: 10.3390/rs12010132
Previdi, M., and Liepert, B. G. (2007). Annular modes and Hadley cell expansion under global warming. Geophys. Res. Lett. 34. doi: 10.1029/2007GL031243
Ritchie, H., Rosado, P., and Roser, M. (2023). CO₂ and greenhouse gas emissions. Published online at OurWorldinData.org. Available online at: https://ourworldindata.org/co2-and-greenhouse-gas-emissions (Accessed April 28, 2024).
Russo, A. C., Gouveia, C. M., Trigo, R. M., Liberato, M. L., and DaCamara, C. C. (2015). The influence of circulation weather patterns at different spatial scales on drought variability in the Iberian Peninsula. Front. Environ. Sci. 3:1. doi: 10.3389/fenvs.2015.00001
Saaroni, H., Ziv, B., Lempert, J., Gazit, Y., and Morin, E. (2015). Prolonged dry spells in the Levant region: climatologic-synoptic analysis. Int. J. Climatol. 35, 2223–2236. doi: 10.1002/joc.4143
Sobie, S. R., and Murdock, T. Q. (2017). High-resolution statistical downscaling in southwestern British Columbia. J. Appl. Meteorol. Climatol. 56, 1625–1641. doi: 10.1175/JAMC-D-16-0287.1
Tarín-Carrasco, P., Petrova, D., Chica-Castells, L., Lukovic, J., Rodó, X., and Cvijanovic, I. (2025). Assessment of future precipitation changes in Mediterranean climate regions from CMIP6 ensemble. Int. J. Climatol. 45:e70039. doi: 10.1002/joc.70039
Tejedor, E., Benito, G., Serrano-Notivoli, R., González-Rouco, F., Esper, J., and Büntgen, U. (2024). Recent heatwaves as a prelude to climate extremes in the western Mediterranean region. NPJ Clim. Atmos. Sci. 7:218. doi: 10.1038/s41612-024-00771-6
Tramblay, Y., Koutroulis, A., Samaniego, L., Vicente-Serrano, S. M., Volaire, F., Boone, A., et al. (2020). Challenges for drought assessment in the Mediterranean region under future climate scenarios. Earth-Sci. Rev. 210:103348. doi: 10.1016/j.earscirev.2020.103348
Tuel, A., and Eltahir, E. A. (2020). Why is the Mediterranean a climate change hot spot? J. Clim. 33, 5829–5843. doi: 10.1175/JCLI-D-19-0910.1
Ulbrich, U., Lionello, P., Belušić, D., and Jacobeit, J., (2012). Climate of the Mediterranean: synoptic patterns, temperature, precipitation, winds, and their extremes.
Ulbrich, U., Xoplaki, E., Dobricic, S., and García-Herrera, R. (2013). “Past and current climate changes in the Mediterranean region” in Regional assessment of climate change in the Mediterranean: Volume 1: Air, sea and precipitation and water. eds. A. Navarra and L. Tubiana. (Dordrecht: Springer Netherlands), 9–51.
Werner, A. T., and Cannon, A. J. (2016). Hydrologic extremes–an intercomparison of multiple gridded statistical downscaling methods. Hydrol. Earth Syst. Sci. 20, 1483–1508. doi: 10.5194/hess-20-1483-2016
Yang, Y., Lin, H., Xu, Y., Pan, H., Dong, G., and Tang, J. (2025). Future projections of precipitation extremes over East Asia based on a deep learning downscaled CMIP6 high-resolution (0.1°) dataset. Clim. Chang. 178:5. doi: 10.1007/s10584-024-03844-w
Yin, J. H. (2005). A consistent poleward shift of the storm tracks in simulations of 21st century climate. Geophys. Res. Lett. 32. doi: 10.1029/2005GL023684
Zhang, X., Alexander, L., Hegerl, G. C., Jones, P., Tank, A. K., Peterson, T. C., et al. (2011). Indices for monitoring changes in extremes based on daily temperature and precipitation data. Wiley Interdiscip. Rev. Clim. Chang. 2, 851–870. doi: 10.1002/wcc.147
Keywords: droughts, heatwaves, CMIP6, Mediterranean, climate
Citation: Daher H and Kirtman BP (2025) Future climate assessment in the Mediterranean region using downscaled CMIP6 data. Front. Clim. 7:1691944. doi: 10.3389/fclim.2025.1691944
Edited by:
Annalisa Cherchi, National Research Council (CNR), ItalyReviewed by:
Marco Possega, National Research Council (CNR), ItalyHoussam Ayt Ougougdal, Cadi Ayyad University, Morocco
Copyright © 2025 Daher and Kirtman. This is an open-access article distributed under the terms of the Creative Commons Attribution License (CC BY). The use, distribution or reproduction in other forums is permitted, provided the original author(s) and the copyright owner(s) are credited and that the original publication in this journal is cited, in accordance with accepted academic practice. No use, distribution or reproduction is permitted which does not comply with these terms.
*Correspondence: Houraa Daher, aGRhaGVyQGVhcnRoLm1pYW1pLmVkdQ==