 Darshan Mehta
 Tommaso Caloiero
 Sanjaykumar Yadav3
 Vikram Kumar
- 1Department of Civil Engineering, Dr. S. & S. S. Ghandhy Government Engineering College, Surat, Gujarat, India
- 2National Research Council of Italy–Research Institute for Geo-Hydrological Protection (CNR-IRPI), Rende, Italy
- 3Department of Civil Engineering, Sardar Vallabhbhai National Institute of Technology, Surat, Gujarat, India
- 4Bihar Mausam Sewa Kendra, Planning & Development, Government of Bihar, Patna, India
Drought, a prolonged period of precipitation deficit, is one of the most significant hydro-meteorological hazards affecting agriculture, water resources, ecosystems, and socio-economic systems, and its impacts are becoming more pronounced under intensifying global climate extremes. This study investigates the temporal behavior and severity of droughts in the Ganganagar district of Rajasthan, India, using a 122-year record of monthly precipitation (1901-2022) analyzed through the Standardized Precipitation Index (SPI) at 3-, 6-, 9-, and 12-month timescales. Statistical techniques were employed to assess drought frequency, duration, intensity, and long-term variability, alongside evaluations of linear trends and decadal oscillations linked to large-scale monsoon dynamics. The analysis identified 46 moderate to severe drought events at the 3-month scale and 32 at the 12-month scale, with the longest drought lasting 21 months between 2000 and 2002. The frequency of extreme drought events increased notably after the 1970s, coinciding with enhanced inter-annual variability in monsoon rainfall. While the long-term linear trends in drought severity were not statistically significant, the 12-month SPI exhibited clear decadal-scale oscillations influenced by monsoon behavior, and the 3-month SPI effectively captured short-term agricultural droughts affecting seasonal crop yields. These findings provide a comprehensive understanding of drought characteristics in a highly vulnerable arid region and offer a quantitative basis for improving drought monitoring and early-warning systems. The results have direct implications for agricultural planning, irrigation scheduling, and the development of climate-informed contingency measures tailored to high-risk periods. By situating local drought assessment within the wider context of global climate extremes, this study highlights the need for integrated water resource management and region-specific policy interventions to strengthen resilience and support sustainable development in the face of an increasingly uncertain climate future.
1 Introduction
Water is an essential natural resource underpinning both sustainable human development and the integrity of ecological systems. Its availability is fundamental for agricultural, industrial, domestic, recreational, and environmental activities (Mehta and Yadav, 2021a). However, climate variability and anthropogenic climate change increasingly threaten freshwater resources. The Intergovernmental Panel on Climate Change (IPCC) Sixth Assessment Report (AR6) emphasizes significant alterations in the global hydrological cycle, with increased variability in precipitation patterns closely associated with the intensification of drought events (Intergovernmental Panel on Climate Change, 2021). This intensification has led to more frequent and severe meteorological, agricultural, and hydrological droughts across many regions of the world.
Drought is commonly defined as a prolonged and abnormal deficit in precipitation, often extending over months or years and affecting large geographic areas (Rossi, 2000). Although its primary driver is insufficient rainfall, additional climatic factors, such as elevated temperatures, increased evapotranspiration, strong winds, and low relative humidity, can exacerbate its severity (Attri and Tyagi, 2010; Mehta and Yadav, 2021b, 2022). The multifaceted impacts of drought span economic losses, reduced agricultural yields, water scarcity, land degradation, and disruption of ecosystems and biodiversity (Dash et al., 2009a,b; Patel et al., 2021). Globally, drought is among the most destructive natural hazards, accounting for approximately 85% of the impacts associated with extreme weather events (Obasi, 1994; Centre for Research on the Epidemiology of Disasters, 2003).
India is particularly vulnerable to drought due to its complex climatic system, especially the variability associated with the southwest monsoon. The spatial and temporal inconsistencies of monsoon rainfall result in frequent hydrological extremes, with simultaneous occurrences of floods and droughts in different regions (Ranjan et al., 2013). Large areas of India, including arid and semi-arid zones such as Rajasthan, are chronically drought-prone (Agarwal et al., 2025). Given the country’s predominantly agrarian economy, which is heavily reliant on monsoon rainfall, drought events pose a significant threat to food security, rural livelihoods, and water availability. Between 1900 and 2016, droughts in India are estimated to have affected approximately 1.3 billion people, and current projections suggest that the frequency, intensity, and duration of droughts will increase under future climate scenarios (Chuphal et al., 2024).
The Standardized Precipitation Index (SPI), developed by McKee et al. (1993), is widely recognized for quantifying meteorological drought. It provides a normalized measure of precipitation deficits over different temporal scales, facilitating the assessment of drought severity and comparison across diverse climatic regions (Wu et al., 2007). Owing to its methodological simplicity and adaptability, the SPI has been endorsed by the World Meteorological Organization as a key drought monitoring tool (World Meteorological Organization, 2006). Several studies have applied SPI-based trend analyses in India to assess long-term drought variability and frequency. For example, a study by Samantaray et al. (2022) has identified regional patterns in SPI trends, with some areas showing increasing drought tendencies while others revealing no significant change, highlighting the spatial heterogeneity of drought evolution in the country.
In light of these considerations, the present study aims to assess drought characteristics in the Ganganagar district of Rajasthan, a region located in one of the most arid and water-scarce states of India. Using long-term precipitation records (1901–2022), the study applies the SPI at multiple timescales (3-, 6-, 9-, and 12-month) to identify the frequency, severity, and temporal variability of drought events. Furthermore, a trend analysis is performed across different timescales to evaluate potential long-term changes in drought conditions. The findings are intended to contribute to regional water resource planning and the development of effective drought early warning and mitigation strategies.
While SPI and trend-based analyses have been widely applied across India and Rajasthan, most existing studies focus on broad regional or state-level assessments, often masking localized drought signals. District-level investigations remain limited, despite the fact that districts are the operational units for agricultural planning, irrigation management, and drought declaration in India. The present study addresses this gap by focusing on the Ganganagar district, which represents a unique hydro-climatic setting within Rajasthan. Situated at the northern fringe of the Thar Desert, Ganganagar has undergone a dramatic transformation due to the Indira Gandhi Canal project, turning onetime desert land into one of the most prominent areas for the production of wheat and cotton regions. Yet, the district remains highly vulnerable to both monsoon variability and fluctuations in canal water availability, thus making localized drought characterization indispensable for safeguarding agricultural productivity and water security. Using a 122-year precipitation record, this study provides one of the longest district-scale drought analyses in semi-arid India, offering insights into frequency, severity, and temporal variability of drought events. The findings not only advance the hydro-climatic understanding of this transitional desert–irrigated zone, but also provide a scientific basis for district-level drought early warning, irrigation scheduling, and climate-resilient policy interventions which cannot be adequately derived from state- or country-level assessments.
2 Study area and data collection
The Ganganagar district, officially known as Sri Ganganagar, is located in the northwestern part of the Indian state of Rajasthan, bordering the Indian states of Punjab and Haryana to the east and northeast, and the international boundary with Pakistan to the west. Geographically, it lies between latitude 28o42’30″ and 30o12’00″ N and longitude 72o39’15″ and 74o18’30″ E, covering an area of 11,154 km2 (Figure 1). In particular, it is located in the vast Thar Desert, and is the northernmost city of the Indian state of Rajasthan. This area is renowned for its rich cultural heritage and historical significance. The Ganganagar District is also a major agricultural area, whose crop yields sustain the local economy. Instead, the northern part of the district is covered by forest (Government of Rajasthan, 2022; National Remote Sensing Centre, 2019).
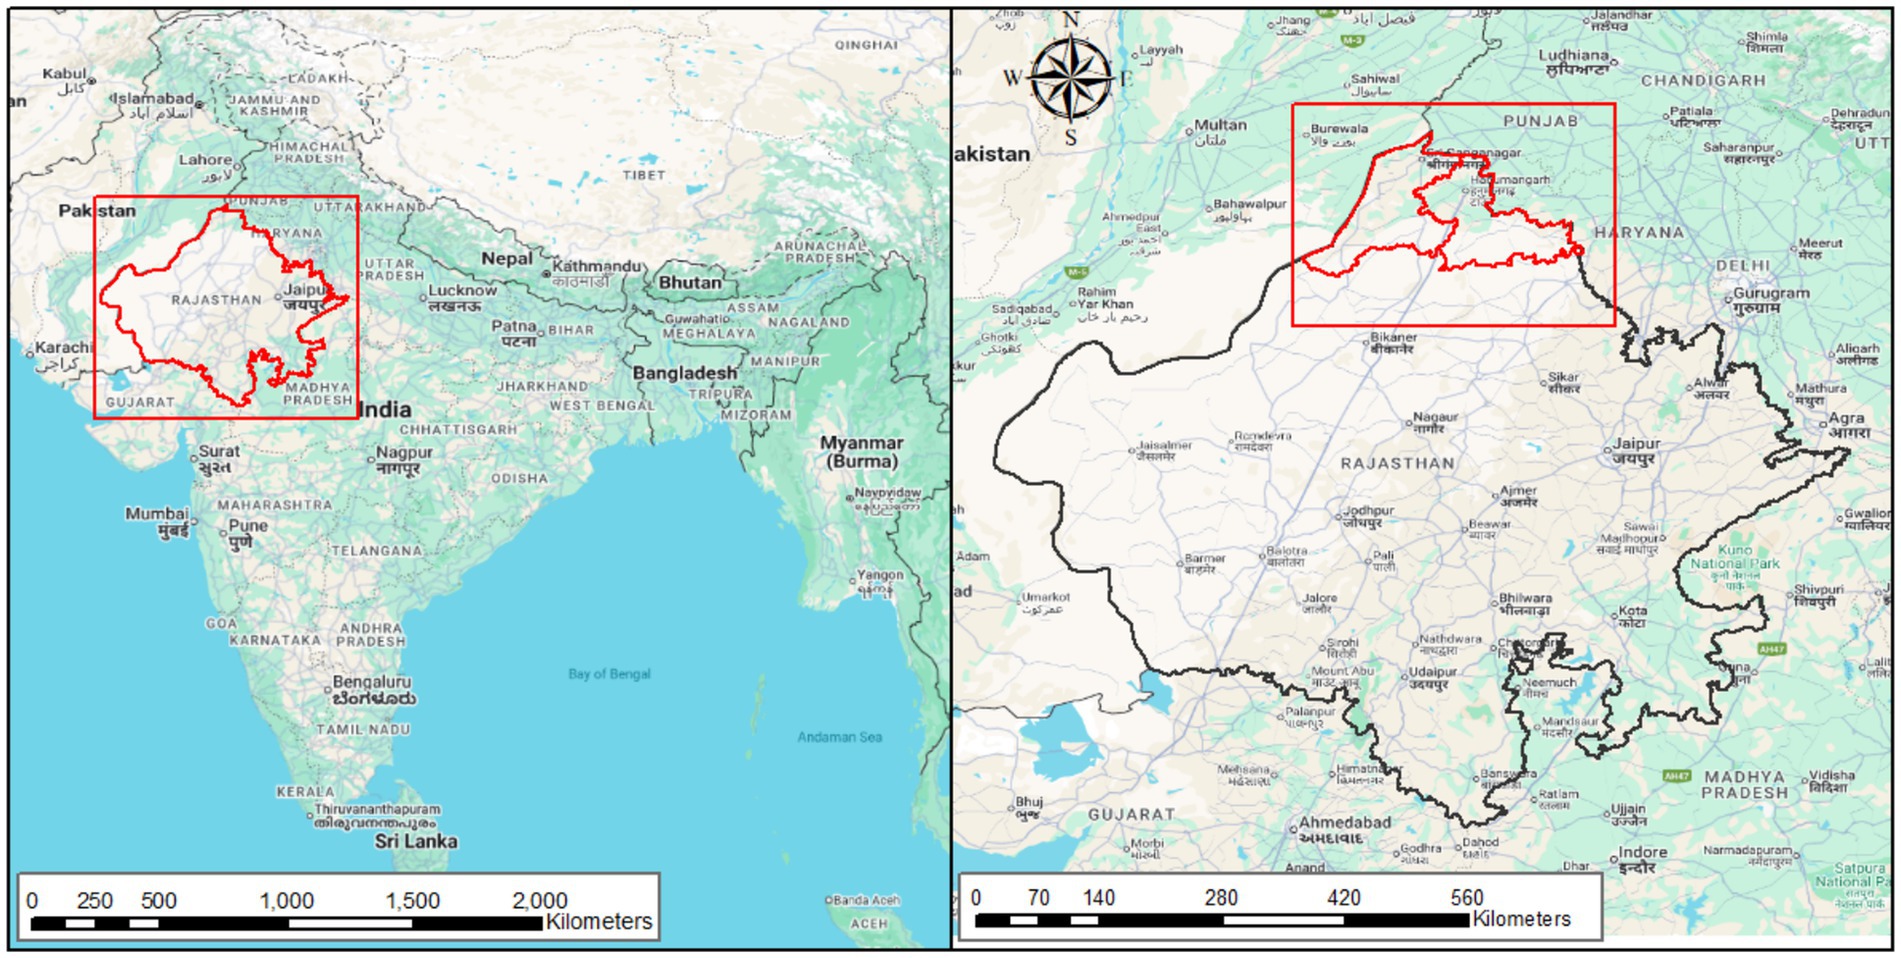
Figure 1. Location of study area.
Climatically, Ganganagar is characterized by extreme temperature variability and low, irregular precipitation. The district experiences hot summers (with maximum temperatures often exceeding 45 °C), cool winters, and an annual average rainfall of approximately 200–300 mm, most of which is concentrated during the southwest monsoon season (June to September). The district is classified under agro-climatic zone Ic (hyper-arid partially irrigated western plain zone) according to the Planning Commission of India (Planning Commission, 1989; Indian Council of Agricultural Research, 2015).
The India Meteorological Department (IMD) provides detailed monthly precipitation data for districts across India, including Sri Ganganagar in Rajasthan. This data is crucial for analyzing drought patterns and understanding climatic variability in the region. In particular, in this paper, 122 years (1901–2022) of monthly precipitation data, without missing records, have been collected from 54 stations managed by the IMD of the Ganganagar district of Rajasthan; the arithmetic mean was adopted for estimating mean areal rainfall over the entire study area.
3 Methodology
3.1 Non-parametric test for trend analysis
Among the several non-parametric tests for trend detection, the Mann–Kendall test (Mann, 1945; Kendall, 1962) has been selected to assess the trend statistical significance. Instead, a simple linear regression has been used to evaluate the magnitude of the trend.
As regards the Mann–Kendall test, to find the significance of trend, the statistic S grounded on the rank-sums is computed as per below Equation 1, where xi and xj are the observations taken at times i and j (and j > i), and N is the length.
The variance is found out as shown in Equation 2.
where, ti is the count of draws with index i.
Given the variance of S, it is possible to evaluate the standardized statistic ZMK using Equation 3:
The significance of the trend is examined for a given significance level α = 95% using double-tailed test.
3.2 Graphical test for trend detection
The Innovative Trend Analysis (ITA) method, originally proposed by Şen (2012), offers a novel approach to trend detection that differs significantly from conventional statistical techniques such as the Mann–Kendall (MK) test. One of the principal advantages of ITA lies in its non-parametric nature, as it does not impose any preconditions regarding data distribution, serial correlation, sample size, or normality, common limitations associated with traditional trend tests.
The method involves dividing the time series into two equal sub-series, each of which is independently sorted in ascending order. These ordered values are then plotted in a Cartesian coordinate system, where the values from the first half are assigned to the X-axis and those from the second half to the Y-axis. A 1:1 reference line (i.e., the 45° line) is used as a benchmark for interpreting trends. If the plotted data points align closely with this ideal line, it indicates the absence of a trend. A concentration of points above the line signifies an increasing trend, while a distribution below the line suggests a decreasing trend (Şen, 2012, 2014).
This graphical method enables a distinct visualization of trends across different value ranges (i.e., low, medium, and high values) of hydro-meteorological or hydro-climatic variables, providing enhanced insight into the behavior of the time series that may not be evident through other statistical methods.
3.3 Standardized Precipitation Index (SPI)
McKee et al. (1993) developed the Standardized Precipitation Index (SPI) to monitor drought. Thom (1958) found the gamma distribution to fit the climatological precipitation time series well.
The gamma distribution is defined by its frequency or probability density function, which can be calculated using Equations 4–8.
Where,
α > 0, α is a shape factor,
β > 0, β is a scale factor
Where,
ᴦ(α) is the gamma function.
n = Number of precipitation observation.
The cumulative probability is calculated using Equations 9 and 10:
Letting t = x/β
The gamma function is undefined for x = 0 and a precipitation distribution may contain zeros, the cumulative probability becomes (as per Equation 11).
Where, q = probability of zero, m = number of zeros in a precipitation time series.
The cumulative probability, H(x), is then transformed to the standard normal random variable Z with mean zero and variance of one, which is the value of the SPI. SPI is categorized based on their range values is shown in Table 1.
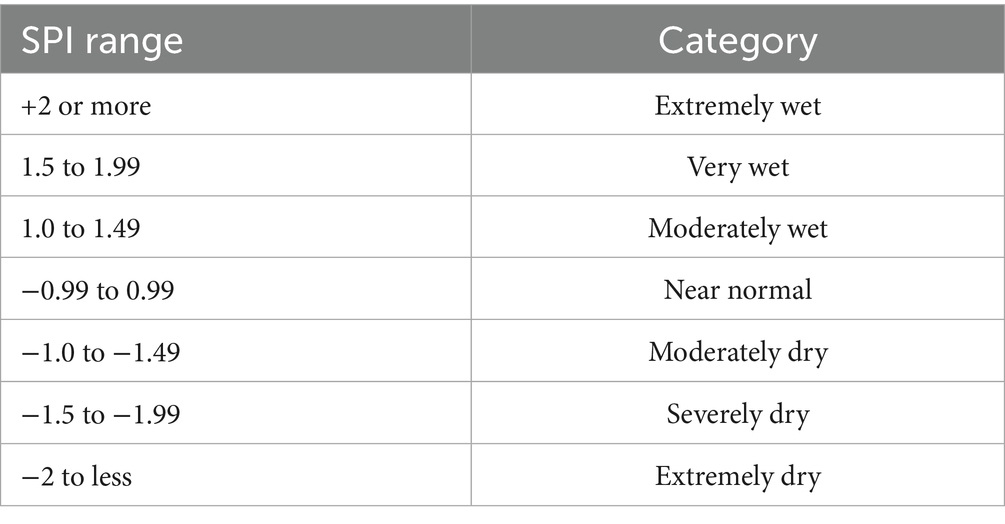
Table 1. Category of Standardized Precipitation Index (SPI) based on range values (Shah et al., 2015).
4 Results
4.1 Result of the non-parametric analysis on rainfall values
Figure 2 illustrates the trend magnitudes (in mm/10 years) of precipitation derived from the Mann–Kendall test, highlighting only statistically significant values.
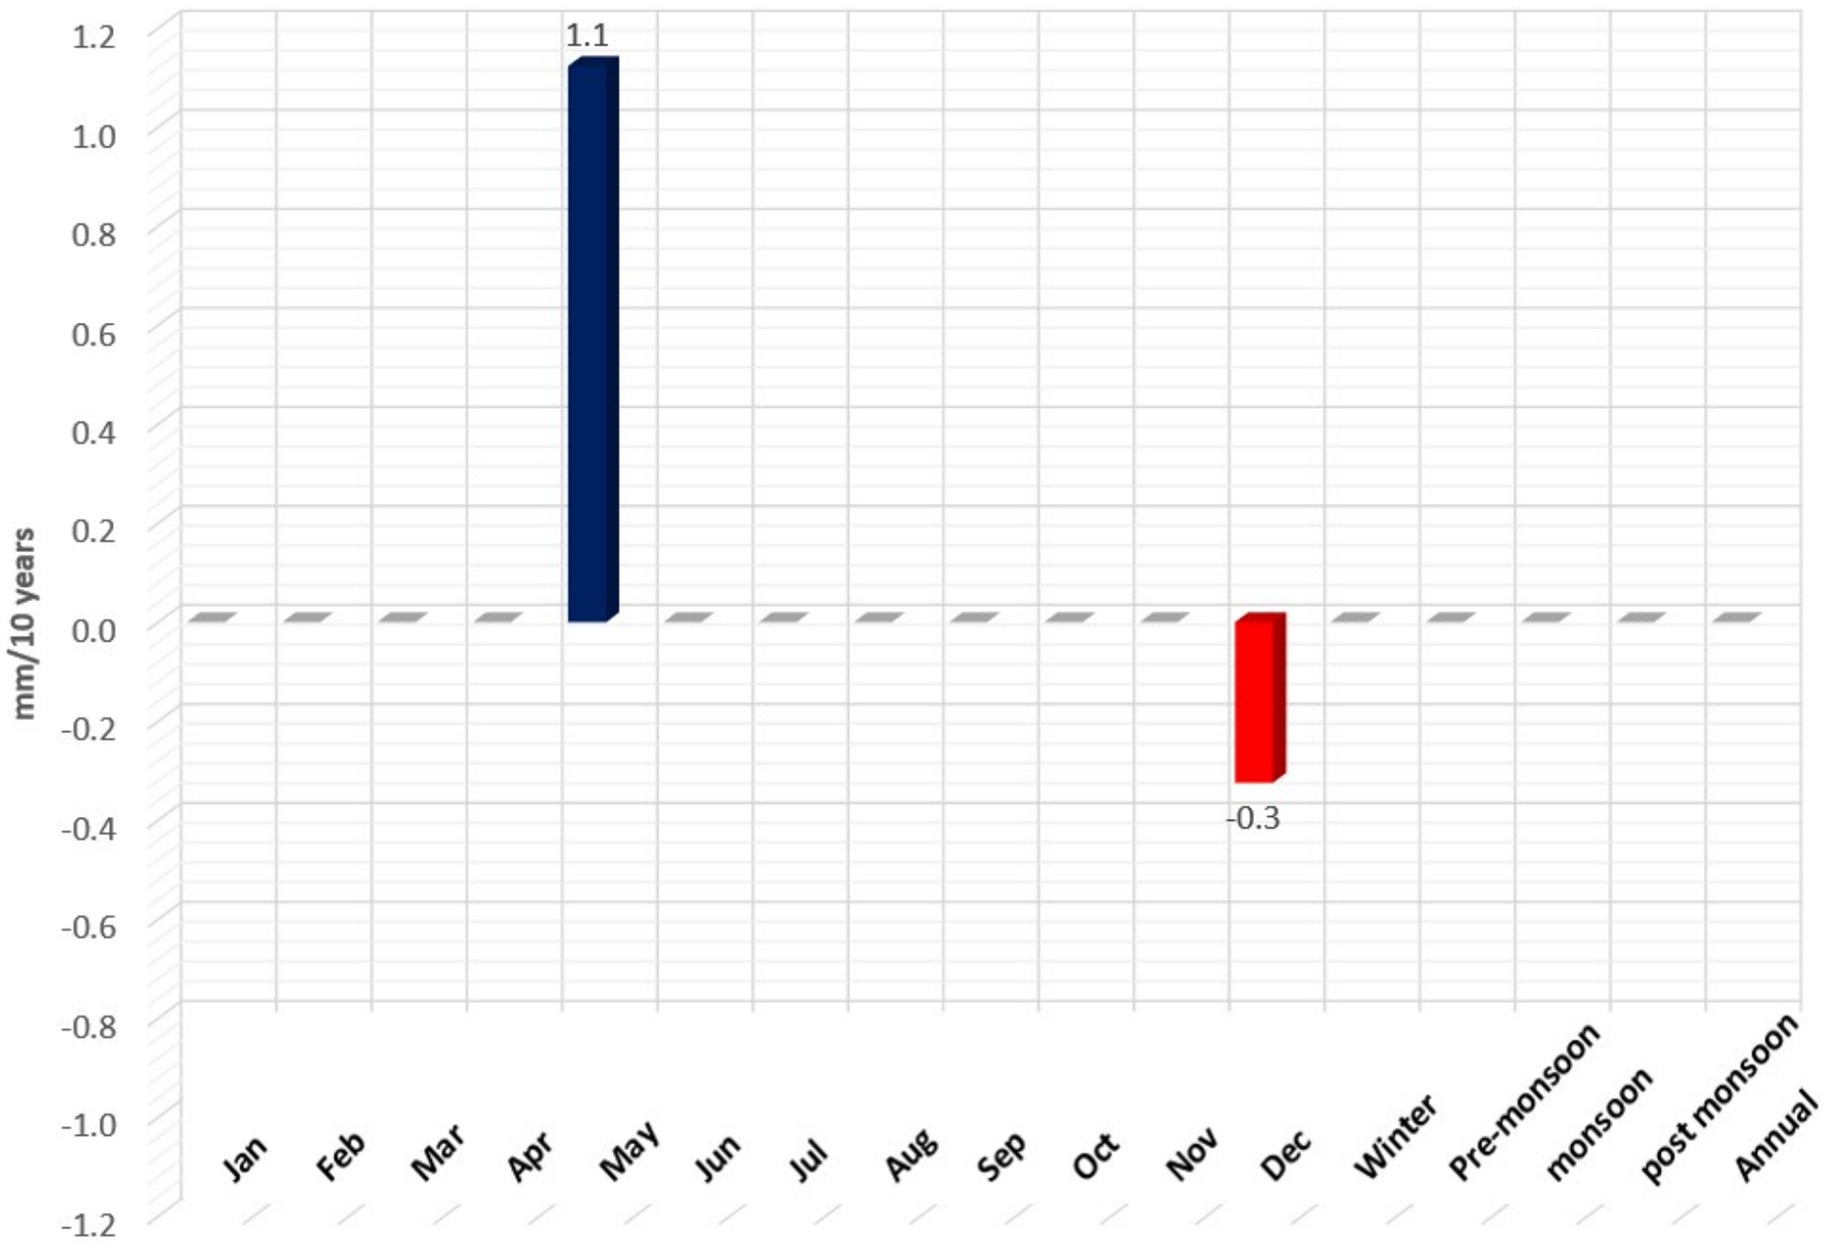
Figure 2. Results of the trend analysis for rainfall. Only significant trends are shown in the figure.
The results indicate a statistically significant increasing trend in the May precipitation (+1.1 mm/10 years, an increase of about 12% than the monthly average), while December shows a decreasing trend (−0.3 mm/10 years, a decrease of about 9% than the monthly average). No significant changes are observed in other months or seasons, and the annual trend remains nearly stable. This suggests that precipitation variability is concentrated in specific transitional months, particularly during the pre-monsoon (May) and post-monsoon (December) periods.
4.2 Result of the graphical test for rainfall trend detection
Figure 3 presents the results of the Innovative Trend Analysis (ITA) for seasonal and annual precipitation, comparing two distinct periods: 1901–1961 (x-axis) and 1962–2022 (y-axis).
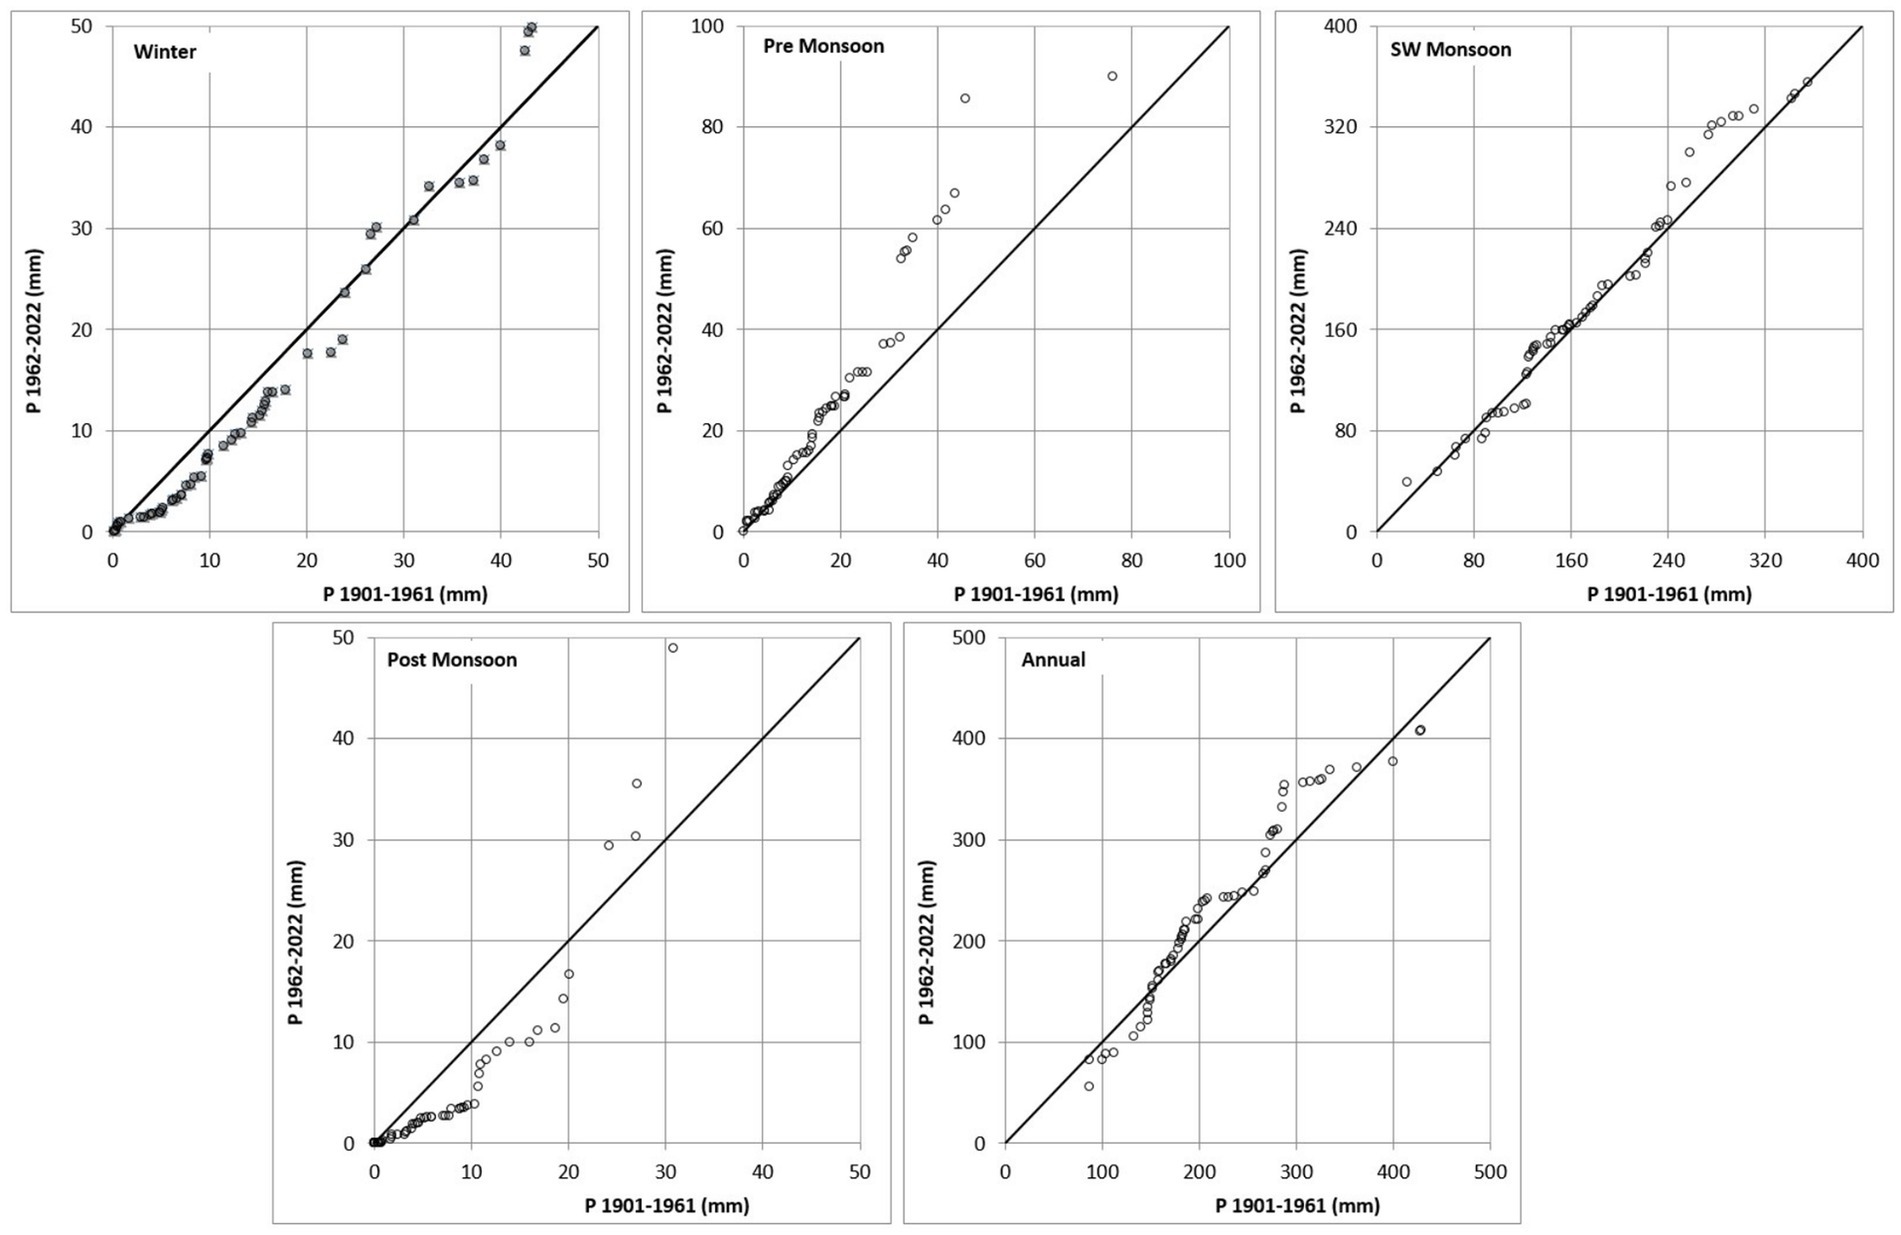
Figure 3. Results of the Innovative Trend Analysis.
Each subplot corresponds to a specific season or the annual average (Winter, Pre-Monsoon, SW Monsoon, Post-Monsoon, and Annual). As a result, the Pre-Monsoon and Post-Monsoon seasons show a clear shift of many points above the 1:1 line, indicating an upward trend in precipitation. The SW Monsoon and the Annual precipitation show a relatively balanced distribution around the diagonal, though slight increases are observable at higher values. The winter precipitation appears to align closely with the 1:1 line, suggesting minimal overall change. These patterns highlight varied seasonal responses to long-term climatic shifts, with more prominent changes during transitional (pre- and post-monsoon) periods.
4.3 SPI analysis in the Ganganagar district
Figure 4 presents the 3-month SPI for the Ganganagar district from 1901 to 2022, for the different seasons: (a) October–December, (b) January–March, (c) April–June, and (d) July–September.
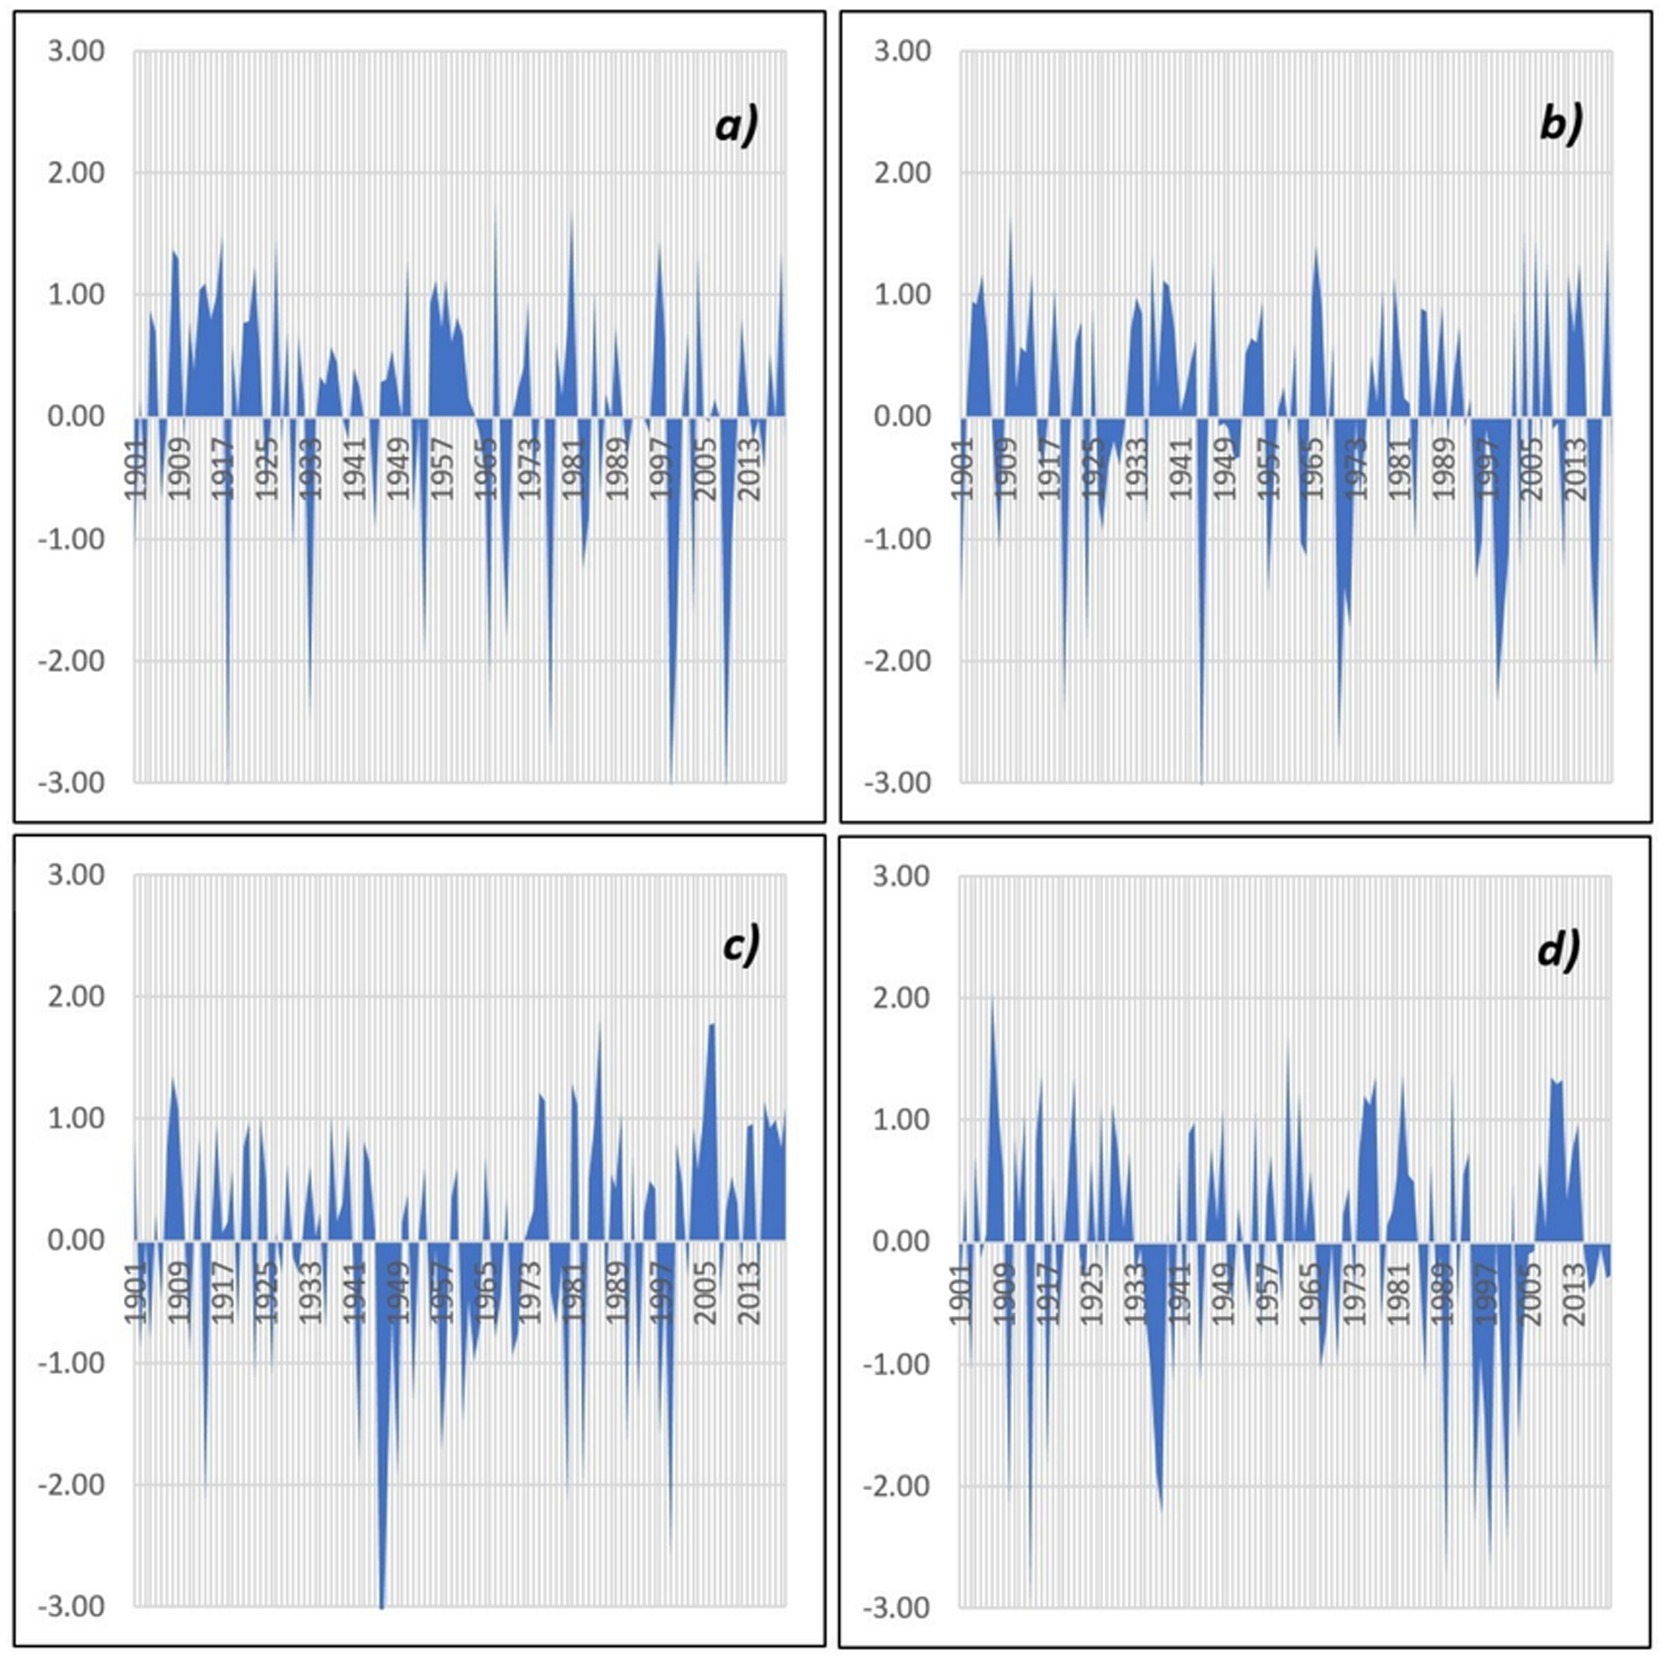
Figure 4. 3-month SPI (1901–2022) of Ganganagar district. (a) October-December, (b) January-March, (c) April-June, and (d) July-September.
The SPI values, which indicate wet and dry conditions, fluctuate around zero, with values below zero representing dry periods and values above zero indicating wet periods. Notable periods of extreme drought (SPI < −2.0) and wetness (SPI > 2.0) are visible for all the seasons, highlighting the seasonal variability and long-term trends in precipitation patterns over the 121-year period. The SPI series highlights frequent oscillations between dry (negative SPI) and wet (positive SPI) conditions. Severe droughts such as 1918, 1972, 1987, and 2002 are captured as strong negative anomalies, while wet years including 1933, 1988, and 2010 show marked positive deviations. The largest variability occurs during the July–September (monsoon) season, while the January–March (winter) season remains relatively stable with fewer extreme events. Moreover, Figure 4c shows an increasing trend in positive SPI values in recent decades, suggesting more frequent wet spells during the pre-monsoon season. Conversely, Figures 4a,b,d reveal more frequent extreme dry events during the mid-20th century.
Table 2 shows the summary of 3-month SPI values, in which total 66 drought years were observed in the Ganganagar district among which 30 years are moderately dry, 16 years are severely dry, and 20 years are extremely dry.
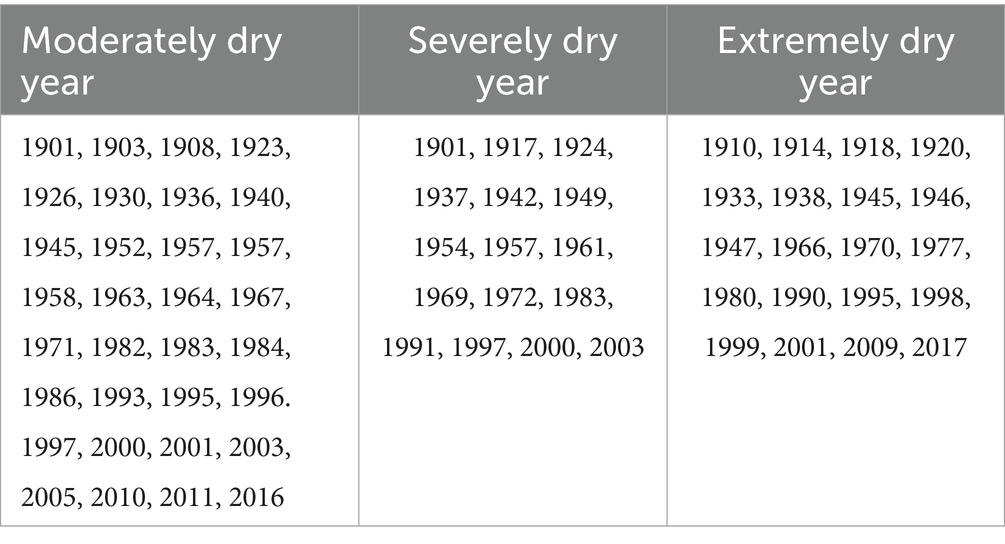
Table 2. Summary of drought years based on the 3-month SPI.
Figure 5 illustrates the 6-month SPI for the Ganganagar district over the period 1901–2022, for two key seasonal intervals: (a) October–March and (b) April–September. SPI values are plotted to depict moisture conditions, where positive values indicate wetter conditions and negative values represent drier periods. The October–March SPI shows variability associated with winter and post-monsoon rainfall, with alternating wet and dry episodes, though extreme deviations are less frequent. In contrast, the April–September SPI, which captures the pre-monsoon and monsoon seasons, shows stronger fluctuations, with severe drought years (e.g., 1918, 1972, 2002) and wet years (e.g., 1988, 2010) clearly identifiable. These results emphasize that the April–September half of the year is more climatically sensitive and prone to extremes compared to October–March.
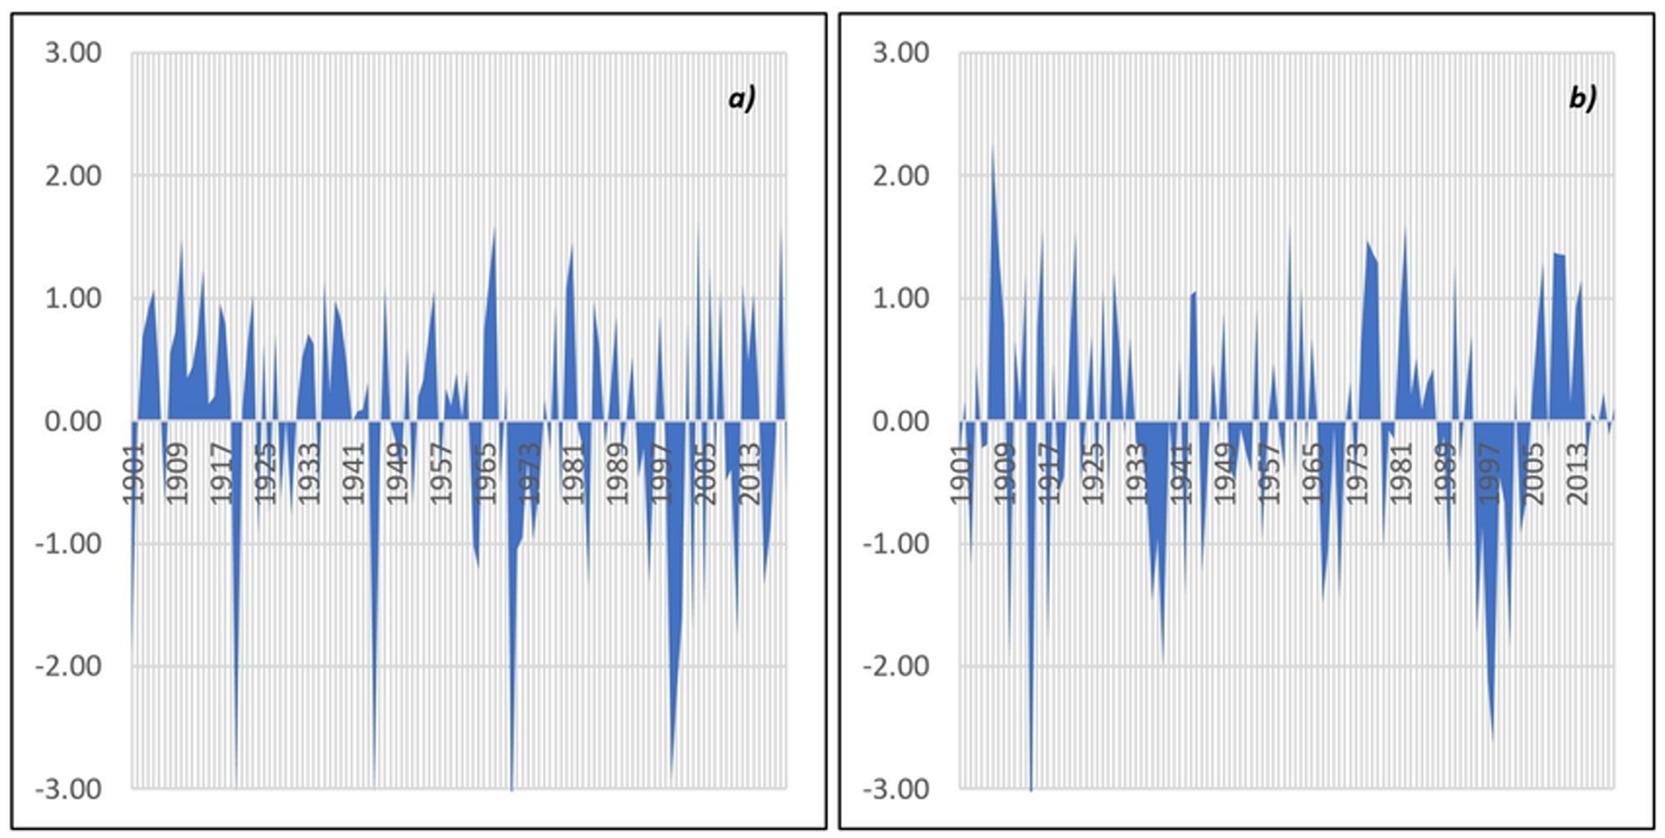
Figure 5. 6-month SPI (1901–2022) of the Ganganagar district. (a) October-March and (b) April-September.
Table 3 provides a summary of the drought years based on 6-month SPI values, in which a total of 32 drought years were observed in the Ganganagar district: 15 years are moderately dry, 8 years are severely dry, and 9 years are extremely dry.
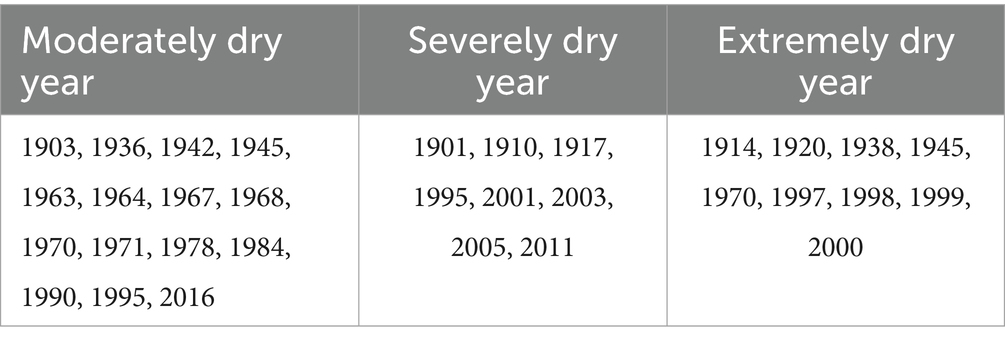
Table 3. Summary of drought years based on the 6-month SPI.
Figure 6 displays the long-term temporal values of the SPI for the Ganganagar district over the period 1901–2022, illustrating (a) the 9-month SPI and (b) the 12-month SPI. These SPI scales provide insights into medium- and long-term moisture conditions, relevant for monitoring agricultural and hydrological droughts. In fact, both indices capture long-term drought and wet cycles more effectively than shorter timescales, highlighting multi-season and near-annual precipitation anomalies. The 9-month SPI (a) reveals frequent moderate to severe dry spells, with extreme drought conditions around 1973 and 2009, and wet periods notably around 1994 and 2008. The 12-month SPI (b) captures more persistent drought episodes with severe deficits during 1918, 1968, 1997–2002, and 2014, while prominent wet spells are observed during the late 1930s and the 2000s. These extended SPI series reveal persistent hydroclimatic variability, underlining the occurrence of multi-year wet and dry spells in the region.
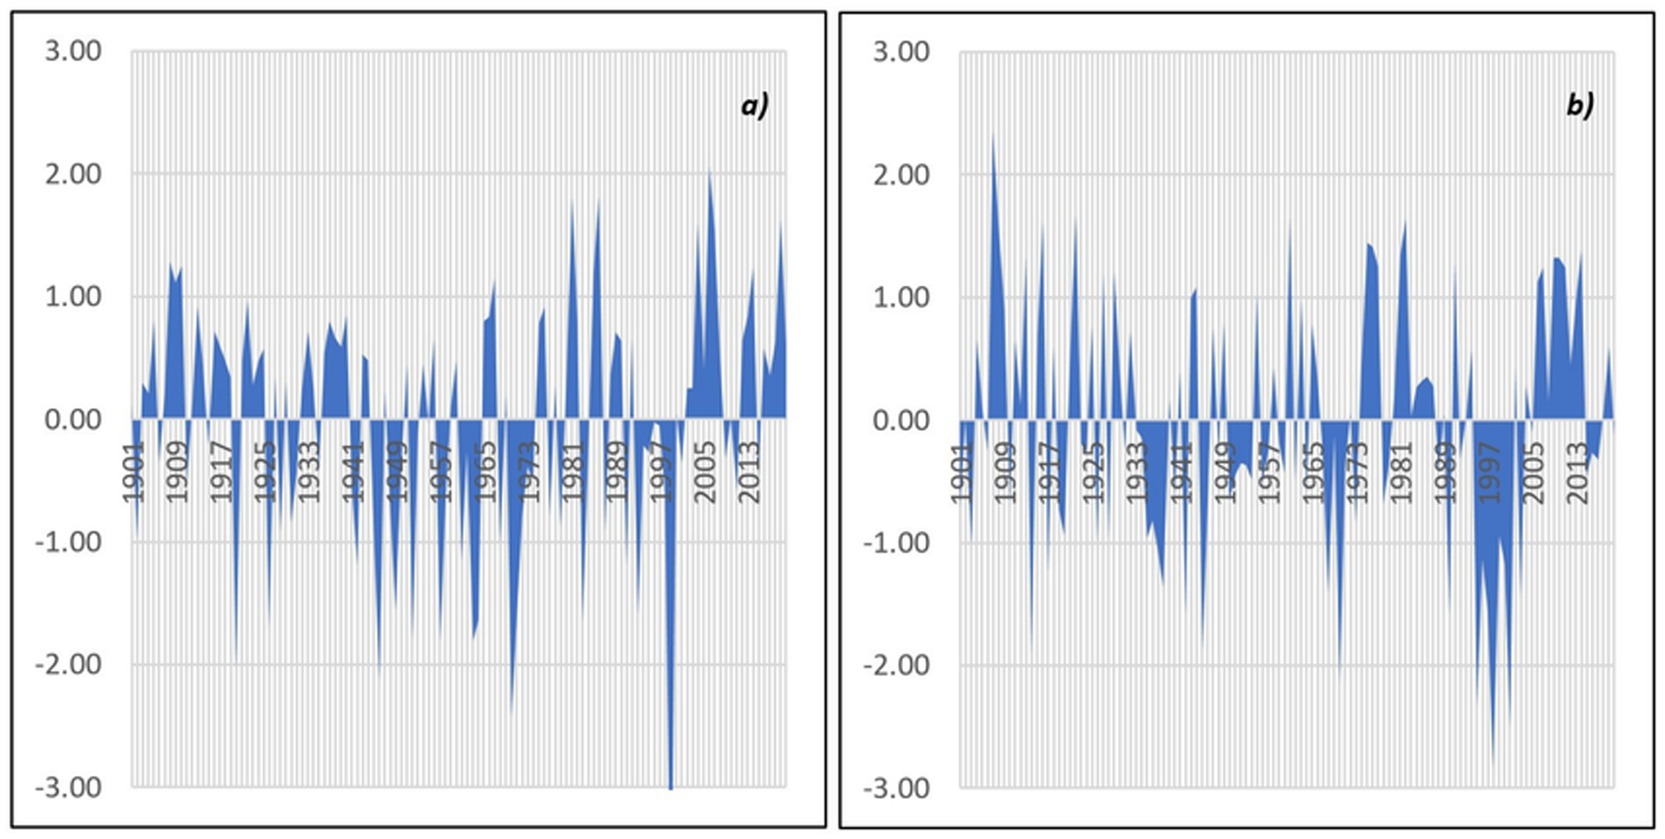
Figure 6. 9- and 12-month SPI (1901–2022) of the Ganganagar district. (a) the 9-month SPI and (b) the 12-month SPI.
Table 4 shows a summary of the drought years based on 9-month SPI values, as a result of which a total of 17 drought years were observed in the Ganganagar district: 4 years are moderately dry, 9 years are severely dry, 4 years are extremely dry.
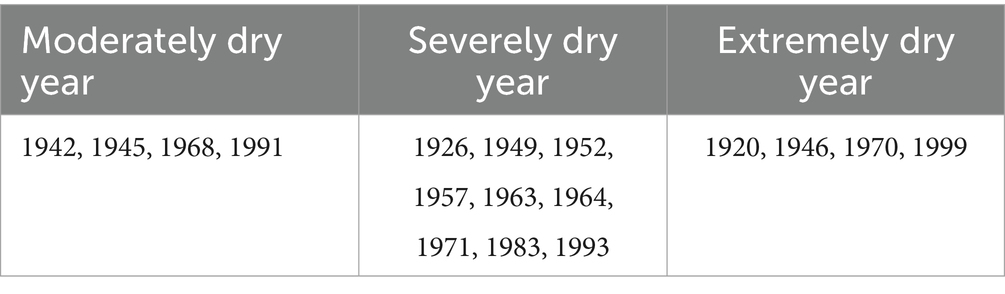
Table 4. Summary of drought years based on the 9-month SPI.
Table 5 shows the summary of the drought years based on the 12-month SPI values, where a total of 18 drought years were observed in the Ganganagar district: 8 years are moderately dry, 5 years are severely dry, and 5 years are extremely dry.
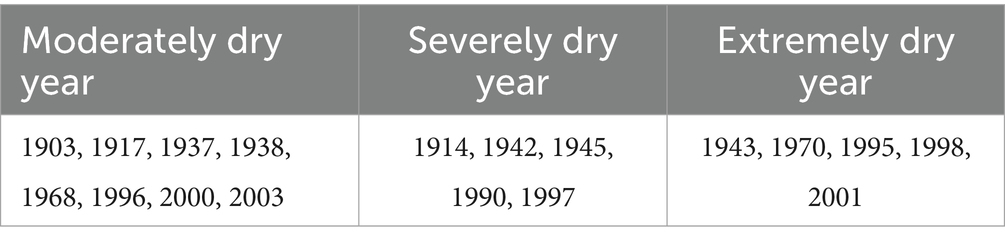
Table 5. Summary of the drought years based on the 12-month SPI.
4.4 Result of the non-parametric analysis on the SPI values
Figure 7 presents the results of the Mann–Kendall trend test for different SPI durations in the Ganganagar district over the period 1901–2022.
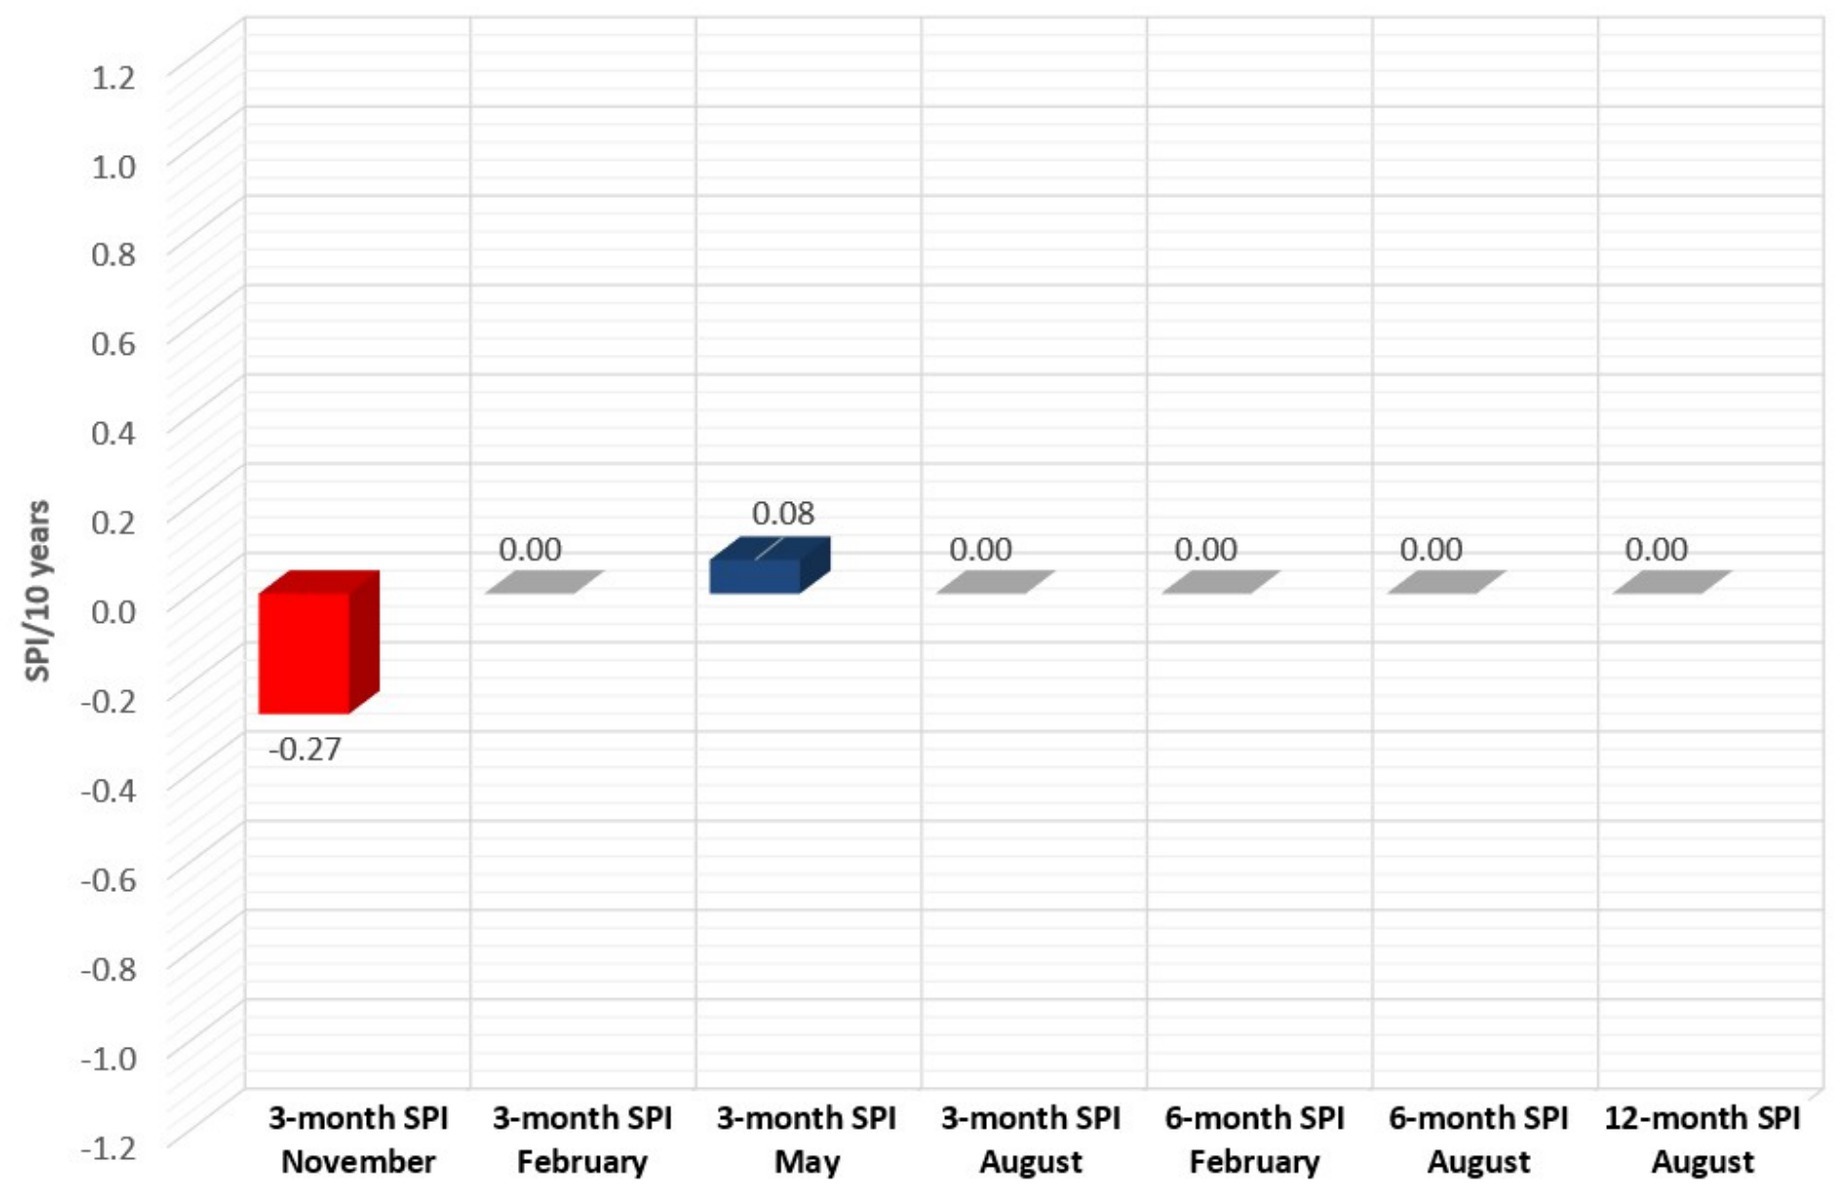
Figure 7. Results of the trend analysis for the SPI. Only significant trends are shown in the figure.
The bars indicate the magnitude of the trend (SPI units per decade), with blue representing statistically significant positive trends, red denoting significant negative trends, and grey indicating non-significant trends. A significant decreasing trend is observed in the 3-month SPI for November (−0.27 SPI/decade, more than 100% than the average SPI value in the period), suggesting increasing dryness in the post-monsoon season. In contrast, the 3-month SPI for May shows a slight but significant increasing trend (0.08 SPI/decade, about 10 times than the average SPI value in the period), possibly pointing to improving pre-monsoon moisture conditions. Other SPI time scales, including February and August (3- and 6-month), and the 12-month SPI, show no significant long-term changes. This indicates that rainfall-related drought risk is most dynamic during transitional months rather than on longer accumulation periods, thus highlighting the temporal and seasonal variability in drought patterns in the region.
5 Discussion
The findings of this study offer a detailed understanding of long-term precipitation and drought trends in the Ganganagar district of northwestern India, utilizing both traditional and innovative statistical methods. These results align with, and contribute to, the broader body of climate trend research across India and globally. As regards the rainfall trend analysis, this study revealed a significant increase in rainfall during May (1.1 mm/decade) and a notable decline in November (−0.3 mm/decade). These results highlight growing pre-monsoon wetness and post-monsoon dryness in the region. Similar increasing pre-monsoon rainfall trends have been observed in other semi-arid parts of India, particularly in Rajasthan and Gujarat, as reported by Jain and Kumar (2010), who found significant rainfall increases in northwest India during the pre-monsoon period. Conversely, the observed decline in post-monsoon precipitation mirrors findings from studies like those by Dash et al. (2009a,b), who reported reduced post-monsoon rainfall in central and western India due to weakening cyclonic activity and delayed monsoon withdrawal. Globally, pre-monsoon rainfall increases have been noted in regions with warming-induced intensification of convection, such as the Sahel and parts of Southeast Asia, while Mediterranean climates have shown reduced post-summer precipitation trends, similar to Ganganagar’s December trend. This suggests that transitional seasons are becoming more climatically volatile in both hemispheres.
The ITA method provides a robust visual comparison of two climatic periods (1901–1961 vs. 1962–2022), indicating a clear shift toward wetter conditions during the pre- and post-monsoon seasons. This is particularly significant in arid regions like Rajasthan, where even small increases in rainfall can have large hydrological and agricultural impacts. Studies by Jain and Kumar (2010) and others have highlighted a growing seasonal asymmetry in Indian rainfall patterns, where monsoonal rainfall remains stable or slightly increases, but transitional seasons see more pronounced changes. Moreover, Saini et al. (2022) showed that the distribution of rainfall over dryland ecosystem of Rajasthan is highly uneven due to its location and topography; they also evidenced that rainfall changes significantly from region to region and from year to year, with the highest chances of deficiencies resulting from the occurrence of drought. The relatively stable winter and slightly positive annual trends observed in this study are consistent with the findings from the India Meteorological Department (2020) reports, showing minimal changes in winter rainfall across northwest India. Anyway, projections from climate models (CMIP6) indicate a robust future intensification of the Indian summer monsoon, particularly under high-emission scenarios, suggesting potential for increased rainfall, even if regional variability persists (Katzenberger et al., 2021).
The SPI-based assessment from 3-month to 12-month scales illustrates significant historical drought variability, with peak drought years corresponding to known extreme climatic events such as 1918, 1973, and 2002 causing widespread crop failure, fodder shortage and famine-like conditions (Rakhecha, 2018) and serious agricultural stress and crop production fell (FAO, 1973) severely affecting drinking water supplies, agriculture, fodder and rural livelihoods (Bhat, 2006).
The increasing frequency of positive SPI values during the pre-monsoon season (April–June) suggests a reduction in seasonal drought risk, in agreement with observations by Das et al. (2020). Moreover, results match studies in Rajasthan indicating that monsoon rainfall exhibits pronounced interannual variability, whereas pre- and post-monsoon periods show more steady behavior (Saini et al., 2022; Kumar et al., 2022).
However, frequent dry spells in longer-term SPI series (6- and 12-month) suggest persistent hydrological drought risks, particularly during the 1960s, 1990s, and early 2000s. In fact, during these events, the Sri Ganganagar district faced reduced rainfall, stress on water supplies (especially in the tail ends of the canal system) and agricultural disruptions. In particular, as a consequence of the 1999–2001 drought across Rajasthan, major crop failure and reduction in agricultural output, decline in the availability of canal water and surface irrigation in command areas, and especially in tail-end zones of the canal system, out-migration of labor or rural households, caused increased poverty and stress on livelihoods (Narain and Kar, 2005).
Similar multi-seasonal SPI patterns have been reported elsewhere in Rajasthan, with the SPI 12 mapping indicating that Ganganagar and the surrounding districts are among the most drought-prone in the region (Saini et al., 2022; Kumar et al., 2022). Drought trends in other parts of the world, such as North Africa and southwestern USA, also indicate a rise in long-term droughts despite short-term variability, often linked to broader atmospheric circulation changes and warming trends (Vicente-Serrano et al., 2010).
The Mann–Kendall test on the SPI time series confirms a statistically significant drying trend in November (−0.27 SPI/decade) and a mild wetting trend in May (0.08 SPI/decade), while the majority of the other timeframes show non-significant trends. These results further emphasize the increasing seasonal variability and drought sensitivity during the shoulder months of the monsoon. This trend is particularly relevant for agriculture, as post-monsoon rainfall plays a critical role in Rabi crop irrigation in regions like Ganganagar. In the global context, similar analyses in arid zones of Iran, Australia, and Chile reveal comparable patterns—where drying trends are often more evident in transitional seasons and in shorter SPI durations, reflecting higher short-term drought susceptibility (Raziei et al., 2009; Mpelasoka et al., 2008). Overall, this study’s findings highlight a growing divergence in seasonal rainfall and drought behavior in Ganganagar, characterized by an emerging pre-monsoon wetting trend and a persistent post-monsoon drying signal. These trends align with regional patterns observed across semi-arid India and reflect broader global climate tendencies in transitional climatic periods. Continuous monitoring using a combination of traditional and innovative statistical approaches remains crucial for understanding evolving drought risks and supporting climate-resilient planning in vulnerable regions.
While the findings from Ganganagar are consistent with drought patterns in many arid regions, contrasting evidence from other global drylands highlights the spatial complexity of hydroclimatic responses to climate change. For instance, in the Sahel region, studies have reported a partial recovery of rainfall since the 1990s following the severe droughts of the 1970s and 1980s (Nicholson, 2013; Sanogo et al., 2015), which differs from the largely stationary long-term rainfall trend observed in northwest India. Similarly, in semi-arid northern China, Zhang et al. (2022) found that SPI-based analyses indicate a significant wetting trend attributed to large-scale afforestation and monsoon strengthening, contrasting with the localized post-monsoon drying trend detected in this study. In contrast, arid regions of southwestern United States and Australia continue to experience intensified drying and more prolonged droughts linked to rising evapotranspiration and persistent subtropical high-pressure anomalies (Cook et al., 2015). Moreover, Vicente-Serrano et al. (2020) documented that in Mediterranean drylands, despite rising temperatures, drought severity has not uniformly increased, due to compensating seasonal rainfall variability, a dynamic resembling the mixed seasonal trends found in Ganganagar. These global comparisons suggest that while transitional-season rainfall asymmetries are emerging as a common feature across many arid and semi-arid zones, their direction and magnitude are shaped by distinct regional atmospheric and land-surface feedbacks.
Anyway, while this study provides one of the longest district-scale assessments of rainfall variability and drought characteristics in semi-arid northwest India, some methodological and data-related limitations must be acknowledged. First, the analysis relies primarily on precipitation data from the India Meteorological Department (IMD) to compute the Standardized Precipitation Index (SPI). Although SPI is a robust and widely adopted metric, it considers only precipitation and does not explicitly account for other hydroclimatic variables such as temperature, evapotranspiration, soil moisture, or groundwater storage, which are critical to understanding the full spectrum of drought dynamics. The inclusion of indices such as the Standardized Precipitation Evapotranspiration Index (SPEI) could therefore provide a more integrated perspective of drought severity and persistence under changing climatic conditions. Second, the spatial averaging of rainfall across multiple stations, while useful for identifying regional patterns, may obscure localized variations driven by topography, land use, and irrigation practices. Incorporating high-resolution gridded rainfall datasets would improve the spatial representation of drought impacts. Moreover, while this research focused on historical data (1901–2021), future work should extend the analysis to incorporate regional climate projections from the latest CMIP6 models to evaluate the potential evolution of drought risk under different warming scenarios. Coupling such projections with hydrological and crop yield models would enable the assessment of climate change impacts on water resources and agricultural productivity.
As regards the implications of the results of this study, it is important to point out that they involve several sectors. In fact, the SPI-based drought characterization offers a valuable decision-support tool not only for agriculture but also for the integrated management of water, energy, ecosystems, and public welfare. As an example, drought-induced declines in surface water levels affect the hydropower generation potential and increase the region’s reliance on thermal power plants, which in turn depend on scarce cooling water. Hence, SPI-based drought forecasts can guide energy planning and load management during water-deficient periods. Moreover, reduced rainfall and recurrent droughts can intensify land degradation, loss of vegetation cover, and desertification in the Thar fringe. Finally, water scarcity and heat stress during drought years can elevate public health risks, including dehydration, waterborne diseases, and vector-borne outbreaks. The social implications, such as rural-to-urban migration and livelihood insecurity, highlight the need for cross-sector drought resilience policies that integrate health, infrastructure, and social welfare planning.
6 Conclusion
This study provides a detailed investigation of the temporal trends, variability of precipitation, and drought conditions in the Ganganagar district over the 122-year period from 1901 to 2022, using several approaches including the Mann–Kendall trend test, the Innovative Trend Analysis (ITA), and the Standardized Precipitation Index (SPI) at multiple time scales. The non-parametric Mann–Kendall analysis revealed statistically significant changes in monthly rainfall trends. A positive trend was identified in May, suggesting increasing precipitation during the pre-monsoon season, while December showed a significant decreasing trend, indicating growing aridity during the post-monsoon period. The ITA results further highlighted an upward shift in precipitation during the Pre-Monsoon. As regards drought, the SPI analysis demonstrated considerable temporal variability in wet and dry periods across all seasons. A total of 66 drought years were identified for the 3-month SPI, with varying degrees of severity. Similarly, 32, 17, and 18 drought years were recorded for the 6-, 9-, and 12-month SPI timescales, respectively, indicating that both short-term and long-term droughts have been a recurring feature in the region. In particular, the 9- and 12-month SPI analyses revealed notable periods of prolonged drought, particularly in the years 1918, 1968, 1973, 1997–2002, and 2014. The application of the Mann–Kendall test on the SPI values identified a significant drying trend in the 3-month SPI for November, confirming the growing dryness in the post-monsoon season. Conversely, a slight but significant wetting trend was observed in May, aligning with increased pre-monsoon precipitation.
Overall, the findings suggest that the Ganganagar district is experiencing a complex pattern of climatic shifts, with clear signals of seasonal changes in rainfall and evolving drought characteristics. These results evidence the need for region-specific adaptation strategies, particularly focusing on water resource management and agricultural planning in response to increased climate variability and potential intensification of extreme weather events. In fact, although in the Ganganagar district water resource management and agricultural planning such as the “District Irrigation Plan” for Sri Ganganagar and the “Agriculture Contingency Plan” are present, there are still gaps in how these planning frameworks integrate evolving climate risks, non-stationary precipitation patterns, or drought early-warning based on climate indices. As an example, adaptive irrigation scheduling should align with the emerging pre-monsoon wetting and post-monsoon drying trends. Canal water management can be improved through seasonal reallocation, lining, and real-time monitoring to reduce losses. Groundwater recharge and rainwater harvesting during wet SPI phases can buffer future droughts. Establishing SPI-based early warning systems would enable timely crop and irrigation decisions. Promoting drought-tolerant and short-duration crops in the Rabi season can reduce vulnerability. Integrating SPI monitoring into district-level water planning will support proactive, climate-informed governance. Overall, the findings encourage a transition from reactive drought relief to anticipatory, evidence-based water management.
Data availability statement
The raw data supporting the conclusions of this article will be made available by the authors, without undue reservation.
Author contributions
DM: Conceptualization, Data curation, Formal analysis, Writing – review & editing, Writing – original draft. TC: Methodology, Project administration, Software, Supervision, Writing – review & editing, Writing – original draft. SY: Funding acquisition, Project administration, Visualization, Writing – review & editing, Resources, Writing – original draft. VK: Funding acquisition, Resources, Writing – review & editing.
Funding
The author(s) declare that no financial support was received for the research and/or publication of this article.
Conflict of interest
The authors declare that the research was conducted in the absence of any commercial or financial relationships that could be construed as a potential conflict of interest.
Generative AI statement
The authors declare that no Gen AI was used in the creation of this manuscript.
Any alternative text (alt text) provided alongside figures in this article has been generated by Frontiers with the support of artificial intelligence and reasonable efforts have been made to ensure accuracy, including review by the authors wherever possible. If you identify any issues, please contact us.
Publisher’s note
All claims expressed in this article are solely those of the authors and do not necessarily represent those of their affiliated organizations, or those of the publisher, the editors and the reviewers. Any product that may be evaluated in this article, or claim that may be made by its manufacturer, is not guaranteed or endorsed by the publisher.
References
Agarwal, V., Vishvendra Raj Singh, B., Marsh, S., Qin, Z., Sen, A., and Kulhari, K. (2025). Integrated remote sensing for enhanced drought assessment: a multi-index approach in Rajasthan, India. Earth Space Sci. 12:e2024EA003639. doi: 10.1029/2024EA003639
Attri, S. D., and Tyagi, A. (2010). Climate profile of India. New Delhi, India: India Meteorological Department, Ministry of Earth Sciences, Government of India.
Bhat, G. S. (2006). The Indian drought of 2002—a sub-seasonal phenomenon? Q. J. R. Meteorol. Soc. 132, 2583–2602. doi: 10.1256/qj.05.13
Centre for Research on the Epidemiology of Disasters (2003). Disaster data: a balanced perspective. CRED crunch 3. Belgium.
Chuphal, D. S., Kushwaha, A. P., Aadhar, S., and Mishra, V. (2024). Drought atlas of India, 1901–2020. Sci Data 11:7. doi: 10.1038/s41597-023-02856-y
Cook, B. I., Ault, T. R., and Smerdon, J. E. (2015). Unprecedented 21st century drought risk in the American southwest and Central Plains. Sci. Adv. 1:e1400082. doi: 10.1126/sciadv.1400082
Das, J., Gayen, A., Saha, P., and Bhattacharya, S. K. (2020). Meteorological drought analysis using standardized precipitation index over Luni River basin in Rajasthan, India. SN. Appl. Sci. 2:1530. doi: 10.1007/s42452-020-03321-w
Dash, S. K., Jenamani, R. K., Kalsi, S. R., and Panda, S. K. (2009b). Some evidence of climate change in twentieth-century India. Clim. Chang. 85, 299–321. doi: 10.1007/s10584-007-9305-9
Dash, S. K., Kulkarni, M. A., Mohanty, U. C., and Prasad, K. (2009a). Changes in the characteristics of rain events in India. J. Geophys. Res. Atmos. 114:D10109. doi: 10.1029/2008JD010572
Government of Rajasthan (2022). District statistical abstract. Sri Ganganagar: Directorate of Economics and Statistics, Rajasthan.
India Meteorological Department (2020). Rainfall statistics of India 2019. New Delhi, India: India meteorological department, Ministry of Earth Sciences.
Indian Council of Agricultural Research (2015). Vision 2050: Central arid zone research institute (CAZRI). Jodhpur: ICAR-central arid zone research institute.
Intergovernmental Panel on Climate Change (2021). Climate change 2021: The physical science basis. Contribution of working group I to the sixth assessment report of the intergovernmental panel on climate change. Cambridge, UK: Cambridge University Press.
Jain, S. K., and Kumar, V. (2010). Trend analysis of rainfall and temperature data for India. Curr. Sci. 102, 37–49.
Katzenberger, A., Schewe, J., Pongratz, J., and Levermann, A. (2021). Robust increase of Indian monsoon rainfall and its variability under future warming in CMIP6 models. Earth Syst. Dynam. 12, 367–386. doi: 10.5194/esd-12-367-2021
Kumar, U., Singh, N., Meena, S., Jangir, K., and Meena, A. (2022). Analysis of precipitation and drought (1951–2002) for Rajasthan state, India. Appl. Ecol. Environ. Sci. 10, 79–87. doi: 10.12691/aees-10-3-2
Mann, H. B. (1945). Nonparametric tests against trend. Econometrica 13, 245–259. doi: 10.2307/1907187
McKee, TB, Doesken, NJ, and Kleist, J (1993) The relationship of drought frequency and duration to time scales. In: Proceedings of the 8th conference on applied climatology, American Meteorological Society. Anaheim, California, pp. 179–183
Mehta, D., and Yadav, S. M. (2021a). An analysis of rainfall variability and drought over Barmer district of Rajasthan, Northwest India. Water Supply 21, 2505–2517. doi: 10.2166/ws.2021.053
Mehta, D. J., and Yadav, S. M. (2021b). “Trend analysis of drought events over the Sirohi District in Western Rajasthan of India” in International conference on hydraulics, water resources and coastal engineering (Singapore: Springer Nature), 257–269.
Mehta, D. J., and Yadav, S. M. (2022). Long-term trend analysis of climate variables for arid and semi-arid regions of an Indian state Rajasthan. Int. J. Hydrol. Sci. Technol. 13, 191–214. doi: 10.1504/IJHST.2022.120639
Mpelasoka, F. S., Hennessy, K. J., Jones, R. N., and Bates, B. C. (2008). Comparison of suitable drought indices for climate change impacts assessment over Australia. Int. J. Climatol. 28, 1283–1292. doi: 10.1002/joc.1649
Narain, P., and Kar, A. (2005). Drought in Western Rajasthan: Impact, coping mechanism and management strategies. Jodhpur: Central Arid Zone Research Institute, 104.
National Remote Sensing Centre (2019). Wastelands atlas of India 2019 (5th edn). India: Department of Land Resources, Ministry of Rural Development, Government of India.
Nicholson, S. E. (2013). The West African Sahel: a review of recent studies on the rainfall regime and its interannual variability. ISRN Meteorol. 2013:453521. doi: 10.1155/2013/453521
Obasi, G. O. P. (1994). WMO’S role in the international decade for natural disaster reduction. Bull. Am. Meteorol. Soc. 75, 1655–1661. doi: 10.1175/1520-0477(1994)075<1655:WRITID>2.0.CO;2
Patel, P, Mehta, D, Waikhom, S, and Patel, K 2021 Analysis of rainfall variability and drought over Bardoli region. In: International conference on hydraulics, water resources and coastal engineering, Singapore: Springer Nature, pp. 245–255
Planning Commission (1989). Report of the working group on agro-climatic regional planning. New Delhi, India: Government of India.
Rakhecha, P. R. (2018). Hydrometeorology of the Rajasthan desert rainfall. Int. J. Hydrol. 2, 688–694. doi: 10.15406/ijh.2018.02.00144
Ranjan, S. M., Behera, B., and Mishra, S. R. (2013). Impact of climate change on Indian agriculture and its mitigating priorities. Am. J. Environ. Prot. 1, 109–111. doi: 10.12691/env-1-4-6
Raziei, T., Bordi, I., Pereira, L. S., and Santos, J. A. (2009). Spatial patterns and temporal variability of drought in western Iran. Water Resour. Manag. 23, 439–455. doi: 10.1007/s11269-008-9282-4
Rossi, G. (2000). “Drought mitigation measures: a comprehensive framework” in Drought: a global assessment. ed. D. A. Wilhite (London: Routledge), 186–197.
Saini, D., Bhardwaj, P., and Singh, O. (2022). Recent rainfall variability over Rajasthan, India. Theor. Appl. Climatol. 148, 363–381. doi: 10.1007/s00704-021-03904-6
Samantaray, A. K., Ramadas, M., and Panda, R. K. (2022). Changes in drought characteristics based on rainfall pattern drought index and the CMIP6 multi-model ensemble. Agric. Water Manag. 266:107568. doi: 10.1016/j.agwat.2022.107568
Sanogo, S., Fink, A. H., Omotosho, J. A., Ba, A., Redl, R., and Ermert, V. (2015). Spatio-temporal characteristics of the recent rainfall recovery in West Africa. Int. J. Climatol. 35, 4589–4605. doi: 10.1002/joc.4309
Şen, Z. (2012). An innovative trend analysis methodology. J. Hydrol. Eng. 17, 1042–1046. doi: 10.1061/(ASCE)HE.1943-5584.0000556
Şen, Z. (2014). Trend identification simulation and application. J. Hydrol. Eng. 19, 635–642. doi: 10.1061/(ASCE)HE.1943-5584.00008
Shah, R., Bharadiya, N., and Manekar, V. (2015). Drought index computation using standardized precipitation index (SPI) method for Surat district, Gujarat. Aquat. Procedia 4, 1243–1249. doi: 10.1016/j.aqpro.2015.02.162
Thom, H. C. S. (1958). A note on the gamma distribution. Mon. Weather Rev. 86, 117–122. doi: 10.1175/1520-0493(1958)086<0117:ANOTGD>2.0.CO;2
Vicente-Serrano, S. M., Beguería, S., and López-Moreno, J. I. (2010). A multiscalar drought index sensitive to global warming: the standardized precipitation evapotranspiration index. J. Clim. 23, 1696–1718. doi: 10.1175/2009JCLI2909.1
Vicente-Serrano, S. M., Quiring, S. M., Peña-Gallardo, M., Yuan, S., and Domínguez-Castro, F. (2020). A review of environmental droughts: increased risk under global warming? Earth Sci. Rev. 201:102953. doi: 10.1016/j.earscirev.2019.102953
World Meteorological Organization (2006). Drought monitoring and early warning: Concepts, progress and future challenges. WMO-no. 1006. Geneva: World Meteorological Organization.
Wu, H., Hayes, M. J., Wilhite, D. A., and Svoboda, M. D. (2007). The effect of the length of record on the standardized precipitation index calculation. Int. J. Climatol. 27, 721–730. doi: 10.1002/joc.1142
Keywords: climate extremes, drought analysis, precipitation, rainfall variability, Standardized Precipitation Index
Citation: Mehta D, Caloiero T, Yadav S and Kumar V (2025) Rainfall temporal variability and drought analysis by means of the Standardized Precipitation Index in Ganganagar District, Rajasthan, India. Front. Clim. 7:1702356. doi: 10.3389/fclim.2025.1702356
Edited by:
Temitope Oluwaseun Ojo, Obafemi Awolowo University, NigeriaReviewed by:
Taiwo Adesiyan, Middle Tennessee State University, United StatesKeyur Prajapati, Upper Thames River Conservation Authority, Canada
Copyright © 2025 Mehta, Caloiero, Yadav and Kumar. This is an open-access article distributed under the terms of the Creative Commons Attribution License (CC BY). The use, distribution or reproduction in other forums is permitted, provided the original author(s) and the copyright owner(s) are credited and that the original publication in this journal is cited, in accordance with accepted academic practice. No use, distribution or reproduction is permitted which does not comply with these terms.
*Correspondence: Darshan Mehta, YXBfZGFyc2hhbl9tZWh0YUBndHUuZWR1Lmlu; Tommaso Caloiero, dG9tbWFzby5jYWxvaWVyb0BjbnIuaXQ=