 Salomon Obahoundje
 Seifu A. Tilahun
 Petra Schmitter
- 1International Water Management Institute (IWMI), Accra, Ghana
- 2International Water Management Institute, Colombo, Sri Lanka
Introduction: Rainfall regimes across West Africa have undergone substantial transformations over the past four decades, with profound implications for rainfed agriculture and food security. However, limited understanding persists on how rainfall extremes translate into spatially differentiated crop yield responses across agroclimatic zones.
Methods: This study integrates multi-decadal climate datasets with crop yield data from the Global Dataset of Historical Yields (GDHY) to assess the sensitivity of maize, rice, and soybean yields to hydroclimatic extremes across six agroclimatic zones. A sensitivity analysis using an Ordinary Least Squares regression framework quantified crop yield responses to key climatic variations across multi-decadal timescales, agroclimatic zones, and administrative units.
Results: Results reveal marked north–south contrasts in rainfall extremes. In the Sahelian and Sudanian zones, seasonal rainfall increased by 5%–25% since the 1990s and up to 80% in the Northern Sahel by 2024, largely driven by more frequent wet days and intensified rainfall events. These trends heighten flood and erosion risks in northern regions. Conversely, the Guinean zones exhibit stagnating or declining rainfall, coupled with over a 90% increase in consecutive dry days in Central Guinea, signaling intensifying drought stress. Crop yield responses associated with these hydroclimatic patterns. Maize yields increased by 40%–50% in the Sahelian, Sudanian, and parts of the Guinean zones, while rice yields declined by 20%–50% in Nigeria’s Sudanian and Eastern Guinea regions. Soybean showed localized yield gains but remained extremely sensitive to rainfall deficits and heat extremes.
Discussion: By linking rainfall variability to spatially explicit yield responses, this study provides a novel multi-decadal sensitivity framework for evaluating climate impacts on agriculture in West Africa. The findings highlight the urgent need for region-specific, climate-smart adaptation strategies, emphasizing flood and erosion management in the north and drought resilience in the south, to sustain food production under increasing climatic variability.
1 Introduction
With a rapidly growing population and increasing pressure on land resources, the stability of West African agriculture is critical not only for regional food security but also for global sustainable development goals set forth by the Food and Agriculture Organization of the United Nations (FAO) (FAO, 2021). West Africa is one of the most climate-sensitive regions in the world, where livelihoods, food security, and economic stability are tightly coupled to rainfall variability (Sultan and Gaetani, 2016; Nicholson, 2013). In Sub-Saharan Africa, rainfed agriculture accounts for approximately 95%–97% of cultivated land, making the region’s food production highly vulnerable to precipitation variability (Biazin et al., 2012; Calzadilla et al., 2013).
Over recent decades, the region has experienced complex rainfall dynamics, first a recovery from the severe droughts of the 1970s–1980s, and more recently, an increase in the frequency and intensity of extreme precipitation events (Taylor et al., 2017; Panthou et al., 2018). These extremes frequently lead to devastating floods, soil erosion, and crop losses, while rainfall deficits during critical crop growth stages exacerbate drought stress and reduce yields (Obahoundje et al., 2025a,b; Parkes et al., 2018a,b). Understanding the patterns of precipitation extremes and their implications for agricultural production is therefore essential to anticipate risks, design adaptation strategies, and ensure food security in the region.
Several studies have assessed precipitation trends and extremes in West Africa using climate indices such as the total wet-day Precipitation (PRCPTOT), the number of heavy precipitation days (R10mm), the number of very Heavy precipitation days (R20mm), and percentile-based indicators of extreme rainfall intensity (R95P, R99P). For example, Sanogo et al. (2015) analyzed rainfall extremes across West Africa and highlighted spatially heterogeneous trends, with increasing intensity of wet extremes in the Guinea coast and more frequent dry spells in the Sahel. Panthou et al. (2014) demonstrated a significant intensification of extreme rainfall in the Sahel since the 1980s, despite no clear increase in mean annual rainfall. Similarly, Bichet and Diedhiou (2018a,b) reported that short-duration intense rainfall events are becoming more common, raising concerns for agriculture, hydrology, and disaster management.
More recently, Nkrumah et al. (2019) examined daily rainfall regimes in Southern West Africa (1950–2014) and found that, during the first rainy season (April–July), coastal regions have experienced less frequent but more intense rainfall events, while in the second rainy season (September–November), both the frequency and intensity of rainfall have increased, particularly in the eastern part of the region. Together, these studies confirm the growing intensity of rainfall extremes across spatial and temporal scales in West Africa, with higher variability across agroclimatic zones.
Despite these advances, many studies rely on relatively low-intensity thresholds such as R10mm and R20mm, which do not adequately represent heavy and very heavy rainfall days, especially in tropical and coastal zones. These indices tend to underestimate the extremes most relevant for flood risk and agricultural impacts. In contrast, higher thresholds such as R50mm and R100mm provide a more accurate depiction of heavy rainfall and are now widely adopted by operational climate monitoring centers, including AGRHYMET (Regional Center for Training and Application in Agrometeorology and Operational Hydrology), ACMAD (African Centre of Meteorological Applications for Development), and national meteorological services. For instance, AGRHYMET’s operational rainfall briefing (AGRHYMET, 2025) reported significant daily accumulations of 50–100 mm across Guinea, Côte d’Ivoire, Mali, Niger, Nigeria, and Chad, thresholds used to identify zones of elevated hydrological and agricultural risk. Rainfall extremes are major drivers of crop yield variability, shaping soil moisture dynamics, plant physiology, and nutrient availability. Excessive rainfall can induce waterlogging, nutrient leaching, and root stress, while prolonged dry spells limit water supply during critical growth stages, thereby constraining yields (Rosenzweig et al., 2014; Sultan et al., 2019). The rising frequency and intensity of extreme rainfall events across tropical regions have further heightened production risks and yield instability (Du and Xiong, 2024). Yet, in West Africa, few studies have explicitly linked such extremes to crop yield responses, with most focusing on seasonal or annual rainfall totals rather than standardized indices. The sensitivity of key staple crops, such as maize, rice, and soybean, to specific precipitation extremes, including heavy rainfall days, consecutive wet days, and percentile-based indicators, remains poorly understood. Although previous research has acknowledged the effects of excessive rainfall and dry spells on crop losses and growth suppression (Traoré et al., 2011; Diatta et al., 2020), empirical assessments quantifying yield responses to distinct rainfall extremes across agroclimatic zones are still limited.
Agroclimatic zonation, which delineates distinct rainfall regimes and cropping systems from the arid Sahel to the humid Guinea zones, has been largely overlooked in rainfall–yield analyses across West Africa. This gap limits understanding of how rainfall extremes, such as prolonged dry or wet spells, affect crop productivity across diverse agroclimatic and administrative contexts. Recent studies highlight pronounced zonal contrasts in rainfall behavior and emphasize the need for zonal analyses and upscaling approaches to better link climate extremes to agricultural outcomes (van Bussel et al., 2015; Mortey et al., 2023). Research on agroclimatic indices and regional mapping further demonstrates that incorporating zonation is essential for robust agro-hydrological and yield assessments (Dieng et al., 2018). Moreover, growing recognition of decadal variability, as distinct from long-term trends, underscores the importance of multi-decadal, zone-specific analyses to inform agricultural risk management and insurance design (Osgood et al., 2024). Studies linking extreme rainfall and yield shocks in staple crops, such as maize, reaffirm the necessity of accounting for both climatic extremes and spatial heterogeneity when assessing crop impacts (Du and Xiong, 2024).
A further limitation in literature is the time horizon of analysis. While many studies report long-term historical changes or future projections (Lüdecke et al., 2021; Chagnaud et al., 2023), few have focused on decadal-scale variability in precipitation extremes. Yet this shorter-term perspective is crucial for detecting near-term shifts that directly affect farmers, planners, and policymakers (Ekolu et al., 2022; Tefera et al., 2025). Decadal analyses can reveal whether recent changes in rainfall patterns represent transient variability or emerging long-term trends, and how these align with observed variations in crop yields. However, limited attention has been paid to how rainfall extremes translate into yield responses across different agroclimatic zones; this study seeks to address (Awode et al., 2025). Understanding these linkages is vital for advancing climate-smart agricultural planning, improving resource allocation, and strengthening resilience in one of the world’s most climate-vulnerable food systems.
Against this backdrop, the present study aims to fill these gaps by systematically assessing decadal changes in extreme precipitation indices across the main agroclimatic zones of West Africa and linking them to crop yield dynamics for maize, rice, and soybean. This study advances current knowledge by integrating multi-decadal analyses of precipitation extremes with spatially explicit yield dynamics to detect emerging agricultural vulnerability and adaptation hotspots. Specifically, we (i) evaluate the changes in seven widely used precipitation extreme indices (see Table 1 for acronyms and definitions) by comparing three recent decades (1995–2004, 2005–2014, and 2015–2024) against a reference period (1985–1994); (ii) investigate the correlations between these indices and observed crop yields; and (iii) conduct sensitivity analyses to determine which crops are most responsive to specific types of precipitation extremes. By combining multi-decadal climate diagnostics with agroclimatic zonation, this approach provides a more nuanced understanding of where and how rainfall extremes most strongly affect agricultural productivity, offering evidence-based insights for targeted climate adaptation and food security planning in West Africa.
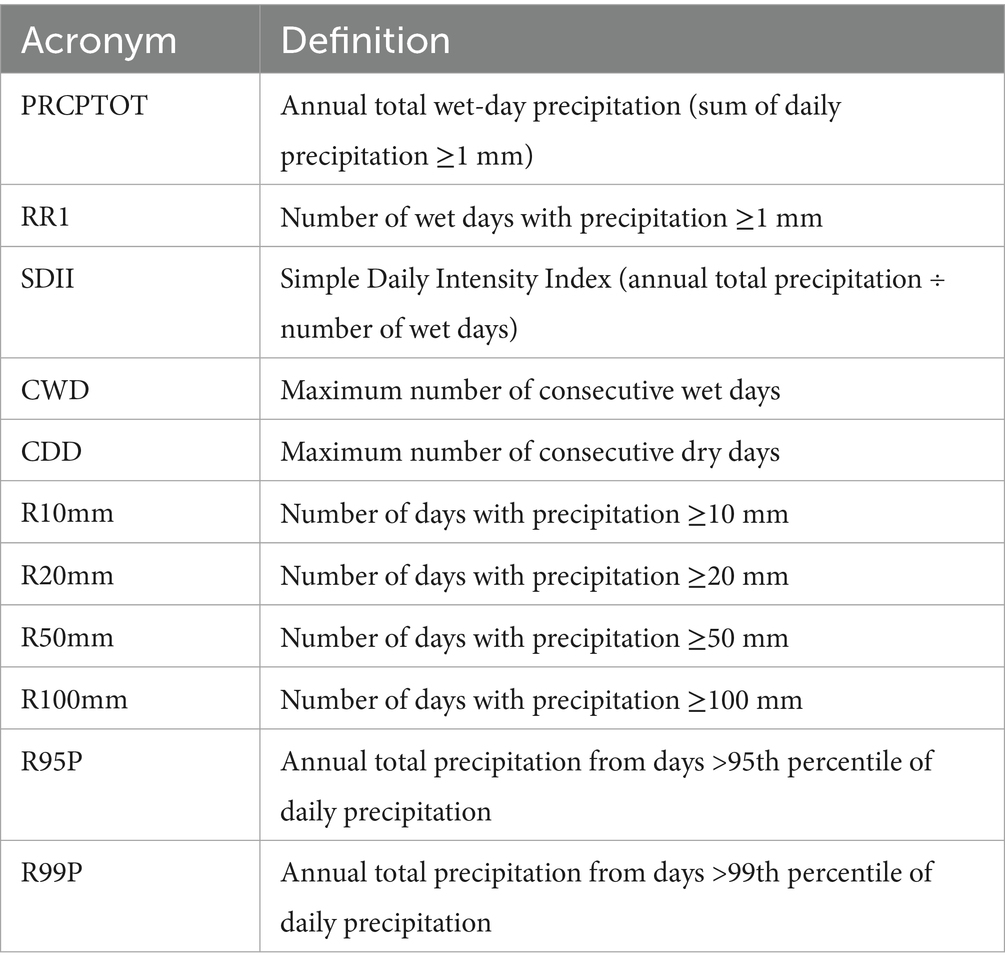
Table 1. Precipitation extreme indices used in this study.
2 Data and methods
2.1 Study area
The study area encompasses several key agroclimatic zones of West Africa, each with distinct climatic characteristics and agricultural practices (see Figure 1). The Northern Sahel (NS), extending from 18°W to 17°E longitude and from 16°N to 19°N latitude, is characterized by warm arid conditions and experiences significant variability in rainfall (decreases southward from 100 to 400 mm/year) peaking from July to September. Moving southward, the Southern Sahel (SS) extends from 18°W to 17°E longitude and from 13°N to 16°N latitude, characterized by warm semi-arid conditions with rainfall varying from June to September (increases southward from 200 to 400 mm/year). The Sahelian zone varies in terms of humidity and better rainfall distribution, allowing for more diverse agricultural activities. These two regions face challenges due to changing rainfall patterns, making them critical areas for studying the impacts of consecutive wet days (CWD).
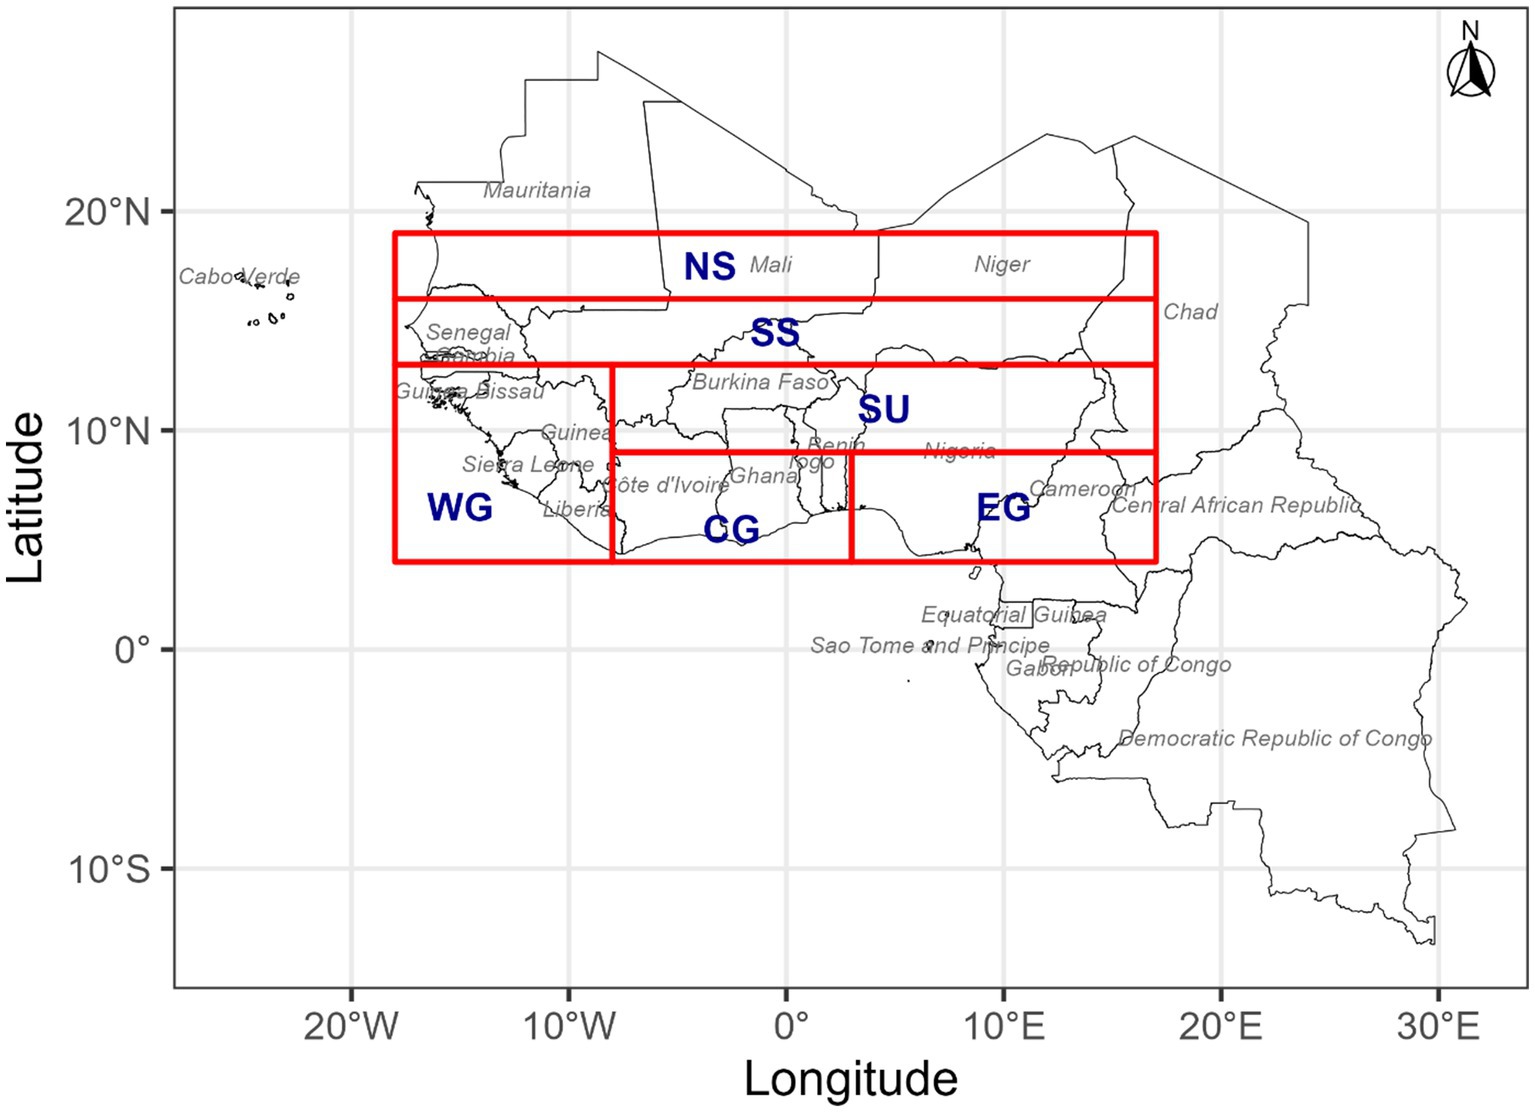
Figure 1. Spatial distribution of West African agro-climatic zones.
Further south, the Sudan (SU) region extending from 8°W to 17°E longitude and from 9°N to 13°N latitude, is notable for a trend toward longer consecutive wet days, which poses risks of flooding and may disrupt traditional farming practices. Adjacent to the coast are the Western Guinea (WG) extending from 18°W to 8°E longitude and from 4°N to 13°N latitude, Central Guinea (CG) extending from 8°W to 3°E longitude and from 4°N to 9°N latitude, and Eastern Guinea (EG) extending from 3°E to 17°E longitude and from 4°N to 9°N latitude zones, where the climate is more humid and conducive to agriculture.
In West Africa, temperature variability shows clear gradients across agroclimatic zones defined by latitude and longitude (Blunden and Boyer, 2024). The NS is characterized by extreme heat, with hot-season peaks of 36 °C–42 °C and cooler-season lows of 15 °C–21 °C. The SS is slightly milder, with mean annual temperatures typically between 26 °C and 30 °C. In the SU zone, conditions moderate further, ranging from monthly lows of 18 °C–21 °C to highs of 30 °C–33 °C. The WG zone, under tropical savanna influence, records highs of 30 °C–33 °C and colder-season lows near 12 °C. In CG, interior areas experience strong diurnal and seasonal variation, with means of 24 °C–30 °C, dry-season peaks up to 38 °C–40 °C, and lows of 11 °C–17 °C. Similarly, EG registers highs of 30–33 °C and lows between 14 °C and 21 °C, while the coastal south reaches 32 °C–34 °C, with occasional peaks up to 40 °C but moderated nighttime cooling inland. These spatial contrasts underscore the strong north–south thermal gradient in the region, shaping agroecological conditions and water demand.
Soil moisture in West Africa exhibits strong spatial and temporal variability, largely shaped by the north–south rainfall and temperature gradients (Jung et al., 2019). In the NS, very low and erratic rainfall combined with high evaporative demand leads to persistently low soil moisture, limiting growing season length and constraining crop production (Nicholson, 2013). The SS receives slightly more rainfall, yet soil moisture remains highly variable and sensitive to intra-seasonal dry spells, often causing mid-season water stress for crops. In the SU zone, wetter conditions support higher soil moisture retention, although variability is still marked by a pronounced wet and dry season cycle (Sultan and Gaetani, 2016). Moving southward, the Guinea zones (4–13°N), including Western, Central, and Eastern Guinea, experience higher annual rainfall and relatively stable soil moisture, supporting longer growing seasons and multiple cropping opportunities (Sylla et al., 2016). However, even in these wetter regions, soil moisture dynamics are influenced by land cover, soil type, and the timing of rainfall onset and cessation, making localized variability important for agricultural planning (Taylor et al., 2017). This gradient highlights how soil water availability strongly governs agricultural potential, with rainfed farming systems in drier northern zones being more vulnerable to moisture deficits than those in the humid south. Since intra-annual variations in rainfall and temperature significantly influence the timing, type, and location of crop cultivation, as well as the extent of arable land and overall yields, understanding these spatial and temporal gradients is crucial for enhancing the resilience of rainfed agriculture across West African agroecological zones.
2.2 Data
The precipitation data for this study were obtained from the Climate Hazards Group InfraRed Precipitation with Stations (CHIRPS) dataset, which provides high-resolution (0.05°) rainfall estimates from 1981 to the present (Funk et al., 2015). Unlike the IMERG product, which begins only in 2000 and is therefore less suitable for multi-decadal trend analysis (Diedhiou et al., 2024), CHIRPS offers a temporally consistent dataset that fully aligns with the study period. In addition, CHIRPS applies gauge correction by blending satellite-derived precipitation estimates with in-situ rain gauge observations. This feature is particularly important in regions such as West Africa, where satellite-only products often encounter challenges due to convective rainfall systems and sparse radar coverage.
CHIRPS is considered one of the most reliable datasets for hydroclimatic monitoring and agricultural applications, particularly in areas with limited ground-based observations (Du et al., 2024; Verdin et al., 2020). Its robustness has been demonstrated in drought monitoring, famine early warning, and crop modeling. By integrating long-term historical records with near-real-time updates, CHIRPS ensures both temporal continuity and spatial accuracy, making it a suitable choice for analyzing climate variability and agricultural productivity. Importantly, CHIRPS has shown strong performance in West Africa, with multiple validation studies confirming its ability to capture rainfall variability and extremes across diverse hydroclimatic zones, across scales, and in broader regional evaluations (Mekonnen et al., 2023; Obahoundje et al., 2020; Didi et al., 2020).
Temperature data were sourced from the Climate Hazards InfraRed Temperature with Stations (CHIRTS) dataset, which follows the development strategy of CHIRPS to provide quasi-global, high-resolution (0.05°) temperature records (Funk et al., 2019). CHIRTS integrates satellite-derived infrared data with ground-based observations, improving accuracy in data-scarce regions and enabling its application in climate impact studies. In West Africa, validation studies have shown that CHIRTS performs reliably against station observations, effectively capturing both mean temperature variability and extreme heat events, which makes it particularly useful for regional climate assessments (Verdin et al., 2020; Parsons et al., 2022).
For crop yield, the study used the Global Dataset of Historical Yields (GDHY), a harmonized dataset providing gridded yield information for major crops at a global scale with a spatial resolution of 0.5°× 0.5 and annual temporal coverage from 1981 to 2016 (Iizumi and Sakai, 2020). This dataset is widely used in agricultural and climate impact assessments due to its standardized format and compatibility with climate datasets. In West Africa, GDHY has been shown to provide consistent yield estimates when compared with subnational agricultural statistics, supporting its reliability for crop-climate impact assessments in data-scarce environments (Lontsi Saadio et al., 2022; Lee et al., 2025). The combination of CHIRPS, CHIRTS, and GDHY ensures consistency, spatial detail, and global coverage, making them highly suitable for integrated assessments of climate–agriculture interactions.
2.3 Methodology
2.3.1 Extreme rainfall indices analysis
The overall methodological framework of the study, including data processing, computation of climate indices, and sensitivity analysis, is illustrated in Figure 2. Extreme rainfall indices, including PRCPTOT, RR1, SDII, CWD, CDD, R10mm, R20mm, R50mm, R100mm, R95p, and R99p, were computed following the definitions of the Expert Team on Climate Change Detection and Indices (ETCCDI) (Zhang et al., 2011). These indices were derived using daily precipitation data from the CHIRPS dataset. The indices were calculated for the full study period and subsequently aggregated to obtain decadal means. Changes were then assessed relative to the reference period 1985–1994. Specifically, the anomalies were computed for the decades 1995–2004, 2005–2014, and 2015–2024, relative to this baseline.
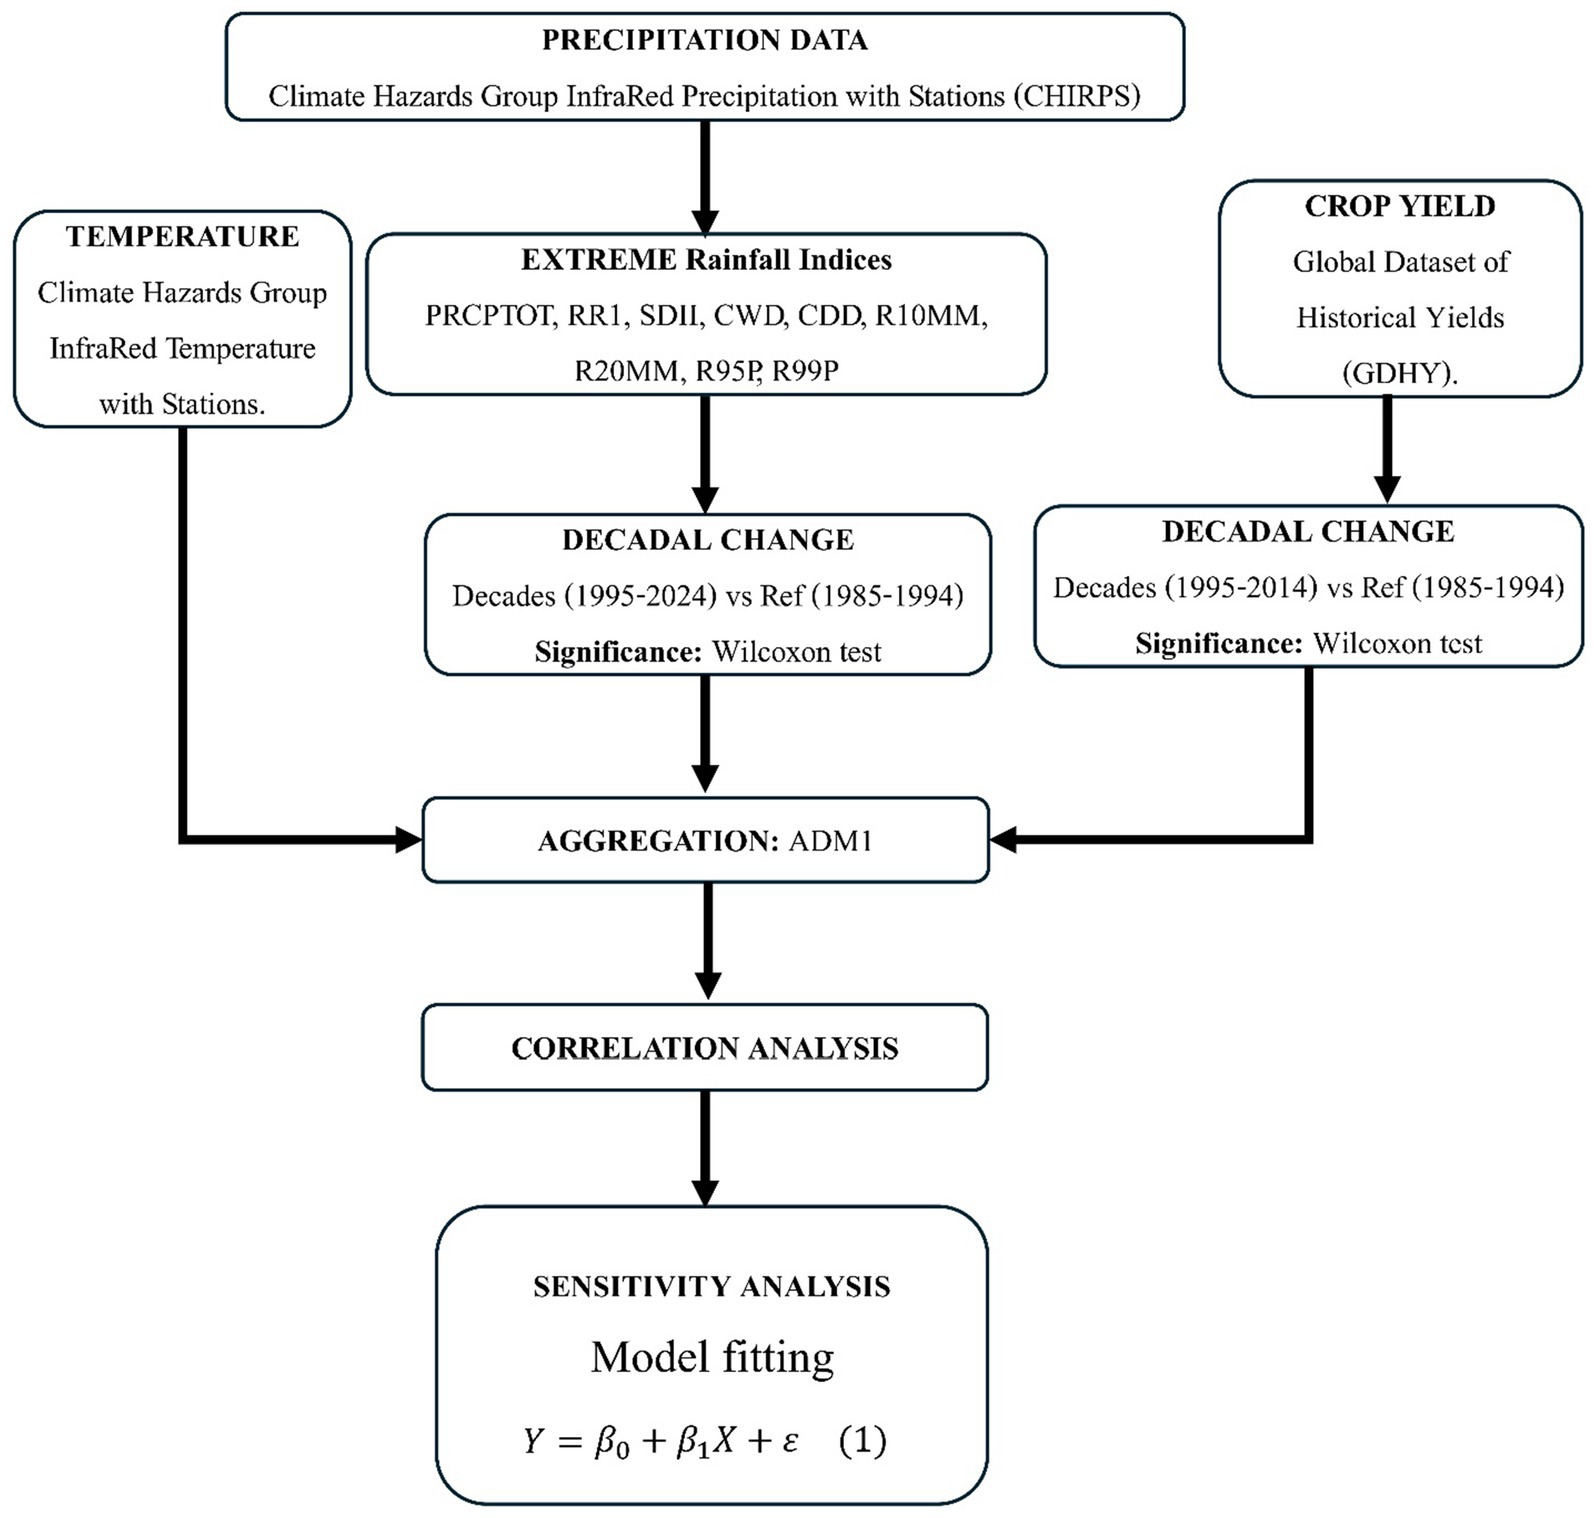
Figure 2. Methodological framework for assessing crop yield sensitivity to climate extremes.
2.3.2 Crop yield analysis
For crop yield, the GDHY dataset was rescaled to match the 5 km spatial resolution of CHIRPS to ensure consistency across datasets. Decadal changes in yield were similarly computed. Both climate indices and yield data were then spatially aggregated at the second administrative unit (Adm2) level to facilitate regionally comparable analysis. The association between crop yields and climate variables was examined across the three decades (1985–1994, 1995–2004, 2005–2014). These variables included extreme precipitation indices and extreme temperatures (minimum and maximum). The correlation between extreme rainfall indices and crop yields was assessed at the 95% confidence level. Correlation analysis was used to quantify the strength and direction of these associational relationships. In addition, a sensitivity analysis was performed to evaluate how crop yields respond to variability in climate extremes. This approach helped identify which climatic factors exert the strongest influence on agricultural productivity at the subnational scale. Given that the GDHY crop yield data are available only for the period 1981–2016, correlations between extreme rainfall and crop yields were computed over this overlapping timeframe. Accordingly, the response of crop yields to extreme rainfall was evaluated for the three decades 1985–1994, 1995–2004, and 2005–2014.
2.3.3 Sensitivity of crop yield to extreme climate
To assess the sensitivity of crop yield to climate extremes, we applied a multi-method sensitivity analysis framework combining linear regression, variance decomposition, and machine learning approaches. Before conducting the sensitivity analysis, multicollinearity and autocorrelation in the regression models were carefully checked to ensure reliable results. The analysis focused on PRCPTOT, SDII, CDD, CWD, Tasmin, and Tasmax. RR1 was excluded because it was strongly correlated with both PRCPTOT and SDII. Similarly, extreme rainfall indices R10mm and R20mm were correlated with PRCPTOT, while R50mm, R100mm, R95p, and R99p showed no correlation with crop yield and were therefore left out. Average temperature (Tmean) was also excluded due to strong correlations with both minimum and maximum temperatures. Given that the crop yield data are available only for 1981–2016, the sensitivity of crop yields to extreme rainfall was evaluated over these common 1985–1994, 1995–2004 decades.
A sensitivity analysis was conducted to assess the responsiveness of crop yields to variations in key climatic variables. Following a regression-based framework widely used in climate–agriculture impact assessments (Lobell and Burke, 2010; Sultan and Gaetani, 2016), we employed Ordinary Least Squares (OLS) regression to quantify the linear relationship between crop yields and individual climate variables (Equation 1). For each administrative unit and study period, the model was expressed as:
Where Y represents crop yield, X denotes a climatic predictor (e.g., precipitation, temperature, ect.), and 𝛽1 is the sensitivity coefficient indicating the direction and magnitude of the crop’s response, and 𝛽0 indicates the baseline or average yield when the climatic variable takes a value of zero (after accounting for scaling or centering). OLS was chosen over machine learning methods such as random forest (Obahoundje et al., 2025a), for its statistical robustness, interpretability, and suitability for estimating marginal effects while minimizing residual variance. It is a standard first-order approach in empirical impact assessments, particularly when data limitations preclude more complex nonlinear or process-based models (Schlenker and Roberts, 2009; Lobell and Burke, 2010). The analysis was done using a custom function that iteratively fitted regressions for each crop–climate pair after removing missing values and excluding cases with fewer than three valid observations. Statistically significant sensitivities (p < 0.05) were retained to identify the climatic drivers most strongly influencing crop yields across space and time.
3 Results
3.1 Monthly variability of rainfall and rainfall extremes
Figures 3, 4 illustrate the intra-annual and monthly variability of rainfall and extreme rainfall indices across six West African agro-climatic zones, Northern Sahel (NS), Southern Sahel (SS), Sudan (SU), Western Guinea (WG), Central Guinea (CG), and Eastern Guinea (EG), over four decades (1985–1994, 1995–2004, 2005–2014, and 2015–2024), with an additional focus on 2024. A distinct seasonal pattern is evident across all regions, reflecting the influence of the West African Monsoon (WAM) and the Intertropical Convergence Zone (ITCZ).
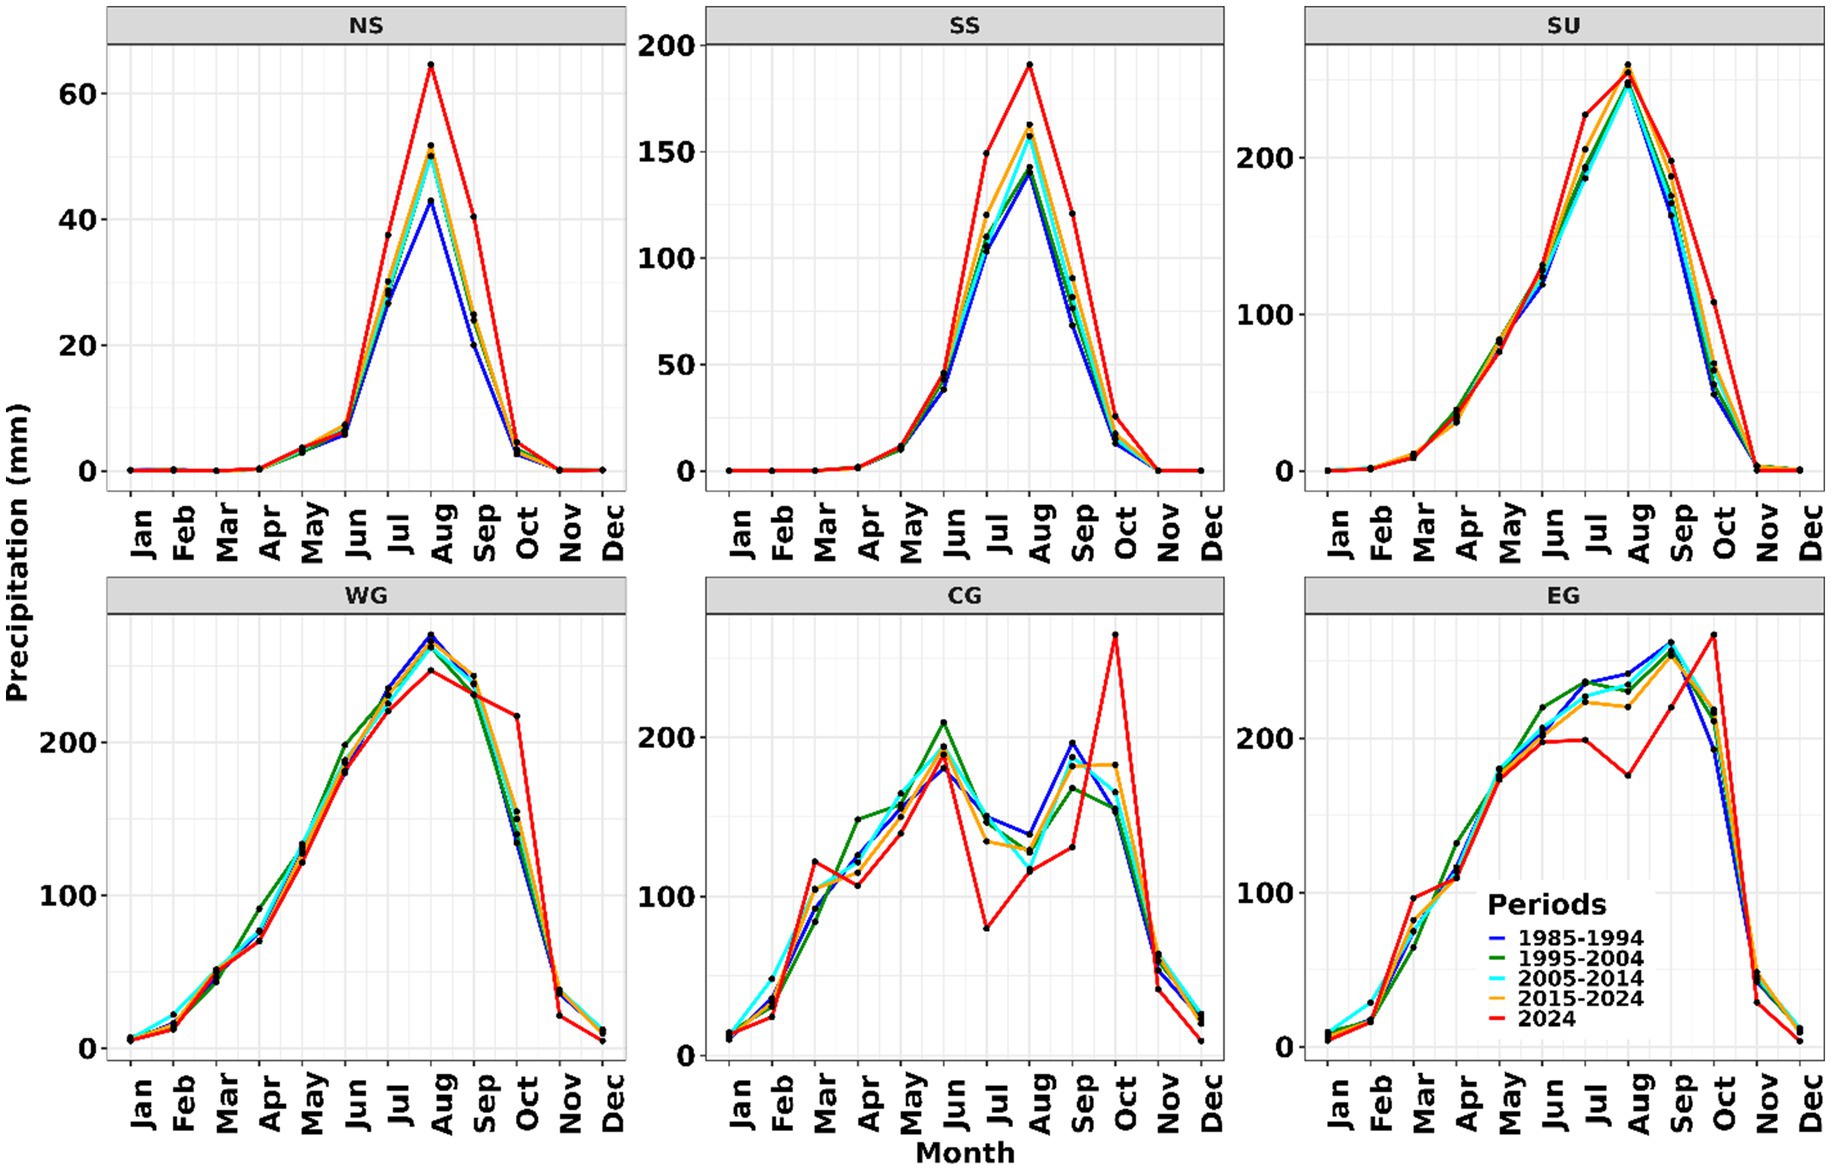
Figure 3. Intra-annual rainfall variability and decadal shifts across agro-climatic zones in West Africa.
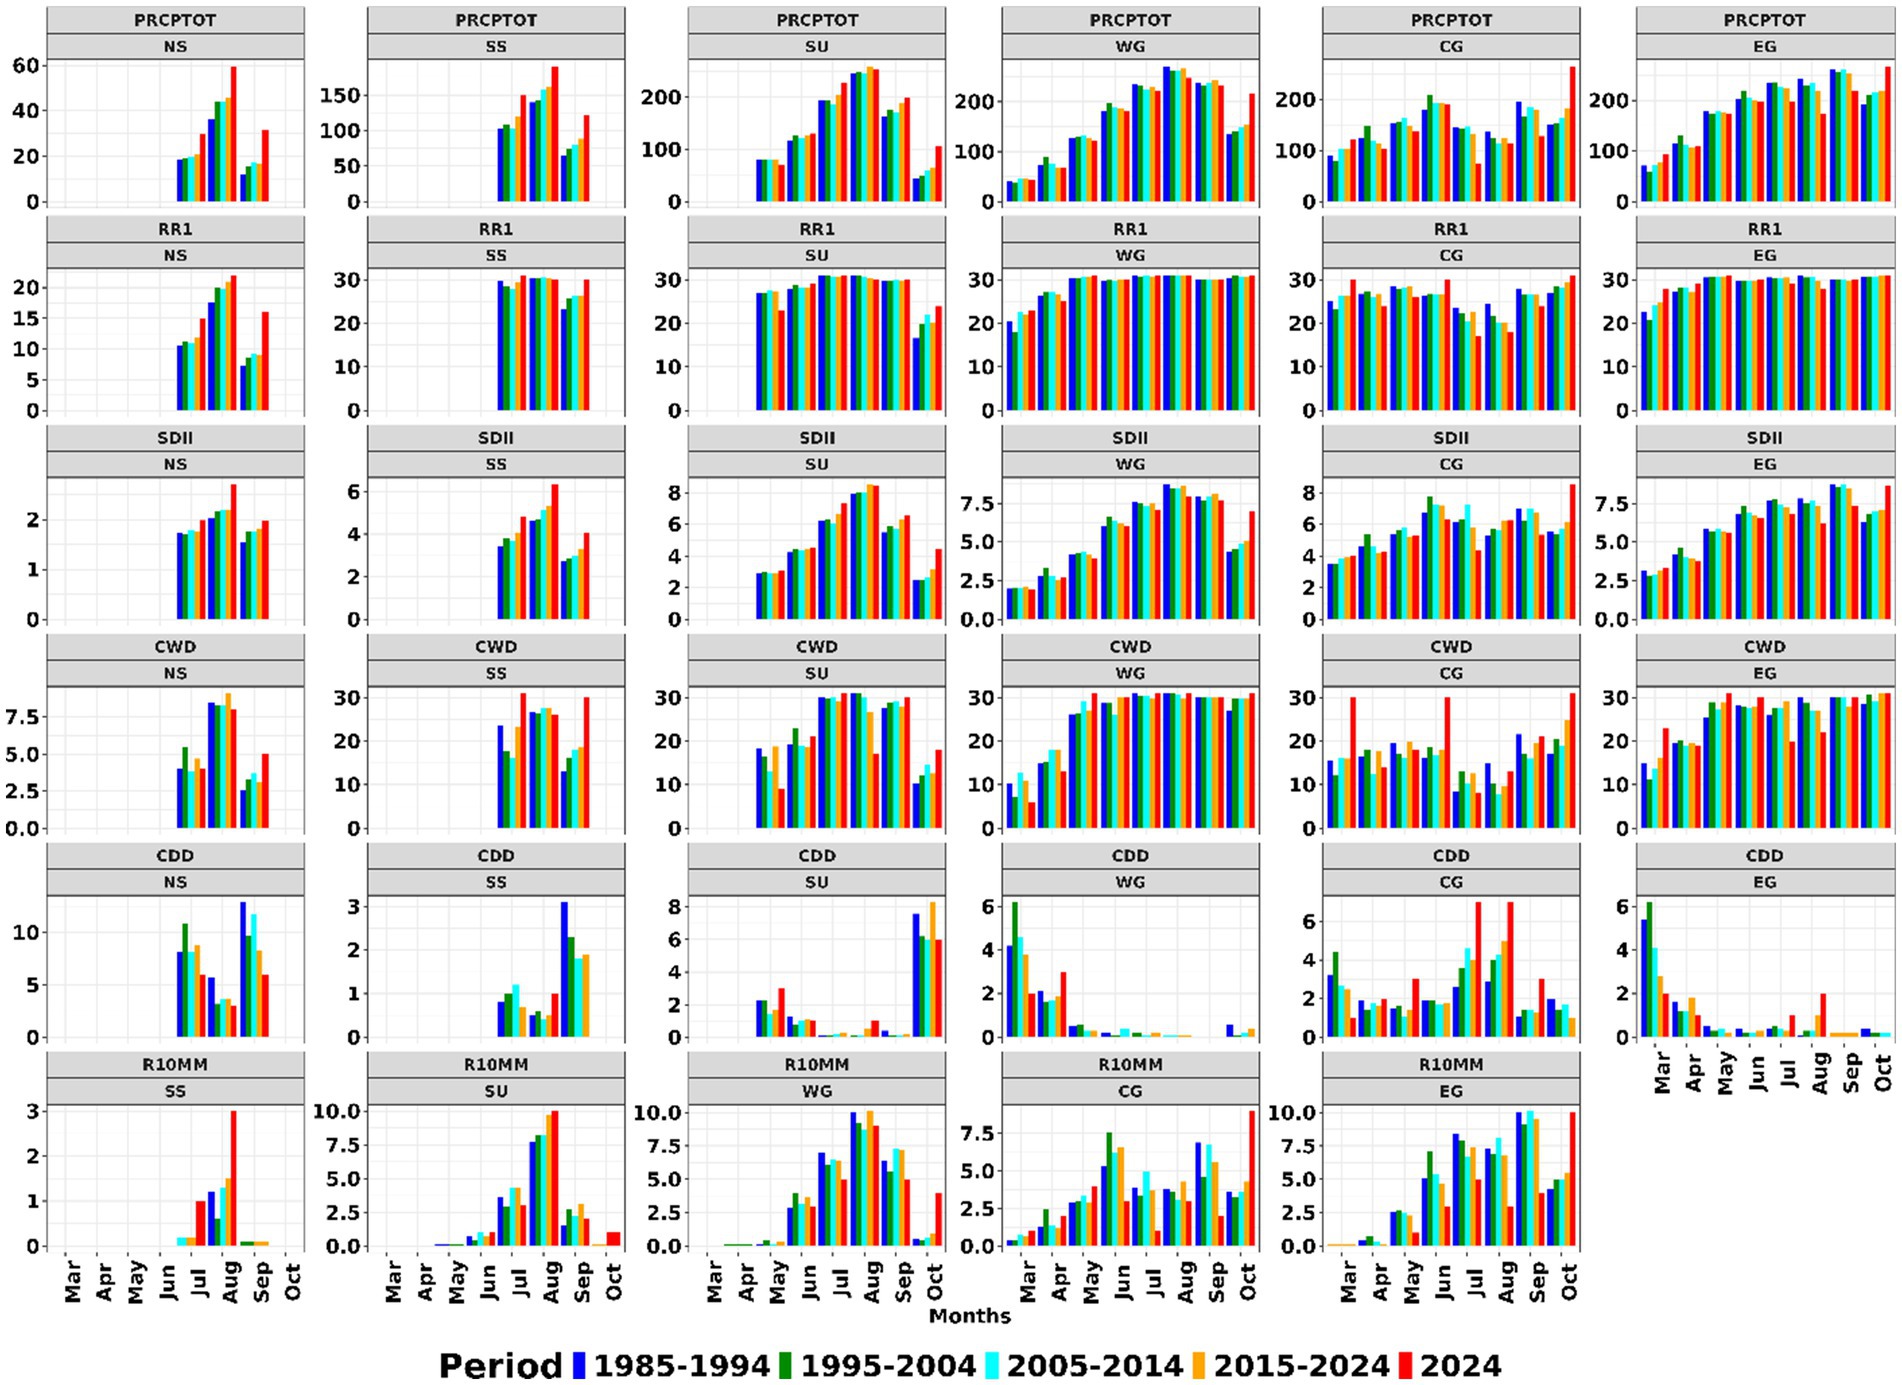
Figure 4. Monthly variability of rainfall extreme indices across West African agro-climatic zones (1985–2024).
In the Sahelian zones (NS, SS, SU), a unimodal rainfall regime dominates, extending from July to September (JAS). The lowest rainfall totals are recorded in NS, followed by SS, with August representing the rainfall peak. Rainfall in these zones has gradually intensified across recent decades, particularly in 2015–2024 and in 2024, suggesting a strengthening and potential northward shift of the monsoon system. Correspondingly, extreme rainfall indices show significant increases in total rainfall (PRCPTOT), frequency of wet days (RR1), and rainfall intensity (SDII) during the core monsoon months. The duration of consecutive wet days (CWD) has lengthened, from approximately 2.5 to 3 days in NS, 13–18 days in SS, and 27–29 days in SU, indicating more persistent wet spells. Conversely, consecutive dry days (CDD) have declined during the rainy season but remain relatively high in SU during October (6–8 days). The frequency of heavy rainfall days (R10mm) has also increased, particularly in SS (July–August) and SU (August–September), pointing to stronger monsoonal extremes.
In the Guinean zones (WG, CG, and EG), the rainfall regime reflects coastal and ITCZ influences, with both unimodal and bimodal patterns. WG exhibits a broad unimodal peak from May to September, showing generally stable rainfall, although a slight decline in 2024 hints at emerging variability. Both CG and EG display bimodal patterns, with early-season peaks in May–June and late-season peaks in September–October. In CG, 2024 shows an unusually strong October peak, while EG records a mid-season decline, suggesting more frequent intra-seasonal dry spells. Rainfall extremes in these regions follow similar seasonal structures: PRCPTOT and RR1 increase notably in October in WG and in both March and October in CG and EG. SDII also rises in March and October, indicating intensification of early- and late-season rainfall events. CWD increases in October in CG, while CDD rises during JAS in CG and in August in EG, highlighting growing rainfall irregularity. Heavy rainfall days (R10mm) have increased during early and late-season months (March, June, and October) but declined during mid-season peaks (July–August).
Overall, the results reveal progressive intensification and temporal redistribution of rainfall and rainfall extremes across West Africa. Increases in PRCPTOT, SDII, R10mm, and CWD, alongside a decline in CDD, suggest a shift toward shorter, more intense rainfall episodes and evolving seasonal timing. These patterns enhance short-term water availability but simultaneously elevate the risks of flooding and mid-season droughts.
Building upon the analysis of intra-annual and monthly rainfall variability, it is essential to further examine how these changing patterns manifest in rainfall extremes. Understanding the spatial and temporal evolution of extreme rainfall indices provides critical insights into the frequency, intensity, and persistence of hydrological events that directly influence soil moisture regimes, crop growth cycles, and yield outcomes across West Africa’s agro-climatic zones.
3.2 Change in extreme rainfall indices
3.2.1 Spatio-temporal dynamics of rainfall extremes relevant to agricultural productivity
The spatio-temporal maps (Figure 5) reveal pronounced shifts in extreme rainfall indices across West Africa from 1995 to 2024 relative to the 1985–1994 baseline. Both total rainfall (PRCPTOT) and the frequency of wet days (RR1) have notably increased, by approximately 1% to over 50%, across much of the Northern Sudanian (NS), Sudanian (SS), and Sub-Humid (SU) zones, reflecting wetter conditions and more frequent rainfall events. However, localized declines (−1% to −20%) are observed in parts of the Guinean zones, particularly in WG (Guinea, northern Liberia, northern Sierra Leone), CG (central-western Ghana and central-eastern Côte d’Ivoire), and EG (southern Nigeria), underscoring spatial disparities in rainfall trends. The Simple Daily Intensity Index (SDII) exhibits a marked decline in the NS and isolated portions of the Guinean zone during 2015–2024, whereas notable increases occur in the SS, SU, and localized southern areas of CG and EG. These rising SDII values in selected regions suggest an intensification of rainfall events, with implications for flood risk and runoff generation.
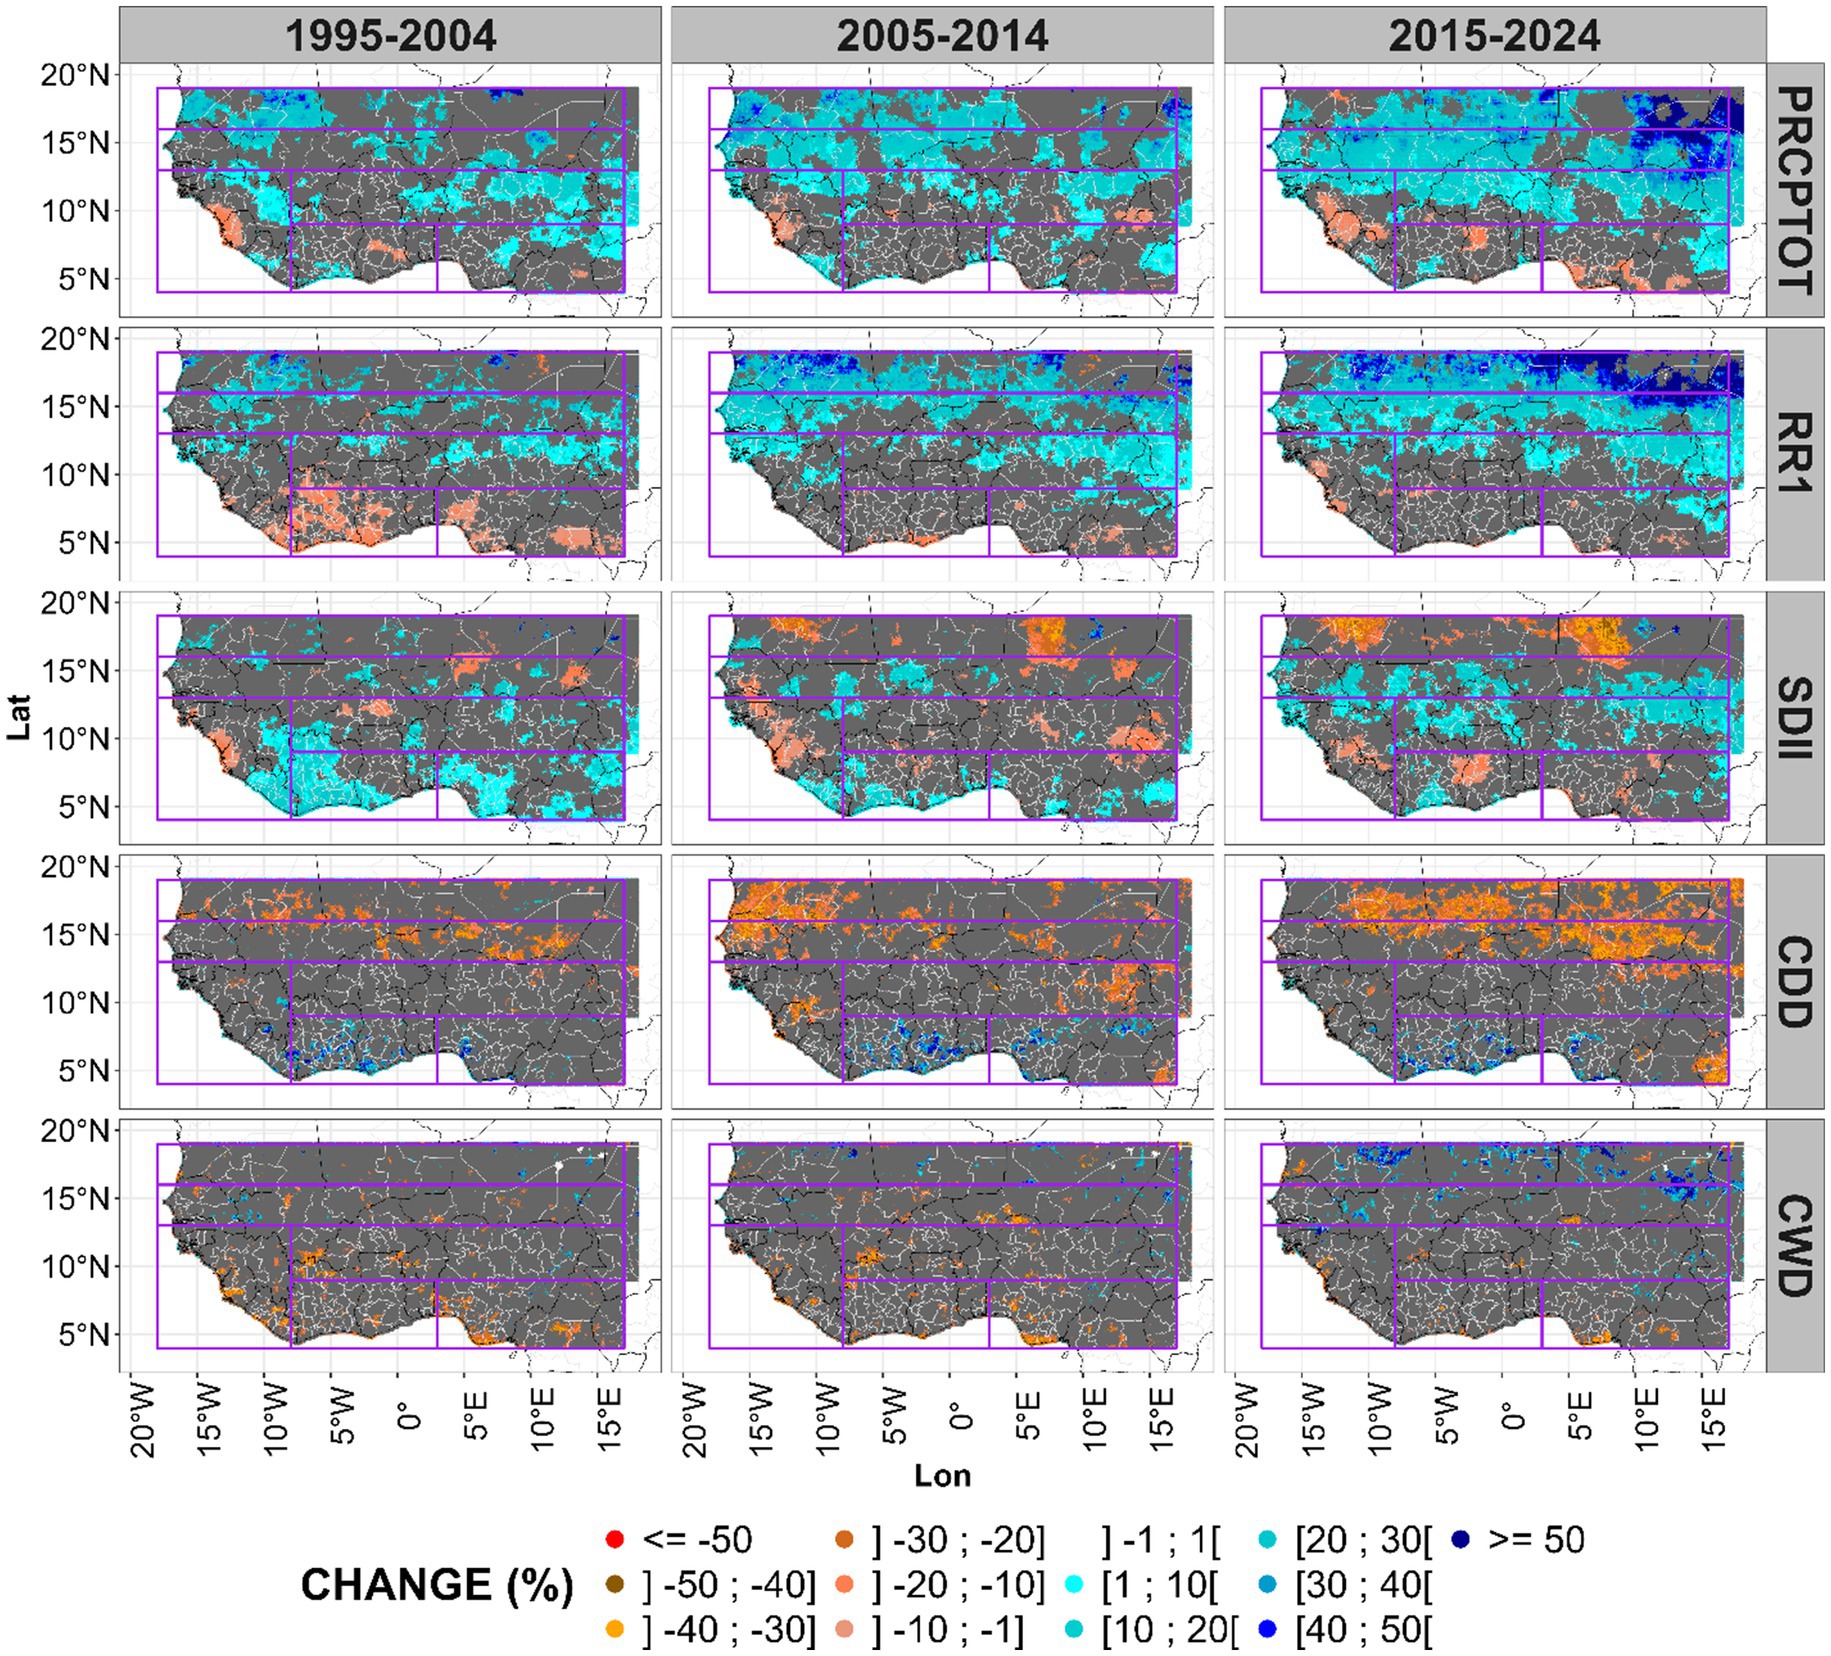
Figure 5. Decadal shifts in rainfall extremes over West Africa (1995–2024 vs. 1985–1994). Gray areas indicate regions where changes are not statistically significant at the 95% confidence level based on the Wilcoxon test.
Shifts in the duration of wet and dry spells are also evident across the study period. The Consecutive Wet Days (CWD) index increased substantially, by more than 50%, in the Sahelian regions (NS and SS), indicating longer periods of continuous rainfall and a potential extension of the growing season. In contrast, this pattern is less consistent in the Guinean zones. The Consecutive Dry Days (CDD) index declined significantly (10%–40%) across NS and SS, pointing to shorter dry spells and enhanced soil moisture persistence in northern regions. Conversely, CDD increases in parts of CG (southern Ghana and Côte d’Ivoire) and EG (southern Nigeria) reflect persistent rainfall variability and the potential for intermittent dry conditions within otherwise humid zones.
3.2.2 Spatio-temporal dynamics and trends in heavy and very heavy rainfall extremes
Figure 6 presents the spatio-temporal evolution of six extreme rainfall indices, four threshold-based (R10mm, R20mm, R50mm, and R100mm) and two percentile-based (R95p and R99p), across West Africa during three successive decades (1995–2004, 2005–2014, and 2015–2024), relative to the 1985–1994 baseline. The results reveal a pronounced intensification of R10mm and R20mm, particularly in the Southern Sahel (SS), encompassing central Senegal, central Mali, northern Burkina Faso, and eastern and western Niger, with increases ranging from 40% to over 50%. Similar upward trends are observed across parts of the Sudanian zone (including south-eastern Mali, southern Burkina Faso, north-western Ghana, southern Niger, north-eastern Benin, and both north-western and north-eastern Nigeria) and the northern West Guinean (WG) zone (southern Senegal, Guinea-Bissau, and northern Guinea), where changes span from 10% to above 50%. These trends, most pronounced during 2015–2024, suggest a regional shift toward more frequent moderate and heavy rainfall events across Sahelian and Guinean environments. However, localized declines in R10mm and R20mm emerge during the same period, particularly in the northern Sahel (southern Mauritania and central Niger, −40% to below −50%) and in parts of the Guinean zone, including Guinea, Liberia, and Sierra Leone (WG), central-western Ghana and central-eastern Côte d’Ivoire (CG), and southern Nigeria (EG), with reductions between −10% and −30%.
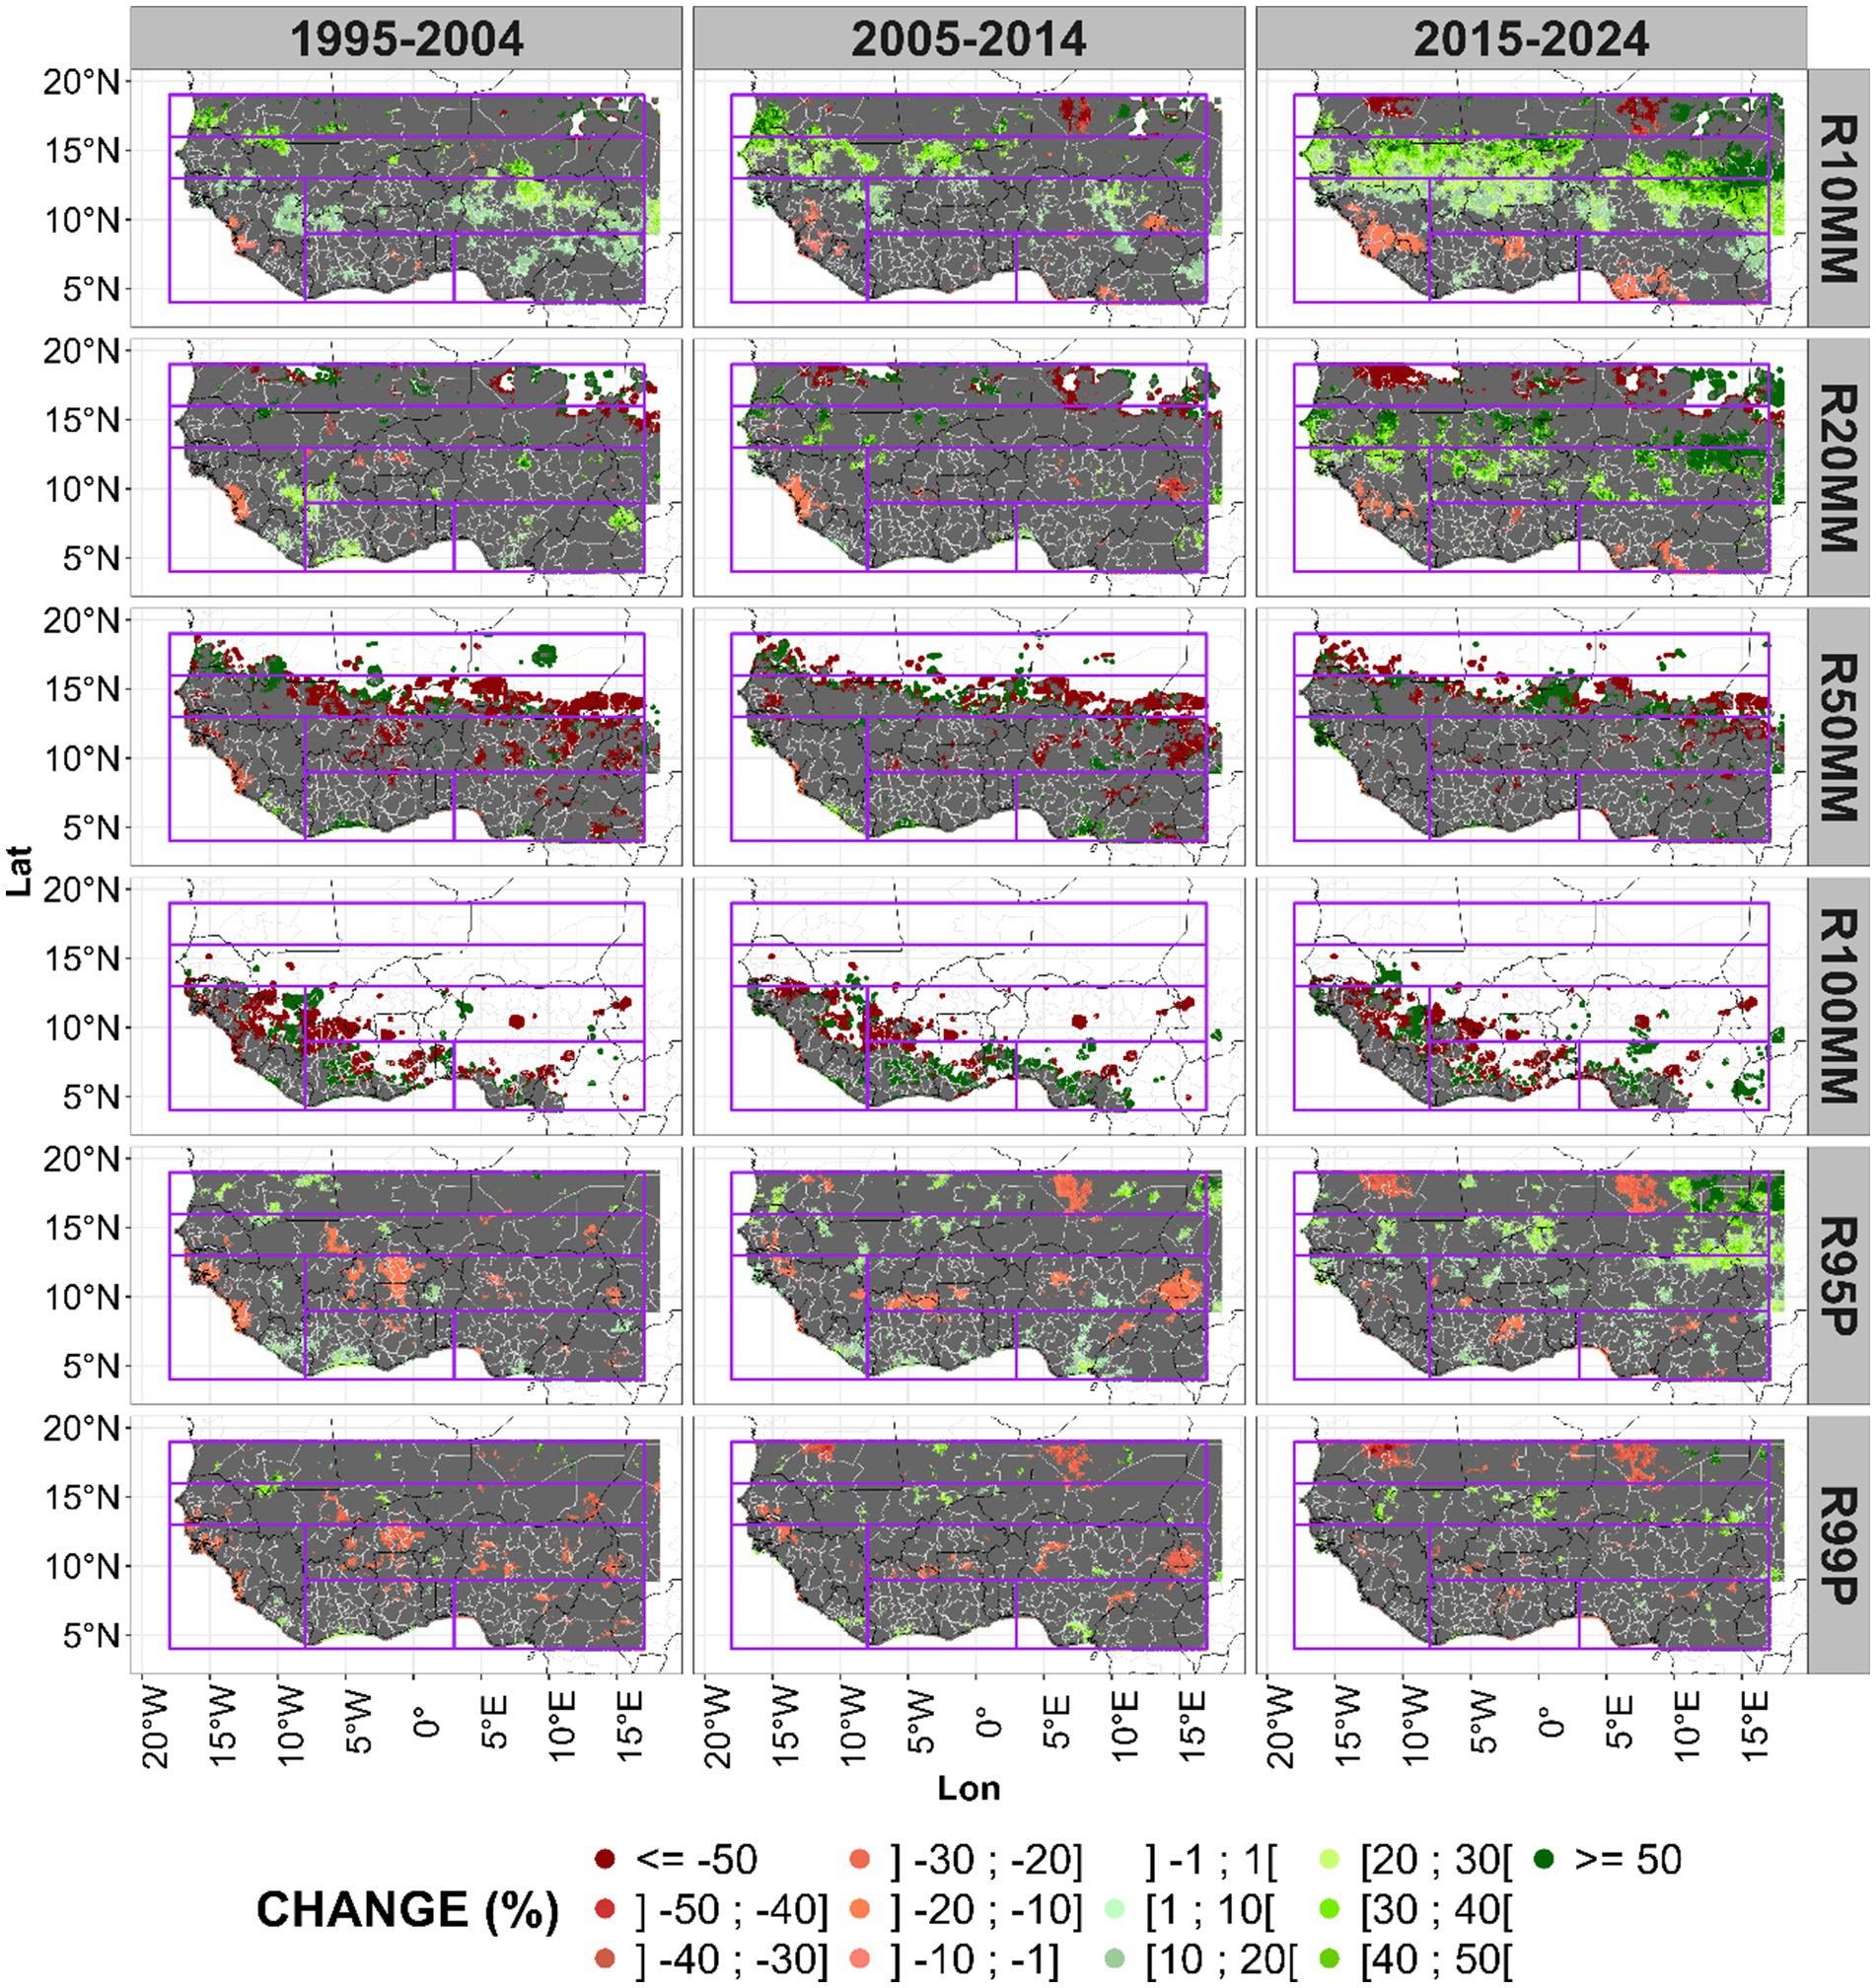
Figure 6. Decadal shifts in threshold-based and percentile-based precipitation extremes over West Africa (1995–2024 vs. 1985–1994). Gray areas indicate regions where changes are not statistically significant at the 95% confidence level based on the Wilcoxon test.
The R50mm index exhibits distinct decadal fluctuations. Declines exceeding 50% are observed in several areas of the SS, SU, CG (central Ghana), WG (western Guinea), and EG (eastern Nigeria) during the 1995–2014 period, followed by a marked resurgence (>50%) in coastal Guinea (WG, CG, EG) and inland regions of the SS and SU during 2015–2024. Similarly, R100mm shows substantial increases (>50%) along the Guinean coast, underscoring a growing concentration of very heavy rainfall events in already humid zones. These patterns suggest a spatial redistribution of intense rainfall thresholds, with coastal amplification in earlier decades and a northward extension of heavy rainfall in the most recent decade. Such intensification of R50mm and R100mm events may exacerbate flooding and erosion risks, particularly in low-lying agricultural systems and fragile landscapes.
In contrast, the percentile-based indices (R95p and R99p), which represent the contribution of extremely wet days to total rainfall, display more spatially heterogeneous patterns. Moderate declines (−10% to −20%) occur in parts of the Northern Sahel (central Mauritania and central Niger), Southern Sahel (central Senegal), and Sudanian zone (northern Côte d’Ivoire, Ghana, and Nigeria), as well as in WG (southern Senegal, Guinea-Bissau, and central Guinea) and EG (central-eastern Nigeria). Conversely, increases (10%–30%) are recorded in NS (southern Mauritania, northern Senegal, central Mali, and central-eastern Niger), SS (southern Mali), WG (central Liberia), CG (central-southern Côte d’Ivoire and Ghana), and EG (south-eastern Nigeria). These contrasting responses indicate a redistribution of rainfall extremes, with intensification across Sahelian and coastal belts but diminishing contributions of the most extreme events (R99p) in parts of central West Africa. Collectively, these findings highlight a continued intensification and shifting spatial footprint of both moderate and extreme precipitation thresholds, with implications for water management, soil conservation, and agricultural resilience across the region.
3.2.3 Decadal change in dry and wet spells across the agro-climatic zone
Figure 7 illustrates the decadal changes in consecutive dry days (CDD) across West Africa, categorized by spell durations of 2–7, 8–14, 15–21, and more than 21 days, over the periods 1995–2004, 2005–2014, and 2015–2024, relative to the 1985–1994 baseline. The results reveal a pronounced increase in short dry spells (2–7 days) across the northern Sahel (southern Mauritania, central Mali, and central–western Niger), the Sudanian zone (notably eastern Niger), and parts of the Sudano-Guinean and West Guinean regions (including northern Benin, Nigeria, western Guinea-Bissau, Sierra Leone, and Liberia). Conversely, a decline in short dry spells is observed in central and southeastern Senegal. These shifts, particularly evident during 2005–2014, signal increasing rainfall instability. While short dry spells have become more frequent in the Sahelian and Sudanian belts, they also appear shorter in duration during the most recent decade.
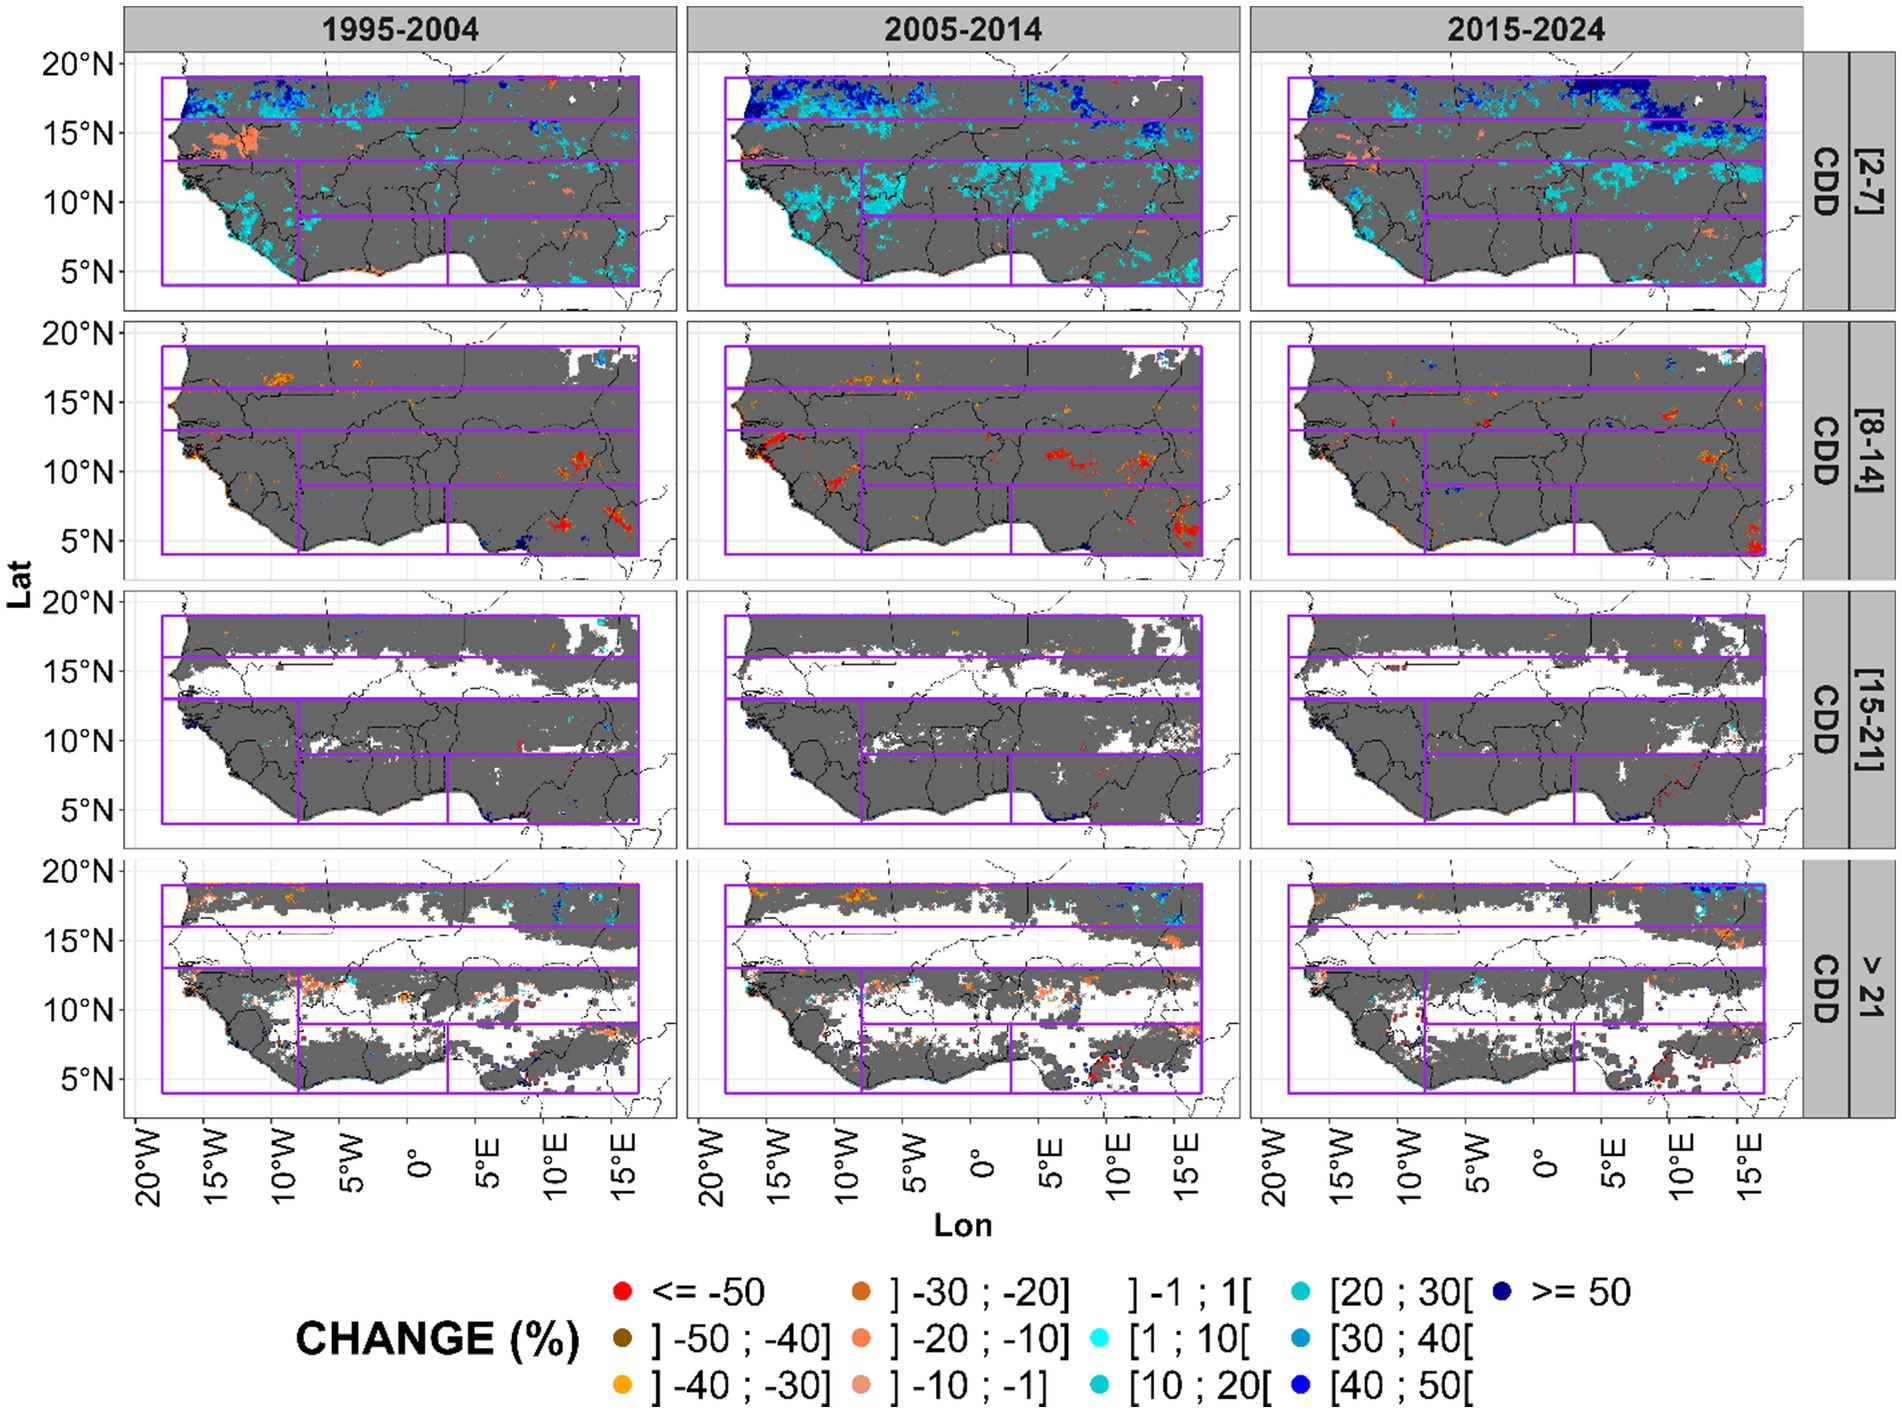
Figure 7. Decadal changes in consecutive dry days (CDD) across West Africa by spell duration (1995–2024 vs. 1985–1994). Gray areas indicate regions where changes are not statistically significant at the 95% confidence level based on the Wilcoxon test.
In contrast, moderate dry spells (8–14 days) show a widespread and consistent decline, especially across the Sahelian and Sudanian zones. This decrease is most evident during 2015–2024, with notable reductions in central Mali, eastern Niger, northern Burkina Faso, northeastern Nigeria, southern Côte d’Ivoire, and western Guinea-Bissau. Longer dry spells (15–21 days and >21 days) display limited or no significant changes across most of the region, except for minor variations (±1%) in parts of the Sudanian zone. These evolving trends indicate intensifying rainfall variability and an emerging tendency toward more erratic and prolonged drought episodes, posing critical risks to rainfed agriculture, water resources, and food security. The results emphasize the need for targeted, locally informed adaptation strategies to strengthen resilience to shifting dry spell dynamics.
The analysis of consecutive wet days (CWD) for varying wet spell durations (2–7, 8–14, 15–21, and >21 days) relative to the 1985–1994 baseline (Supplementary Figure S1) reveals a distinct rise in short wet spells (2–7 days) across much of the Sahel and Sudanian zones. This trend suggests a transition toward more frequent but shorter rainfall events, which may enhance rainfall intensity but reduce soil moisture retention, with mixed implications for crop productivity. Moderate wet spells (8–14 days) display heterogeneous spatial patterns, with substantial declines across Mauritania, Mali, Niger, Burkina Faso, and Côte d’Ivoire during 2015–2024. In contrast, longer wet spells (15–21 days and >21 days) show minimal changes, except for localized increases in parts of the Sudano–Sahelian belt, which may exacerbate flood risks. Collectively, these findings highlight intensifying short-duration rainfall events and increasing spatial variability in wet spell dynamics, reinforcing the importance of adaptive water management and climate-resilient agricultural planning across West Africa.
3.2.4 Regional mean changes in extreme rainfall indices
The mean decadal changes in extreme rainfall indices across the agroclimatic regions of West Africa are presented in Figure 8. Comparative analysis between the reference decade (1985–1994) and recent decades (1995–2024) reveals a substantial intensification of precipitation extremes, particularly in the northern Sahel (NS) and southern Sahel (SS). Total seasonal precipitation (PRCPTOT) increased markedly by 19%–25% in NS and 7–21% in SS, driven by notable rises in the number of wet days (RR1: 12%–17% in NS; 1%–4% in SS) and rainfall intensity (SDII: 5–7% in NS; 4%–17% in SS), alongside reductions in consecutive dry days (CDD: −2% to −22% in NS; −30% to −35% in SS). Although events exceeding 10 mm or 20 mm (R10mm, R20mm) remain relatively rare in the Sahel, variability in consecutive wet days (CWD), very wet days (R95P), and extremely wet days (R99P) has increased across both Sahelian belts, indicating heightened rainfall irregularity.
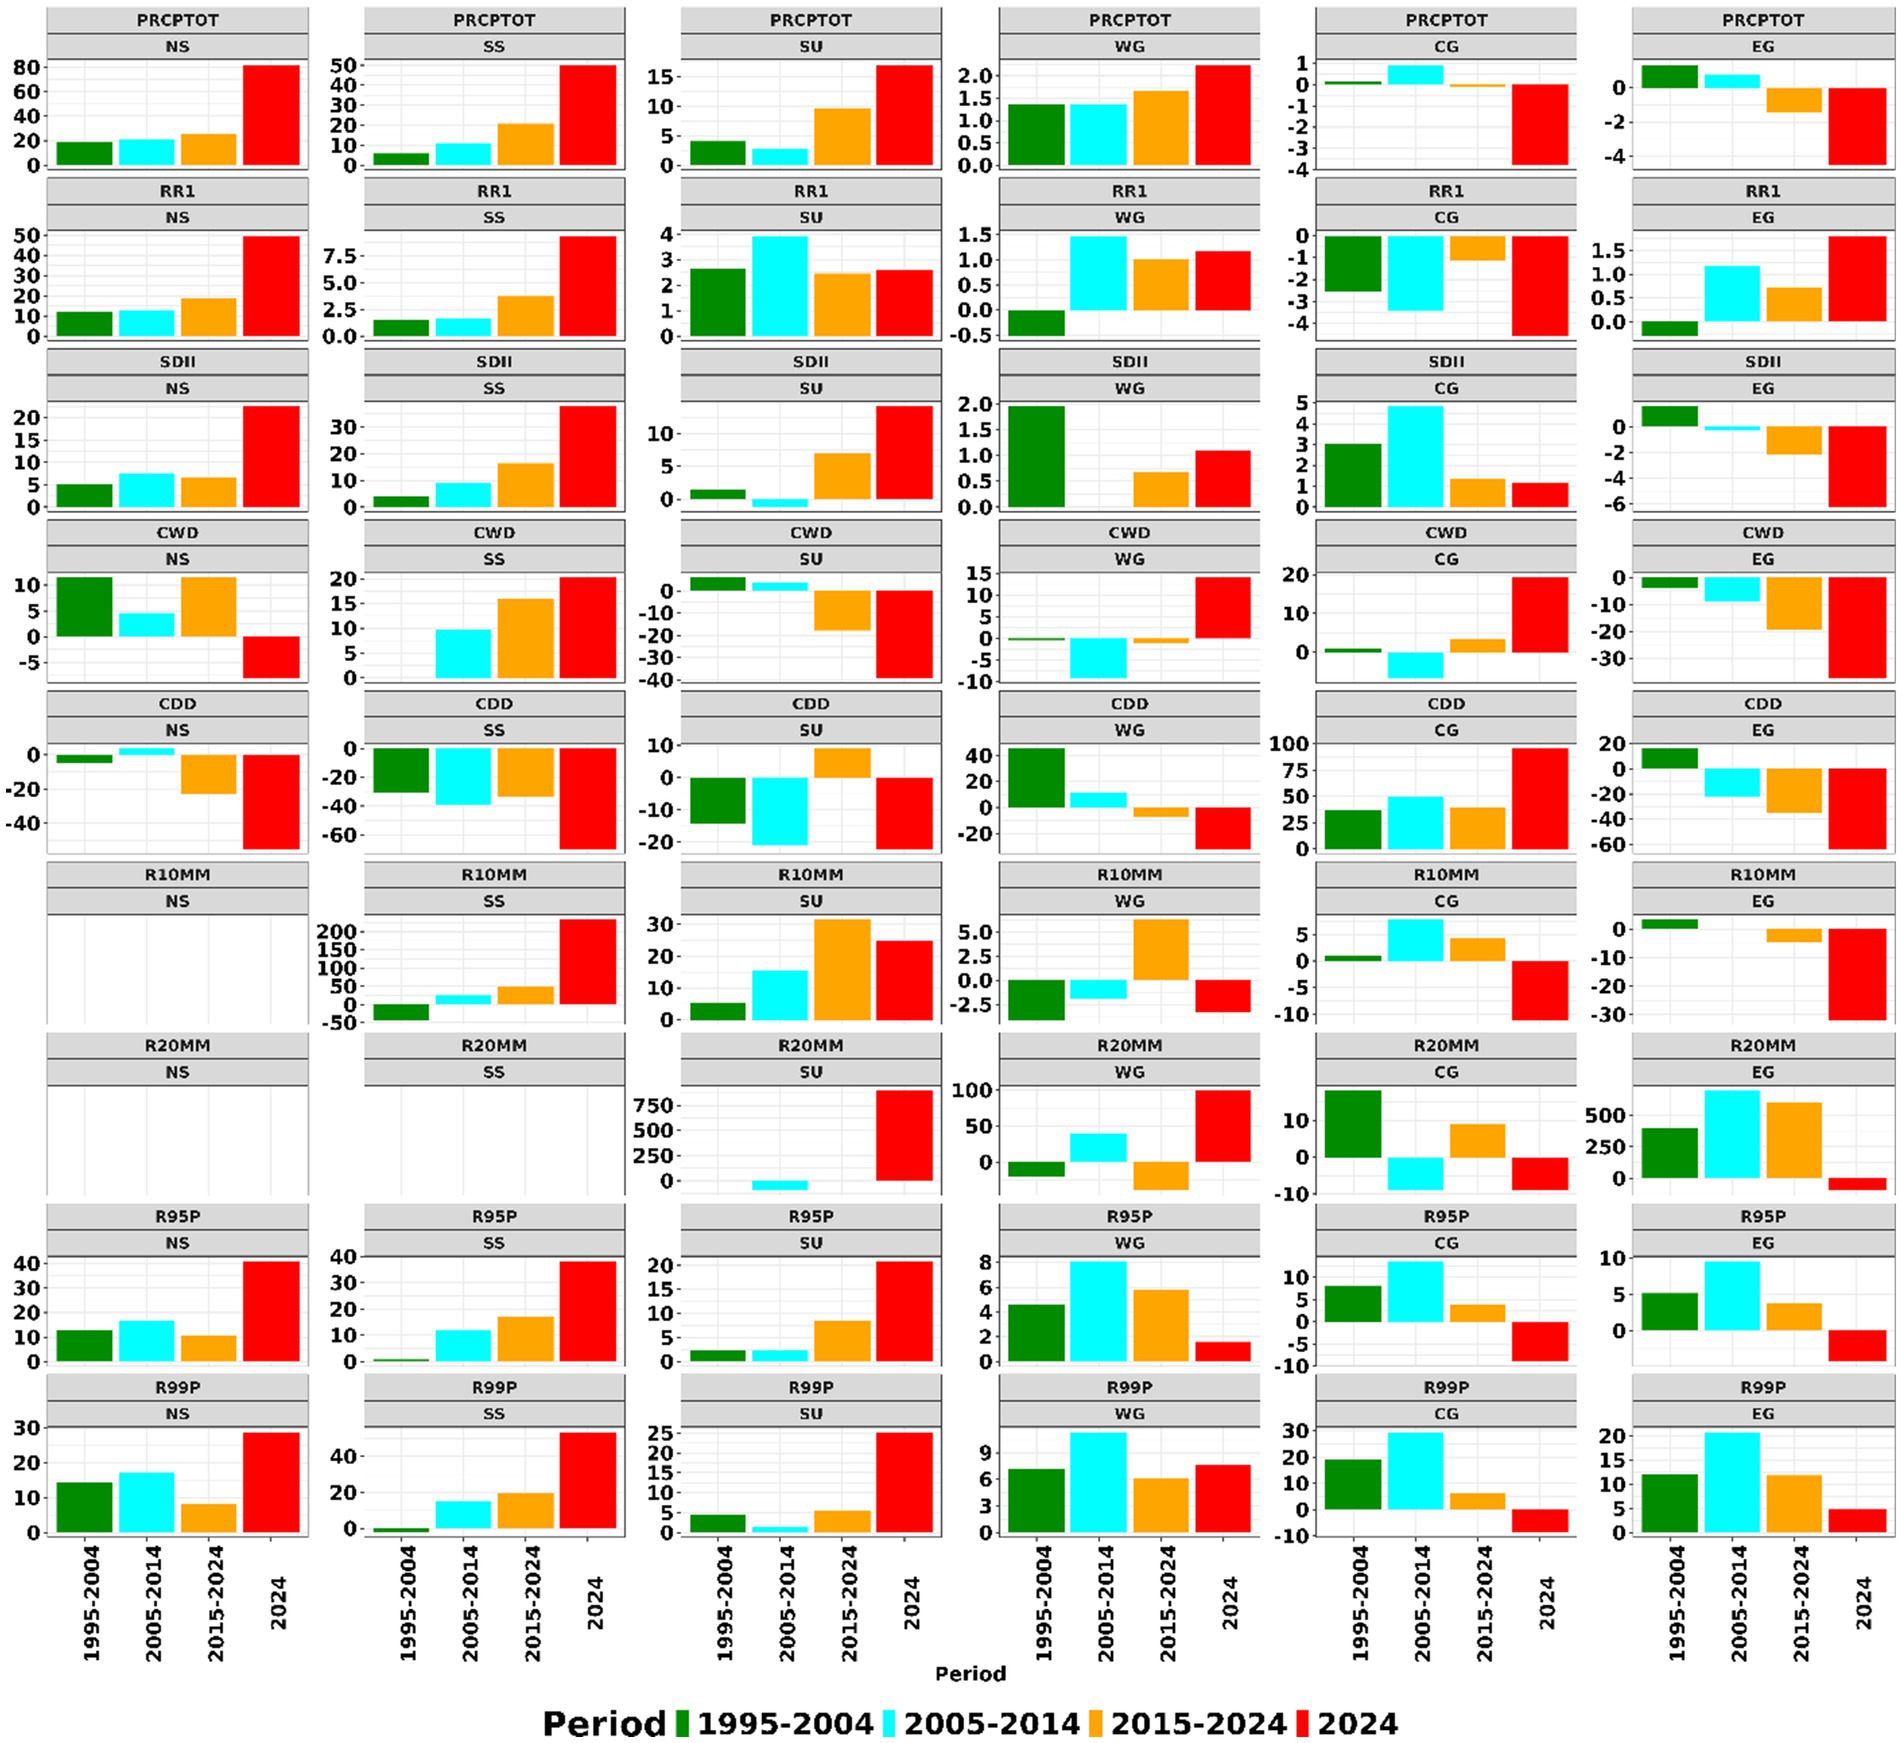
Figure 8. Decadal trends and regional variations in extreme rainfall indices across agro climatic zones in West Africa (1995–2024 vs. 1985–1994).
In the Sudanian (SU) zone, PRCPTOT rose by 5%–10%, accompanied by higher SDII (2%–7%) and notable increases in R10mm (5%–32%) and R95P (3%–8%), though RR1, CWD, and CDD trends remain spatially variable. The West Guinean (WG) zone exhibited modest gains in PRCPTOT (1.3%–1.7%) with heightened variability across most rainfall indices, while Central Guinea (CG) displayed greater interdecadal fluctuations in PRCPTOT. In contrast, the Eastern Guinean (EG) zone recorded an overall decline in rainfall, reflected in decreases across nearly all indices.
By 2024, an exceptional surge in PRCPTOT was observed in NS (80%), SS (50%), SU (17%), and WG (2%), contrasting with declines in CG (−4%) and EG (−4%). Rainfall intensity and frequency rose sharply in NS (SDII +20%, RR1 +50%) and SS (SDII +40%, RR1 +10%), coupled with a marked reduction in dry spell duration (CDD −50%). Extreme precipitation events became particularly pronounced in SS, where R10mm and R20mm increased by 200 and 750%, respectively, and R95P and R99P rose by 40 and 50%. The SU zone also experienced a notable intensification of extremes (R20mm +750%, R95P +21%, R99P +25%), though accompanied by declines in CWD (−40%) and CDD (−22%). WG displayed modest increases across most indices, except for decreases in R10mm (−3%) and CDD (−30%). Conversely, CG recorded widespread reductions in PRCPTOT (−4%) and most extreme rainfall indices, along with a sharp increase in dry spell duration (CDD >90%), while EG exhibited consistent declines across metrics except for a 5% increase in R99P and a slight rise in RR1 (2%).
3.3 Decadal patterns of yield responses to climate variability and extremes
Crop yield responses across West Africa exhibit strong spatial and temporal contrasts over recent decades (Supplementary Figure S2). Maize yields increased markedly in both major and second growing seasons, with widespread gains exceeding 40%–50% across the Guinean, Sudanian, and southern Sahel zones. The improvements were particularly pronounced during 2005–2014, likely reflecting advances in agronomic management and input adoption. Soybean, though less extensively cultivated, also recorded substantial yield gains, especially in Nigeria, despite localized declines in other regions. In contrast, rice displayed a more heterogeneous pattern: while moderate yield increases occurred in portions of the Sudano-Sahelian, western Sudanian, and Coastal Guinea zones, sharp declines of up to 50% were recorded in both major and minor seasons in Nigeria, underscoring the crop’s sensitivity to climatic and agronomic stressors. Overall, the results reveal distinct crop- and zone-specific trajectories, with maize and soybean exhibiting sustained improvements, whereas rice remains particularly vulnerable to hydroclimatic variability.
3.3.1 Correlation analysis between rainfall extremes and crop yields
Correlation maps (Figure 9) reveal pronounced spatial and temporal heterogeneity in the relationships between crop yields (maize, rice, and soybean) and extreme rainfall indices across West Africa. For maize, both major and second seasons display generally positive correlations with precipitation-based indices (PRCPTOT, R10mm, and R20mm), particularly in the Guinean and Sudanian zones, suggesting that increased rainfall enhances maize productivity. However, negative correlations emerge in parts of the Sahel, indicating potential sensitivity to excessive rainfall or prolonged wet spells that may induce waterlogging. Correlations with temperature indices (Tasmin and Tasmax) are predominantly negative, emphasizing the crop’s vulnerability to heat stress, especially in northern Nigeria, Burkina Faso, and Mali.
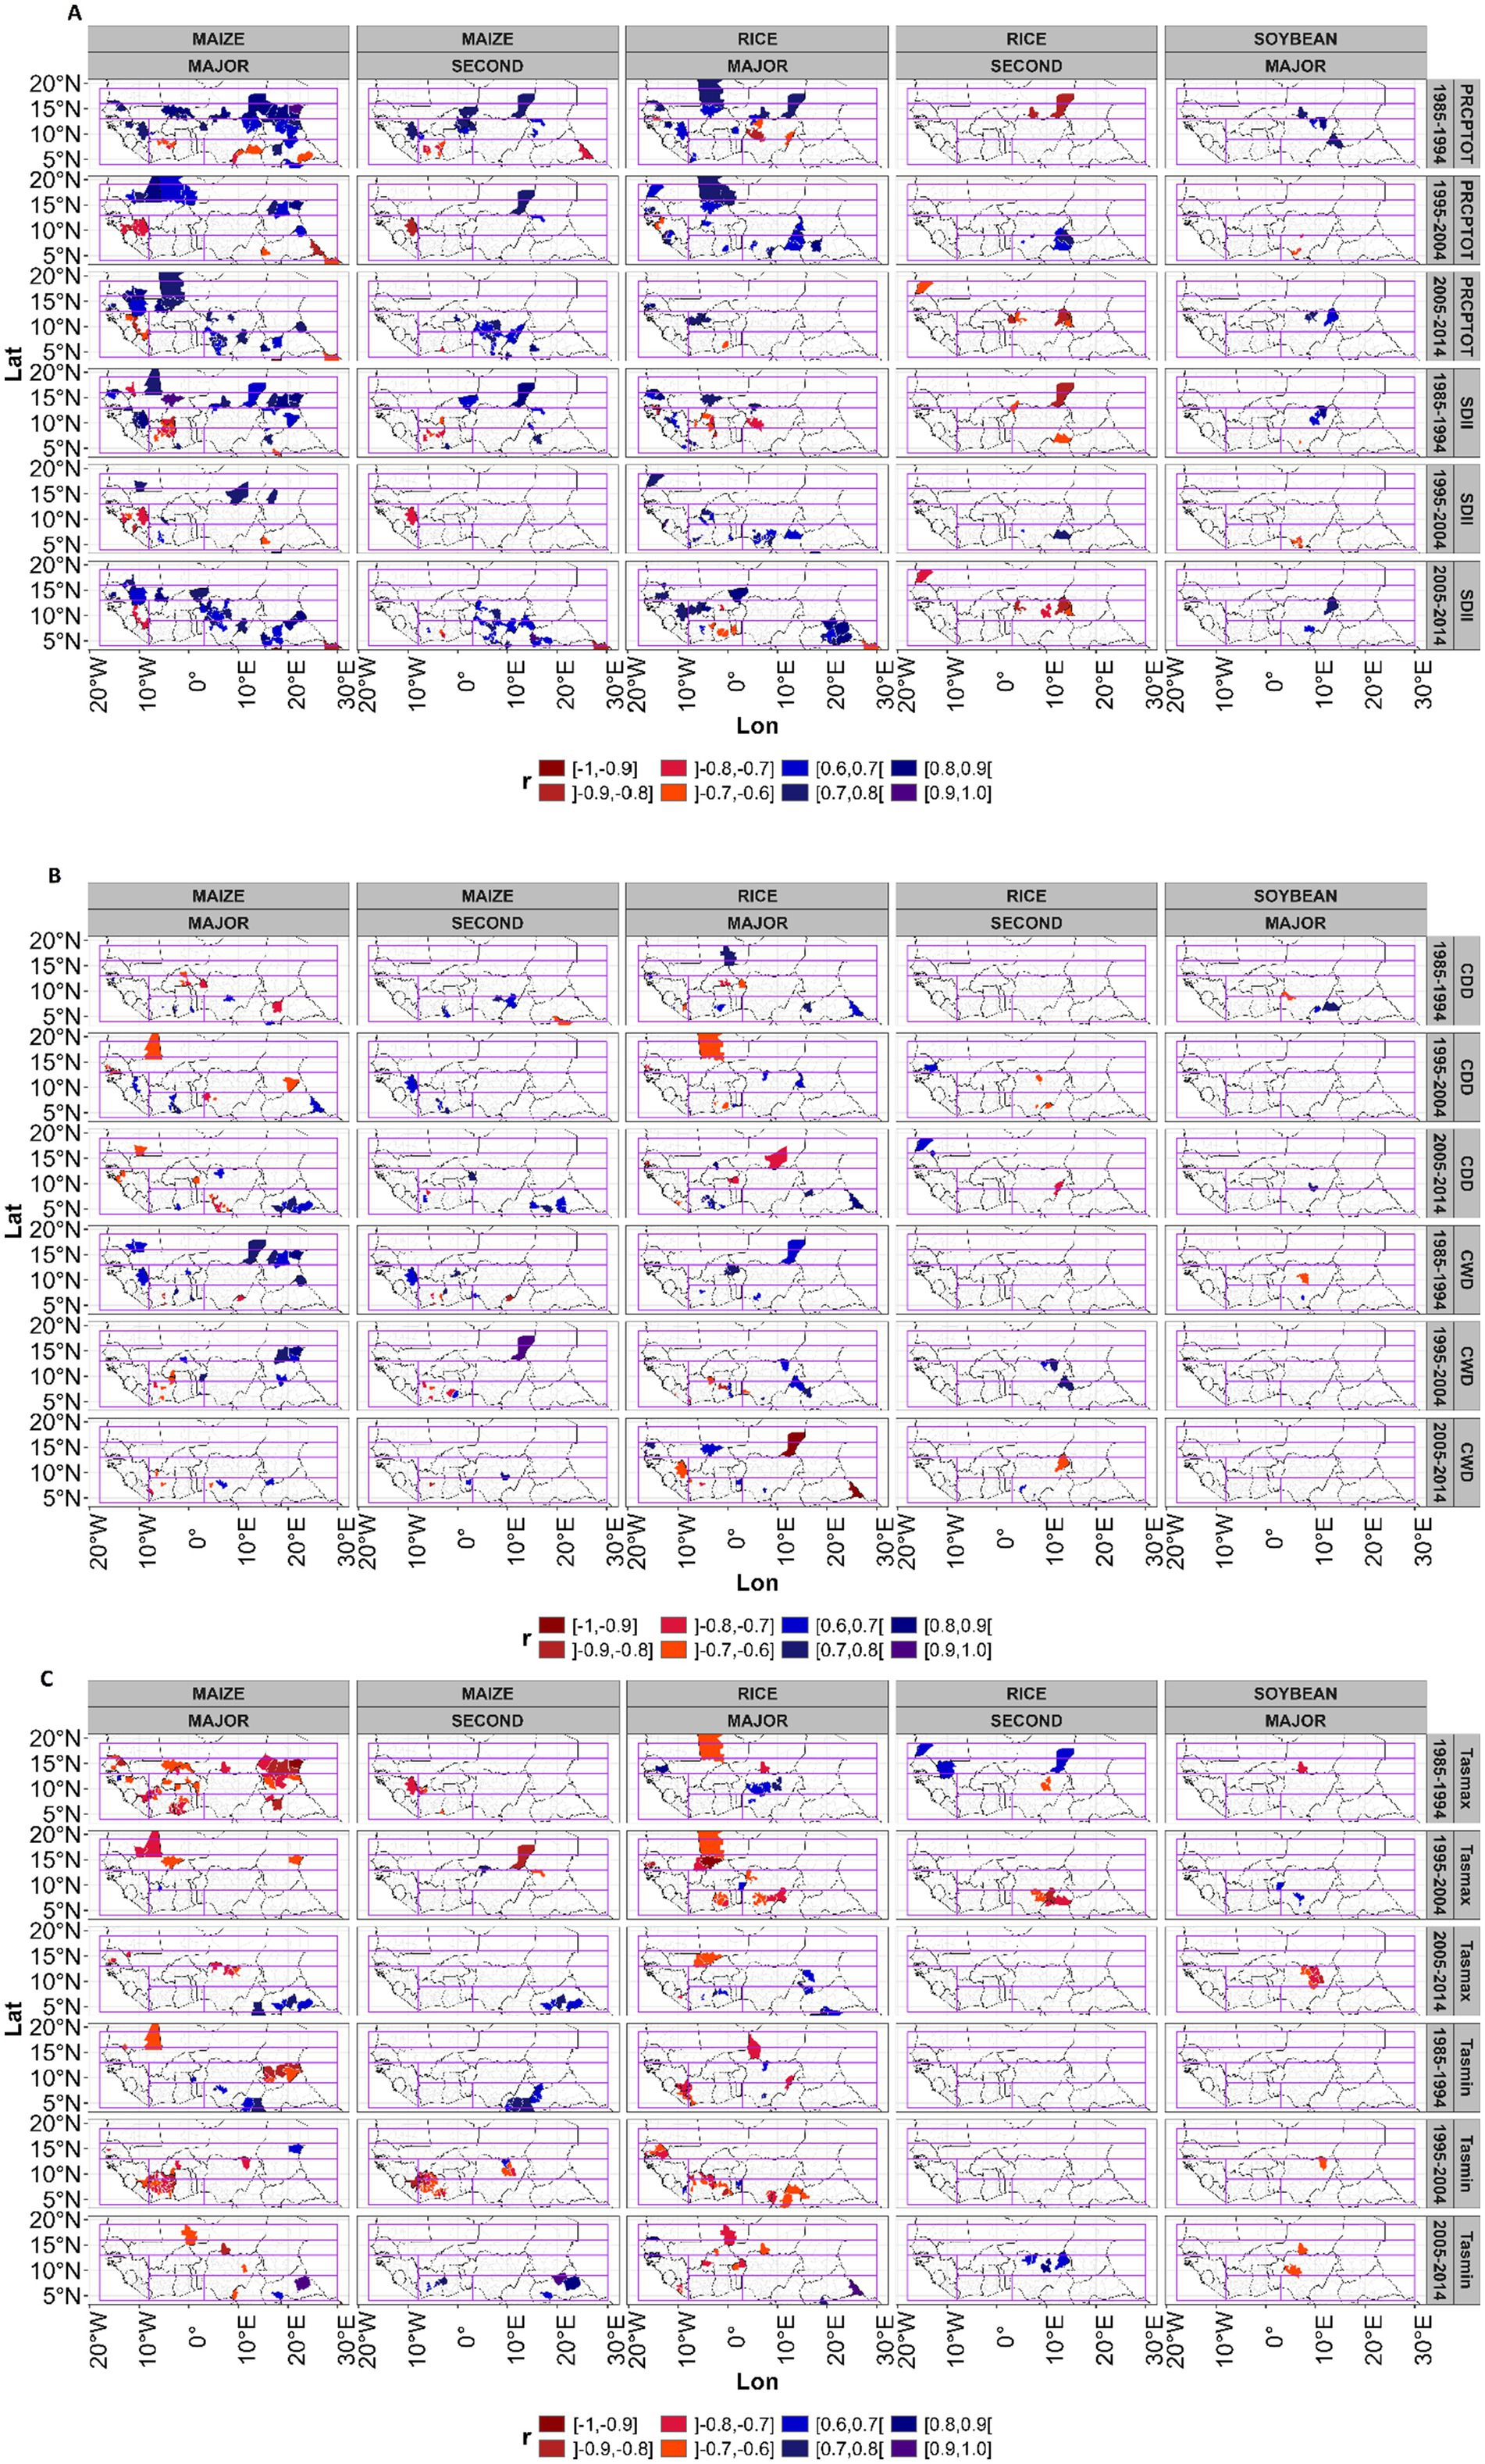
Figure 9. Correlations between crop yields and extreme climate indices at the 95% confidence level. (A) Total precipitation (PRCPTOT) and rainfall intensity (SDII); (B) dry spell duration (CDD) and wet spell duration (CWD); and (C) maximum (Tasmax) and minimum (Tasmin) temperatures.
For rice, correlation patterns are more complex and spatially variable. During the major season, strong positive correlations with precipitation indices are observed across the western Sudanian and coastal zones (southern Mali, Côte d’Ivoire, Ghana, and Benin), reflecting the crop’s dependence on adequate water availability. Conversely, negative correlations in Nigeria suggest adverse impacts from extreme rainfall or poor drainage, leading to flood-related yield losses. Temperature indices, particularly extreme maximum temperature, exhibit strong negative correlations across both growing seasons, underscoring rice’s sensitivity to thermal stress. Soybean, cultivated primarily in Nigeria during the major season, shows moderately positive correlations with rainfall indices but consistently negative associations with temperature extremes, indicating that heat stress remains a limiting factor despite the crop’s relatively smaller spatial footprint.
Collectively, these results demonstrate that yield–climate relationships are highly crop, season, and zone-specific. Rainfall variability exerts both beneficial and adverse effects depending on intensity and duration, while temperature extremes consistently constrain yields. These findings highlight the dual challenge of managing water and heat stress in sustaining crop productivity under a warming and increasingly variable climate across West Africa.
3.3.2 Sensitivity analysis of crop yields to rainfall extremes
The sensitivity analysis (Figure 10) reveals distinct spatial and seasonal variations in how climatic factors influence crop yields across West Africa. To minimize the effects of multicollinearity, the predictors RR1, R95P, R99P, and Tmean were excluded before the assessment. Maize, particularly during the major growing season, exhibits strong positive sensitivity to total precipitation (PRCPTOT) and rainfall intensity (SDII), but negative sensitivity to consecutive dry days (CDD) and temperature indices (Tasmin and Tasmax) across the Sahel and Sudanian zones. These patterns indicate that maize production in these regions is particularly vulnerable to heat stress and rainfall variability, both of which contribute to yield instability.
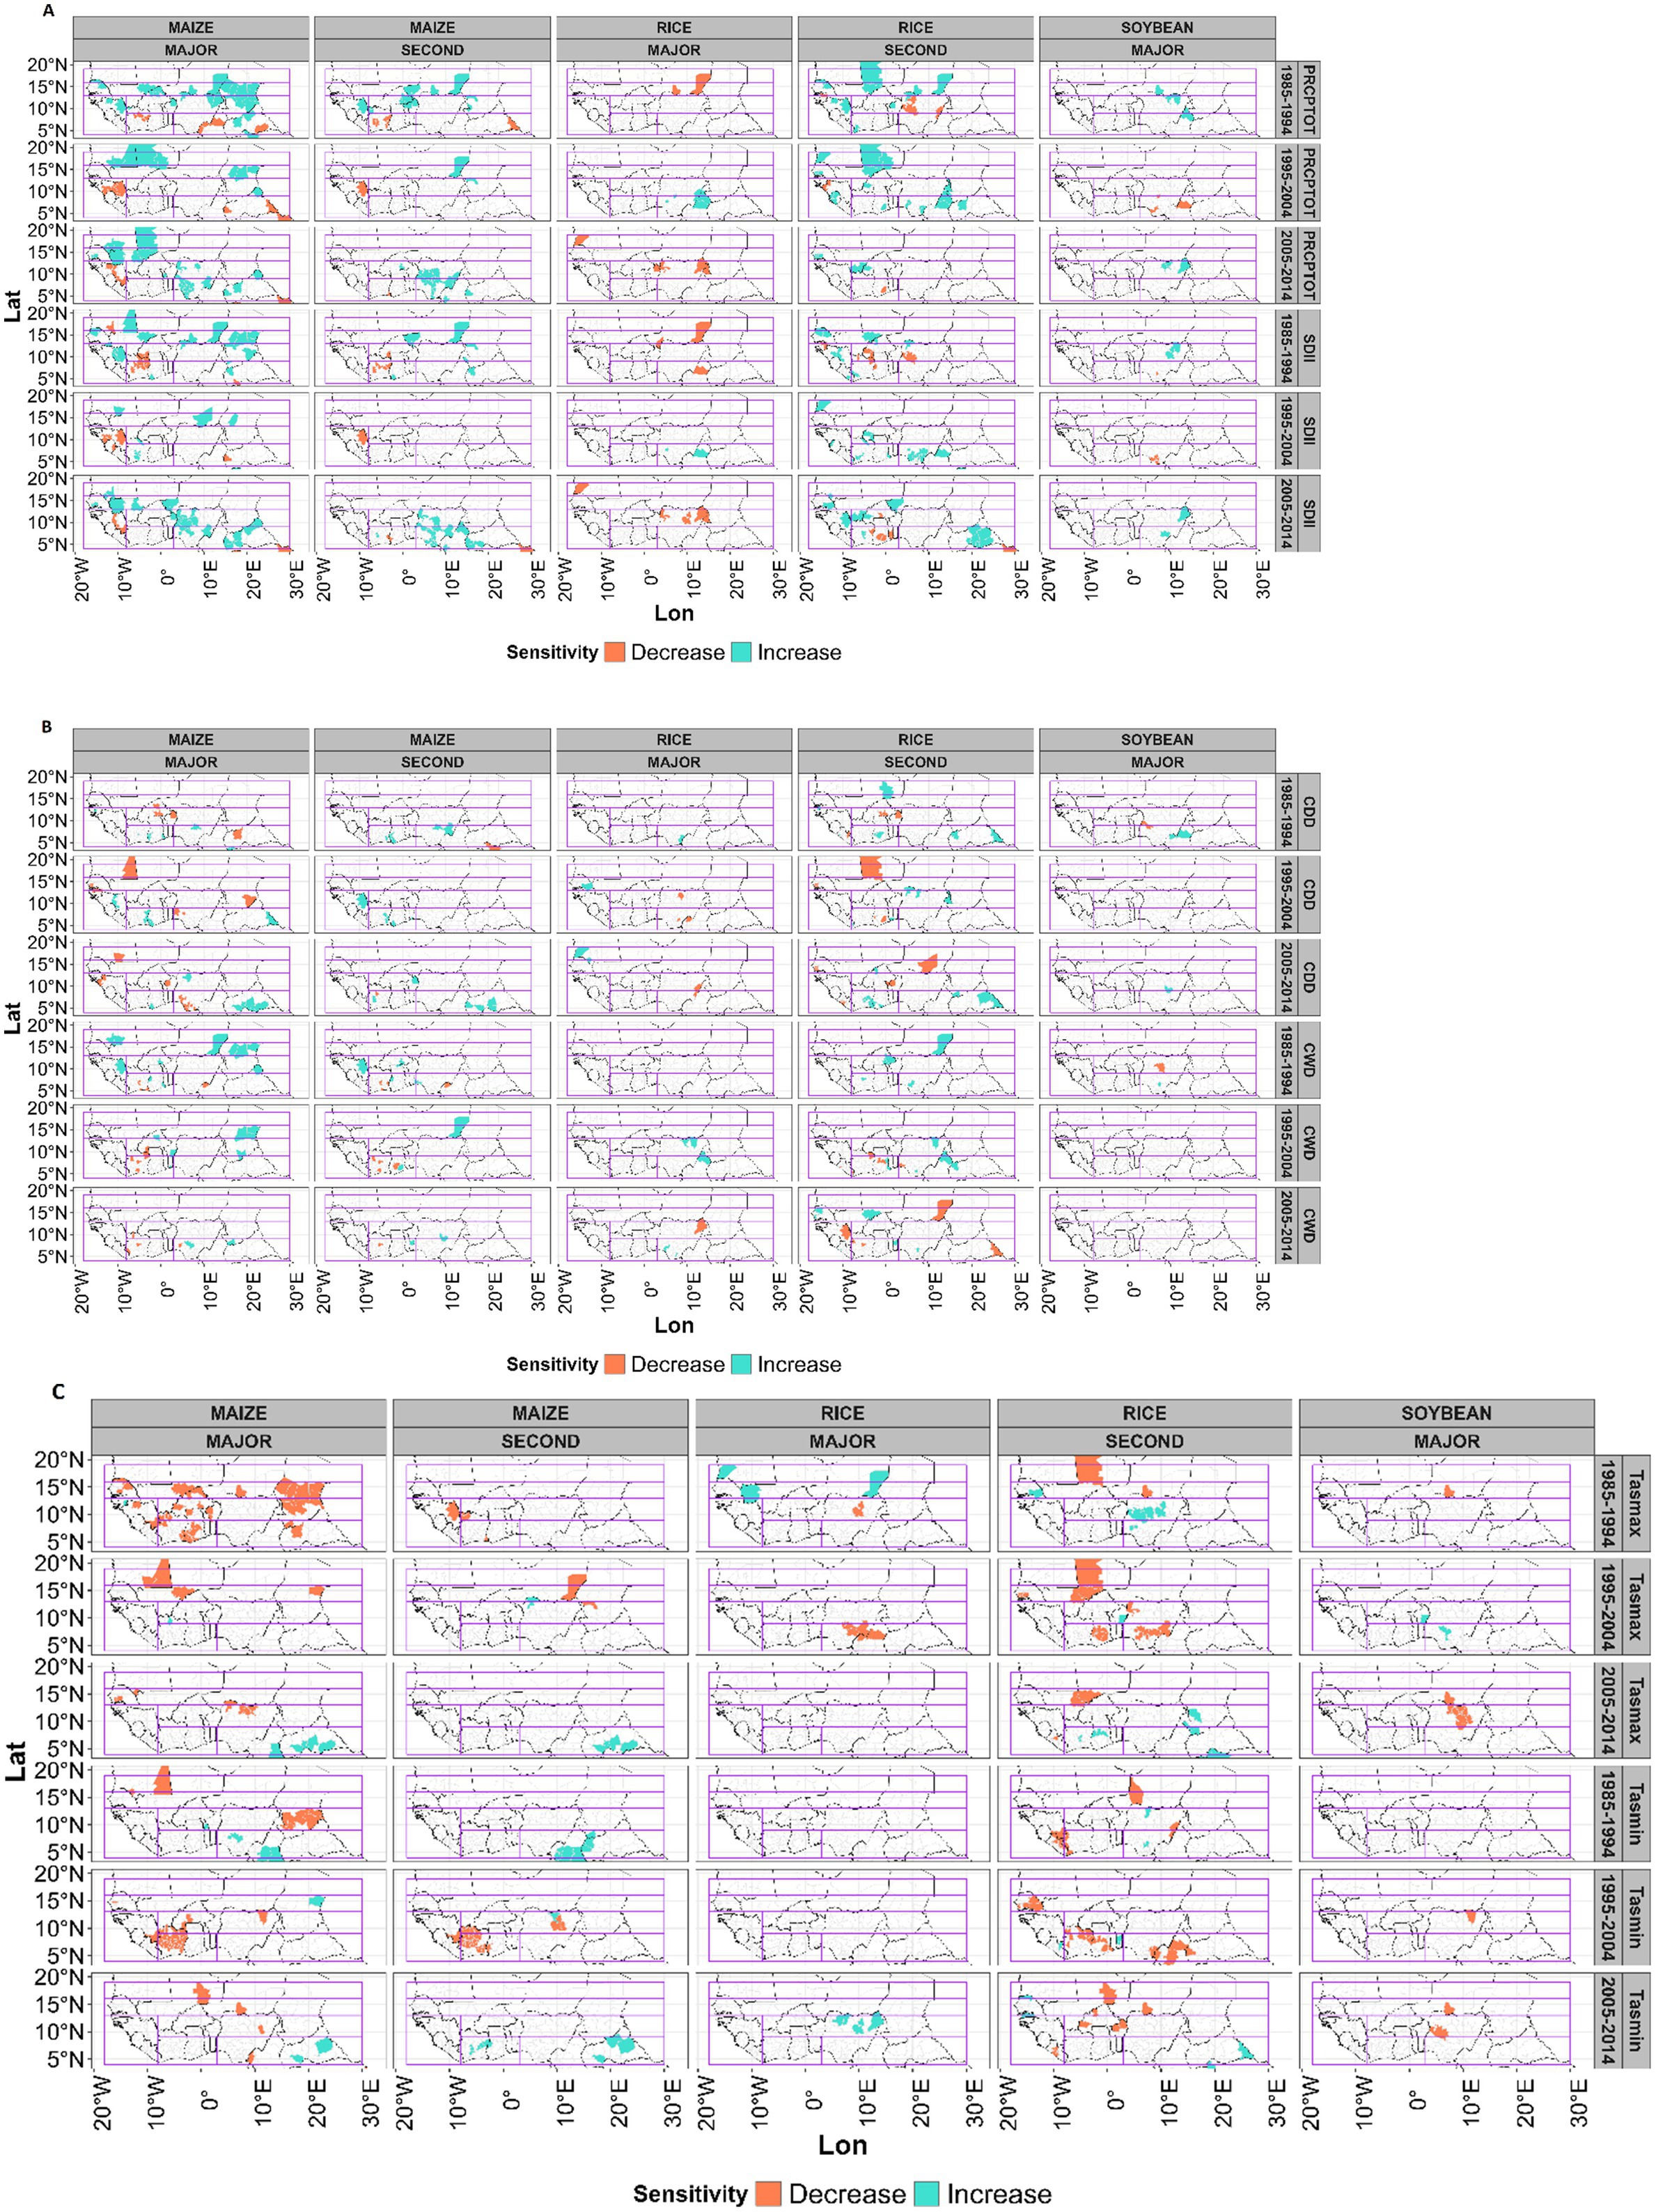
Figure 10. Sensitivity analysis of crop production under climate extremes at 95% confidence level. (A) Total precipitation (PRCPTOT) and rainfall intensity (SDII); (B) dry spell duration (CDD) and wet spell duration (CWD); and (C) maximum (Tasmax) and minimum (Tasmin) temperatures.
In contrast, second-season maize and rice show greater positive sensitivity to PRCPTOT, SDII, and consecutive wet days (CWD), particularly in Central and Eastern Guinea. These relationships suggest potential yield gains under conditions of moderate rainfall enhancement, provided that waterlogging and flood risks remain limited. Soybean, though spatially restricted in its cultivation, demonstrates significant yield declines in central Nigeria, highlighting its heightened vulnerability to climatic stressors. The analysis also indicates that crop yields exhibit limited sensitivity to extreme rainfall thresholds (R10mm, R20mm, R50mm, and R100mm) (see Supplementary Figure S3), suggesting that overall yield responses are driven more by total rainfall and wet–dry spell dynamics than by discrete extreme events.
Overall, the findings suggest that the northern agroclimatic zones (Sahel and Sudanian) and parts of western Guinea are more susceptible to climate-induced yield reductions, especially for major-season crops. By contrast, the southern zones (Central and Eastern Guinea) may offer more favorable conditions under future climate scenarios, particularly during the second season. These results underscore the importance of region-specific adaptation strategies, such as revising planting calendars, promoting drought and heat-tolerant varieties, and expanding second-season cultivation in suitable zones, to strengthen the resilience of West African cropping systems to evolving climatic extremes.
4 Discussion
4.1 Rainfall extremes in West Africa
The decadal analysis of extreme rainfall indices and crop yield responses across West Africa reveals a pronounced north–south contrast, reflecting evolving monsoon dynamics, increases in PRCPTOT, RR1, and SDII, coupled with declines in CDD, point to wetter conditions and intensifying rainfall extremes. These trends are consistent with a strengthening monsoon and more frequent heavy rainfall events under climate change (Salack et al., 2016; Sultan and Gaetani, 2016; Bichet and Diedhiou, 2018b).
The observed intensification and redistribution of rainfall and rainfall extremes across West Africa closely align with recent Arias et al. (2021) assessments based on observational evidence. The IPCC reports a discernible increase in annual and seasonal rainfall over parts of the central and eastern Sahel since the 1980s, marking a recovery from the severe droughts of the 1970s–1980s. This trend is accompanied by growing evidence of more frequent heavy rainfall events and longer wet spells in the Sahel and Sudanian zones, consistent with our findings of increasing PRCPTOT, SDII, and CWD. Similarly, the IPCC notes rising rainfall irregularity and extended dry spells in the Guinean and coastal zones, which correspond with our observed increases in CDD and intra-seasonal variability in Central and Eastern Guinea. Together, these observations confirm an ongoing intensification of the hydrological cycle in West Africa, characterized by both wetter extremes in the north and drying tendencies in the south, patterns that are reshaping regional water and agricultural systems.
In contrast, the Guinean zones exhibit declining or stagnating rainfall, characterized by emerging deficits and prolonged dry spells, particularly in Central and Eastern Guinea. These findings align with prior studies indicating heightened rainfall variability and extended dry spells along the Guinea Coast, posing serious challenges to rainfed rice and other water-sensitive crops (Bichet and Diedhiou, 2018a; Froidurot and Diedhiou, 2017). Overall, this dual climatic reality, a wetter, flood-prone north versus a drier, water-stressed south, defines the spatial pattern of agricultural vulnerability. Targeted interventions, such as flood management and soil-water conservation in the Sahel/Sudan and drought preparedness and irrigation in the Guinea belt, are crucial to sustain agricultural productivity (Douxchamps et al., 2016; Mechiche-Alami and Abdi, 2020). In summary, rainfall extremes are intensifying in northern West Africa due to a strengthening monsoon, while southern regions experience drying trends and prolonged dry spells, with very heavy rainfall events increasingly concentrated along the coastal zones.
The intra-annual and monthly rainfall variability observed across West Africa’s six agro-climatic zones can be interpreted through key biophysical mechanisms. In the northern Sahel and Sudanian zones, increases in wet spell duration (CWD), rainfall totals (PRCPTOT), and rainfall intensity (SDII) during July–September enhance soil moisture retention and infiltration-storage capacity, temporarily improving water availability for maize and other rainfed crops (Thomas et al., 2022; Parkes et al., 2018b; Roudier et al., 2011). However, these intensifying rainfall events also elevate the risk of flooding and surface runoff in low-lying or poorly drained areas, promoting soil erosion, nutrient leaching, and root hypoxia-processes particularly detrimental to flood-sensitive crops such as rice (Niang et al., 2017; Bichet and Diedhiou, 2018b; Adeyeri, 2025). Conversely, in the southern Guinean zones, prolonged dry spells (rising CDD) reduce soil water availability, constrain crop growth, and exacerbate drought stress (Douxchamps et al., 2016; Sultan and Gaetani, 2016; Iizumi et al., 2024). This north–south contrast illustrates how rainfall variability interacts with soil moisture dynamics, drainage efficiency, and antecedent water conditions to shape spatial patterns of agricultural vulnerability, emphasizing that heavier rainfall does not uniformly translate into higher yields. These mechanistic insights underscore the need for zone-specific adaptation strategies, including improved drainage in flood-prone northern landscapes and soil-water conservation measures in the drying southern regions.
Our observations reveal that rainfall extremes are increasingly generating compound hazards, co-occurring floods, soil waterlogging, and subsequent dry spells, which heighten agricultural risks across West Africa. The coexistence of intense wet spells in the Sahel/Sudan zones and prolonged dry periods in the Guinean belt illustrates cascading hydrological stresses that hinder crop recovery within the same season. These rainfall-driven compound events align with the recent IPCC report (Arias et al., 2021) highlighting intensifying monsoon variability and multi-hazard exposure. Although rising temperatures beyond the scope of this study are expected to amplify evapotranspiration and drought stress, rainfall variability alone already imposes major compounding risks. Addressing these interconnected extremes requires integrated water management and climate-informed adaptation strategies across agroecological zones.
4.2 Crop-specific responses
The yield responses of major crops mirror the north–south climatic divide but also underscore distinct sensitivities to rainfall variability. Maize demonstrates relative resilience, with yield gains in the Sudanian and Guinean zones linked to increased rainfall totals and more frequent wet spells. These results echo prior evidence of maize’s responsiveness to intra-seasonal rainfall variability and potential yield gains under wetter conditions if managed effectively (Parkes et al., 2018b; Roudier et al., 2011). Scaling heat-tolerant varieties and improved water management could help stabilize yields, though limited farmer access to technologies remains a major barrier (Sultan and Gaetani, 2016).
Rice, by contrast, shows heterogeneous outcomes, yield gains in western Sudanian and coastal Guinea zones but declines in Nigeria and Eastern Guinea, reflecting its high vulnerability to flooding, poor drainage, and temperature extremes (Niang et al., 2017; Duvallet et al., 2021). Expanding irrigation, flood management, and drainage infrastructure, alongside developing stress-tolerant rice varieties adapted to regional agroecologies, is essential to improve resilience (Roudier et al., 2011).
Soybean, though less widely cultivated, exhibits strong positive yield responses where rainfall is adequate, highlighting its promise as a diversification crop. Yet, sensitivity to short dry spells and heat stress constrains large-scale expansion (MacCarthy et al., 2022; Bebeley et al., 2025). Strengthening seed systems, research support, and mechanization could enable soybean’s integration into mixed cropping systems that improve soil fertility and farmer income (Siamabele, 2021). In summary, maize tends to benefit from wetter conditions in the northern zones, rice remains highly sensitive to both flooding and heat stress, while soybean offers promising diversification potential under favorable moisture regimes.
4.3 Adaptation and policy implications
Our decadal analysis of rainfall extremes across West Africa aligns with regional and global initiatives aimed at advancing climate-smart agriculture (CSA) and strengthening adaptation planning. Reports from AICCRA and the Global Center on Adaptation, CGIAR partnership (Kpadonou et al., 2023) emphasize the urgency of embedding CSA innovations within rainfed and water-stressed systems. Our findings, showing intensifying wet spells and rainfall in the Sahel/Sudan zones and prolonged dry spells in the Guinean belt, highlight spatially differentiated adaptation priorities. These contrasts are consistent with recent evidence from Abawiera Wongnaa et al. (2024), who emphasize tailoring adaptation and policy responses to localized climate risks and biophysical conditions. Likewise, Obahoundje et al. (2025b) underscore the importance of integrating remote sensing and machine learning approaches to better characterize climate hazards and their impacts on crop yields, thereby enhancing the spatial precision of CSA and adaptation targeting. Mechanisms such as improved drainage, soil-water retention, and drought-buffering practices align with CSA principles and provide biophysical evidence to support adaptation frameworks, as underscored in recent UNEP and UNFCCC reports on adaptation progress (UNFCCC, 2023, 2024).
Despite valuable insights, key knowledge gaps and limitations remain. Most analyses, including this study, emphasize historical rainfall–yield correlations, which cannot fully separate climatic influences from technological and management effects (Douxchamps et al., 2016). Furthermore, compound hazards, such as simultaneous floods and droughts, remain underexplored in climate–crop assessments (Diedhiou et al., 2018). The use of decadal averages, while informative, can obscure interannual variability critical to farmers’ livelihoods. Future research must integrate climate modeling, crop physiology, and socio-economic analyses to capture both risks and adaptation opportunities. Extending this framework to include livestock, fisheries, and household-level adaptation will strengthen evidence-based policy design.
From a policy perspective, resilience building must combine climate-smart agriculture (CSA), improved water management, and targeted investments in flood control and irrigation infrastructure. Empowering smallholders through access to climate information, technology, and financial tools will be pivotal for scaling adaptation and ensuring food security across West Africa’s climatic hotspots. In summary, rainfall extremes are intensifying in northern West Africa due to a strengthening monsoon, while southern regions experience drying trends and prolonged dry spells, with very heavy rainfall events increasingly concentrated along the coast.
5 Conclusion
This study reveals profound shifts in extreme rainfall and crop–climate interactions across West Africa, marked by a growing contrast between wetter, flood-prone Sahelian/Sudanian zones and drying, drought-vulnerable Guinean regions. Crop yield responses mirror these climatic patterns: maize and soybean generally benefit from increased rainfall, while rice shows mixed and often negative outcomes, particularly under rising heat stress. Sensitivity analyses identify the northern zones and parts of western Guinea as especially vulnerable, while southern Guinea may offer opportunities for strengthening second-season production. These results provide actionable evidence to guide regional adaptation planning, emphasizing the need for flood-tolerant crops, erosion control, and improved water management in northern areas, and irrigation and drought preparedness in the south. Strengthening early warning systems, climate-smart agriculture, and investment in resilient infrastructure should remain central to adaptation policies implemented through the Economic Community of West African States (ECOWAS), a regional political and economic union promoting climate resilience and sustainable development, and the Comprehensive Africa Agriculture Development Programme (CAADP), an African Union initiative aimed at enhancing agricultural productivity, food security, and sustainable land and water management. Future research should integrate socio-economic, hydrological, and crop modeling to better capture compound climate risks, assess adaptation trade-offs, and design inclusive, multi-hazard adaptation pathways for West Africa’s diverse agroecological zones.
Data availability statement
All data are available upon request to the corresponding author(s).
Author contributions
SO: Conceptualization, Data curation, Formal analysis, Investigation, Methodology, Visualization, Writing – original draft, Writing – review & editing. SAT: Conceptualization, Supervision, Validation, Writing – review & editing. PS: Funding acquisition, Project administration, Resources, Supervision, Writing – review & editing.
Funding
The author(s) declare that financial support was received for the research and/or publication of this article. This work was supported by Consortium of International Agricultural Research Centers (CGIAR), Excellence in Agronomy Initiative (EiA), and Sustainable Farming Program (SFP).
Conflict of interest
The authors declare that the research was conducted in the absence of any commercial or financial relationships that could be construed as a potential conflict of interest.
Generative AI statement
The authors declare that no Gen AI was used in the creation of this manuscript.
Any alternative text (alt text) provided alongside figures in this article has been generated by Frontiers with the support of artificial intelligence and reasonable efforts have been made to ensure accuracy, including review by the authors wherever possible. If you identify any issues, please contact us.
Publisher’s note
All claims expressed in this article are solely those of the authors and do not necessarily represent those of their affiliated organizations, or those of the publisher, the editors and the reviewers. Any product that may be evaluated in this article, or claim that may be made by its manufacturer, is not guaranteed or endorsed by the publisher.
Supplementary material
The Supplementary material for this article can be found online at: https://www.frontiersin.org/articles/10.3389/fclim.2025.1717323/full#supplementary-material
References
Abawiera Wongnaa, C., Amoah Seyram, A., and Babu, S. (2024). A systematic review of climate change impacts, adaptation strategies, and policy development in West Africa. Reg. Sustain. 5, 100137–100113. doi: 10.1016/j.regsus.2024.100137
Adeyeri, O. E. (2025). Hydrology and climate change in Africa: contemporary challenges, and future resilience pathways. Water 17:2247. doi: 10.3390/w17152247
Arias, P. A., Bellouin, N., Coppola, E., Jones, R. G., Krinner, G., Marotzke, J., et al. (2021). Technical Summary. In Climate Change 2021: The Physical Science Basis. Contribution of Working Group I to the Sixth Assessment Report of the IPCC (pp. 33–144). Cambridge University Press. doi: 10.1017/9781009157896.002
Awode, A. E., Adewumi, J. R., Obiora-Okeke, O., and Komolafe, A. A. (2025). Analysis of rainfall variability and extreme events in South-Western Nigeria: implications for water resource management and climate resilience. Bull. Natl. Res. Cent. 49:31. doi: 10.1186/s42269-025-01324-4
Bebeley, J. F., Tofa, A. I., Kamara, A. Y., Jibrin, J. M., Solomon, R., Adeleke, M. A., et al. (2025). Modelling the potential impact of climate change on the productivity of soybean in the Nigeria savannas. PLoS One 20:e0313786. doi: 10.1371/journal.pone.0313786
Biazin, B., Sterk, G., Temesgen, M., Abdulkedir, A., and Stroosnijder, L. (2012). Rainwater harvesting and management in rainfed agricultural systems in sub-Saharan Africa - a review. Phys. Chem. Earth 47, 139–151. doi: 10.1016/j.pce.2011.08.015
Bichet, A., and Diedhiou, A. (2018a). Less frequent and more intense rainfall along the coast of the Gulf of Guinea in West and Central Africa (1981−2014). Clim. Res. 76, 191–201. doi: 10.3354/cr01537
Bichet, A., and Diedhiou, A. (2018b). West African Sahel has become wetter during the last 30 years, but dry spells are shorter and more frequent. Clim. Res. 75, 155–162. doi: 10.3354/cr01515
Blunden, J., and Boyer, T. (2024). State of the climate in 2023. Bull. Amer. Meteor. Soc 105, S1–S484. doi: 10.1175/2024BAMSStateoftheClimate.1
Calzadilla, A., Zhu, T., Rehdanz, K., Tol, R. S. J., and Ringler, C. (2013). Economywide impacts of climate change on agriculture in sub-Saharan Africa. Ecol. Econ. 93, 150–165. doi: 10.1016/j.ecolecon.2013.05.006
Chagnaud, G., Panthou, G., Vischel, T., and Lebel, T. (2023). Capturing and attributing the rainfall regime intensification in the West African Sahel with CMIP6 models. J. Clim. 36, 1823–1843. doi: 10.1175/JCLI-D-22-0412.1
Diatta, S., Diedhiou, C. W., Dione, D. M., and Sambou, S. (2020). Spatial variation and trend of extreme precipitation in West Africa and teleconnections with remote indices. Atmos. 11:999. doi: 10.3390/atmos11090999
Didi, S. R. M., Mouhamed, L., Kouakou, K., Adeline, B., Arona, D., Houebagnon, J. C. S., et al. (2020). Using the CHIRPS dataset to investigate historical changes in precipitation extremes in West Africa. Climate 8:84. doi: 10.3390/cli8070084
Diedhiou, A., Bichet, A., Wartenburger, R., Seneviratne, S. I., Rowell, D. P., Sylla, M. B., et al. (2018). Changes in climate extremes over West and Central Africa at 1.5 °C and 2 °C global warming. Environ. Res. Lett. 13:065020. doi: 10.1088/1748-9326/aac3e5
Diedhiou, S., Rauch, M., Lahat Dieng, A., Bliefernicht, J., Sy, S., Sall, S. M., et al. (2024). Extreme rainfall in Dakar (Senegal): a case study for September 5, 2020. Front. Water 6:1439404. doi: 10.3389/frwa.2024.1439404
Dieng, D., Laux, P., Smiatek, G., Heinzeller, D., Bliefernicht, J., Sarr, A., et al. (2018). Performance analysis and projected changes of agroclimatological indices across West Africa based on high-resolution regional climate model simulations. J. Geophys. Res. Atmos. 123, 7950–7973. doi: 10.1029/2018JD028536
Douxchamps, S., Van Wijk, M. T., Silvestri, S., Moussa, A. S., Quiros, C., Ndour, N. Y. B., et al. (2016). Linking agricultural adaptation strategies, food security and vulnerability: evidence from West Africa. Reg. Environ. Chang. 16, 1305–1317. doi: 10.1007/s10113-015-0838-6
Du, H., Tan, M. L., Zhang, F., Chun, K. P., Li, L., and Kabir, M. H. (2024). Evaluating the effectiveness of CHIRPS data for hydroclimatic studies. Theor. Appl. Climatol. 155, 1519–1539. doi: 10.1007/s00704-023-04721-9
Du, S., and Xiong, W. (2024). Weather extremes shock maize production: current approaches and future research directions in Africa. Plants 13:1585. doi: 10.3390/plants13121585
Duvallet, M., Dumas, P., Makowski, D., Boé, J., del Villar, P. M., and Ben-Ari, T. (2021). Rice yield stability compared to major food crops in West Africa. Environ. Res. Lett. 16:124005. doi: 10.1088/1748-9326/ac343a
Ekolu, J., Dieppois, B., Sidibe, M., Eden, J. M., Tramblay, Y., Villarini, G., et al. (2022). Long-term variability in hydrological droughts and floods in sub-Saharan Africa: new perspectives from a 65-year daily streamflow dataset. J. Hydrol. 613:128359. doi: 10.1016/j.jhydrol.2022.128359
Froidurot, S., and Diedhiou, A. (2017). Characteristics of wet and dry spells in the West African monsoon system. Atmos. Sci. Lett. 18, 125–131. doi: 10.1002/asl.734
Funk, C., Peterson, P., Landsfeld, M., Pedreros, D., Verdin, J., Shukla, S., et al. (2015). The climate hazards infrared precipitation with stations - a new environmental record for monitoring extremes. Sci. Data 2, 150066–150021. doi: 10.1038/sdata.2015.66
Funk, C., Peterson, P., Peterson, S., Shukla, S., Davenport, F., Michaelsen, J., et al. (2019). A high-resolution 1983–2016 TMAX climate data record based on infrared temperatures and stations by the climate hazard center. J. Clim. 32, 5639–5658. doi: 10.1175/JCLI-D-18-0698.1
Iizumi, T., Iseki, K., Ikazaki, K., Sakai, T., Shiogama, H., Imada, Y., et al. (2024). Increasing heavy rainfall events and associated excessive soil water threaten a protein-source legume in dry environments of West Africa. Agric. For. Meteorol. 344:109783. doi: 10.1016/j.agrformet.2023.109783
Iizumi, T., and Sakai, T. (2020). The global dataset of historical yields for major crops 1981–2016. Sci. Data 7:97. doi: 10.1038/s41597-020-0433-7
Jung, H. C., Getirana, A., Arsenault, K. R., Kumar, S., and Maigary, I. (2019). Improving surface soil moisture estimates in West Africa through GRACE data assimilation. J. Hydrol. 575, 192–201. doi: 10.1016/j.jhydrol.2019.05.042
Kpadonou, G., Ganyo, K., Segnon, A., and Zakari, S. (2023). Developing capacity to accelerate scaling of climate-smart agriculture in West and central: Lessons learnt from the regional capacity building initiative : AICCRA.
Lee, D., Anderson, W., Chen, X., Davenport, F., Shukla, S., Sahajpal, R., et al. (2025). HarvestStat Africa – harmonized subnational crop statistics for sub-Saharan Africa. Sci. Data 12, 690–613. doi: 10.1038/s41597-025-05001-z
Lobell, D. B., and Burke, M. B. (2010). On the use of statistical models to predict crop yield responses to climate change. Agric. For. Meteorol. 150, 1443–1452. doi: 10.1016/j.agrformet.2010.07.008
Lontsi Saadio, C., Adoni, W. Y. H., Aworka, R., Zoueu, J. T., Kalala Mutombo, F., and Kimpolo, C. L. M. (2022). Crops yield prediction based on machine learning models: case of West African countries. Smart. Agr. Technol. 2:100049. doi: 10.2139/ssrn.4003105
Lüdecke, H. J., Müller-Plath, G., Wallace, M. G., and Lüning, S. (2021). Decadal and multidecadal natural variability of African rainfall. J. Hydrol. Reg. Stud. 34:100795. doi: 10.1016/j.ejrh.2021.100795
MacCarthy, D. S., Traore, P. S., Freduah, B. S., Adiku, S. G. K., Dodor, D. E., and Kumahor, S. K. (2022). Productivity of soybean under projected climate change in a semi-arid region of West Africa: sensitivity of current production system. Agronomy 12:2614. doi: 10.3390/agronomy12112614
Mechiche-Alami, A., and Abdi, A. M. (2020). Agricultural productivity in relation to climate and cropland management in West Africa. Sci. Rep. 10:3393. doi: 10.1038/s41598-020-59943-y
Mekonnen, K., Velpuri, N. M., Leh, M., Akpoti, K., Owusu, A., Tinonetsana, P., et al. (2023). Accuracy of satellite and reanalysis rainfall estimates over Africa: a multi-scale assessment of eight products for continental applications. J. Hydrol. Reg. Stud. 49:101514. doi: 10.1016/j.ejrh.2023.101514
Mortey, E. M., Annor, T., Arnault, J., Inoussa, M. M., Madougou, S., Kunstmann, H., et al. (2023). Interactions between climate and land cover change over West Africa. Land 12:355. doi: 10.3390/land12020355
Niang, A., Becker, M., Ewert, F., Dieng, I., Gaiser, T., Tanaka, A., et al. (2017). Variability and determinants of yields in rice production systems of West Africa. Field Crop Res. 207, 1–12. doi: 10.1016/j.fcr.2017.02.014
Nicholson, S. E. (2013). The West African Sahel: a review of recent studies on the rainfall regime and its interannual variability. ISRN Meteorology 2013, 1–32. doi: 10.1155/2013/453521
Nkrumah, F., Vischel, T., Panthou, G., Klutse, N. A. B., Adukpo, D. C., and Diedhiou, A. (2019). Recent trends in the daily rainfall regime in southern West Africa. Atmos. 10:741. doi: 10.3390/ATMOS10120741
Obahoundje, S., Akpoti, K., Zwart, S. J., Tilahun, S. A., and Cofie, O. (2025a). Implications of changes in water stress and precipitation extremes for cocoa production in Côte D’ivoire and Ghana. Int. J. Climatol. 45:e8872. doi: 10.1002/joc.8872
Obahoundje, S., Bi, V. H. N., Kouassi, K. L., Ta, M. Y., Amoussou, E., and Diedhiou, A. (2020). Validation of three satellite precipitation products in two south-western African watersheds: Bandama (Ivory Coast) and mono (Togo). Atmos. Clim. Sci. 10, 597–613. doi: 10.4236/acs.2020.104031
Obahoundje, S., Tilahun, S. A., Birhanu, B. Z., and Schmitter, P. (2025b). A critical synthesis of remote sensing and machine learning approaches for climate hazard impact on crop yield. Environ. Res. Commun. 7:102001. doi: 10.1088/2515-7620/ae1099
Osgood, D., Blakeley, S. L., Ouni, S., Enenkel, M., Braun, M., Lebel, T., et al. (2024). Climate variability through the lens of applied weather index insurance in Senegal-a novel perspective on the implications of decadal variation. Front. Clim. 6:1281623. doi: 10.3389/fclim.2024.1281623
Panthou, G., Lebel, T., Vischel, T., Quantin, G., Sane, Y., Ba, A., et al. (2018). Rainfall intensification in tropical semi-arid regions: the Sahelian case. Environ. Res. Lett. 13:064013. doi: 10.1088/1748-9326/aac334
Panthou, G., Vischel, T., and Lebel, T. (2014). Recent trends in the regime of extreme rainfall in the Central Sahel. Int. J. Climatol. 34, 3998–4006. doi: 10.1002/joc.3984
Parkes, B., Defrance, D., Sultan, B., Ciais, P., and Wang, X. (2018a). Projected changes in crop yield mean and variability over West Africa in a world 1.5K warmer than the pre-industrial era. Earth Syst. Dynam. 9, 119–134. doi: 10.5194/esd-9-119-2018
Parkes, B., Sultan, B., and Ciais, P. (2018b). The impact of future climate change and potential adaptation methods on maize yields in West Africa. Clim. Chang. 151, 205–217. doi: 10.1007/s10584-018-2290-3
Parsons, D., Stern, D., Ndanguza, D., and Sylla, M. B. (2022). Evaluation of satellite-based air temperature estimates at eight diverse sites in Africa. Climate 10:98. doi: 10.3390/cli10070098
Rosenzweig, C., Elliott, J., Deryng, D., Ruane, A. C., Müller, C., Arneth, A., et al. (2014). Assessing agricultural risks of climate change in the 21st century in a global gridded crop model intercomparison. Proc. Natl. Acad. Sci. USA 111, 3268–3273. doi: 10.1073/pnas.1222463110
Roudier, P., Sultan, B., Quirion, P., and Berg, A. (2011). The impact of future climate change on West African crop yields: what does the recent literature say? Glob. Environ. Chang. 21, 1073–1083. doi: 10.1016/j.gloenvcha.2011.04.007
Salack, S., Klein, C., Giannini, A., Sarr, B., Worou, O. N., Belko, N., et al. (2016). Global warming induced hybrid rainy seasons in the Sahel. Environ. Res. Lett. 11:104008. doi: 10.1088/1748-9326/11/10/104008
Sanogo, S., Fink, A. H., Omotosho, J. A., Ba, A., Redl, R., and Ermert, V. (2015). Spatio-temporal characteristics of the recent rainfall recovery in West Africa. Int. J. Climatol. 35, 4589–4605. doi: 10.1002/joc.4309
Schlenker, W., and Roberts, M. J. (2009). Nonlinear temperature effects indicate severe damages to U.S. crop yields under climate change. Proc. Natl. Acad. Sci. USA 106, 15594–15598. doi: 10.1073/pnas.0906865106
Siamabele, B. (2021). The significance of soybean production in the face of changing climates in Africa. Cogent Food Agric. 7:1933745. doi: 10.1080/23311932.2021.1933745
Sultan, B., Defrance, D., and Iizumi, T. (2019). Evidence of crop production losses in West Africa due to historical global warming in two crop models. Sci. Rep. 9:12834. doi: 10.1038/s41598-019-49167-0
Sultan, B., and Gaetani, M. (2016). Agriculture in West Africa in the twenty-first century: climate change and impacts scenarios, and potential for adaptation. Front. Plant Sci. 7:1262. doi: 10.3389/fpls.2016.01262
Sylla, M. B., Nikiema, P. M., Peter Gibba, I., And bourahima, K., and Klutse, N. A. B. (2016). “Climate change over West Africa: recent trends and future projections” in Adaptation to climate change and variability in rural West Africa. eds. A. Jay and J. Hesselberg (Switzerland: Springer International Publishing Switzerland), 25–40.
Taylor, C. M., Belusic, D., Guichard, F., Parker, D. J., Vischel, T., Bock, O., et al. (2017). Frequency of extreme Sahelian storms tripled since 1982 in satellite observations. Nature 544, 475–478. doi: 10.1038/nature22069
Tefera, M. L., Giovanna, S., Alberto, C., and Awada, H. (2025). Rainfall variability and drought in West Africa: challenges and implications for rainfed agriculture. Theor. Appl. Climatol. 156:41. doi: 10.1007/s00704-024-05251-8
Thomas, N. P., Anyamba, A., Tubbs, H., and Bishnoi, B. (2022). Evaluation of extreme soil moisture conditions during the 2020 Sahel floods and implications for disease outbreaks. Geophys. Res. Lett. 49, 1–9. doi: 10.1029/2022GL099872
Traoré, S. B., Alhassane, A., Muller, B., Kouressy, M., Somé, L., Sultan, B., et al. (2011). Characterizing and modeling the diversity of cropping situations under climatic constraints in West Africa. Atmos. Sci. Lett. 12, 89–95. doi: 10.1002/asl.295
UNFCCC (2023). Conference of the parties serving as the meeting of the parties to the Paris agreement. United Nations framework convention on climate change. Bonn, Germany: United Nations Climate Change, 1–21.
UNFCCC (2024). Progress in the process to formulate and implement national adaptation plans. Bonn, Germany: United Nations Climate Change, 4–50.
van Bussel, L. G. J., Grassini, P., Van Wart, J., Wolf, J., Claessens, L., Yang, H., et al. (2015). From field to atlas: upscaling of location-specific yield gap estimates. Field Crop Res. 177, 98–108. doi: 10.1016/j.fcr.2015.03.005
Verdin, A., Funk, C., Peterson, P., Landsfeld, M., Tuholske, C., and Grace, K. (2020). Development and validation of the CHIRTS-daily quasi-global high-resolution daily temperature data set. Sci Data 7:303. doi: 10.1038/s41597-020-00643-7
Keywords: rainfall variability, crop yield sensitivity, hydroclimatic extremes, agroclimatic zones, West Africa
Citation: Obahoundje S, Tilahun SA and Schmitter P (2025) Hydroclimatic extremes and food security hotspots in West Africa: evidence from rainfall–yield interactions. Front. Clim. 7:1717323. doi: 10.3389/fclim.2025.1717323
Edited by:
Yubin Li, Nanjing University of Information Science and Technology, ChinaReviewed by:
Adetomiwa Kolapo, Obafemi Awolowo University, NigeriaLawrence Oyenpemi, Middle Tennessee State University, United States
Copyright © 2025 Obahoundje, Tilahun and Schmitter. This is an open-access article distributed under the terms of the Creative Commons Attribution License (CC BY). The use, distribution or reproduction in other forums is permitted, provided the original author(s) and the copyright owner(s) are credited and that the original publication in this journal is cited, in accordance with accepted academic practice. No use, distribution or reproduction is permitted which does not comply with these terms.
*Correspondence: Salomon Obahoundje, cy5vYmFob3VuZGplQGNnaWFyLm9yZw==