 Yigang Shen
 Lei Xie
- China Telecom Corporation Limited Zhejiang Branch, Hangzhou, China
In tactical communication networks, highly dynamic topologies and frequent data exchanges create complex spatiotemporal dependencies among link states. However, most existing intelligent routing algorithms rely on simplified model architectures and fail to capture these spatiotemporal correlations, resulting in limited situational awareness and poor adaptability under dynamic network conditions. To address these challenges, this study proposes an intelligent path selection method—Deep Reinforcement Learning with Spatiotemporal-aware Link State Guidance Algorithm (DRLSGA). The algorithm builds upon the Proximal Policy Optimization (PPO) framework to develop an intelligent decision-making model and integrates a link state feature extraction module that combines Gated Recurrent Units (GRU) and a Graph Attention Network (GAT). This design enables the model to learn long-term temporal dependencies and spatial structural relationships from sequential link state data, thereby enhancing perception and decision-making capability. An attention mechanism is further introduced to highlight salient features within link state sequences, while an optimal routing strategy is derived through a deep reinforcement learning-based training process. Experimental results demonstrate that, compared with the existing DRL-ST algorithm, DRLSGA reduces average end-to-end latency by at least 2.07%, lowers the packet loss rate by 1.65%, and increases average throughput by up to 2.59% under high-traffic conditions. Moreover, the proposed algorithm exhibits stronger adaptability to highly dynamic network topologies.
1 Introduction
The evolution of modern warfare has driven battlefield communication systems toward greater efficiency, flexibility, and intelligence. Routing technology plays a critical role in ensuring dependable data transmission within tactical communication networks, enabling coordination among units during missions, and improving overall quality of service (QoS) (Suomalainen et al., 2021; Liu et al., 2024). Under intelligent warfare conditions, however, the increasing number, heterogeneity, and autonomy of battlefield elements have created a highly complex and adversarial communication environment (Patel et al., 2023).
Tactical communication networks designed for intelligent combat must meet several demanding requirements. First, more than five types of heterogeneous services—such as voice, image, and video—are typically transmitted, each with distinct QoS demands concerning delay, bandwidth, and packet-loss tolerance (Pourranjbar et al., 2023). Second, the network infrastructure incorporates more than ten types of heterogeneous links, including shortwave, microwave, and optical fiber, with data rates ranging from Kbps to hundreds of Mbps. These diverse and dynamic link conditions significantly influence network performance and complicate routing decisions. As a result, the design and deployment of routing algorithms face new challenges in highly mobile and adversarial battlefield scenarios (Bajracharya et al., 2023).
Conventional routing approaches generally compute optimal paths using partial or limited link state information. While effective under stable conditions, these methods adapt poorly to rapid traffic fluctuations and often fail to meet diverse QoS requirements. The explosive growth of data traffic and applications in tactical communication networks further amplifies these limitations, leading to inefficiency and reduced accuracy (Liu et al., 2023). Deep reinforcement learning (DRL), a branch of artificial intelligence, has emerged as a promising solution to these challenges. DRL offers self-learning capabilities without requiring prior environmental knowledge and is well-suited for optimizing high-dimensional state spaces (Wang et al., 2023). Consequently, DRL-based routing strategies have attracted significant attention in path decision-making research.
Despite their potential, conventional DRL algorithms exhibit notable drawbacks. They often require lengthy trial-and-error exploration, during which valuable samples are underutilized while uninformative samples are repeatedly processed. This inefficiency leads to slow convergence and suboptimal routing decisions, which may aggravate congestion (He et al., 2023). Moreover, the frequent topological changes and intensive data exchanges in tactical communication networks give rise to complex temporal and spatial dependencies in link state information (Yang et al., 2024). Most existing DRL-based routing algorithms overlook these spatiotemporal correlations, thereby limiting situational awareness and adaptability. As a result, end-to-end QoS requirements are often not met.
To address these limitations, this study proposes a deep reinforcement learning with spatiotemporal-aware link state guidance algorithm (DRLSGA) for tactical communication networks. The algorithm leverages proximal policy optimization (PPO) to construct an intelligent path decision model while integrating a link state feature extraction module. Specifically, a gated recurrent unit (GRU) is employed to capture temporal dependencies in link state sequences, and a graph attention network (GAT) is used to model spatial correlations. An additional attention mechanism highlights critical features within the state sequence. Together, these components enable the DRL framework to generate an optimal path forwarding policy with improved adaptability to dynamic network topologies. The contributions of this work can be concluded as:
• The study identifies critical limitations of existing DRL-based routing algorithms in tactical communication networks, including slow convergence, inefficient sample utilization, and the inability to capture spatiotemporal correlations in link state information.
• A novel deep reinforcement learning with spatiotemporal-aware link state guidance algorithm is proposed. The algorithm integrates PPO-based decision-making with a specialized link state feature extraction module.
• Temporal dependencies of link state sequences are captured using GRU, while spatial correlations are modeled through GAT. An attention mechanism is further introduced to highlight critical features, thereby enhancing situational awareness.
To further enhance transparency and reproducibility, we commit to releasing the full source code upon acceptance of this paper. All resources will be hosted on GitHub, enabling researchers to readily reproduce our results and adapt the proposed method to other recommendation tasks.
2 Related works
Global network path planning algorithms can be broadly categorized into three classes based on their underlying principles and decision-making mechanisms: traditional routing algorithms, heuristic routing algorithms, and DRL-based routing algorithms. Traditional routing algorithms are typically divided into static and dynamic approaches. Heuristic routing algorithms utilize experience-based and rule-driven strategies for path planning. DRL-based routing algorithms, depending on their learning strategies, fall into value function-based and policy gradient-based methods.
2.1 Traditional routing algorithms
Conventional routing algorithms are typically divided into static and dynamic categories. Static routing involves manually configured routing tables and is incapable of adapting to variations in network topology or traffic conditions. As networks grow in scale and complexity, manual configuration becomes increasingly cumbersome and error-prone, rendering static routing unsuitable for dynamic environments. In contrast, dynamic routing algorithms autonomously adjust routing tables in response to network conditions, making them more adaptable and suitable for complex, dynamic communication scenarios (Zhou et al., 2023).
Traditional routing algorithms are supported by well-established theoretical foundations and have been widely applied across various domains. For instance, Mehraban et al. introduced an intelligent node placement strategy that integrates both node connectivity and traffic features, demonstrating notable improvements in reducing maximum link utilization over existing methods (Hussain and Sinha Roy, 2021). Similarly, Zhu et al. introduced a routing algorithm tailored for low Earth orbit satellite ad hoc networks by enhancing open shortest path first (OSPF) to accommodate dynamic satellite topologies, incorporating a routing reconstruction mechanism to ensure reliable data transmission (Zhu and Jin, 2023). Hussain et al. introduced a smart flow steering agent that leverages real-time network conditions to dynamically balance traffic in SDN, thereby enhancing routing efficiency and overall performance (Hussain et al., 2021). However, as network traffic and scale continue to grow exponentially, conventional routing algorithms face mounting limitations due to their restricted ability to obtain real-time link state information. This limitation results in slower convergence and delayed responsiveness to dynamic traffic changes, thereby reducing transmission efficiency. Consequently, Traditional routing strategies are inadequate for addressing the complex and dynamic demands of tactical communication networks in intelligent combat scenarios, thereby hindering the formulation of globally optimal routing decisions.
2.2 Heuristic routing algorithms
Heuristic algorithms are well-suited for solving complex optimization problems and offer notable advantages over traditional methods when addressing large-scale and dynamic network environments. As such, they have increasingly become mainstream solutions for routing optimization tasks. Tabatabaei et al. combined the bacterial foraging optimization algorithm with a mobile sink approach to propose a novel routing algorithm for wireless sensor networks. By incorporating node energy information in the path selection process, the algorithm effectively reduced control overhead and bandwidth consumption while improving routing accuracy (Tabatabaei, 2022). Alnajjar et al. developed a genetic algorithm to optimize cluster head placement in wireless sensor networks, achieving balanced distribution and stable energy usage. By employing customized crossover and mutation operations, the method gradually improved sensor-to-cluster assignments, confirming the efficiency and reliability of the approach over multiple generations (Alnajjar et al., 2022). Deng et al. (2022) introduced an ant colony optimization (ACO)-based routing algorithm for low Earth orbit (LEO) satellite networks. Their method jointly considers path distance, transmission direction, and link load to identify routes with minimal delay and cost, thereby achieving load balancing in the satellite network. Shokouhifar (2021) designed a fuzzy heuristic ACO algorithm that utilizes a multi-objective function incorporating power consumption, delay, and reliability, allowing for adaptive routing based on application-specific requirements. Ju et al. designed a dynamic load-balancing routing approach for LEO satellite networks was developed by integrating multiagent dueling double deep Q-network with spatiotemporal traffic prediction. By utilizing both local and predicted traffic data, the method efficiently optimizes routing, reduces peak and average bandwidth usage, and balances network load (Ju et al., 2025). While heuristic routing algorithms have demonstrated strong capability in solving complex network optimization problems and have been widely applied, they often require specific network assumptions and conditions. Variations in network topology and link status can introduce significant volatility and error, undermining algorithm scalability and stability. As a result, these methods tend to perform poorly in highly dynamic and unpredictable environments, such as tactical communication networks under battlefield conditions, where rapid changes in structure and link quality are common. Consequently, heuristic routing algorithms face challenges in maintaining robust QoS under such circumstances.
2.3 Deep reinforcement learning-based routing algorithms
DRL offers the capability to learn complex, nonlinear policies through interaction with the environment, exhibiting superior flexibility and adaptability in solving practical problems. These advantages have opened new avenues for addressing complex network optimization challenges (Dake et al., 2021). To address the limitations of traditional routing strategies in SDN, particularly their inability to meet diverse application-level QoS requirements and their lack of interaction with the network environment, Li et al. (2021) proposed DRNet—an intelligent, QoS-aware routing algorithm. This approach utilizes traffic demand matrices and network state information as input to the DRL agent for training, enabling more flexible routing deployment. Fu et al. (2020) designed a deep Q network (DQN)-based routing strategy that distinguishes between mouse flows and elephant flows in data center networks, thereby improving throughput and reducing latency and packet loss. Liu et al. (2021) introduced a DRL-based routing algorithm that reconfigures network resources by assigning weighted importance to caching, bandwidth, and latency. Network states are represented as multidimensional inputs to the agent, enabling perceptual learning and optimized resource allocation, which enhances throughput and robustness. Casas-Velasco et al. (2021) proposed a DQN-based intelligent routing algorithm under the SDN architecture that learns path state information for dynamic routing decisions, addressing the challenge of traffic variability in traditional routing schemes. He et al. integrates graph neural networks with deep reinforcement learning to capture network topology information and guide routing decisions, which enables balanced traffic distribution and enhanced performance (He et al., 2023). Huang et al. (2022) developed a deep graph reinforcement learning (DGRL) routing algorithm that integrates graph convolutional network (GCN) with DDPG to achieve effective traffic control in wireless sensor networks. Zhou et al. (2022) proposed a PPO-based QoS-aware routing optimization mechanism, which adjusts the reward function dynamically according to different optimization goals, thus enabling a generic and customizable routing optimization framework.
These DRL-based intelligent routing algorithms demonstrate strong adaptability to complex and dynamic network conditions, enabling autonomous policy adjustments and improving overall service quality. However, several limitations persist. Current methods often suffer from slow convergence and unstable performance, and many focus solely on single or limited link-level features, neglecting the heterogeneous QoS demands across different traffic types. Moreover, the highly dynamic topology and rapidly changing link states of tactical communication networks challenge the fixed-architecture neural networks used in existing models, limiting their situational awareness and adaptability. Consequently, current intelligent routing algorithms are inadequate for optimal path decision-making in highly mobile, adversarial battlefield environments.
3 Basic theory
3.1 SDN network measurement mechanism
This study employs Ryu (Ryu SDN Framework Community, 2020) as the SDN controller to achieve network topology awareness and link status monitoring, implementing the described application requirements using Python programming.
3.1.1 Network topology perception
The link layer discovery protocol (LLDP) (Chang et al., 2020) is used in the SDN network to obtain the network topology structure. The main principle is shown in Figure 1, the controller periodically sends a Packet-Out message encapsulating LLDP data packet to the S1 node of the data plane through the OpenFlow channel. Upon receiving the Packet-Out message, node S1 processes it and forwards it via the designated port to node S2. Since S2 cannot find a matching flow table entry for the incoming packet, it responds by sending a Packet-In message to the controller. The controller then interprets this message to generate identifiers—such as Classis ID and Port ID—that help recognize neighboring nodes and their associated ports. Other adjacent nodes are identified in the same way, and finally the entire network topology structure is obtained.
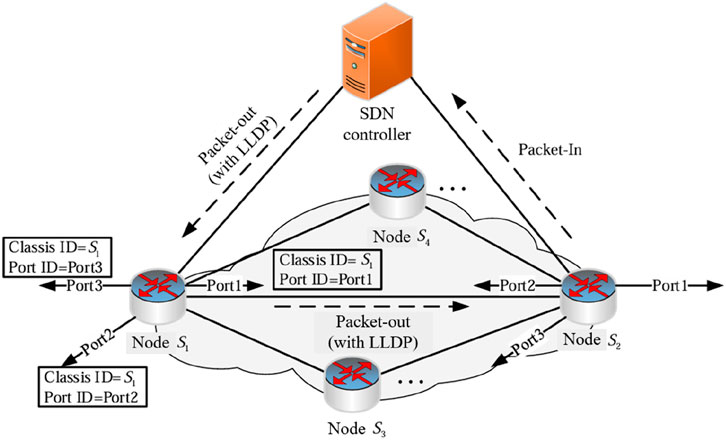
Figure 1. Network topology awareness.
After achieving global network topology awareness, the NetworkX module in Python is used to store the topology as a graph
3.1.2 Delay measurement SDN
The delay measurement method of the network link (Lu et al., 2023) is shown in Figure 2. First, the SDN controller sends LLDP protocol to nodes S1 and S2 to obtain timestamps
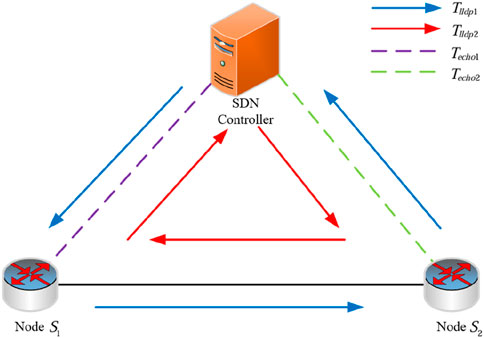
Figure 2. Delay measurement.
3.1.3 Remaining bandwidth measurement
The remaining bandwidth measurement method of the SDN network link is shown in Figure 3. The controller sends a port status request message to the node at t1 and t2 to query the node status. The node replies with a port status reply (Port Stats Reply) message. The controller parses the data packet of the reply message to obtain the sent byte count
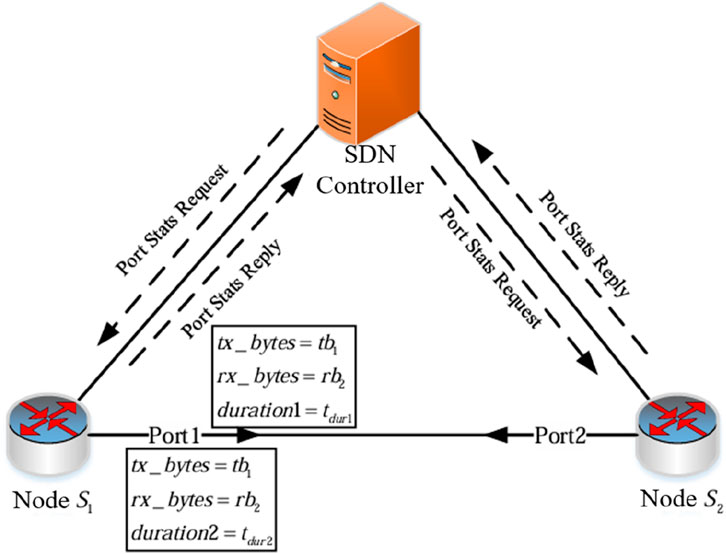
Figure 3. Remaining bandwidth measurement.
3.1.4 Packet loss rate measurement
The packet loss rate measurement method of the SDN link is shown in Figure 4. The controller sends a Port Stats Request message to nodes S1 and S2 to query the node status. The node replies with a Port Stats Reply message. The controller parses the data packet of the reply message and obtains the number of sent data packets
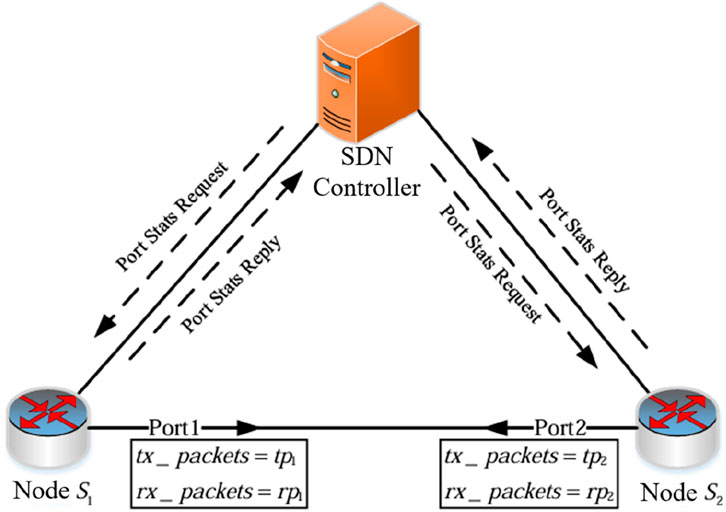
Figure 4. Packet loss rate measurement.
3.2 Proximal policy optimization algorithm
The PPO algorithm is an improvement on the trust region policy optimization (TRPO) algorithm (Li and He, 2023). Its main advantage is to limit the distance between the new policy
The basic framework of the PPO algorithm can be divided into two parts, the Actor network and the Critic network. The Actor network is a policy network that maps the state
The PPO algorithm can be refined into PPO-penalty with adaptive KL-divergence and PPO-clip with clip clipping according to the policy update method of the Actor network. The objective functions of PPO-Penalty and PPO-Clip are defined in Equations 6, 7.
where
3.3 System architecture and network model
3.3.1 System architecture
The SDN architecture decouples network control from data forwarding, thereby improving resource utilization and enhancing network transmission performance. This separation offers new opportunities for enabling resilient and adaptive tactical communication networks with intelligent capabilities (Bale et al., 2023). Accordingly, this study designs a tactical communication network path optimization system architecture based on SDN, as illustrated in Figure 5, which comprises three layers: the data layer, control layer, and application layer.
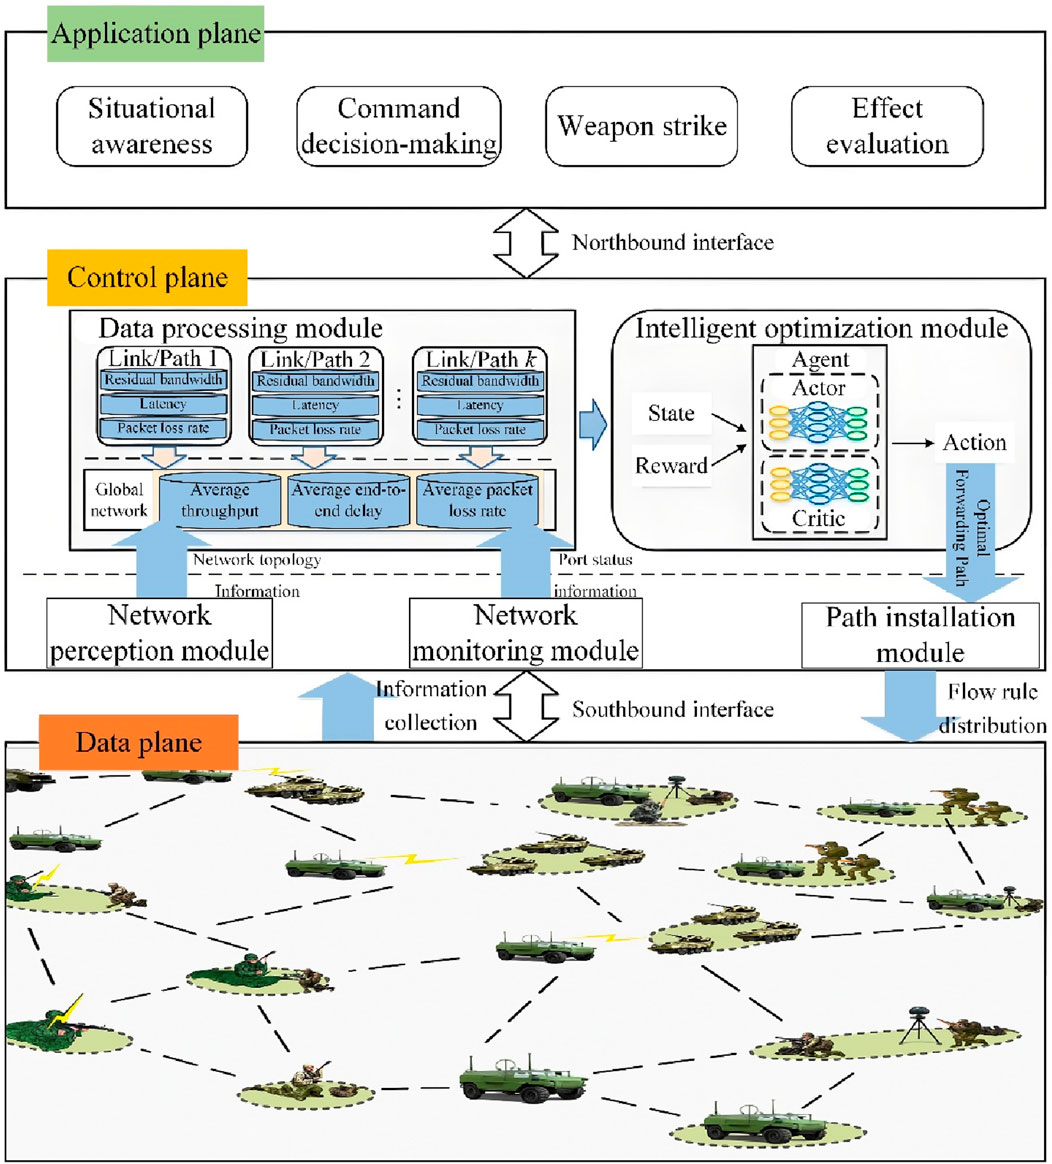
Figure 5. System architecture.
3.3.1.1 Data layer
The data layer is responsible for deploying the tactical communication network, consisting of various routing nodes and communication links. It primarily handles the transmission of mission-critical traffic. Through the southbound interface, it reports real-time network information to the control layer and receives control policies from the control layer, executing corresponding operations such as data processing and forwarding.
3.3.1.2 Control layer
Serving as the core of the path optimization system, the control layer periodically issues requests to the data layer via the southbound interface to acquire global network information, including topology and link states. It then transmits optimized control strategies back to the data layer. A data processing module within the control layer maintains statistical records of global network metrics such as average throughput, average end-to-end delay, and average packet loss rate. These metrics are used as inputs to the reward function of the intelligent routing optimization module.
The control layer consists of five functional modules: network perception, network monitoring, data processing, intelligent decision-making, and path installation. The network perception module periodically issues feature request messages to the data layer to obtain the topology information of the tactical communication network. The network monitoring module periodically sends status request messages and asynchronously receives status reply messages to acquire the port status information of routing nodes. The data processing module utilizes the topology and port status data collected by the network perception and monitoring modules to compute link state and end-to-end path state metrics, including residual bandwidth, delay, and packet loss rate. These metrics serve as the network state inputs (
The intelligent decision-making module employs a learning agent that takes the network state as input and trains a model to generate forwarding actions for traffic in the data layer. The path installation module translates the agent’s output actions into flow tables, which are then deployed to the data layer to guide service transmission.
The intelligent decision-making module in the control layer adopts a smart routing decision model based on the PPO algorithm within an actor-critic AC framework. To capture the spatiotemporal dependencies inherent in link state information, the proposed method integrates GRU and GAT in place of the traditional feedforward neural network employed in standard PPO architectures. This design enhances the agent’s perception of link dynamics and improves the overall intelligence of routing decisions.
The control layer normalizes the collected network topology and link state information into a unified network model, which is subsequently fed into the deep reinforcement learning agent for training. The agent dynamically adjusts the optimal routing policy by continuously interacting with real-time state information, aiming to maximize the accumulated reward.
3.3.1.3 Application layer
The application layer encompasses a wide range of tactical services and applications, including situational awareness, command and control, and weapon engagement. It interacts with the control layer through a northbound interface to facilitate information exchange.
3.3.2 Network model
The tactical communication network topology model is graph
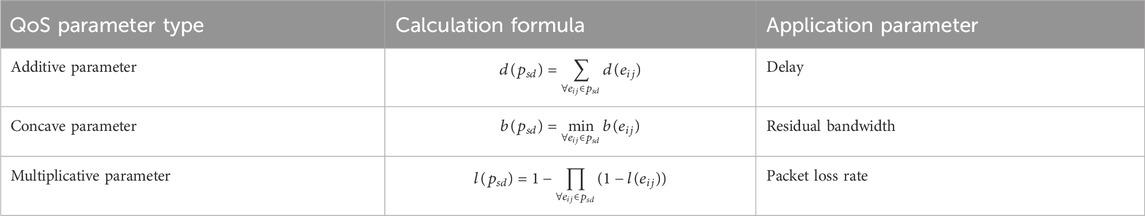
Table 1. QoS parameter definition.
The set of all end-to-end paths through which service flows exist in the global network is recorded as
Definition 1. Average network throughput is presented in Equation 8. The average network throughput represents the average value of the total amount of data successfully transmitted through the end-to-end paths of all service flows per unit time.
where
Definition 2. Average end-to-end delay is presented in Equation 9. The average end-to-end delay represents the average value of the sum of the end-to-end delays of all service flows through the paths.
where
Definition 3. Average packet loss rate is presented in Equation 10. The average packet loss rate represents the average value of the sum of the packet loss rates of all service flows through the paths.
where
4 Design of intelligent path optimization algorithm
4.1 PPO agent
The intelligent optimization algorithm proposed in this paper uses PPO to construct a deep reinforcement learning agent for model training. PPO is more versatile and stable than DDPG, actor-critic and other algorithms (Li and Wu, 2025). The PPO algorithm is implemented based on the AC network architecture. The policy network Actor is used to learn the mean of the network environment state output action, and the evaluation network Critic is used to output the state value. The agent interacts with the environment through state, action and reward information, and continuously optimizes the strategy through iterative training.
As a framework-based deep reinforcement learning algorithm, PPO requires the design of different state spaces, action spaces and reward functions for different problems and different application scenarios. In this paper, based on the PPO deep reinforcement learning framework, the state space, action space and reward function are designed for the tactical communication network scenario, as follows:
1. State space. The state space is the set of link state information obtained by the agent from the tactical communication network. The network state
where
The specific representation of each network link state information set is shown in Equations 13–15. Due to the large differences in the element values in the link state information, this difference will cause the intelligent path optimization algorithm to fluctuate greatly during the training process and it is difficult to reach a convergence state. Therefore, the Min-Max method is used to normalize the elements in the link state information.
The state space of the agent is designed to be a state sequence formed by combining the state information containing time t and l−1 time steps before the time, as shown in Equation 16.
2. Action space. The action space refers to the set of actions taken by the agent according to the state
3. Reward function. The control layer feeds back the collected real-time network performance indicators as reward signals to the agent. The optimization goal of the algorithm in this paper is set to maximize network throughput and minimize end-to-end delay and packet loss. In order to make the optimization goal increase proportionally with the reward value, the reward function is defined as shown in Equation 17.
where
The PPO algorithm policy update stage uses the advantage function
where
The traditional policy gradient update algorithm will cause serious deviations in the execution strategy of the agent due to the inaccurate estimation of the advantage function [33]. Therefore, this paper adopts the importance sampling method to adjust the strategy update amplitude and improve the efficiency of strategy update and sample utilization during training. The importance sampling is presented in Equation 19.
where
To better adapt to the dynamic changes of the network topology and the uneven distribution of samples, the algorithm in this paper adopts a gradient clipping method defined as Equation 20, which effectively limits the magnitude of policy updates. The policy update of the algorithm is shown in Equation 21. While restricting the extent of policy updates, the algorithm also aims to maximize the expected cumulative reward, thereby improving the convergence and stability of the algorithm.
where,
4.2 Link state feature extraction module
In order to better extract the temporal and spatial characteristics of the tactical communication network link state information, this paper introduces GRU, GAT, and a self-attention mechanism to construct a link state feature extraction module, replacing the feedforward neural network structure of PPO. This enables the perception of the spatiotemporal characteristics of link state information and realizes end-to-end optimal action policy output. As shown in Figure 6, the link state feature extraction module mainly consists of a temporal feature extraction module, a self-attention mechanism module, a spatial feature extraction module, and a multilayer perceptron module.
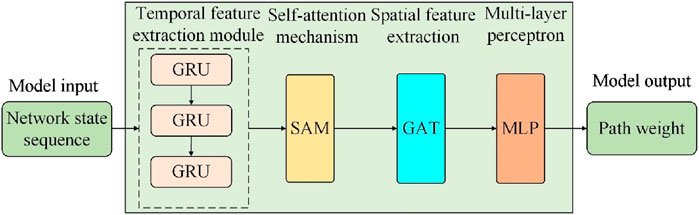
Figure 6. Link state information feature extraction module.
4.2.1 Time feature extraction module
The time correlation of link state refers to the mutual dependence between link state data within a certain time range, and is also the dynamic change of link state information over time. Therefore, when considering the time correlation of link state information, this paper needs to input a network state sequence with a time step of l for the agent. When the initial network state
where
The reset gate
where
As shown in Equation 24, the output of the reset gate at the current time step (
where
The output of the hidden state is shown in Equation 25. The hidden state
Since the state sequence
4.2.2 Self-attention mechanism module
The self-attention mechanism is used to capture the dependencies and importance among different samples in the state sequence. It determines the importance of each sample in model computation by calculating the correlations (i.e., attention weights) between different samples in the sequence, thereby enhancing the model’s ability to perceive the critical parts of the input sequence. According to Equations 27–29, the outputs of the GRU hidden layer are multiplied by three weight matrices
Then, the attention weight of each unit is computed, and the attention matrix
where, M represents the dimension of the weight matrix, and
Finally, the Hadamard product of
where
4.2.3 Spatial feature extraction module
GAT is capable of focusing on neighboring node information with different weights and demonstrates excellent spatial information capturing capabilities. Therefore, this paper employs GAT to extract the spatial correlation features of complex tactical communication network link state information. Since this study focuses on the link state characteristics in the tactical communication network, links are mapped to nodes in the graph structure for feature extraction. The data output from the temporal feature extraction module, after passing through the self-attention mechanism module, is denoted as
where,
To facilitate the calculation of attention coefficients, a softmax function is introduced to normalize the attention coefficients, as shown in Equation 34.
where,
Then, the normalized attention coefficients are used to perform a linear aggregation of the neighborhood representations of the nodes to obtain the final output features of the node, which is illustrated in Equation 35.
where,
Since single-head attention may suffer from instability during the training process, multi-head attention is introduced to enhance the model’s representation capability and improve the algorithm’s stability. Specifically, K is used to represent the number of heads. The above operation is performed for each head, and the final results are concatenated. Then, an averaging operation is applied to the concatenated results, followed by a delayed application of a nonlinear function to obtain the final representation, as shown in Equation 36.
The GAT module outputs all node characteristics to obtain the characteristic matrix
4.2.4 Multi-layer perceptron module
The multi-layer perceptron (MLP) module is used to implement the model’s output function. The feature matrix
The final output is the action weight matrix
4.2.5 DRL-SGA path optimization algorithm
The structure of the DRL-SGA path optimization algorithm is shown in Figure 7.
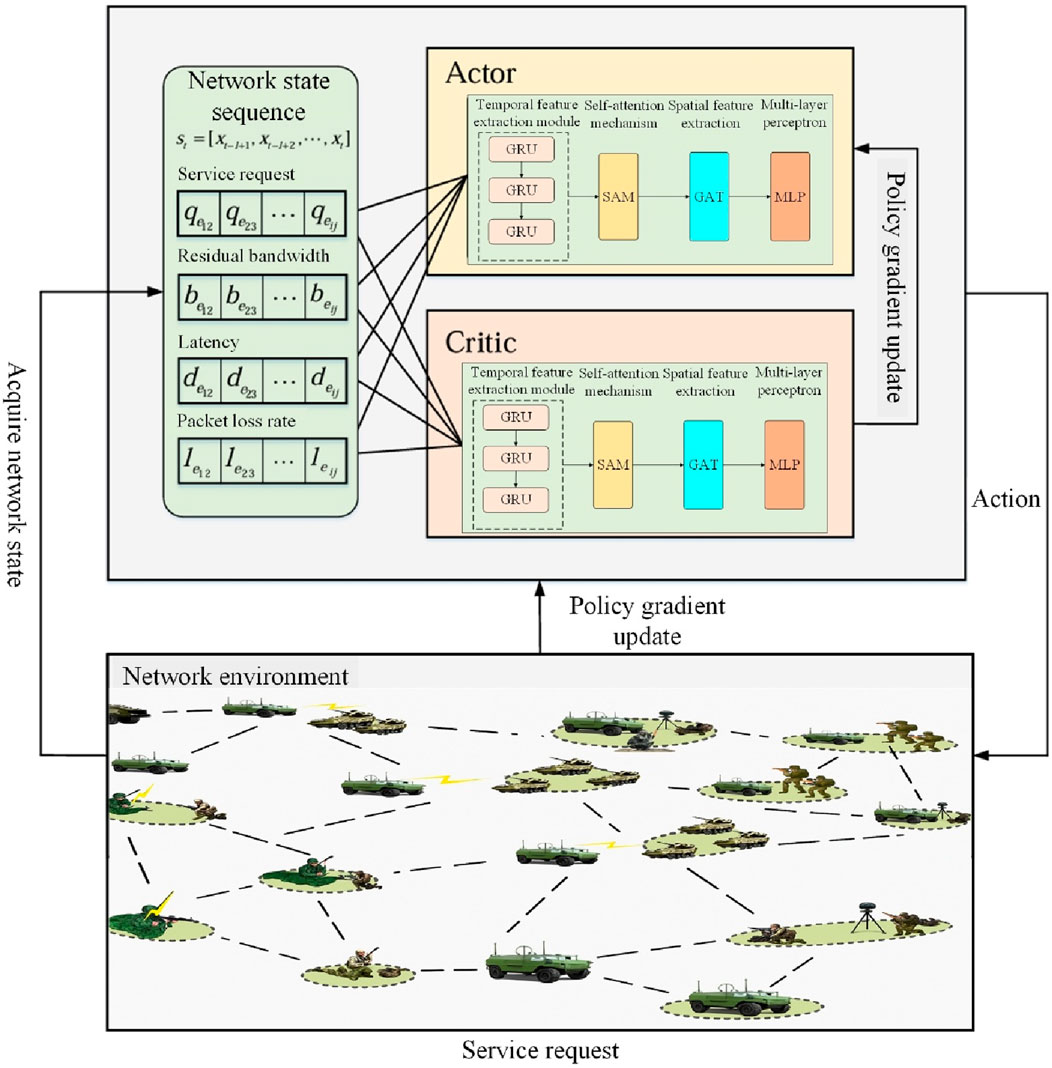
Figure 7. DRL-SGA algorithm structure.
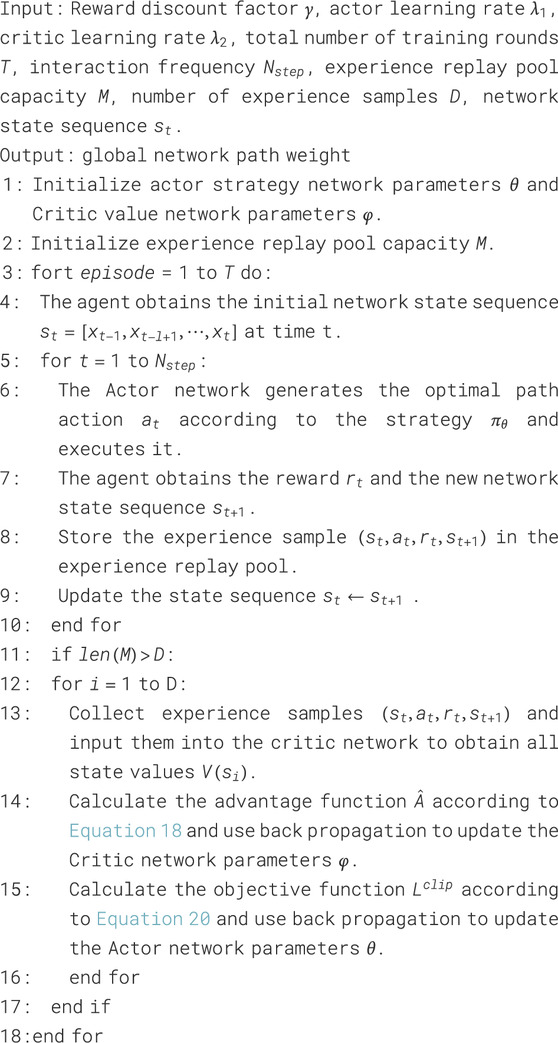
Algorithm 1. DRL-SGA algorithm.
5 Simulation scenario setup and result analysis
The experimental simulation platform in this paper is based on the Linux operating system Ubuntu 18.04. The hardware platform is equipped with an Intel(R) Core (TM) i7-10700 CPU, 16.0 GB RAM, and a Tesla V100s GPU. The Mininet 2.3.0 network simulation software is used to build the network topology, with Ryu 4.34 serving as the network controller. The DRL-SGA algorithm is implemented based on PyTorch 1.11.0.
5.1 Scenario setup
The experimental scenario constructs an integrated tactical communication network oriented toward joint operations. The network structure is shown in Figure 8, consisting of 47 nodes and 61 links. Among them, nodes 18, 19, and 20 and nodes 32, 33, and 34 simulate sensor nodes. Nodes 42, 43, and 44 simulate command and control nodes. Nodes 11, 12, and 13, nodes 25, 26, and 27, and nodes 39, 40, and 41 simulate fire strike nodes. The traffic transmission path follows the principle of “Sensor — Command and Control — Fire Strike.” The tactical communication network contains more than 10 types of heterogeneous links. The types of heterogeneous links are shown in Table 2. To simulate the impact of a highly adversarial environment on link status, experiments are conducted by setting different link bandwidths in the Mininet simulation software.
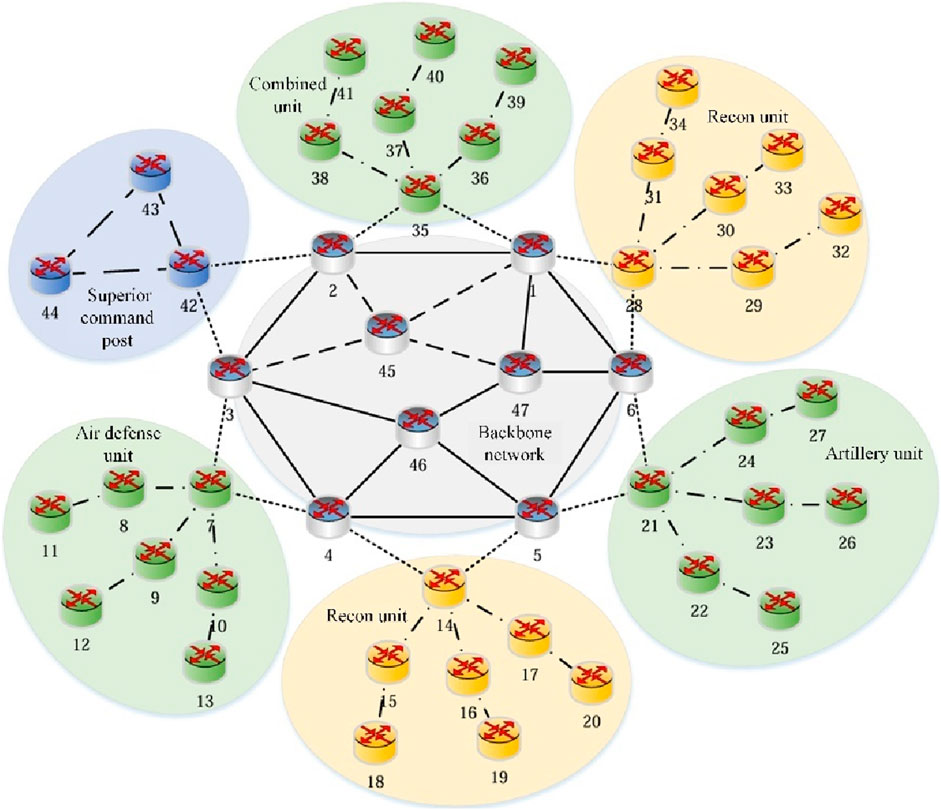
Figure 8. Tactical communication network.
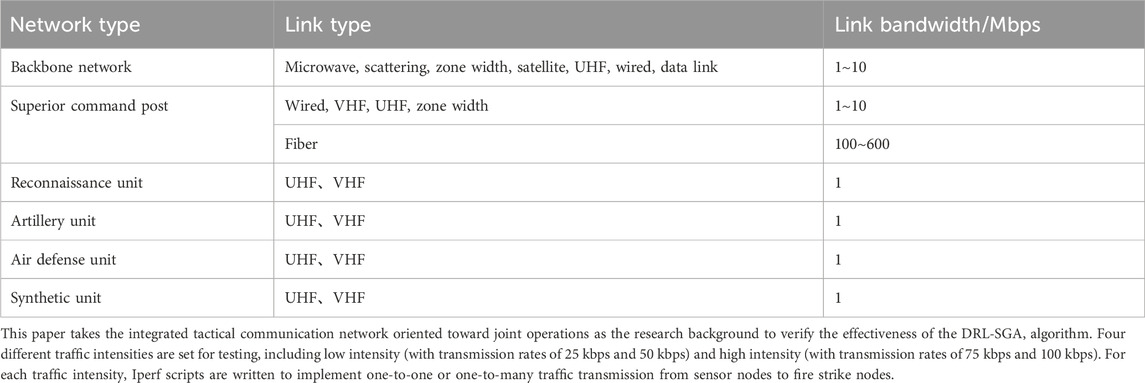
Table 2. Types of heterogeneous links.
The experiment sets five different traffic intensities in units of kbps: {20, 40, 60, 80, 100} for testing. For each traffic intensity, an Iperf [34] script is written to implement one-to-one or one-to-many traffic transmission from sensor nodes to fire strike nodes, and the Ryu controller is used to measure network performance parameters.
5.2 Parameter settings
The parameter settings of the DRL-SGA algorithm are shown in Table 3.
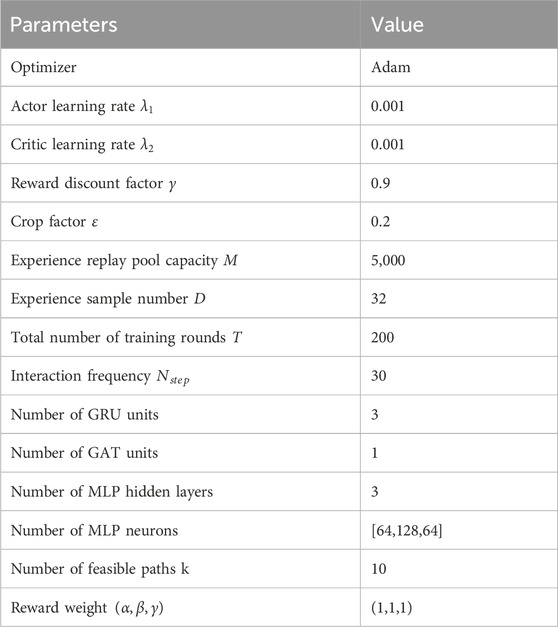
Table 3. DRL-SGA parameter settings.
5.3 Network performance comparison under different traffic intensities
To verify the effectiveness of the DRL-SGA algorithm in improving the quality of service under different traffic intensities, this paper compares the DRL-SGA algorithm with the following three routing algorithms:
1. OSPF: Open shortest path first algorithm. It obtains the weight information of each link in the network through an SDN measurement mechanism and calculates the path with the shortest link weight.
2. DQN [35]: A deep reinforcement learning routing algorithm based on the traditional DQN. The agent performs perception and training based on link state information. The reward function is set the same as in this paper.
3. DDPG [36]: A deep reinforcement learning routing algorithm based on the traditional DDPG. The agent adopts a fully connected feedforward neural network structure. By interacting with the network environment, it learns the routing strategy using link state information. The reward function is set the same as in this paper.
4. DRL-ST: Constructs an end-to-end transmission path decision model based on Dueling DQN and optimizes the sampling mechanism using SumTree. Routing decisions are made based on link state information, with the reward function set the same as in this paper.
The experiment uses average network throughput, average end-to-end delay, and average packet loss rate as evaluation metrics. For each traffic intensity, data transmission is tested five times, and the average of the measurement results is taken for comparison. The results are as follows:
The comparison results in Figure 9 indicate that under low traffic intensity scenarios, the throughput improvement of DRL-SGA over other algorithms is not significant. This is because the low service traffic intensity and sufficient link bandwidth resources do not lead to noticeable network congestion, resulting in relatively small differences in throughput across algorithms. However, as traffic intensity increases, DRL-SGA demonstrates a more pronounced advantage in throughput performance compared to the other algorithms. In high traffic intensity scenarios, DRL-SGA consistently maintains a relatively high level of network throughput. When the traffic intensity reaches 100 kbps, the throughput improves by up to 23.48% compared with the OSPF algorithm, and by up to 2.59% compared with the better-performing DRL-ST algorithm. This indicates that DRL-SGA can formulate more optimal routing strategies based on network load conditions and dynamic link state variations.
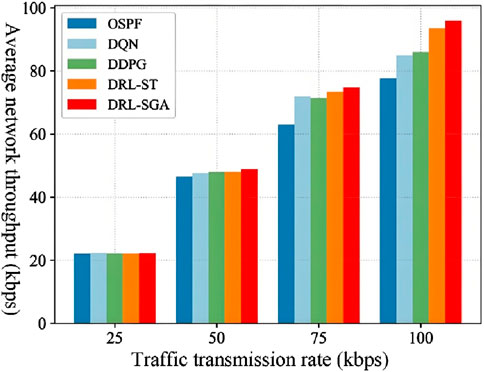
Figure 9. Comparison of average network throughput.
As shown in Figure 10, DRL-SGA achieves lower average end-to-end delay than the comparison routing algorithms under all traffic intensity levels. Moreover, as the traffic intensity increases, DRL-SGA demonstrates more outstanding performance in guaranteeing end-to-end latency. Compared with the traditional OSPF algorithm, DRL-SGA reduces the average end-to-end delay by at least 14.42%, with a maximum reduction of 33.57%. Compared with the DQN algorithm, the delay is reduced by a minimum of 5.69% and up to 25.04%. When compared with the DDPG algorithm, the reduction ranges from 7.08% to 22.44%. Even compared to the better-performing DRL-ST algorithm, DRL-SGA achieves a delay reduction of at least 2.07% and up to 16.88%.
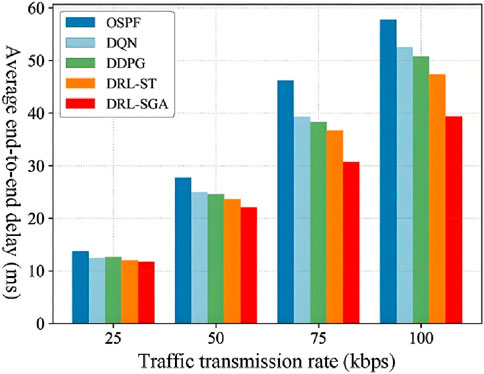
Figure 10. Comparison of average end-to-end delay.
The comparison results in Figure 11 show that DRL-SGA consistently achieves a lower average packet loss rate than the comparison routing algorithms across different traffic intensities. Moreover, as traffic intensity increases, DRL-SGA maintains more stable packet loss performance. Compared with the traditional OSPF algorithm, the average packet loss rate of DRL-SGA is reduced by at least 14.66%. When compared with intelligent algorithms DQN, DDPG, and DRL-ST, the average packet loss rate is reduced by at least 9.03%, 8.73%, and 1.65%, respectively.
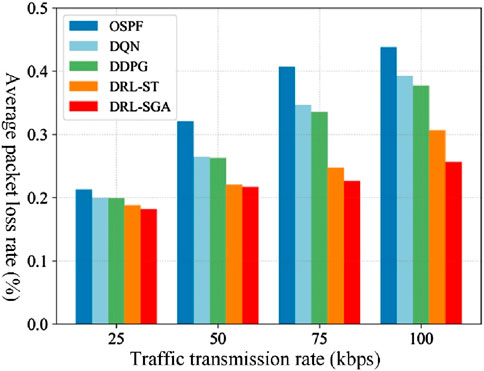
Figure 11. Comparison of average packet loss rate.
The above results demonstrate that the DRL-SGA algorithm exhibits superior adaptability to network environments with varying traffic intensities. This advantage stems from the fact that OSPF is a routing algorithm based on fixed forwarding rules, which makes it difficult to dynamically adjust routing strategies in response to changes in network traffic, thereby increasing the likelihood of link congestion. In contrast, DQN, DDPG, and DRL-ST utilize deep reinforcement learning mechanisms to perceive network state changes in real time and dynamically adjust optimal routing strategies. This capability allows them to alleviate network congestion to a certain extent, thereby reducing latency and packet loss while improving throughput compared to the OSPF algorithm. However, due to the limitations of fully connected feedforward neural networks used in these traditional methods, their perception capabilities are constrained, which hinders optimal path decision-making.
DRL-SGA, by leveraging the collaborative functionality of GRU, GAT, and attention mechanisms, effectively captures the spatiotemporal characteristics of network link states. It fully exploits hidden information within the link state data and captures evolving trends in link status, thereby enhancing the model’s decision-making and perception capabilities and enabling the generation of more optimal routing strategies. As a result, DRL-SGA demonstrates robust adaptability to varying traffic intensity conditions, effectively reducing end-to-end delay and packet loss while improving network throughput, thereby ensuring real-time and reliable transmission of service data.
5.4 Ablation study
To evaluate the effectiveness of individual components in the link-state feature extraction module for enhancing the perceptual capability of the DRL-SGA algorithm, an ablation study was conducted under the scenario where three links were broken and traffic intensity was set to 100 kbps. The attention mechanism, the temporal feature extraction module (GRU), and the spatial feature extraction module (GAT) were removed individually. The performance of each ablated algorithm was compared with that of the full DRL-SGA model by analyzing the convergence behavior of their reward functions. The comparative results are illustrated in Figure 12.
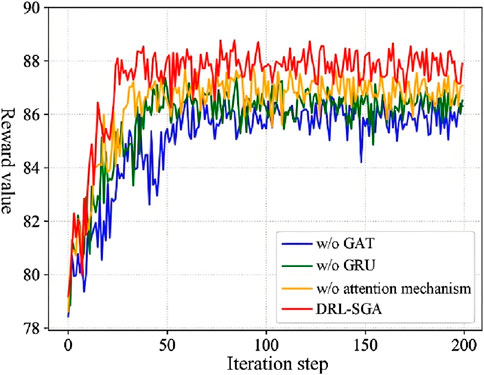
Figure 12. Comparison of reward convergence.
As shown in Figure 12, the removal of any component from the link-state feature extraction module resulted in a decrease in the final reward value at convergence, indicating a reduction in the perceptual and decision-making capabilities of the agent model. This led to suboptimal routing choices. Furthermore, the removal of each module increased the number of iterations required for convergence and slowed the convergence speed. The most significant degradation was observed when the GAT module was ablated, which yielded the lowest reward and slowest convergence. This is attributed to the role of GAT in capturing spatial dependencies in link states, which enhances the algorithm’s adaptability to dynamic network changes and is crucial for achieving effective convergence. Table 4 presents a quantitative comparison of the mean and variance of reward values obtained during training under each ablated condition.
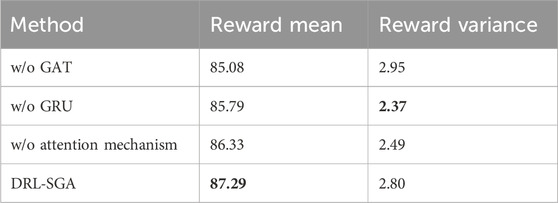
Table 4. Comparison of reward quantitative metrics.
The results indicate that, while the variance in rewards remains comparable across configurations, the full DRL-SGA algorithm achieved mean rewards that are 2.60%, 1.75%, and 1.11% higher than those of the models without GAT, GRU, and the attention mechanism, respectively. This demonstrates that each component in the link-state feature extraction module contributes positively to enhancing the perceptual ability of the agent, enabling the algorithm to adapt to dynamic structural changes in the network and thereby facilitating the output of an optimal routing policy.
5.5 Computational overhead and scalability analysis
To further assess the feasibility of the proposed DRL-SGA algorithm in practical applications, its computational overhead and scalability were analyzed. Evaluation metrics included model size, parameter count, per-epoch training time, inference latency, peak memory usage, throughput, and control overhead. The experimental environment was identical to that described earlier, and synthetic networks of different scales were constructed to simulate various deployment scenarios: small scale (16 nodes, 24 links), medium scale (47 nodes, 61 links), and large scale (100 nodes, 220 links). The results are presented in Table 5.
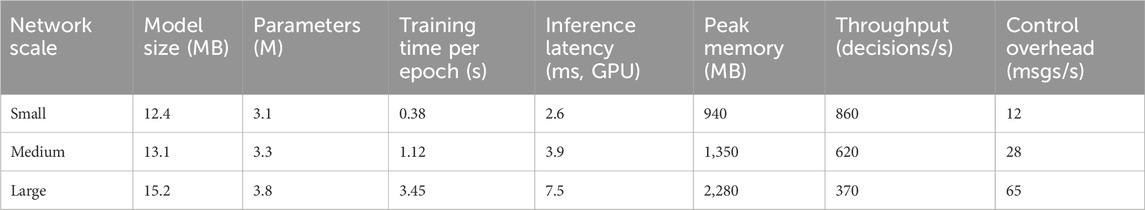
Table 5. Computational overhead and scalability of DRL-SGA.
Several conclusions can be drawn from Table 5. First, both model size and parameter count remain largely stable across different network scales, indicating that computational complexity is primarily determined by the architecture components (GRU, GAT, and MLP) rather than node count. Second, per-epoch training time grows approximately linearly with network size, consistent with the complexity of node-based feature extraction. Third, even in the large-scale scenario with 100 nodes and 220 links, inference latency remains below 10 ms, meeting the real-time requirements of tactical communication environments. Peak memory consumption increases with network size but remains within the capacity of a V100 GPU. Throughput decreases as the network expands, yet continues to support several hundred routing decisions per second, sufficient for operational needs. Meanwhile, control-plane overhead rises nearly linearly with network size but remains negligible compared with conventional network telemetry traffic. In summary, the DRL-SGA algorithm demonstrates moderate computational overhead and strong scalability. Its complexity scales nearly linearly with network size, making it suitable for deployment in large-scale tactical communication networks. Furthermore, additional strategies such as batch processing, localized attention, and model compression (e.g., pruning or quantization) may further reduce computational costs in resource-constrained environments. Overall, DRL-SGA achieves a favorable balance between routing performance and computational efficiency, supporting its feasibility for real-world large-scale deployment.
5.6 Parameter sensitivity analysis
As shown in Table 2, the performance of DRL-SGA is influenced by several parameters, among which ε, α, β, and γ are the most critical. To validate the rationality of their selection, two sets of experiments were conducted. In the first, β and γ were fixed while ε and α were varied. In the second, ε and α were fixed while β and γ were adjusted. The results are illustrated in Figure 13.
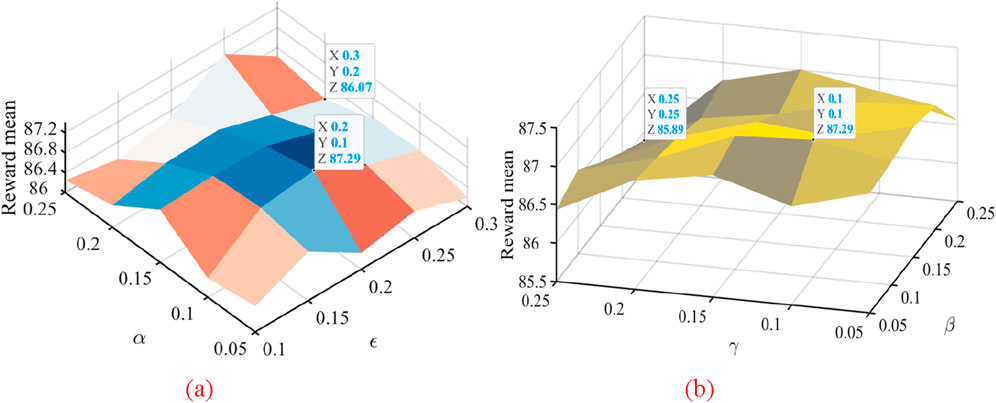
Figure 13. Parameter sensitivity analysis results. (a) Effect of ε and α on DRL-SGA performance. (b) Effect of β and γ on DRL-SGA performance.
In the first set, ε was varied within {0.10, 0.15, 0.20, 0.25, 0.30}, and α within {0.05, 0.10, 0.15, 0.20, 0.25}. The best performance was observed when ε = 0.20 and α = 0.10, achieving a maximum average reward of 87.29. This indicates that a balanced exploration rate and reward weighting effectively enhance routing decisions. Excessively high or low exploration rates reduced performance, suggesting that both over-exploration and premature convergence degrade effectiveness. In the second set, β and γ were varied within {0.05, 0.10, 0.15, 0.20, 0.25}. Optimal performance was obtained at β = 0.10 and γ = 0.10 (maximum reward 87.29), with only marginal performance differences across values. This demonstrates robustness in weighting for delay and packet-loss optimization. However, further increases in β or γ caused slight declines, indicating that overly emphasizing a single objective weakens overall multi-objective optimization. Overall, DRL-SGA exhibits a “middle-value optimal” pattern across ε, α, β, and γ, with stable and peak performance maintained under balanced parameter settings. The chosen configuration is therefore reasonable, providing an effective trade-off among exploration, delay optimization, and packet-loss control, ensuring both effectiveness and robustness across diverse network scenarios.
5.7 Network performance comparison under different topologies
To evaluate the adaptability of the DRL-SGA algorithm to dynamically changing network topologies, a new network structure was configured as shown in Figure 14. Several links within the backbone network were sequentially disconnected to simulate link failure scenarios. Experiments were conducted under both low-intensity traffic (50 kbps) and high-intensity traffic (100 kbps), and the network performance metrics of each routing algorithm were recorded and compared accordingly.
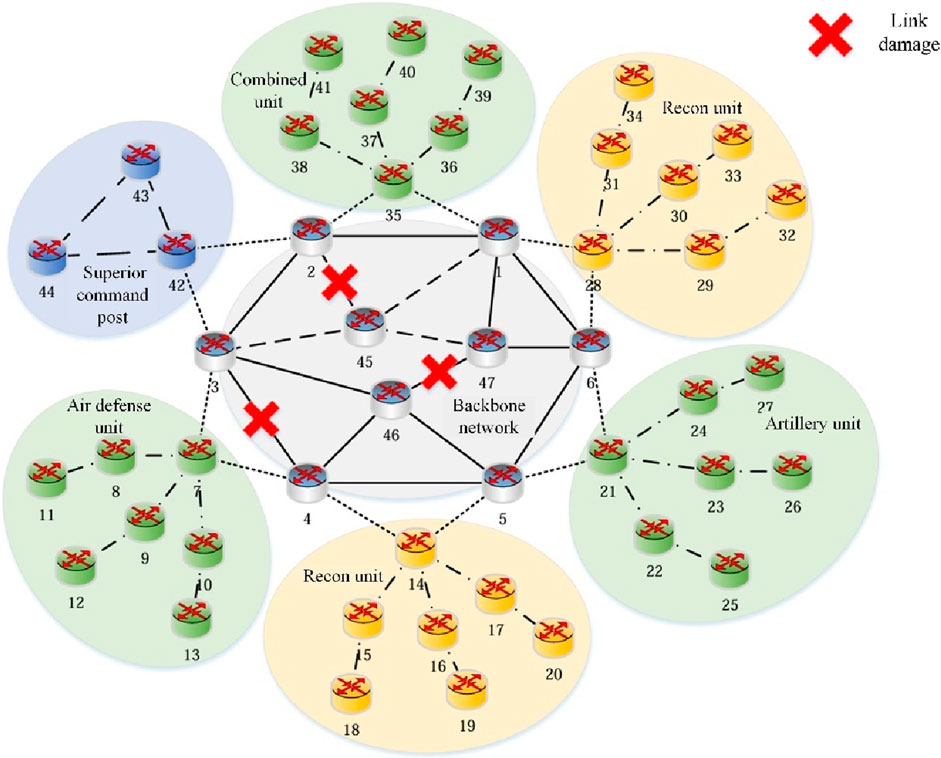
Figure 14. Network topology with partial link failures.
Figure 15 presents the throughput comparison results of each algorithm under varying levels of link failures and different traffic intensities. As the number of failed backbone links increases, the overall network throughput of all algorithms gradually declines. However, the DRL-SGA consistently maintains the highest throughput performance. When the number of failed backbone links reaches three, under the low traffic intensity scenario (50 kbps), the average throughput of DRL-SGA improves by 8.76% over the traditional routing algorithm OSPF, and by 5.34%, 4.25%, and 2.77% over the intelligent routing algorithms DQN, DDPG, and DRL-ST, respectively. Under the high traffic intensity scenario (100 kbps), DRL-SGA outperforms these four algorithms with throughput improvements of 35.29%, 25.47%, 20.18%, and 4.39%, respectively.
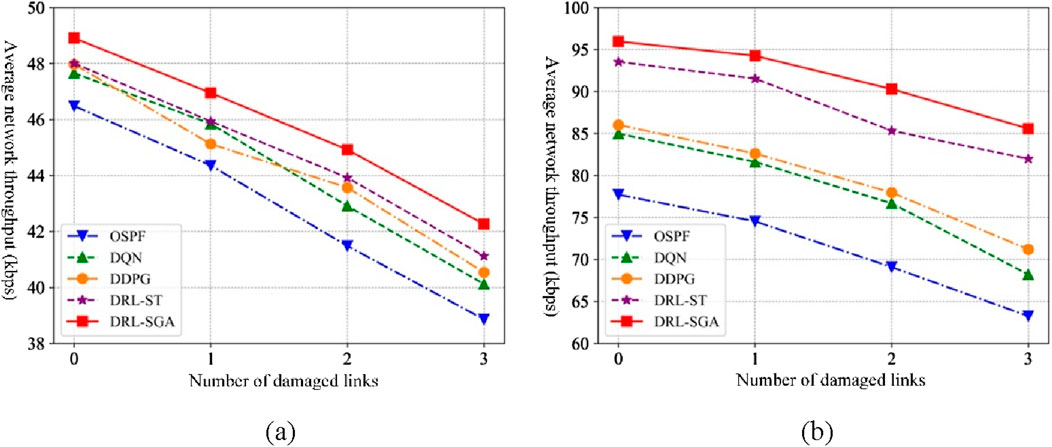
Figure 15. Throughput comparison under link failure scenarios. (a) Traffic intensity: 50 kbps. (b) Traffic intensity: 100 kbps.
Figure 16 shows the comparison of average end-to-end delay across algorithms under different levels of link failure and traffic intensities. As the number of failed links increases, all algorithms experience an increase in delay. Under 50 kbps traffic intensity, the average end-to-end delay of DRL-SGA is at least 12.99%, 8.06%, 6.41%, and 3.15% lower than that of OSPF, DQN, DDPG, and DRL-ST, respectively. Under 100 kbps traffic intensity, DRL-SGA achieves delay reductions of at least 24.25%, 16.95%, 14.43%, and 6.44% compared to the same respective algorithms.
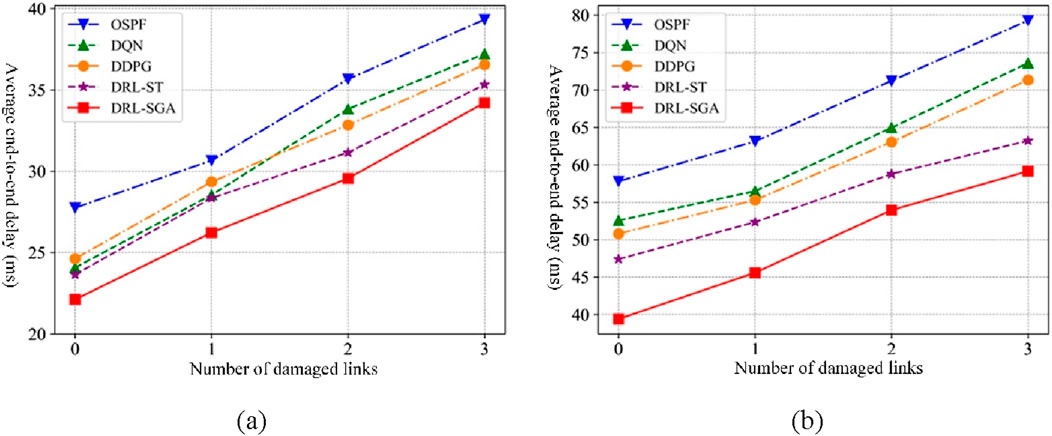
Figure 16. Average end-to-end delay comparison under link failure scenarios. (a) Traffic intensity: 50 kbps. (b) Traffic intensity: 100 kbps.
Figure 17 illustrates the comparison of average packet loss rates for all algorithms under increasing link failure conditions and varying traffic intensities. As the number of failed links grows, all algorithms exhibit rising packet loss rates. When the traffic intensity is 50 kbps, the average packet loss rate of DRL-SGA is reduced by at least 21.92%, 15.08%, 12.52%, and 1.65% relative to OSPF, DQN, DDPG, and DRL-ST, respectively. Under 100 kbps traffic intensity, DRL-SGA achieves minimum reductions of 35.19%, 26.44%, 21.16%, and 9.63% compared to the same algorithms.
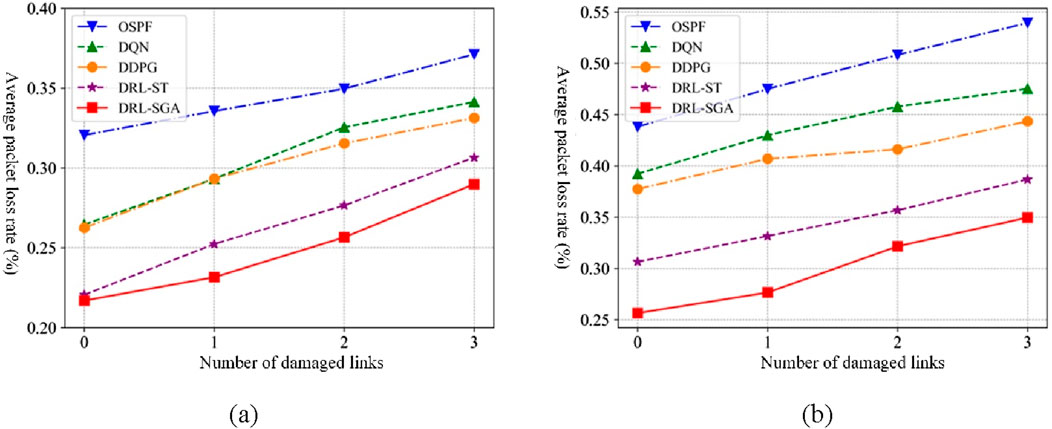
Figure 17. Average packet loss rate comparison under link failure scenarios. (a) Traffic intensity: 50 kbps. (b) Traffic intensity: 100 kbps.
In summary, compared with traditional routing algorithms and existing intelligent routing algorithms, DRL-SGA demonstrates superior adaptability to dynamic network changes and incurs smaller QoS performance degradation in scenarios involving link failures, regardless of whether the traffic intensity is low or high. This is primarily because the traditional OSPF algorithm is incapable of promptly adapting to changes in network topology and adjusting routing strategies in a timely manner, making it difficult to maintain optimal network performance. Although intelligent algorithms such as DQN, DDPG, and DRL-ST leverage deep reinforcement learning, they rely on conventional feedforward neural networks trained with link state information in fixed formats, making it difficult to adapt to complex network dynamics. Consequently, these algorithms exhibit lower training efficiency and suboptimal decision accuracy.
In contrast, the DRL-SGA algorithm effectively extracts the spatiotemporal characteristics of tactical communication network structures. Specifically, GRU captures the temporal evolution of historical link state information, enabling accurate prediction of future trends and enhancing the model’s perception and reasoning capabilities. GAT enhances the algorithm’s ability to represent non-Euclidean graph-structured data, thereby enabling a more comprehensive understanding and processing of complex network environments and significantly improving the model’s structural awareness. As a result, DRL-SGA exhibits stronger adaptability to dynamic network topologies and superior capability in ensuring service quality.
6 Conclusion
This study proposes a DRL-SGA for tactical communication networks, which enhances route selection through improved link state awareness. The algorithm constructs an intelligent path decision model using PPO and integrates a link state feature extraction module designed to capture the spatiotemporal dependencies within sequences composed of multiple link states. An optimal path forwarding strategy is then derived through a deep reinforcement learning training mechanism. Experimental results demonstrate that DRL-SGA exhibits superior adaptability to dynamic changes in network topology compared to traditional and existing intelligent routing algorithms.
It should be noted that all evaluations in this study are conducted in simulation. While the simulated scenarios are designed to resemble realistic tactical networks, the lack of real-world dataset or testbed validation remains a limitation. Future work will focus on validating the proposed approach in real operational environments to further assess its practical applicability and robustness. Moreover, tactical communication networks typically exhibit rapidly changing topologies and highly uncertain traffic patterns. Accurate and real-time traffic prediction is critical for ensuring timely delivery of high-priority services and effective traffic regulation, which in turn improves network resource utilization. In future work, we plan to integrate traffic prediction mechanisms with intelligent routing algorithms. By forecasting the future evolution of network traffic states, we aim to enhance the perception and decision-making capabilities of intelligent routing models, enabling more efficient and adaptive routing strategies in dynamic tactical communication scenarios.
Data availability statement
The datasets presented in this study can be found in online repositories. The names of the repository/repositories and accession number(s) can be found in the article/supplementary material.
Author contributions
YS: Writing – original draft, Conceptualization. LX: Writing – review and editing, Investigation. ML: Writing – review and editing, Conceptualization.
Funding
The author(s) declare that no financial support was received for the research and/or publication of this article.
Conflict of interest
Authors YS, LX, and ML were employed by China Telecom Corporation Limited Zhejiang Branch.
Generative AI statement
The author(s) declare that no Generative AI was used in the creation of this manuscript.
Any alternative text (alt text) provided alongside figures in this article has been generated by Frontiers with the support of artificial intelligence and reasonable efforts have been made to ensure accuracy, including review by the authors wherever possible. If you identify any issues, please contact us.
Publisher’s note
All claims expressed in this article are solely those of the authors and do not necessarily represent those of their affiliated organizations, or those of the publisher, the editors and the reviewers. Any product that may be evaluated in this article, or claim that may be made by its manufacturer, is not guaranteed or endorsed by the publisher.
References
Alnajjar, A. B., Kadim, A. M., Jaber, R. A., Hasan, N. A., Ahmad, E. Q., Altaei, M. S., et al. (2022). Wireless sensor network optimization using genetic algorithm. J. Robotics Control (JRC) 3 (6), 827–835. doi:10.18196/jrc.v3i6.16526
Bajracharya, R., Shrestha, R., Hassan, S. A., Jung, H., and Shin, H. (2023). 5G and beyond private military communication: trend, requirements, challenges and enablers. IEEE Access 11, 83996–84012. doi:10.1109/access.2023.3303211
Bale, A. S., Hamsalekha, R., Dash, R., Baral, R., Bajaj, B., Arora, S., et al. (2023). “Recent scientific achievements and developments in software defined networking: a survey,” in 2023 1st International Conference on Circuits, Power and Intelligent Systems (CCPIS) (IEEE), 1–6.
Casas-Velasco, D. M., Rendon, O. M. C., and da Fonseca, N. L. S. (2021). DRSIR: a deep reinforcement learning approach for routing in software-defined networking. IEEE Trans. Netw. Serv. Manag. 19 (4), 4807–4820. doi:10.1109/tnsm.2021.3132491
Chang, Y. C., Lin, H. T., Chu, H. M., and Wang, P. C. (2020). Efficient topology discovery for software-defined networks. IEEE Trans. Netw. Serv. Manag. 18 (2), 1375–1388. doi:10.1109/tnsm.2020.3047623
Dake, D. K., Gadze, J. D., Klogo, G. S., and Nunoo-Mensah, H. (2021). Traffic engineering in software-defined networks using reinforcement learning: a review. Int. J. Adv. Comput. Sci. Appl. 12 (5), 330–345. doi:10.14569/ijacsa.2021.0120541
Deng, X., Zeng, S., Chang, L., Wang, Y., Wu, X., Liang, J., et al. (2022). An ant colony optimization-based routing algorithm for load balancing in leo satellite networks. Wirel. Commun. Mob. Comput. 2022, 3032997. doi:10.1155/2022/3032997
Shokouhifar, M. (2021). FH-ACO: fuzzy heuristic-based ant colony optimization for joint virtual network function placement and routing. Appl. Soft Comput. 107, 107401. doi:10.1016/j.asoc.2021.107401
Fu, Q., Sun, E., Meng, K., Li, M., and Zhang, Y. (2020). Deep Q-learning for routing schemes in SDN-based data center networks. IEEE Access 8, 103491–103499. doi:10.1109/access.2020.2995511
He, Q., Wang, Y., Wang, X., Xu, W., Li, F., Yang, K., et al. (2023). Routing optimization with deep reinforcement learning in knowledge defined networking. IEEE Trans. Mob. Comput. 23 (2), 1444–1455. doi:10.1109/tmc.2023.3235446
Huang, R., Guan, W., Zhai, G., He, J., and Chu, X. (2022). Deep graph reinforcement learning based intelligent traffic routing control for software-defined wireless sensor networks. Appl. Sci. 12 (4), 1951. doi:10.3390/app12041951
Hussain, M. W., and Sinha Roy, D. (2021). “Intelligent node placement for improving traffic engineering in hybrid SDN,” in Advances in Communication, Devices and Networking: Proceedings of ICCDN 2020 (Singapore: Springer Singapore), 287–296.
Hussain, O. F., Al-Kaseem, B. R., and Akif, O. Z. (2021). Smart flow steering agent for end-to-end delay improvement in software-defined networks. Baghdad Sci. J. 18 (1), 0163. doi:10.21123/bsj.2021.18.1.0163
Ju, Y., Song, J., Li, W., Zhang, Y., He, C., Dong, F., et al. (2025). Dynamic load-balancing routing strategy for LEO satellite networks based on spatio-temporal traffic prediction. IEEE Trans. Aerosp. Electron. Syst., 1–16. doi:10.1109/taes.2025.3571400
Li, H., and He, H. (2023). Multiagent trust region policy optimization. IEEE Trans. Neural Netw. Learn. Syst. 35 (9), 12873–12887. doi:10.1109/tnnls.2023.3265358
Li, Q., and Wu, J. (2025). Efficient network attack path optimization method based on prior knowledge-based PPO algorithm. Cybersecurity 8 (1), 15–14. doi:10.1186/s42400-024-00288-8
Li, J., Jiang, K., Zhang, K., Shen, C., Du, J., Wang, J., et al. (2021). “DRNet: QoS-aware routing for SDN using deep reinforcement learning,” in 2021 IEEE 21st International Conference on Communication Technology (ICCT) (IEEE), 25–30.
Liu, W., Cai, J., Chen, Q. C., and Wang, Y. (2021). DRL-R: deep reinforcement learning approach for intelligent routing in software-defined data-center networks. J. Netw. Comput. Appl. 177, 102865. doi:10.1016/j.jnca.2020.102865
Liu, L., Wang, X., Yang, X., Liu, H., Li, J., and Wang, P. (2023). Path planning techniques for mobile robots: review and prospect. Expert Syst. Appl. 227, 120254. doi:10.1016/j.eswa.2023.120254
Liu, J., Wang, X., Wang, J., Xiao, J., Albrethsen, J., Goh, L., et al. (2024). “Spatial-temporal graph representation learning for tactical networks future state prediction,” in 2024 International Joint Conference on Neural Networks (IJCNN) (IEEE), 1–8.
Lu, X., Zhao, C., and Liao, L. X. (2023). “C-LLDP-monitoring: latency monitoring across large-scale software defined networks,” in 2023 5th International Conference on Frontiers Technology of Information and Computer (ICFTIC) (IEEE), 792–799.
Patel, Z., Khanpara, P., Valiveti, S., and Raval, G. (2023). “The evolution of Ad hoc networks for tactical military communications: trends, technologies, and case studies,” in Proceedings of Third International Conference on Sustainable Expert Systems: ICSES 2022, Singapore (Springer Nature Singapore), 331–346.
Pourranjbar, A., Elleuch, I., Landry-pellerin, S., and Kaddoum, G. (2023). Defense and offence strategies for tactical wireless networks using recurrent neural networks. IEEE Trans. Veh. Technol. 72 (6), 8278–8283. doi:10.1109/tvt.2023.3243127
Ryu SDN Framework Community (2020). Component-based software defined networking frame work. Available online at: http://osrg.github.io/ryu.
Suomalainen, J., Julku, J., Vehkaperä, M., and Posti, H. (2021). Securing public safety communications on commercial and tactical 5G networks: a survey and future research directions. IEEE Open J. Commun. Soc. 2, 1590–1615. doi:10.1109/ojcoms.2021.3093529
Tabatabaei, S. (2022). Provide energy-aware routing protocol in wireless sensor networks using bacterial foraging optimization algorithm and Mobile sink. Plos one 17 (3), e0265113. doi:10.1371/journal.pone.0265113
Wang, Y., Shang, F., and Lei, J. (2023). Energy-efficient and delay-guaranteed routing algorithm for software-defined wireless sensor networks: a cooperative deep reinforcement learning approach. J. Netw. Comput. Appl. 217, 103674. doi:10.1016/j.jnca.2023.103674
Yang, X., Yan, J., Wang, D., Xu, Y., and Hua, G. (2024). WOAD3QN-RP: an intelligent routing protocol in wireless sensor networks—A swarm intelligence and deep reinforcement learning based approach. Expert Syst. Appl. 246, 123089. doi:10.1016/j.eswa.2023.123089
Zhou, W., Jiang, X., Guo, B., and Meng, L. (2022). PQROM: to optimize software defined network QoS aware routing with proximal policy optimization. J. Intelligent and Fuzzy Syst. 42 (4), 3605–3614. doi:10.3233/jifs-211787
Zhou, X., Yan, J., Yan, M., Mao, K., Yang, R., and Liu, W. (2023). Path planning of rail-mounted logistics robots based on the improved dijkstra algorithm. Appl. Sci. 13 (17), 9955. doi:10.3390/app13179955
Keywords: link state information, spatiotemporal characteristics, intelligent path decision-making, deep reinforcement learning, graph attention network (GAT)
Citation: Shen Y, Xie L and Li M (2025) Intelligent path selection algorithm for tactical communication networks enhanced by link state awareness. Front. Commun. Netw. 6:1635982. doi: 10.3389/frcmn.2025.1635982
Received: 04 June 2025; Accepted: 15 September 2025;
Published: 17 October 2025.
Edited by:
Mark Eisen, Johns Hopkins University, United StatesReviewed by:
Domingos F. Oliveira, Mandume Ya Ndemufayo University, AngolaSourajit Das, University of Pennsylvania, United States
Nur Alamsyah, Universitas Informatika dan Bisnis Indonesia, Indonesia
Copyright © 2025 Shen, Xie and Li. This is an open-access article distributed under the terms of the Creative Commons Attribution License (CC BY). The use, distribution or reproduction in other forums is permitted, provided the original author(s) and the copyright owner(s) are credited and that the original publication in this journal is cited, in accordance with accepted academic practice. No use, distribution or reproduction is permitted which does not comply with these terms.
*Correspondence: Ming Li, bGltLnpqQGNoaW5hdGVsZWNvbS5jbg==