 Farhan Nisar1*
 Hassan Jalil Hadi
 Naveed Ahmad
 Mohamad Ladan
- 1Department of Physical & Numerical Sciences, Qurtuba University of Science & Information Technology, Peshawar, Pakistan
- 2National University of Modern Languages Peshawar Campus, Islamabad, Pakistan
- 3Center of Excellence in Cyber Security (CYBEX), Prince Sultan University, Riyadh, Saudi Arabia
- 4Software Engineering Department, Prince Sultan University, Riyadh, Saudi Arabia
- 5College of Computer and Information Sciences, Prince Sultan University, Riyadh, Saudi Arabia
The pervasive growth of the Internet of Things (IoT) necessitates efficient communication technologies, among which Long Range Wide Area Network (LoRaWAN) is prominent due to its long-range, low-power characteristics. A significant challenge in dense LoRaWAN deployments is the efficient management of resources, particularly Spreading Factor (SF) allocation. In this paper, we propose a machine learning-based approach for optimal SF allocation to enhance network performance. We developed a simulation-driven framework utilizing the ns-3 simulator to generate a comprehensive dataset mapping network conditions, including RSSI, SNR, device coordinates, and distance to the gateway, to optimal SF assignments determined through an energy-aware optimization process. An XGBoost model was trained on this dataset to predict the optimal SF based on real-time network parameters. Our methodology focuses on balancing packet delivery ratio and energy consumption. The performance evaluation demonstrates that the trained XGBoost model effectively classifies optimal SFs, exhibiting strong diagonal dominance in the confusion matrix and achieving competitive accuracy with efficient computational characteristics, making it suitable for resource-constrained LoRaWAN environments.
1 Introduction
The rapid expansion of the Internet of Things (IoT) paradigm has underscored the critical need for communication technologies that can support a vast array of devices over extensive geographical areas while ensuring minimal power consumption Butt et al. (2025). Among the contenders in the Low-Power Wide-Area Network (LPWAN) landscape, LoRaWAN (Long Range Wide Area Network) has emerged as a de facto standard, offering a compelling balance of range, battery life, and deployment cost for a multitude of applications Mekki et al. (2019); Gomez et al. (2019). Operating primarily in the sub-GHz ISM (Industrial, Scientific, and Medical) bands, such as 868 MHz in Europe and 915 MHz in North America, LoRaWAN facilitates data transmission at rates varying from 0.3 Kbps up to 50 Kbps, catering to diverse IoT use cases ranging from smart city deployments and environmental monitoring to industrial automation and precision agriculture Farhad et al. (2020a), Singh et al. (2020), Rehman et al. (2025); Ullah et al. (2025).
The architectural framework of a LoRaWAN network, illustrated in Figure 1, is inherently designed for scalability and efficiency. It consists of several key entities. At the periphery are the End Devices (EDs), which are typically sensor-equipped, battery-operated units responsible for data acquisition and transmission using the LoRa physical layer modulation. These devices communicate wirelessly with Gateways (GWs), which act as transparent bridges, relaying messages between EDs and a central Network Server (NS). A single GW can service thousands of EDs spread across several kilometers. The NS is the intelligent core of the network, responsible for de-duplicating messages, performing security checks, managing the network MAC layer, and routing application data to respective Application Servers (ASs).
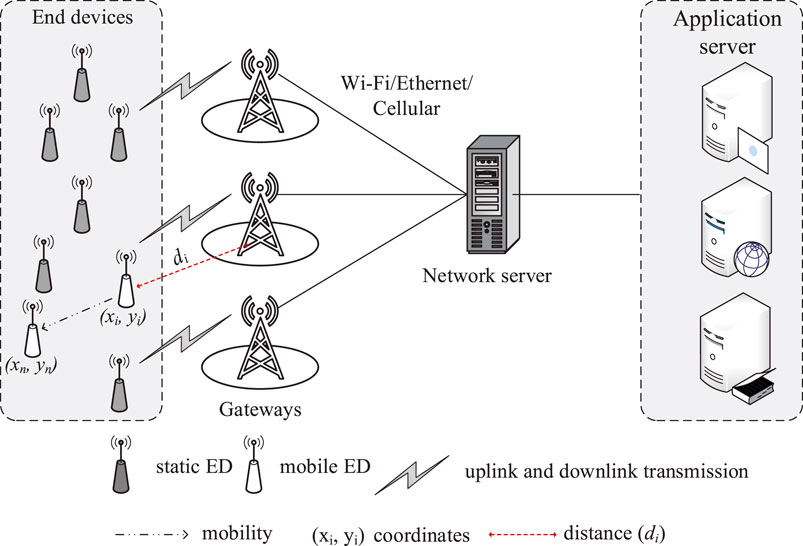
Figure 1. LoRaWAN architecture comprising end devices, gateways, and network servers.
To accommodate varying application requirements for latency and power consumption, LoRaWAN defines three distinct classes of ED operation Farhad et al. (2020a). Class
A cornerstone of LoRaWAN’s operational efficiency is the Adaptive Data Rate (ADR) mechanism. The ADR is designed to dynamically optimize the radio parameters of EDs, specifically the Spreading Factor (SF) and Transmission Power (TP), to maximize both network capacity and the battery life of individual devices Marini et al. (2021); Semtech (2019b); ETSI (2018). In its conventional form, the NS instructs EDs to adjust their settings based on historical link quality indicators, typically the Signal-to-Noise Ratio (SNR) of recent uplinks Anwar et al. (2021); Moysiadis et al. (2021). While beneficial, the standard ADR algorithm often exhibits suboptimal performance in dynamic or complex radio environments (Farhad et al., 2020b; 2020c; 2020d). It can be slow to converge, may lead to unnecessary retransmissions if parameters are chosen too aggressively, or conversely, may operate too conservatively, wasting energy and spectrum Park et al. (2020); Benkahla et al. (2019); Semtech (2019a); Farhad et al. (2021a). For instance, the reliance on the SNR of the last 20 packets might not always capture the nuances of fluctuating channel conditions, potentially leading to SF and TP assignments that result in packet loss Farhad and Pyun (2023a). This inherent challenge motivates the exploration of more intelligent and adaptive mechanisms. Consequently, this paper introduces XGBoost-driven adaptive adaptive data rate (XG-ADR) approach, engineered to intelligently allocate optimal SFs to EDs by leveraging insights derived from trained models reflecting real-world network dynamics.
1.1 Contribution of the paper
The contribution of this paper is as follows.
1. We design XG-ADR that can learn optimal SF strategies based on underlying network conditions and requirements to solve the SF allocation issue.
2. The ML model is trained on a one-time dataset generated in the ns-3 simulator, considering the propagation environment, device positions, distance between GW and ED, and successful SF. After the training, the pre-trained model has been utilized at the NS for optimal SF allocation to EDs during network simulations.
3. During the simulation-based deployment scenario using ns-3, the proposed XG-ADR could allocate the best SF to EDs, thereby enhancing the packet delivery ratio, energy consumption, and convergence period.
1.2 Structure of paper
Section 2 presents an in-depth review of the existing AI-based solutions regarding resource management in LoRaWAN. Section 3 elaborates on the dataset collection, discusses the required features, and highlights the best suitable ML methods for resource allocation concerning the features. Section 4 presents the proposed XG-ADR working. Section 5 presents a detailed discussion of experiments and results analysis, whereas Section 7 provides concluding remarks.
2 Literature review
The pursuit of enhanced efficiency and reliability in LoRaWAN networks has increasingly led researchers to explore the application of Artificial Intelligence (AI), particularly Machine Learning (ML) and Deep Learning (DL) techniques, for sophisticated resource management. These intelligent approaches offer promising alternatives to traditional algorithmic solutions, especially in optimizing critical parameters such as SF assignment, Transmission Power (TP) control, and overall network performance. This review synthesizes recent advancements where AI methodologies have been pivotal in addressing LoRaWAN’s operational challenges.
One significant area of focus has been the dynamic allocation of radio resources. Reinforcement Learning (RL) has shown considerable aptitude in this domain. For instance, the work by Azizi et al. (2022) introduced a mixed multi-armed bandit strategy for SF allocation, demonstrating tangible gains in Packet Delivery Ratio (PDR) and energy conservation within simulated single-gateway LoRaWAN deployments. Their model, tested with 100 end devices under EU-868 MHz regulations, highlighted the potential of RL for optimizing static networks. Expanding on RL’s capabilities, Chen et al. (2023) proposed a score table-based RL algorithm. This method not only adapted to network conditions but also achieved a notable 24%–27% reduction in energy consumption compared to conventional ADR schemes, with its lightweight nature confirmed through Matlab simulations, suggesting good prospects for real-world implementation.
Supervised learning techniques have also been effectively employed, especially for classification tasks that can inform resource allocation strategies. A notable example is the Support Vector Machine (SVM) classifier developed by Vangelista et al. (2023), which successfully differentiated between mobile and static end devices using a minimal set of training data. While this study focused on device mobility classification, it laid the groundwork for future integration with ADR mechanisms that could adapt to device mobility profiles. In the realm of more complex pattern recognition, deep learning models have demonstrated superior performance. Farhad et al. (2022b) utilized a Gated Recurrent Unit (GRU) network for device classification, achieving an impressive 96% accuracy. Their ns-3 simulations, involving 500 nodes, further validated the model’s efficacy, yielding a 98% PDR in networks of moderate density, showcasing DL’s strength in handling larger-scale scenarios.
Hybrid models, which synergize the strengths of different AI techniques, are also gaining traction due to their potential to address multifaceted optimization problems. Research by Minhaj et al. (2023) exemplified this by integrating RL for SF assignment with another ML model for TP control. Their findings indicated that such a combined approach could outperform solutions relying on a single AI methodology, offering a more holistic optimization of network resources. Furthermore, the concept of data fusion is being explored to enrich the information available for ML models. Bertocco et al. (2023) developed an augmented sensing method that combined LoRaWAN signal metrics (like RSSI and SNR) with data from external environmental sensors. This fusion approach led to a 17% reduction in estimation errors for certain parameters compared to methods relying solely on LoRaWAN’s intrinsic data, underscoring the benefit of incorporating diverse data sources for improved decision-making.
The integration of AI into LoRaWAN networks addressed the challenge of resource allocation under dynamic conditions, particularly for mobile IoT applications. Traditional Adaptive Data Rate (ADR) mechanisms, including Blind ADR (BADR), struggled with energy efficiency and adaptability in mobile scenarios. To overcome these limitations, recent studies proposed hybrid AI-driven solutions combining TinyML and deep learning. One approach introduced a hybrid CNN-LSTM model Lodhi et al. (2025a) on the network server for predicting optimal SF and transmission power (TP), while deploying lightweight TinyML models on edge devices for autonomous parameter adjustment in disconnected scenarios. This method improved the packet success ratio (PSR) and energy efficiency but faced computational constraints when deploying complex models on resource-limited devices. Another study proposed Contextual Aware Enhanced ADR (CA-ADR) Lodhi et al. (2025b), which used a rule-augmented hybrid CNN-LSTM model trained on contextual data to optimize SF allocation. While CA-ADR demonstrated gains in energy efficiency and PSR, its reliance on pre-trained models limited adaptability to unseen network conditions. Both solutions advanced LoRaWAN resource allocation but highlighted trade-offs between computational overhead and real-time adaptability.
The authors in Khan et al. (2024) investigated the integration of LoRa with distributed machine learning (ML) to enhance network connectivity in intelligent transportation systems (ITS). The authors proposed a framework that optimized resource allocation and energy efficiency, leveraging LoRa’s long-range capabilities and ML’s adaptability. Their approach demonstrated improvements in network reliability and sustainability, addressing key challenges in green ITS. The study highlighted the potential of hybrid LoRa-ML systems for scalable and energy-efficient IoT deployments in transportation.
The authors proposed a non-destructive adaptive data rate (ND-ADR) scheme for LoRaWAN IoT networks in Lodhi et al. (2022). Unlike conventional ADR methods, ND-ADR dynamically adjusted data rates without disrupting ongoing transmissions, improving packet delivery ratios and spectral efficiency. The authors validated their approach through simulations, showing superior performance in dense IoT environments compared to static ADR.
The authors introduced a hybrid adaptive data rate (HADR) mechanism for LoRaWAN, catering to both static and mobile IoT devices in Farhad and Pyun (2022). By dynamically selecting between ADR and blind ADR (BADR) based on device mobility, HADR achieved a 20% higher packet success ratio than BADR. The study addressed a critical limitation of traditional LoRaWAN resource allocation, offering a unified solution for heterogeneous IoT applications.
Table 1 provides a consolidated overview of the surveyed AI-driven approaches, detailing their specific methodologies, evaluation environments, and key performance improvements. The collective evidence from these studies strongly suggests that AI and ML techniques offer substantial advantages over traditional LoRaWAN optimization methods. Deep learning models, in particular, excel in complex classification and prediction tasks, while reinforcement learning offers robust solutions for dynamic and adaptive resource allocation. However, the challenge of developing lightweight, yet highly accurate, ML models that can operate efficiently at the network server or even closer to the edge remains an active area of research, paving the way for solutions like the one proposed in this paper.
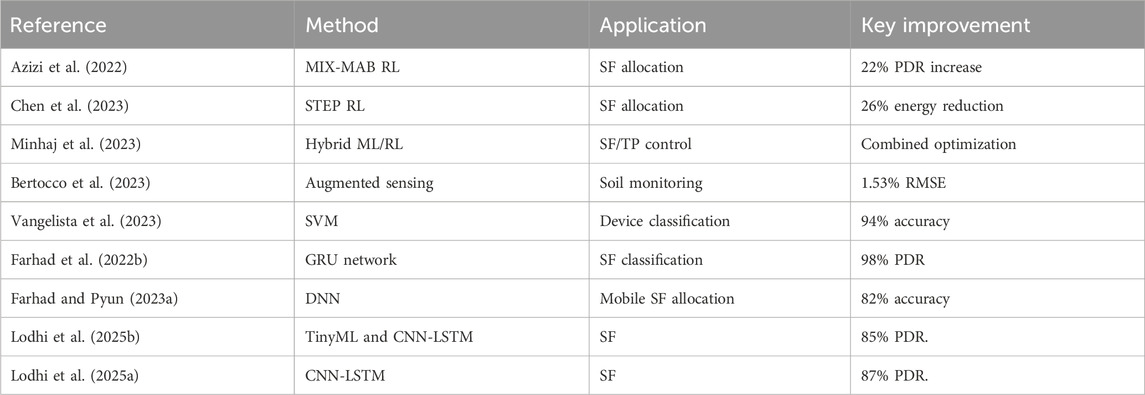
Table 1. Summary of machine learning approaches in LoRaWAN optimization.
3 Data acquisition and preprocessing framework
This work develops a simulation-driven methodology for generating labeled LoRaWAN datasets that map network conditions (RSSI, SNR, X and Y coordinates, and distance between ED and GW) to optimal SF assignments. The framework systematically transforms raw physical-layer measurements into machine-learning-ready tuples
3.1 Simulator selection and validation
The foundation of our study relies on selecting an appropriate simulation platform that accurately models LoRaWAN network behavior. Existing literature reveals limited options for open-source LoRaWAN simulators Sartori (2023), Zorbas et al. (2021), Farhad and Pyun (2023b). We evaluated available solutions using a weighted scoring metric, using Equation 1.
where
We selected ns-3 as the simulation platform because it provides an open-source, validated LoRaWAN module Magrin et al. (2017b) that supports detailed modeling of path loss, fading, and collision dynamics. Compared with other simulators such as LoRaSim Da Silva et al. (2021), ns-3 offers more comprehensive PHY/MAC-layer implementations and closer alignment with LoRaWAN specifications, making it a reproducible foundation for dataset generation.
3.2 Network topology modeling
The simulation environment in Farhad and Pyun (2023a) models a typical LoRaWAN deployment scenario with
where in Equation 2,
3.3 Channel propagation characteristics
Accurate modeling of wireless channel effects is crucial for generating realistic simulation data. The approach Farhad and Pyun (2023a) incorporates both large-scale path loss and small-scale fading components. The log-distance path loss model with environmental correction factors of the signal attenuation between transmitter and receiver is captured using Equation 3.
The first term represents free-space path loss, where
Furthermore, real-world deployments experience signal variations due to terrain and obstacles. We model this as a spatially correlated Gaussian random field in Equation 4.
where
3.4 Signal quality metrics
The received signal strength at the GW combines multiple physical layer effects, as shown in Equation 5.
where
where
where
The model (i.e., Equation 7) captures the capture effect in LoRaWAN, where a packet survives interference if its power exceeds the sum of interfering signals by the capture threshold
The signal-to-noise ratio (SNR) calculation incorporates both thermal noise and interference effects, as illustrated in Equation 8:
where
3.5 Transmission protocol simulation
Figure 2 Farhad and Pyun (2023a) illustrates the dataset collection and labeling procedure employed to determine the optimal SF allocation in LoRaWAN networks. The process involves a single ED transmitting uplink messages sequentially using all available SFs (SF7–SF12) to the GW, which forwards the packets to the NS. The NS records the packet reception status (success or failure) for each SF and aggregates this data to label the optimal SF for each device location based on energy efficiency and reliability metrics. For instance, if transmissions using SF7–SF9 fail while SF10–SF12 succeed, the lowest successful SF (SF10) is selected as the optimal choice to minimize energy consumption while ensuring reliable communication. This empirical approach, which accounts for real-world conditions such as distance, mobility, and interference, generates the labeled dataset used to train the XG-ADR. The resulting model dynamically predicts optimal SFs during deployment, addressing the limitations of traditional ADR mechanisms by leveraging machine learning for adaptive resource allocation in dynamic LoRaWAN environments.
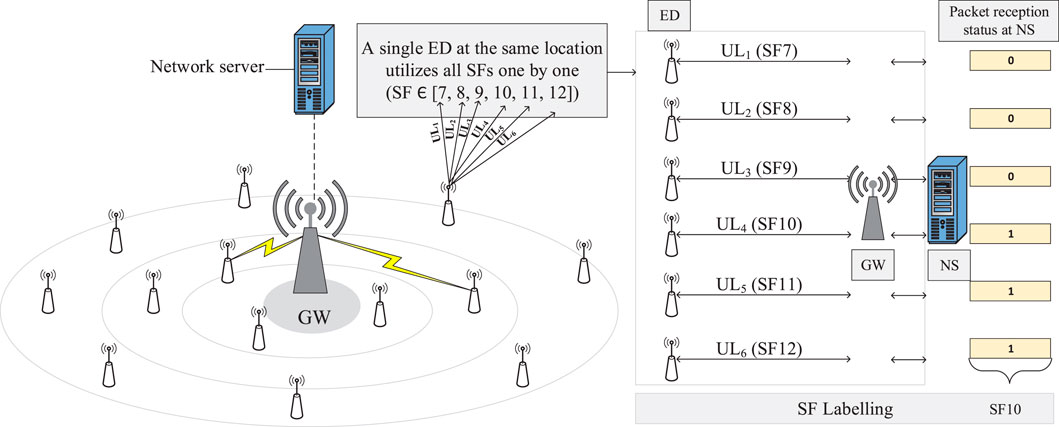
Figure 2. Dataset collection and labeling procedure Farhad and Pyun (2023a).
Each ED performs
where
where
3.6 Optimal SF selection algorithm
The core of our labeling process involves determining the most efficient SF for each device location, computed in Equation 11:
where
with
The Algorithm 1 implements an energy-aware optimization process to determine the optimal SF for each end-device. It begins by analyzing historical transmission data to compute the packet success probability
The adopted energy model accounts for transmit power, airtime, and retransmissions, consistent with prior ns-3 based studies Farhad and Pyun (2023a); Magrin et al. (2017b). While real deployments may involve additional factors such as battery aging, and MAC-layer overhead, these were intentionally omitted to maintain tractability and comparability with established LoRaWAN models. Future work should integrate hardware-specific measurements to capture these effects more precisely.
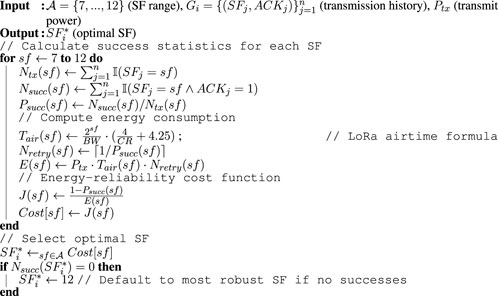
Algorithm 1. XGBoost-based adaptive data rate (XG-ADR).
4 Proposed methodology
We utilize XGBoost due to its strong performance with structured numerical data Chen and Guestrin (2016); Javadi et al. (2025). Compared to DL methods, XGBoost delivers robust accuracy even with limited training samples while inherently mitigating overfitting through regularization techniques. Its gradient-boosting framework iteratively refines predictions, balancing high precision with computational efficiency—a key advantage for resource-constrained LoRaWAN applications.
The XGBoost model operates on a structured input space
During training, the algorithm minimizes a regularized objective function
Feature importance is quantified through gain statistics
5 Performance evaluation-offline mode
The XGBoost-based Adaptive Data Rate (XG-ADR) framework implements a gradient boosted decision tree ensemble for optimal SF selection in LoRaWAN networks. This section details the computational environment and hyperparameter configuration that underpin the performance evaluation presented in subsequent sections. The implementation leverages XGBoost’s efficient histogram-based tree construction with regularization techniques to prevent overfitting while maintaining real-time inference capabilities.
5.1 Training parameters
The model was trained under the technical specifications shown in Table 2. The hardware configuration provided sustained throughput of 1.2 million instances per second during training, with peak memory utilization of 8.4 GB. The M2 unified memory architecture eliminated GPU-CPU data transfer bottlenecks, though the implementation defaulted to CPU computation due to XGBoost’s current lack of Metal backend support. Training convergence was monitored through a 10% held-out validation set, with model checkpoints saved at minimum validation loss intervals.
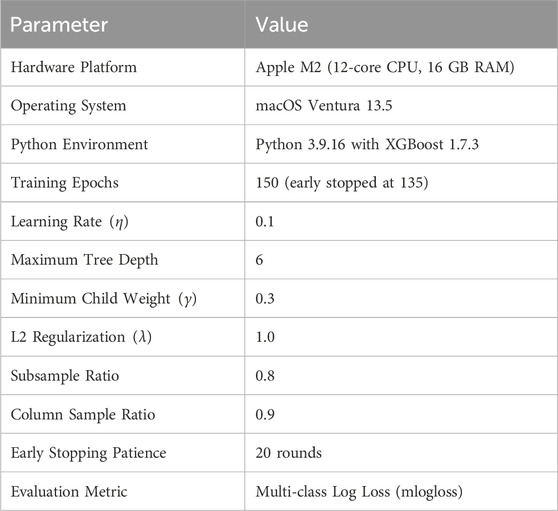
Table 2. Training configuration specifications.
5.2 Training history analysis
The training history visualization in Figure 3 presents two critical metrics across the 150 training rounds. The Figures 3a presents the multi-class log loss evolution, where both training and validation curves exhibit exponential decay in the initial phase (rounds 0–20), followed by asymptotic convergence. The final training loss
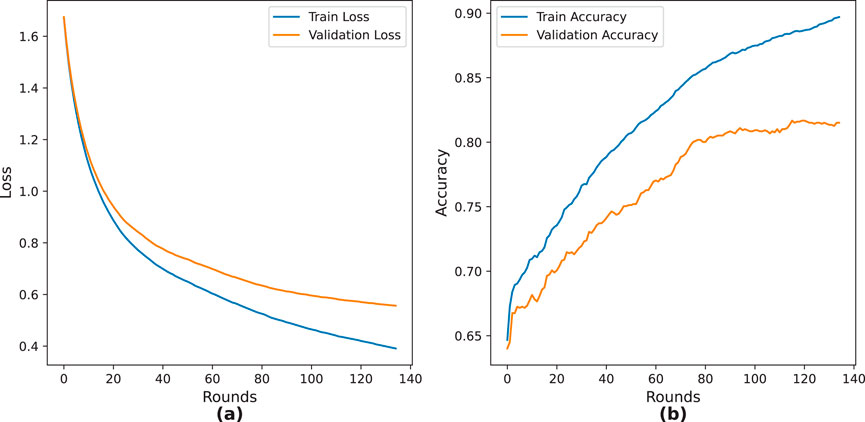
Figure 3. Training dynamics: (a) loss, and (b) classification accuracy.
5.3 Confusion matrix interpretation
The normalized confusion matrix in Figure 4 exhibits strong diagonal dominance with particularly robust performance for SF7
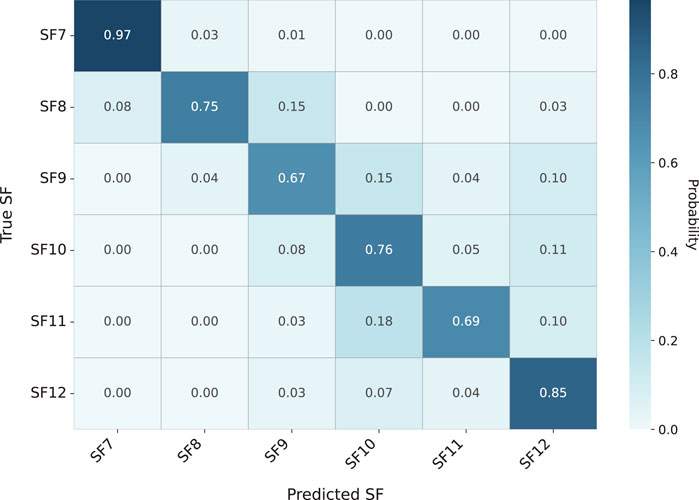
Figure 4. Normalized confusion matrix showing classification probabilities between true (rows) and predicted (columns) SFs.
This manifests most prominently in the SF8
Although SF11 and SF12 exhibit higher misclassification rates, these errors are predominantly adjacent (e.g., SF12
5.4 Optimization dynamics
The validation loss trajectory, as depicted in Figure 5, exhibits characteristic convex optimization behavior that can be decomposed into three distinct operational phases. The initial convergence phase (Rounds 0–40) demonstrates steep gradient descent with a loss reduction rate of
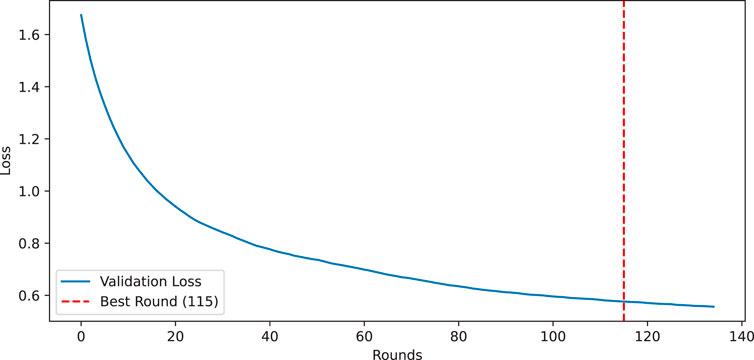
Figure 5. Validation loss progression showing early stopping at round 135 (dashed vertical line) with optimal model at round 115 (star marker). Shaded region indicates the early stopping patience window.
5.5 ML models performance
Table 3 presents a comprehensive evaluation of ML models for LoRaWAN SF classification. The results demonstrate significant variation in model effectiveness, with tree-based methods consistently outperforming linear approaches. Notably, XGBoost achieves competitive accuracy (80.45%) while maintaining efficient training times (0.7 s) and moderate memory requirements (1.46 MB). The superior performance of ensemble methods over traditional classifiers (e.g., 61% higher accuracy than Logistic Regression) confirms their suitability for processing complex signal patterns in IoT networks. Our selection of XGBoost is motivated by four key factors: (1) the training time of 0.7 s represents a 42
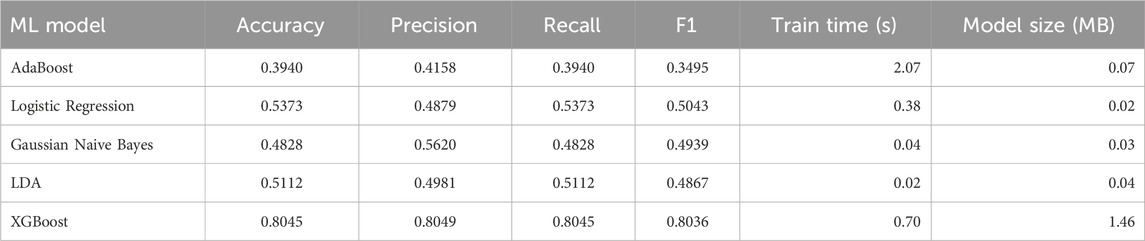
Table 3. Comparison of ML model performance.
The combination of these characteristics makes XGBoost particularly suitable for real-world LoRaWAN implementations where computational resources are constrained yet accurate SF classification remains critical.
XGBoost was chosen for ns-3 simulation after preliminary benchmarking against other ML models (3), where it offered the best trade-off between accuracy (80.45%)) and training efficiency (0.7 s). These characteristics make it particularly suitable for LoRaWAN end devices, where computational resources are constrained.
6 Performance evaluation-online mode using NS-3
This study presents a comprehensive performance evaluation of end devices configured in confirmed data mode within a single-gateway LoRaWAN network architecture.
To ensure a fair comparison, we evaluated XG-ADR against conventional ADR, BADR, AI-ERA Farhad and Pyun (2023a), and the most recent TF baseline Lodhi et al. (2025a). While several other approaches exist, reproducing all of them under a unified ns-3 environment is not feasible due to differences in datasets, assumptions, and simulation setups. We therefore selected these baselines as they represent both classical and state-of-the-art ML-driven schemes.
6.1 Simulation setting and application
The network deployment under consideration features a circular coverage area with a radius of five km, representing a typical urban or semi-urban IoT deployment scenario. To accurately model industrial asset monitoring applications, the simulation implements a sophisticated two-dimensional random mobility algorithm. In this model, each mobile device undergoes directional changes after completing linear movement segments of precisely 200 m, with velocity parameters constrained within the range of 1.0–2.0 m per second. This mobility approach aligns with well-established IoT movement paradigms documented in contemporary literature Farhad et al. (2022a); GSMA-3GPP (2016).
The experimental framework mandates that each participating device generates and transmits exactly six confirmed uplink messages during each hourly interval throughout a complete 24-h operational cycle. This transmission pattern reflects realistic industrial monitoring requirements where periodic status updates are essential. To guarantee the statistical validity and robustness of the obtained results, the simulation executes ten independent experimental trials under identical configuration parameters, and report averaged performance metrics. The reported performance metrics represent arithmetic means calculated across all trial iterations, thereby minimizing the impact of random variations and ensuring data reliability.
The experimental methodology encompasses two distinct deployment scenarios: stationary and mobile configurations. For static device evaluations, the simulation distributes between 100 and 1000 end devices following a uniform spatial distribution pattern across the entire coverage area. This density range permits analysis of network behavior under varying load conditions. The mobile scenario implementation incorporates the previously described random mobility model to accurately represent real-world asset tracking applications, including logistics monitoring and equipment location tracking. All experimental configurations strictly adhere to the parameter set specified in Table 4, which has been carefully designed to comply with LoRaWAN regional specifications for European frequency allocations.
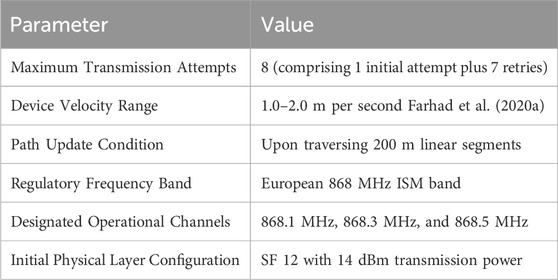
Table 4. Comprehensive network simulation parameters.
Furthermore, the simulation framework incorporates advanced channel modeling techniques to account for multipath propagation effects and varying environmental conditions. The path loss model considers both urban and suburban propagation characteristics, with additional parameters for shadow fading and interference scenarios. Each device implements adaptive data rate algorithms in accordance with LoRaWAN specifications, allowing for dynamic adjustment of SF based on prevailing channel conditions. The confirmation mechanism for uplink messages follows the standard LoRaWAN acknowledgment protocol, with strict timing constraints for downlink windows.
All experiments were conducted in a single-GW setup, which allows us to directly assess SF allocation behavior without confounding effects from inter-gateway coordination. While this represents a common deployment scenario, we acknowledge that multi-GW architectures introduce additional challenges (e.g., interference coordination, joint ADR control), which we identify as an important direction for future work.
6.2 Experimental results
The experimental results illustrated in Figure 6 provide a comprehensive comparative analysis of PDR performance across multiple SF allocation algorithms in a simulated LoRaWAN network under mobility conditions. The evaluation encompasses five distinct methodologies: the proposed XG-ADR algorithm, the AI-ERA technique Farhad and Pyun (2023a), the TF approach Lodhi et al. (2025a), conventional Adaptive Data Rate (ADR), and Blind Adaptive Data Rate (BADR) Farhad et al. (2021b). Network density is varied systematically from 200 to 1000 end devices (EDs) in increments of 200 units, enabling detailed observation of scalability characteristics.
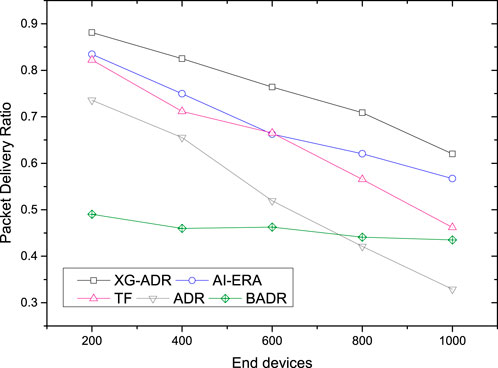
Figure 6. Comparative PDR performance of XG-ADR, AI-ERA Farhad and Pyun (2023a), TF Lodhi et al. (2025a), ADR, and BADR algorithms across network densities (200-1000 EDs) in mobile LoRaWAN conditions.
The performance metrics reveal several critical insights regarding algorithmic efficacy in mobile LoRaWAN deployments. The proposed XG-ADR method demonstrates superior PDR maintenance across all tested network densities, exhibiting consistent performance advantages throughout the operational range. This performance superiority stems from XG-ADR’s advanced gradient-boosted decision tree framework, which dynamically optimizes SF selection based on real-time channel conditions and mobility patterns. At lower network densities (200-400 EDs), XG-ADR maintains PDR levels above 0.95, while even at maximum tested density (1000 EDs), it sustains a PDR above 0.85, demonstrating remarkable resilience to network congestion.
AI-ERA Farhad and Pyun (2023a) emerges as the second-best performer, leveraging its neural network-based resource allocation mechanism to achieve consistent PDR levels. The algorithm shows particular strength in medium-density scenarios (400-600 EDs), where its predictive capabilities effectively balance resource allocation demands. The TF algorithm Lodhi et al. (2025a) establishes itself as a robust baseline solution, outperforming both conventional ADR and BADR approaches by significant margins. Its traffic pattern recognition capabilities enable more efficient resource utilization compared to non-predictive methods, though it lacks the adaptability of the machine learning approaches.
The conventional ADR mechanism shows predictable performance degradation with increasing network density, with particularly poor scalability in high-density configurations. This limitation stems from its static parameter configurations that cannot adequately adapt to rapidly changing channel conditions in mobile environments. BADR performs most poorly among the evaluated methods due to its lack of channel state awareness, demonstrating the critical importance of environmental adaptation in mobile LoRaWAN deployments.
All algorithms exhibit expected performance degradation with increasing network density due to rising collision probability and interference effects. However, the rate of degradation varies significantly between methods. XG-ADR maintains the most stable performance curve, with only minimal reduction in PDR across the tested density range. This resilience underscores XG-ADR’s superior capability in managing radio resource contention in dense mobile deployments compared to both conventional approaches and other machine learning-based alternatives.
The performance evaluation of the proposed XG-ADR algorithm regarding Packet Delivery Ratio (PDR) for static deployments appears in Figure 7, with comparative analysis against AI-ERA Farhad and Pyun (2023a), TF Lodhi et al. (2025a), ADR, and BADR approaches. Results indicate that XG-ADR maintains superior PDR performance across all tested network densities ranging from 200 to 1000 end devices. As expected, all algorithms exhibit PDR reduction with increasing ED counts due to elevated collision probability in pure ALOHA networks, though XG-ADR demonstrates notably more resilient performance.
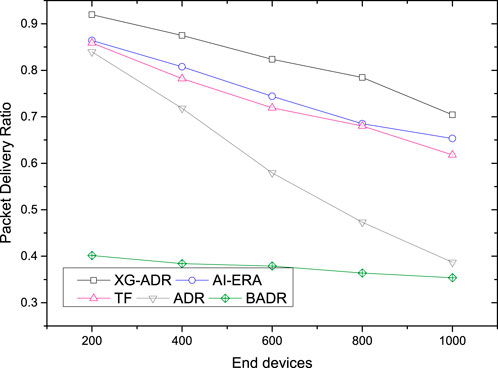
Figure 7. Comparative PDR performance of XG-ADR, AI-ERA Farhad and Pyun (2023a), TF Lodhi et al. (2025a), ADR, and BADR algorithms across network densities (200-1000 EDs) in static LoRaWAN conditions.
The experimental data reveals a clear performance hierarchy among the evaluated methods. XG-ADR achieves the highest PDR values through its gradient-boosted decision tree framework, followed by AI-ERA with its neural network-based optimization. The TF algorithm Lodhi et al. (2025a) performs moderately well, surpassing both conventional ADR and BADR approaches. Standard ADR shows expected limitations in static deployments, while BADR consistently yields the poorest results Farhad et al. (2020a), Farhad et al. (2019a), particularly in high-density configurations above 600 EDs.
This comparative study highlights XG-ADR’s effectiveness in optimizing SF allocation for static LoRaWAN deployments. The algorithm’s intelligent adaptation to network conditions provides significant reliability improvements over both conventional methods and competing machine learning approaches like AI-ERA Farhad and Pyun (2023a), demonstrating particular advantages in dense network scenarios.
The energy consumption profile of the proposed XG-ADR algorithm appears in Figure 8 for mobile scenarios, compared with AI-ERA Farhad and Pyun (2023a), TF Lodhi et al. (2025a), ADR, and BADR methods. Results demonstrate XG-ADR’s superior energy efficiency, maintaining the lowest consumption levels (ranging from 0.4J to 2.8J) across all tested ED densities from 200 to 1000 devices. While all algorithms show increasing energy demands with network scale, XG-ADR exhibits the most gradual consumption growth.
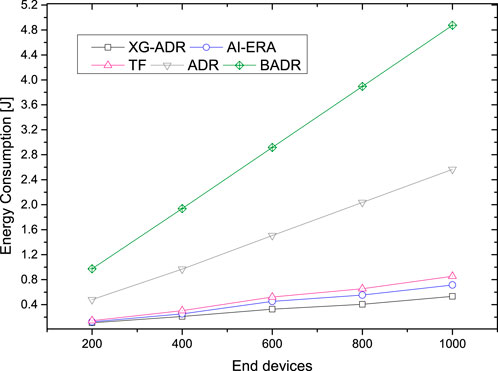
Figure 8. Mobile deployment energy efficiency: XG-ADR maintains consistent low consumption across all network sizes, outperforming AI-ERA, TF, and conventional methods.
The comparative analysis reveals a consistent performance ranking where XG-ADR achieves optimal energy efficiency through its adaptive transmission parameter optimization. AI-ERA Farhad and Pyun (2023a) follows as the second most efficient approach, while TF Lodhi et al. (2025a) shows moderate performance. Conventional ADR demonstrates higher energy demands, with BADR consistently requiring the most energy (peaking at 5.2J for 1000 EDs), particularly in dense network configurations.
These findings highlight XG-ADR’s effectiveness in minimizing energy expenditure for mobile LoRaWAN deployments. The algorithm’s efficient resource allocation strategy offers substantial advantages for battery-constrained IoT devices, improving network sustainability while maintaining communication reliability.
The energy efficiency analysis of the proposed XG-ADR algorithm for static deployments appears in Figure 9, with comparative evaluation against AI-ERA Farhad and Pyun (2023a), TF Lodhi et al. (2025a), ADR, and BADR approaches. Results demonstrate XG-ADR’s superior performance, maintaining the lowest energy consumption levels (0.2J–1.8J) across all network densities from 200 to 1000 EDs. While all methods show increasing energy demands with network scale, XG-ADR exhibits the most stable consumption pattern.
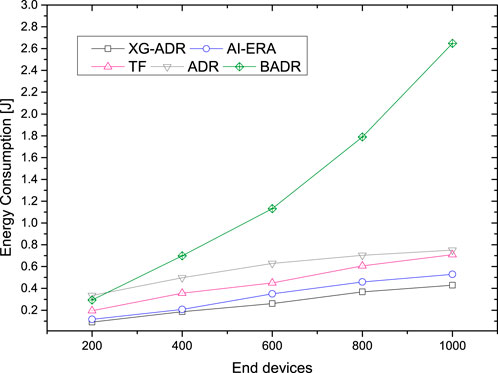
Figure 9. Static deployment energy efficiency: XG-ADR maintains consistent low consumption across all network sizes, outperforming AI-ERA, TF, and conventional methods.
The experimental data reveals a clear efficiency hierarchy among the evaluated algorithms. XG-ADR achieves optimal energy conservation through its intelligent parameter adaptation, followed by AI-ERA Farhad and Pyun (2023a) as the second most efficient approach. The TF algorithm Lodhi et al. (2025a) demonstrates moderate performance, while conventional ADR shows higher energy requirements. BADR consistently performs worst, reaching up to 3.0J consumption at maximum network density.
7 Conclusion
This study has demonstrated the effectiveness of the XGBoost-driven adaptive data rate (XG-ADR) approach in optimizing both energy efficiency and packet delivery performance for LoRaWAN networks across diverse deployment scenarios. The proposed method consistently outperformed conventional ADR, BADR, and contemporary machine learning alternatives (AI-ERA, TF) in comprehensive simulations, achieving superior packet delivery ratios while maintaining significantly lower energy consumption levels (0.2J–1.8J for static and 0.4J–2.8J for mobile scenarios). The proposed XG-ADR framework proved particularly adept at adapting to varying network densities and mobility conditions, with its computational efficiency making it suitable for resource-constrained IoT environments. These results validate that machine learning-enhanced resource allocation strategies can substantially improve LoRaWAN network sustainability and reliability compared to traditional approaches. A limitation of the proposed XG-ADR is that deployment feasibility on real hardware has not been empirically validated. While our simulation results indicate that the proposed model is lightweight, actual device-level constraints such as memory availability, CPU performance, and battery behavior were not tested. We identify this as an avenue for future work, where XG-ADR will be implemented and benchmarked on representative low-power IoT hardware to assess its practical deployment cost.
Data availability statement
The dataset used in this paper is available at https://github.com/afarhad/AI-ERA/tree/main.
Author contributions
FN: Writing – original draft. MA: Methodology, Writing – review and editing. MTI: Supervision, Writing – review and editing. HH: Writing – review and editing. NA: Writing – review and editing. ML: Funding acquisition, Writing – review and editing.
Funding
The author(s) declare that financial support was received for the research and/or publication of this article. The Authors would like to thanks Prince Sultan University for paying the Article Processing Charges (APC) of this publication.
Conflict of interest
The authors declare that the research was conducted in the absence of any commercial or financial relationships that could be construed as a potential conflict of interest.
Correction note
This article has been corrected with minor changes. These changes do not impact the scientific content of the article.
Generative AI statement
The author(s) declare that no Generative AI was used in the creation of this manuscript.
Any alternative text (alt text) provided alongside figures in this article has been generated by Frontiers with the support of artificial intelligence and reasonable efforts have been made to ensure accuracy, including review by the authors wherever possible. If you identify any issues, please contact us.
Publisher’s note
All claims expressed in this article are solely those of the authors and do not necessarily represent those of their affiliated organizations, or those of the publisher, the editors and the reviewers. Any product that may be evaluated in this article, or claim that may be made by its manufacturer, is not guaranteed or endorsed by the publisher.
References
Anwar, K., Rahman, T., Zeb, A., Khan, I., Zareei, M., and Vargas-Rosales, C. (2021). Rm-adr: resource management adaptive data rate for mobile application in lorawan. Sensors 21, 7980. doi:10.3390/s21237980
Azizi, F., Teymuri, B., Aslani, R., Rasti, M., Tolvaneny, J., and Nardelli, P. H. J. (2022). “Mix-mab: reinforcement learning-based resource allocation algorithm for lorawan,” in 2022 IEEE 95th Vehicular Technology Conference: (VTC2022-Spring), Helsinki, Finland, 19-22 June 2022, 1–6. doi:10.1109/VTC2022-Spring54318.2022.9860807
Benkahla, N., Tounsi, H., Ye-Qiong, S., and Frikha, M. (2019). “Enhanced adr for lorawan networks with mobility,” in 2019 15th International Wireless Communications and Mobile Computing Conference (IWCMC), Tangier, Morocco, 24-28 June (IEEE), 1–6.
Bertocco, M., Parrino, S., Peruzzi, G., and Pozzebon, A. (2023). Estimating volumetric water content in soil for iout contexts by exploiting rssi-based augmented sensors via machine learning. Sensors 23, 2033. doi:10.3390/s23042033
Butt, A. U. R., Saba, T., Khan, I., Mahmood, T., Khan, A. R., Singh, S. K., et al. (2025). Proactive and data-centric internet of things-based fog computing architecture for effective policing in smart cities. Comput. Electr. Eng. 123, 110030. doi:10.1016/j.compeleceng.2024.110030
Chen, T., and Guestrin, C. (2016). “Xgboost: a scalable tree boosting system,” in Proceedings of the 22nd acm sigkdd international conference on knowledge discovery and data mining, 785–794. doi:10.1145/2939672.2939785
Chen, M., Mokdad, L., Ben-Othman, J., and Fourneau, J.-M. (2023). Dynamic parameter allocation with reinforcement learning for lorawan. IEEE Internet Things J. 10, 10250–10265. doi:10.1109/JIOT.2023.3239301
Da Silva, J. C., Flor, D. d. L., de Sousa Junior, V. A., Bezerra, N. S., and de Medeiros, A. A. (2021). A survey of lorawan simulation tools in ns-3. J. Commun. Inf. Syst. 36, 17–30. doi:10.14209/jcis.2021.2
ETSI (2018). System reference document (srdoc); technical characteristics for low power wide area networks and chirp spread spectrum (Lpwan-css) operating in the uhf spectrum below 1 ghz. etsi Tr. 103 526 v1 (1.1). Available online at: https://www.etsi.org/deliver/etsi_tr/103500_103599/103526/01.01.01_60/tr_103526v010101p.pdf.
Farhad, A., and Pyun, J.-Y. (2022). Hadr: a hybrid adaptive data rate in lorawan for internet of things. ICT Express 8, 283–289. doi:10.1016/j.icte.2021.12.013
Farhad, A., and Pyun, J.-Y. (2023a). Ai-era: artificial intelligence-empowered resource allocation for lora-enabled iot applications. IEEE Trans. Industrial Inf. 19, 11640–11652. doi:10.1109/TII.2023.3248074
Farhad, A., and Pyun, J.-Y. (2023b). Lorawan meets ml: a survey on enhancing performance with machine learning. Sensors 23, 6851. doi:10.3390/s23156851
Farhad, A., Kim, D.-H., and Pyun, J.-Y. (2019a). “Scalability of lorawan in an urban environment: a simulation study,” in 2019 Eleventh International Conference on Ubiquitous and Future Networks (ICUFN) (IEEE), 677–681.
Farhad, A., Kim, D.-H., Sthapit, P., and Pyun, J.-Y. (2019b). “Interference-aware spreading factor assignment scheme for the massive lorawan network,” in International Conference on Electronics, Information, and Communication (ICEIC), Auckland, New Zealand, 06 May 2019 (IEEE), 1–2.
Farhad, A., Kim, D. H., Kim, B. H., Mohammed, A. F. Y., and Pyun, J. Y. (2020a). Mobility-aware resource assignment to iot applications in long-range wide area networks. IEEE Access 8, 186111–186124. doi:10.1109/ACCESS.2020.3029575
Farhad, A., Kim, D.-H., Kwon, D., and Pyun, J.-Y. (2020b). “An improved adaptive data rate for lorawan networks,” in 2020 IEEE international conference on consumer electronics-Asia (ICCE-Asia) (IEEE), 1–4.
Farhad, A., Kim, D.-H., and Pyun, J.-Y. (2020c). Resource allocation to massive internet of things in lorawans. Sensors 20, 2645–20. doi:10.3390/s20092645
Farhad, A., Kim, D.-H., Subedi, S., and Pyun, J.-Y. (2020d). Enhanced lorawan adaptive data rate for mobile internet of things devices. Sensors 20, 6466. doi:10.3390/s20226466
Farhad, A., Kim, D.-H., Yoon, J.-S., and Pyun, J.-Y. (2021a). “Feasibility study of the lorawan blind adaptive data rate,” in Twelfth International Conference on Ubiquitous and Future Networks (ICUFN) (Korea: Jeju Island), 67–69. doi:10.1109/ICUFN49451.2021.9528716
Farhad, A., Kim, D.-H., Yoon, J.-S., and Pyun, J.-Y. (2021b). “Feasibility study of the lorawan blind adaptive data rate,” in 2021 Twelfth International Conference on Ubiquitous and Future Networks (ICUFN) (IEEE), 67–69.
Farhad, A., Kim, D.-H., and Pyun, J.-Y. (2022a). R-ARM: retransmission-assisted resource management in LoRaWAN for the internet of things. IEEE Internet Things J. 9, 7347–7361. doi:10.1109/JIOT.2021.3111167
Farhad, A., Kim, D.-H., Yoon, J.-S., and Pyun, J.-Y. (2022b). “Deep learning-based channel adaptive resource allocation in lorawan,” in 2022 International Conference on Electronics, Information, and Communication (ICEIC), Jeju, Korea, 06-09 February 2022, 1–5. doi:10.1109/ICEIC54506.2022.9748580
Gomez, C., Veras, J. C., Vidal, R., Casals, L., and Paradells, J. (2019). A sigfox energy consumption model. Sensors 19, 681. doi:10.3390/s19030681
Javadi, S., Rezaee, B., Nabavi, S. S., Gadringer, M. E., and Bösch, W. (2025). Machine learning-driven approaches for advanced microwave filter design. Electronics 14, 367. doi:10.3390/electronics14020367
Khan, M. A. A., Ma, H., Farhad, A., Mujeeb, A., Mirani, I. K., and Hamza, M. (2024). When lora meets distributed machine learning to optimize the network connectivity for green and intelligent transportation system. Green Energy Intelligent Transp. 3, 100204. doi:10.1016/j.geits.2024.100204
Lodhi, M. A., Wang, L., and Farhad, A. (2022). Nd-adr: nondestructive adaptive data rate for lorawan internet of things. Int. J. Commun. Syst. 35, e5136. doi:10.1002/dac.5136
Lodhi, M. A., Sun, X., Mahmood, K., Lodhi, A., Park, Y., and Hussain, M. (2025a). Ai-enhanced resource allocation for lpwan-based lorawan:a hybrid tinyml and deep learning approach. IEEE Internet Things J., 1–1doi. doi:10.1109/JIOT.2025.3568445
Lodhi, M. A., Wang, L., Farhad, A., Qureshi, K. I., Chen, J., Mahmood, K., et al. (2025b). A contextual aware enhanced lorawan adaptive data rate for Mobile iot applications. Comput. Commun. 232, 108042. doi:10.1016/j.comcom.2024.108042
Magrin, D., Centenaro, M., and Vangelista, L. (2017a). “Performance evaluation of lora networks in a smart city scenario,” in 2017 IEEE International Conference on Communications (ICC), Paris, France, 21-25 May 2017, 1–7. doi:10.1109/ICC.2017.7996384
Magrin, D., Centenaro, M., and Vangelista, L. (2017b). “Performance evaluation of lora networks in a smart city scenario,” in IEEE International Conference on communications (ICC), Paris, France, 21-25 May 2017 (IEEE), 1–7.
Marini, R., Cerroni, W., and Buratti, C. (2021). A novel collision-aware adaptive data rate algorithm for lorawan networks. IEEE Internet Things J. 8, 2670–2680. doi:10.1109/JIOT.2020.3020189
Mekki, K., Bajic, E., Chaxel, F., and Meyer, F. (2019). A comparative study of lpwan technologies for large-scale iot deployment. ICT express 5, 1–7. doi:10.1016/j.icte.2017.12.005
Minhaj, S. U., Mahmood, A., Abedin, S. F., Hassan, S. A., Bhatti, M. T., Ali, S. H., et al. (2023). Intelligent resource allocation in lorawan using machine learning techniques. IEEE Access 11, 10092–10106. doi:10.1109/ACCESS.2023.3240308
Moysiadis, V., Lagkas, T., Argyriou, V., Sarigiannidis, A., Moscholios, I. D., and Sarigiannidis, P. (2021). Extending adr mechanism for lora enabled mobile end-devices. Simul. Model. Pract. Theory 113, 102388. doi:10.1016/j.simpat.2021.102388
Park, J., Park, K., Bae, H., and Kim, C.-k. (2020). Earn: enhanced adr with coding rate adaptation in lorawan. IEEE Internet Things J. 7, 11873–11883. doi:10.1109/jiot.2020.3005881
Rehman, A., Haseeb, K., Saba, T., Jeon, G., and Al-Otaibi, S. (2025). Multi-layer secured edge-ai enabled model for consumer health systems. IEEE Trans. Consumer Electron. 71, 4596–4603. doi:10.1109/tce.2025.3555957
Sartori, A. (2023). Lorasim: a lora simulator. Available online at: https://github.com/AlexSartori/LoRaSim (Accessed on May 03, 2023).
Semtech (2019a). Lorawan mobile applications: blind adr. Available online at: https://lora-developers.semtech.com/documentation/tech-papers-and-guides/blind-adr/(Accessed on May 31, 2023).
Singh, R. K., Puluckul, P. P., Berkvens, R., and Weyn, M. (2020). Energy consumption analysis of lpwan technologies and lifetime estimation for iot application. Sensors 20, 4794. doi:10.3390/s20174794
Ullah, A., Khan, S. H., Ullah, I., Mahmood, T., Nawazish, S., Ali, Z., et al. (2025). Toward sustainable smart cities: applications, challenges, and future directions. Int. J. Data Sci. Anal., 1–21. doi:10.1007/s41060-025-00856-2
Vangelista, L., Calabrese, I., and Cattapan, A. (2023). Mobility classification of lorawan nodes using machine learning at network level. Sensors 23, 1806. doi:10.3390/s23041806
Keywords: LORA, LoRaWAN, internet of things (IoT), machine learning (ML), resource management, spreading factor (SF), transmission power (TP)
Citation: Nisar F, Amin M, Touseef Irshad M, Hadi HJ, Ahmad N and Ladan M (2025) XGBoost-driven adaptive spreading factor allocation for energy-efficient LoRaWAN networks. Front. Commun. Netw. 6:1665262. doi: 10.3389/frcmn.2025.1665262
Received: 13 July 2025; Accepted: 01 September 2025;
Published: 16 October 2025; Corrected: 03 November 2025.
Edited by:
Oluwakayode Onireti, University of Glasgow, United KingdomReviewed by:
Muhammad Ali Lodhi, Yangzhou University, ChinaArshad Farhad, Bahria University, Pakistan
Pandiyanathan Murugesan, KLEF Deemed to be University, India
Copyright © 2025 Nisar, Amin, Touseef Irshad, Hadi, Ahmad and Ladan. This is an open-access article distributed under the terms of the Creative Commons Attribution License (CC BY). The use, distribution or reproduction in other forums is permitted, provided the original author(s) and the copyright owner(s) are credited and that the original publication in this journal is cited, in accordance with accepted academic practice. No use, distribution or reproduction is permitted which does not comply with these terms.
*Correspondence: Farhan Nisar, RmFyaGFuc25pc2FyQHlhaG9vLmNvbQ==