 Kai-Xi Tian
 Jie-Xuan Dong1
- 1Baoshan Traditional Chinese Medicine Hospital, Baoshan, China
- 2Department of Emergency Medicine, The First Affiliated Hospital of Tianjin University of Traditional Chinese Medicine, Tianjin, China
Objective: A nomogram model for predicting the prognosis of patients with sepsis in the intensive care unit (ICU) was developed based on lactate and procalcitonin (PCT) and externally validated.
Methods: From the anonymous medical database of the First Affiliated Hospital of Tianjin University of Traditional Chinese Medicine, 55 patients with sepsis admitted to the ICU of the First Affiliated Hospital of Tianjin University of Traditional Chinese Medicine were retrospectively collected. Demographic data, admission leukocyte count, lactate, PCT, and other clinical parameters were collected. Based on 28-day outcomes, patients were stratified into survival and mortality groups. Independent prognostic risk factors were identified In review through multivariate logistic regression analysis, and a nomogram prediction model was subsequently developed and internally validated. From the anonymous medical database of the First Affiliated Hospital of Tianjin University of Traditional Chinese Medicine, an additional 45 ICU sepsis patients were collected to form an independent cohort for external validation.
Results: The cohort comprised 55 patients (37 male, 18 female), with 41 survivors and 14 non-survivors. No statistically significant differences were observed between survival and mortality groups in sex, age, White Blood Cell (WBC) Counts on Admission, Underlying Diseases, admission lactate,72-h lactate levels, 72-h lactate clearance rate, 24-h PCT levels, 24-h PCT clearance rate, or 72-h PCT levels (all P > 0.05). Significant differences were identified in 24-h lactate levels, 24-h lactate clearance rate, admission PCT levels, and 72-h PCT clearance rate (P < 0.05). Multivariate analysis confirmed 24-h lactate clearance rate and 72-h PCT clearance rate as independent prognostic risk factors for sepsis outcomes. The prognostic value of 24-h lactate clearance rate and 72-h PCT clearance rate in ICU sepsis patients was evaluated. The area under the ROC curve (AUC) for the 24-h lactate clearance rate was 0.709 (P = 0.02). For the 72-h PCT clearance rate, the AUC was 0.908 (P = 0.039). The combined model yielded an AUC of 0.920 (P = 0.036). Internal validation of the nomogram model incorporating both 24-h lactate clearance In review rate and 72-h PCT clearance rate demonstrated an AUC of 0.9012453, with a sensitivity of 0.539507 and specificity of 0.8985287. The calibration curve analysis shows that there is a certain correlation between the prediction probability of the model and the observation results, indicating that it has a certain prediction accuracy and reliability. Decision curve analysis (DCA) demonstrated some clinical net benefit across a range of threshold probabilities, supporting the model's utility in sepsis management. External validation of the nomogram model (incorporating 24-h lactate clearance rate and 72-h PCT clearance rate) using an independent cohort showed an AUC of 0.681, with sensitivity 0.510 and specificity 0.742.
Conclusion: Both 24-h lactate clearance rate and 72-h PCT clearance rate may serve as independent prognostic risk factors for predicting outcomes in ICU sepsis patients. The combination of two independent prognostic risk factors may demonstrate superior predictive value for the prognosis of ICU sepsis patients compared to individual factors alone. A nomogram prediction model integrating these two independent risk factors may exhibits enhanced accuracy, reliability, and clinical utility. However, due to the limited sample size (n = 55) and single-center cohort design, these findings require validation through multicenter prospective studies with larger cohorts to strengthen the evidence level and confirm In review generalizability.
1 Background
Sepsis is a life-threatening organ dysfunction caused by a dysregulated host response to infection (1). Sepsis is a relatively common critical illness in the ICU. Currently, due to its persistently high morbidity and mortality rates, the diagnosis and treatment of sepsis have become a significant public health concern. Gaieski et al. (2) reported that over 1 million patients are diagnosed with sepsis annually in the United States, with its incidence continuing to rise. A substantial proportion of sepsis patients require intensive care, with mortality rates ranging from 20% to 50% (3, 4). According to 2018 epidemiological data, China reports up to 32.38 million sepsis cases annually, with a mortality rate of 66.7%, exceeding the global average (5). A study on Chinese ICUs revealed that sepsis patients account for 20.6% of ICU admissions, among whom 53.3% have septic shock, while severe sepsis and uncomplicated sepsis account for 43.6% and 3.1%, respectively. Regarding mortality, septic shock patients—the largest subgroup—exhibit the highest 90-day mortality rate (51.94%), whereas uncomplicated sepsis patients—the smallest subgroup—have the lowest (2.75%), and severe sepsis patients show a In review 90-day mortality rate of 17.69% (6). Additionally, studies indicate that the daily medical cost for severe sepsis patients in China reaches $502 (7). Given its high incidence, mortality, and substantial financial burden on families, sepsis poses a major global threat to public health.
To address these challenges in clinical practice, accurately predicting disease progression and prognosis in sepsis is critical. In current diagnostic protocols, lactate and PCT are widely used to assess sepsis progression and outcomes. This study employs a retrospective analysis to identify independent risk factors associated with lactate-and PCT-related indicators that influence sepsis prognosis. It further compares the predictive value of combined risk factors vs. individual factors and constructs a 28-day prognostic nomogram model for sepsis patients. This nomogram may assist clinicians in rapidly and accurately evaluating disease progression and prognosis based on dynamic biomarker changes, enabling timely adjustments to treatment plans, personalized care, reduced overtreatment, and lower medical costs. The model will undergo internal and external validation, with calibration plots and clinical DCA to enhance its reliability, accuracy, and clinical applicability.
2 Methods
2.1 Case selection
Both internal and external validation data must meet the following inclusion and exclusion criteria.
(1) Diagnostic criteria: Sepsis diagnosis followed the Third In review International Consensus Definitions for Sepsis and Septic Shock (Sepsis-3) (8).
(2) Inclusion criteria: Aged 18–85 years; Meets diagnostic criteria for sepsis.
(3) Exclusion criteria: Patients with pre-existing hematological disorders, malignancies, hepatic/renal insufficiency, or immune diseases; those who underwent continuous renal replacement therapy (CRRT) within 72 h of admission; non-mechanically ventilated patients; and patients with incomplete clinical data for accurate assessment.
2.2 Clinical data
A total of 55 mechanically ventilated sepsis patients aged 18–85 years, treated at The First Affiliated Hospital of Tianjin University of Traditional Chinese Medicine from January 2022 to January 2024, were included. The cohort comprised 37 males and 18 females, with 14 non-survivors and 41 survivors.
2.3 Study design
This study employed a single-center, retrospective case-control design. All patient data in this study were obtained from anonymous data from the medical database of Tianjin University of Traditional Chinese Medicine, and were retrospectively enrolled.
2.4 Observational parameters
Both internal and external validation data were collected via anonymous data from the medical database of Tianjin University of Traditional Chinese Medicine: patient demographics: age, sex; History of In review underlying diseases: diabetes, hypertension, coronary heart disease; Laboratory markers: admission WBC count, Lactate levels at admission, 24h, and 72 h, Lactate clearance rates at 24 h and 72 h, PCT levels at admission, 24 h, and 72 h, PCT clearance rates at 24 h and 72 h, Clinical outcome: 28-day prognosis.
2.5 Statistical analysis
Statistical analysis was performed using SPSS 21.0. Measurement data conforming to a normal distribution were expressed as mean ± standard deviation (mean ± SD), while non-normally distributed measurement data were expressed as the interquartile range (IQR; Q25, Q75).
For intergroup comparisons: normally distributed data between two groups were analyzed using the independent samples t-test. Non-normally distributed data between two groups were analyzed using the Mann-Whitney U-test (rank-sum test). Multi-group comparisons were performed using the Kruskal-Wallis H-test.
Categorical variables were expressed as frequencies and percentages, and comparisons between categorical variables were conducted using the chi-square (χ2) test.
These statistical methods (independent samples t-test, MannWhitney U-test, and chi-square test) were applied to compare clinical parameters between groups, aiming to identify risk factors influencing In review the prognosis of sepsis patients.
SPSS21.0 was used to complete univariate and multivariate logistic regression analysis, identify independent risk factors affecting the prognosis of patients with sepsis in ICU, construct ROC curves, and complete the Hosmer and Lemeshow Test. The predictive value of individual independent risk factors vs. combined risk factors for ICU sepsis prognosis was compared. Based on the identified independent risk factors, the collinearity analysis of independent risk factors was completed using the car package, corrplot package, and Hmisc package of R software (version 4.3.1 (2023-06-16 ucrt), and then the nomogram model was developed using the rms package, rmda package, dcurves package, etc., and the clinical decision curve and Bootstrap internal validation (1,000 iterations) were generated. External validation was performed using clinical data from an additional 45 ICU sepsis patients to evaluate the accuracy, reliability, and clinical applicability of this model. Difference difference is defined as P < 0.05.
3 Results
3.1 Comparison of baseline characteristics
A total of 55 septic patients from the ICU of Tianjin University of Traditional Chinese Medicine were enrolled in this study. There were no statistically significant differences in baseline characteristics between the two groups (P > 0.05). For details, see Tables 1–3.
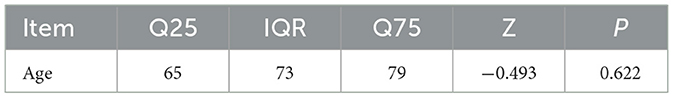
Table 1. Comparison of patient age between the two groups.

Table 2. Comparison of WBC counts on admission between the two groups.
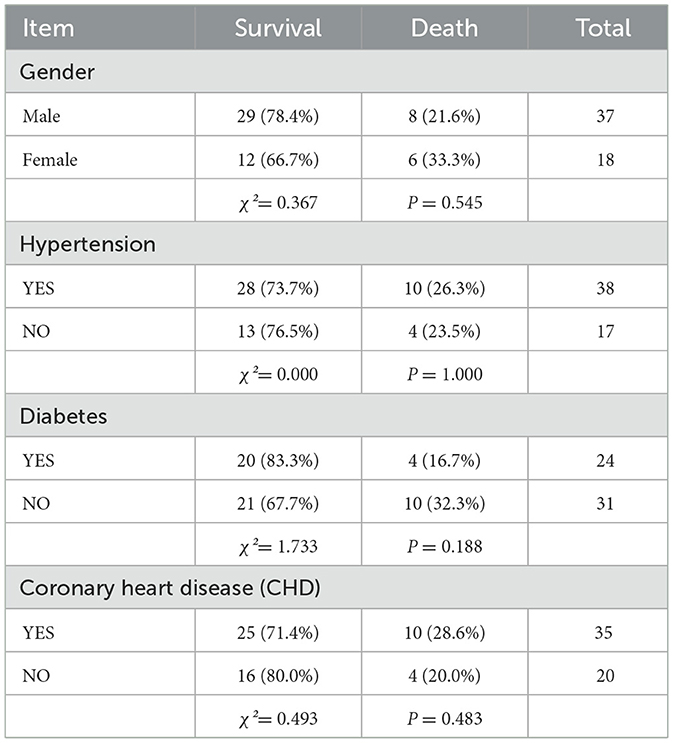
Table 3. Comparison of underlying diseases between the two groups.
3.2 Comparison of lactate and procalcitonin (PCT)-related indicators between groups
In the comparison of lactate and PCT-related indicators between the two groups, statistically significant differences were observed in 24-h lactate levels, 24-h lactate clearance rate, admission PCT levels, and 72-h PCT clearance rate (P < 0.05). Detailed results are shown in Table 4.
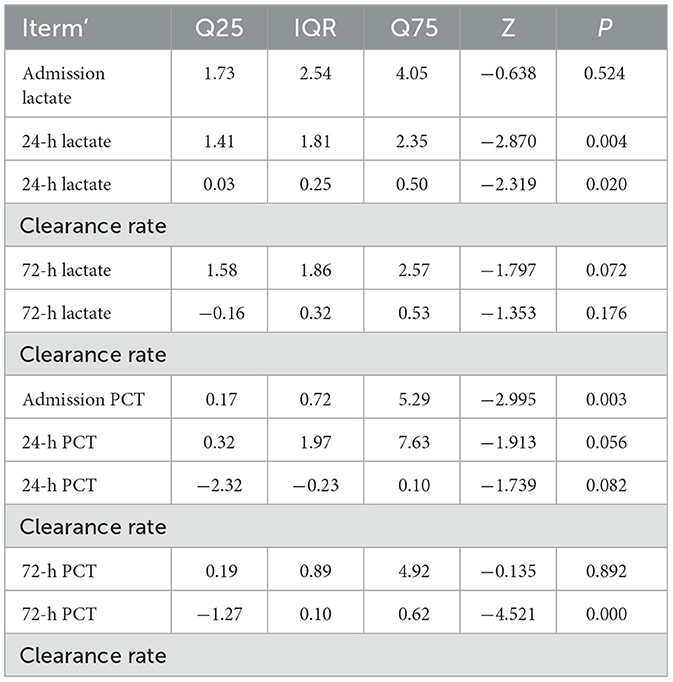
Table 4. Comparison of lactate and PCT-related indicators between the two groups.
3.3 Analysis of independent risk factors affecting the prognosis of septic patients
Statistically significant differences were observed between the survival and death groups in 24-h lactate levels, 24-h lactate clearance rate, admission PCT levels, and 72-h PCT clearance rate (P < 0.05). These variables were subjected to univariate logistic regression analysis. Results showed that 24-h lactate levels, 24-h lactate clearance rate, and 72-h PCT clearance rate were significantly associated with prognosis (P < 0.05), while admission PCT levels showed no significance (P = 0.104, P > 0.05; see Table 5).
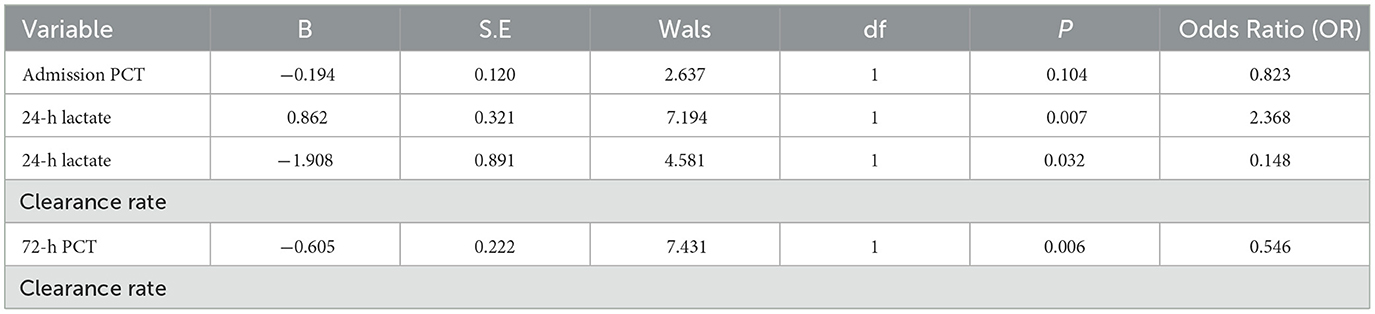
Table 5. Results of univariate logistic regression analysis for factors with significant differences between groups.
Subsequently, multivariate logistic regression analysis was performed using these three risk factors as independent variables. Results demonstrated that 24-h lactate clearance rate and 72-h PCT clearance rate remained statistically significant (P < 0.05; see Table 6), identifying them as independent risk factors for 28-day prognosis in septic patients.
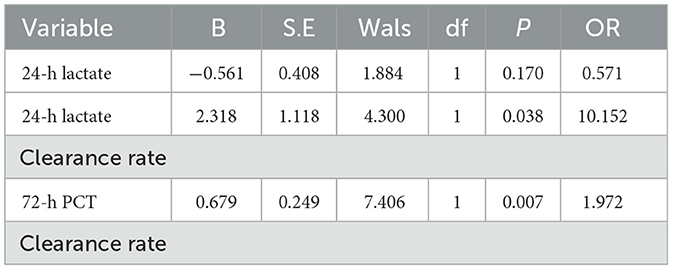
Table 6. Results of multivariate logistic regression analysis for risk factors.
3.4 Comparison of prognostic value between single and combined independent risk factors in septic patients
ROC curves were generated to evaluate the predictive value of individual and combined independent risk factors. The area value under the ROC curve is the core index to evaluate the discrimination ability of the prediction model, and the numerical size can reflect the model's ability to correctly distinguish between “true positive” and “true negative.” A higher AUC value represents a higher predictive value of the prediction model. The results showed: 24-h lactate clearance rate: AUC = 0.709, standard error (SE) = 0.091, P = 0.020, 95% confidence interval (CI): 0.531–0.887 (Figure 1); 72-h PCT clearance rate: AUC = 0.908, SE = 0.039, P < 0.001, 95% CI: 0.830–0.985 (Figure 2); Combined two independent risk factors: AUC = 0.920, SE = 0.036, P < 0.001, 95% CI: 0.850–0.990 (Figure 3).

Figure 1. ROC curve for 24-h lactate clearance rate. The ROC curve showed a good discrimination (AUC = 0.709, P = 0.020, 95% CI: 0.531–0.887).
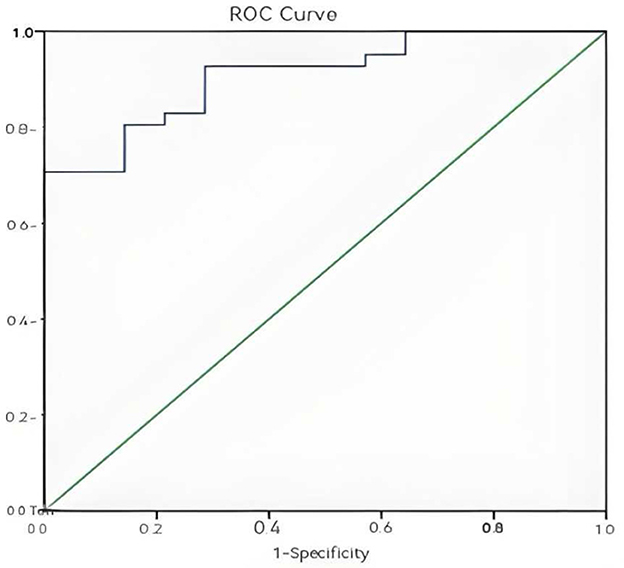
Figure 2. ROC curve of 72-h PCT clearance rate. The ROC curve showed a good discrimination (AUC = 0.908, P < 0.001, 95% CI: 0.830–0.985).
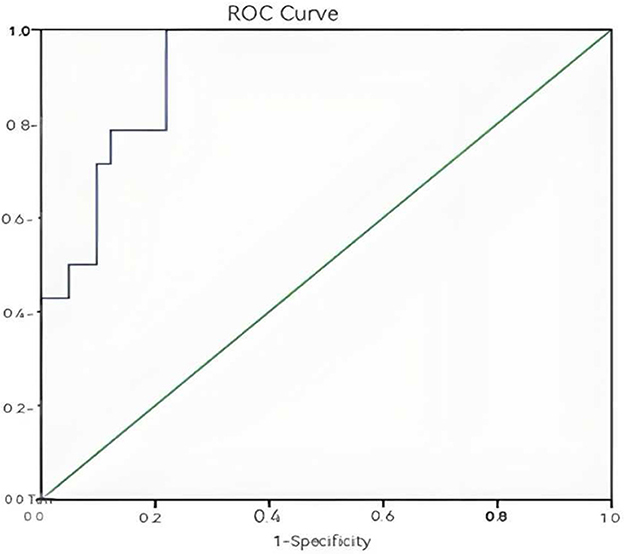
Figure 3. Combined ROC curve of the two independent risk factors. The ROC curve showed a good discrimination (AUC = 0.920, P < 0.001, 95% CI: 0.850–0.990).
The AUC value of the combination of two independent risk factors is greater than that of any one risk factor alone, so the combination of the two independent risk factors has a higher predictive value for the prognosis of sepsis patients.
The Hosmer and Lemeshow Test is the core test method of logistic regression model calibration, which is used to evaluate the degree of match between the predicted probability of the model and the actual observed outcome, if the test result is P > 0.05, and χ2/d < 2 indicates that the model is well calibrated and there is no local calibration defect.
The Hosmer and Lemeshow test results of the logistic regression model constructed with two independent risk factors alone and the two independent risk factors combined all showed P > 0.05 and χ2/d < 2, which supported the model fit well and the model calibration degree was acceptable (see Tables 7–9 for details).
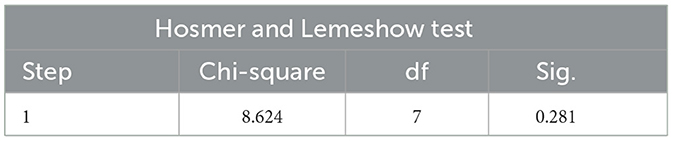
Table 7. Hosmer and lemeshow test results for 24-h lactate clearance.
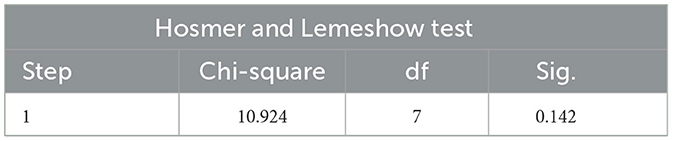
Table 8. Hosmer and Lemeshow test results for 72-h PCT clearance.

Table 9. The results of the Hosmer and Lemeshow test combined with two independent risk factors.
The variance expansion factor (VIF) of the two predictors was 1.079493 less than 2, indicating that there was no significant multicollinearity problem. The highest correlation coefficient between variables was |r| = 0.08, which was much lower than the collinearity alert threshold of 0.7 (see Table 10 for details).
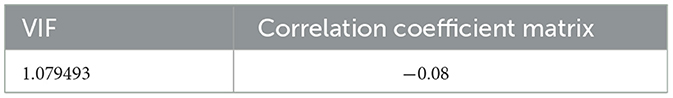
Table 10. Multicollinearity diagnostic results.
3.5 Construction of a nomogram model combining twoindependent risk factors for predicting sepsis prognosis
A nomogram model for predicting the prognosis of sepsis patients was developed using R language, based on the combination of two independent risk factors, as illustrated in Figure 4. In the nomogram, the 24-h lactate clearance rate and 72-h PCT clearance rate are displayed according to their respective weights. Each variable value corresponds to a point score, and the sum of all variable scores yields the total score. The total score is then mapped to a predicted probability, representing the survival probability of sepsis patients.
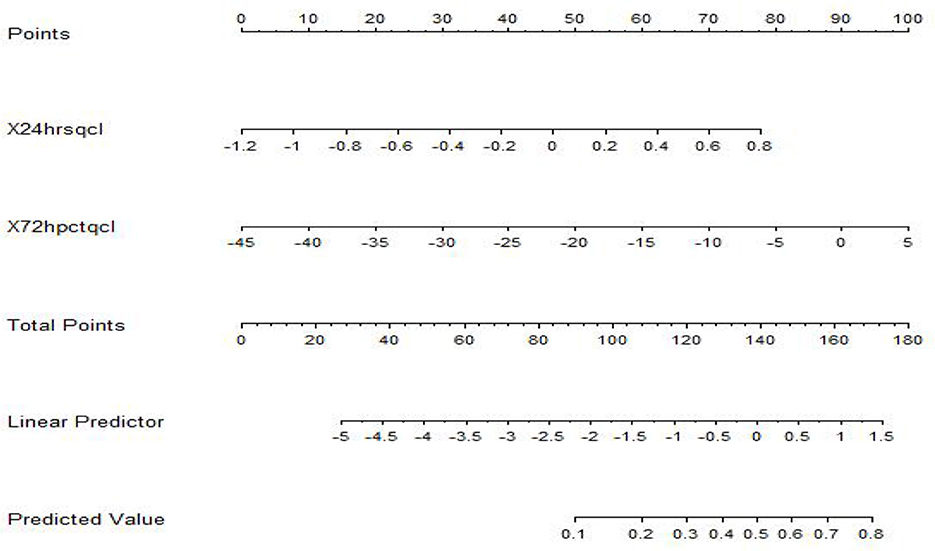
Figure 4. Nomogram model for predicting sepsis prognosis. Each predictor indicates a certain score. A total score was generated by a summary of the score of each predictor. The total score is then mapped to a predicted probability, representing the survival probability of sepsis patients.
3.6 Evaluation of the prognostic nomogram model for sepsis patients
The calibration curve and clinical decision curve of the nomogram model were plotted, and Bootstrap internal validation was performed. External validation was conducted using clinical data from an additional 45 ICU sepsis patients to assess the model's accuracy, reliability, and clinical applicability. In Figure 5, the x-axis and y-axis of the calibration curve represent the nomogram-predicted and actual survival probabilities, respectively. The ideal curve is a 45° diagonal line, where closer proximity to the diagonal indicates better agreement between model predictions and actual observations, reflecting higher reliability. The results of this study show that the calibration curve of the model roughly coincides with the ideal curve in its overall trajectory, indicating that the model has certain predictive value.
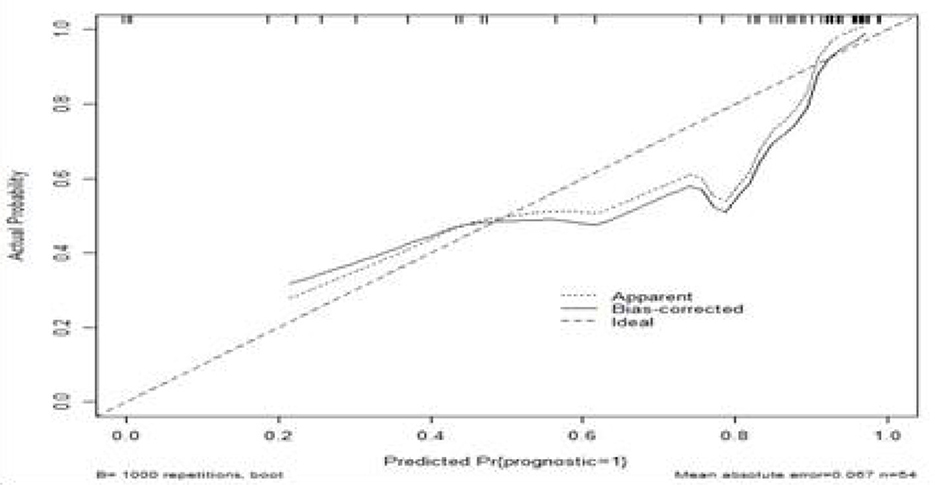
Figure 5. Calibration curve of the predictive model. The x-axis and y-axis of the calibration curve represent the predicted probability and the actual survival probability of the nomogram, respectively. The diagonal dotted line represents a perfect prediction by an ideal model. The solid line represents the performance of the nomogram. It represents a better prediction that a solid line is close to a diagonal dotted line. The calibration curve of the model roughly coincides with the ideal curve in its overall trajectory, indicating that the model has certain predictive value.
In Figure 6, when the DCA curve lies above and to the right of the two extreme lines, it indicates superior predictive performance and clinical value. The DCA of this model suggests that this predictive model may provide some clinical net benefit for patients with sepsis.
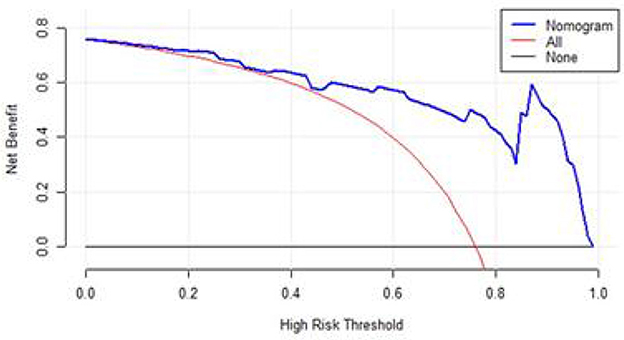
Figure 6. DCA of the nomogram. Black-solid line: The patient does not apply the nomogram and the net benefit is zero; Red-solid line: All patients are treated by the nomogram. The area enclosed by the three lines presents the clinical utility of the nomogram.
For internal validation, the model achieved an AUC value of 0.901, sensitivity of 0.540, and specificity of 0.899. External validation yielded an AUC value of 0.681, sensitivity of 0.510, and specificity of 0.742. The large difference between the AUC values of internal and external validation indicates that there may be some overfitting or data heterogeneity in the nomogram prediction model, which may be caused by the small sample size of the prediction model and the systematic differences in the included population, which limits the generalizability of the nomogram prediction results.
4 Discussion
This study aimed to retrospectively investigate independent risk factors affecting sepsis prognosis through lactate and PCT-related indices and to develop a nomogram model for predicting 28-day outcomes in sepsis patients. The results demonstrated that 24-h PCT clearance rate and 72-h lactate clearance rate were independent risk factors influencing 28-day prognosis. The combined predictive value of these two factors surpassed that of either factor alone.
Compared with the traditional project of evaluating the complex Sofa score of sepsis patients and the APACH-II score of critically ill patients, the nomogram prediction model constructed using lactate and PCT indicators can accurately cover the dual characteristics of sepsis “infection + organ damage,” and has the advantage of visualization to intuitively reflect the prognosis of patients. Nomogram models constructed using these independent risk factors have shown some clinical applicability. It may aid in prognostic assessment, early detection of clinical deterioration, and personalized treatment adjustments, potentially improving treatment outcomes, alleviating patient suffering, reducing healthcare costs, guiding treatment optimization, and enhancing outcomes.
However, due to the small sample size of this study (n = 55 in the main cohort and n = 45 in the external validation cohort), limited evidence strength, and all patients were from the ICU medical database of the First Affiliated Hospital of Tianjin University of Traditional Chinese Medicine, resulting in the homogeneity of the enrolled population. The above reasons lead to the large difference in the AUC value of internal and external verification of the prediction model, and there is a certain overfitting and data heterogeneity of the prediction model. There may be selection bias in the analysis of conclusions, and generality cannot be guaranteed, and the generalization of the model needs to be re-verified. Therefore, multicenter, larger sample clinical studies are needed to improve the quality and generalizability of the evidence and to minimize estimation errors by improving population diversity and statistical power.
Data availability statement
The raw data supporting the conclusions of this article will be made available by the authors, without undue reservation.
Ethics statement
Ethical approval was not required for the study involving humans in accordance with the local legislation and institutional requirements. Written informed consent to participate in this study was not required from the participants or the participants' legal guardians/next of kin in accordance with the national legislation and the institutional requirements.
Author contributions
K-XT: Writing – review & editing, Data curation, Validation, Writing – original draft. J-XD: Writing – review & editing. JD: Data curation, Writing – review & editing. X-BH: Writing – review & editing, Validation. YL: Writing – review & editing.
Funding
The author(s) declare that no financial support was received for the research and/or publication of this article.
Conflict of interest
The authors declare that the research was conducted in the absence of any commercial or financial relationships that could be construed as a potential conflict of interest.
Generative AI statement
The author(s) declare that no Gen AI was used in the creation of this manuscript.
Any alternative text (alt text) provided alongside figures in this article has been generated by Frontiers with the support of artificial intelligence and reasonable efforts have been made to ensure accuracy, including review by the authors wherever possible. If you identify any issues, please contact us.
Publisher's note
All claims expressed in this article are solely those of the authors and do not necessarily represent those of their affiliated organizations, or those of the publisher, the editors and the reviewers. Any product that may be evaluated in this article, or claim that may be made by its manufacturer, is not guaranteed or endorsed by the publisher.
References
1. Wu JF, Luan YY, Ke L. Expert consensus on the diagnosis and treatment of immunosuppression in sepsis. Chin Crit Care Emerg Med. (2020) 32:1281–89. doi: 10.3760/cma.j.cn121430-20201123-00719
2. Gaieski DF, Edwards JM, Kallan MJ, Carr BG. Benchmarking the incidence and mortality of severe sepsis in the United States. Crit Care Med. (2013) 41:1164–74. doi: 10.1097/CCM.0b013e31827c09f8
3. Kaukonen KM, Bailey M, Suzuki S, Pilcher D, Bellomo R. Mortality related to severe sepsis and septic shock among critically ill patients in Australia and New Zealand, 2000-2012. JAMA. (2014) 311:1308–16. doi: 10.1001/jama.2014.2637
4. Rhee C, Dantes R, Epstein L, Murphy DJ, Seymour CW, Iwashyna TJ, et al. Incidence and trends of sepsis in US hospitals using clinical vs claims data, 2009-2014. JAMA. (2017) 318:1241–9. doi: 10.1001/jama.2017.13836
5. Weng L, Zeng XY, Yin P, Wang LJ, Wang CY, Jiang W, et al. Sepsis-related mortality in China: a in review descriptive analysis. Intensive Care Med. (2018) 44:1071–80. doi: 10.1007/s00134-018-5203-z
6. Xie J, Wang H, Kang Y, Zhou L, Liu Z, Qin B, et al. The epidemiology of sepsis in Chinese ICUs: a national cross-sectional survey. Crit Care Med. (2020) 48:e209–18. doi: 10.1097/CCM.0000000000004155
7. Cheng B, Xie G, Yao SL, Wu X, Guo Q, Gu M, et al. Epidemiology of severe sepsis in critically ill surgical patients in ten university hospitals in China. Crit Care Med. (2007) 35:2538–46. doi: 10.1097/01.CCM.0000284492.30800.00
Keywords: sepsis, lactic acid, procalcitonin, line chart prediction model, external verification, prognosis
Citation: Tian K-X, Dong J-X, Du J, Huang X-B and Liu Y (2025) Development and validation of a lactate and procalcitonin-based nomogram model for predicting prognosis in ICU sepsis patients. Front. Disaster Emerg. Med. 3:1612093. doi: 10.3389/femer.2025.1612093
Received: 15 April 2025; Accepted: 01 September 2025;
Published: 03 October 2025.
Edited by:
Gabriella Bottari, Bambino Gesù Children's Hospital (IRCCS), ItalyReviewed by:
Tamorish Kole, University of South Wales, United KingdomRuth Lizzeth Madera Sandoval, Mexican Social Security Institute, Mexico
Copyright © 2025 Tian, Dong, Du, Huang and Liu. This is an open-access article distributed under the terms of the Creative Commons Attribution License (CC BY). The use, distribution or reproduction in other forums is permitted, provided the original author(s) and the copyright owner(s) are credited and that the original publication in this journal is cited, in accordance with accepted academic practice. No use, distribution or reproduction is permitted which does not comply with these terms.
*Correspondence: Yi Liu, MTUzOTM4NzkxNjdAMTYzLmNvbQ==