 G. Tatsis1
 G. Baldoumas1
 V. Christofilakis1*
 P. Kostarakis1
 P. A. Varotsos2
 N. V. Sarlis2
 E. S. Skordas2A. Bechlioulis3L. K. Michalis3
 K. K. Naka3
- 1Electronics-Telecommunications and Applications Laboratory, Physics Department, University of Ioannina, Ioannina, Greece
- 2Section of Condensed Matter Physics, Department of Physics, National and Kapodistrian University of Athens, Athens, Greece
- 32nd Department of Cardiology and Michaelidion Cardiac Center, Faculty of Medicine, School of Health Sciences, University of Ioannina, Ioannina, Greece
Sudden cardiac death (SCD) is one of the leading causes of death worldwide. Many individuals have no cardiovascular symptoms before the SCD event. As a result, the ability to identify the risk before such an event is extremely limited. Timely and accurate prediction of SCD using new electronic technologies is greatly needed. In this work, a new innovative e-health cloud-based system is presented that allows a stratification of SCD risk based on the method of natural time entropy variability analysis. This innovative, non-invasive system can be used easily in any setting. The e-health cloud-based system was evaluated using data from a total of 203 individuals, patients with chronic heart failure (CHF) who are at high risk of SCD and age-matched healthy controls. Statistical analysis was performed in two-time windows of different duration; the first-time window had a duration of 20 min, while the second was 10 min. Employing modern methods of machine learning, classifiers for the discrimination of CHF patients from the healthy controls were obtained for the first as well as the second (half-time) window. The results indicated a very good separation between the two groups, even from samples taken in a 10-min time window. Larger studies are needed to further validate this novel e-health cloud-based system before its use in everyday clinical practice.
1 Introduction
Sudden cardiac death (SCD) is a frequent cause of death and may occur even if the electrocardiogram (ECG) seems to be similar to that of a healthy (H) individual. More people die from SCD than HIV, breast cancer, lung cancer, and stroke combined (Arora et al., 2007). A method that may identify patients at high risk for SCD, provide an estimate of an impending cardiac arrest and distinguish chronic heart failure (CHF) patients from H individuals has been developed by Varotsos et al. (2007).
The above method was built on the basis of the following two cornerstones:
First, it is most likely that physiological time series contain both stochastic and deterministic components (Costa et al., 2002; Costa et al., 2005; Varotsos et al., 2004). Since, however, the concept of entropy can be applied to stochastic as well as deterministic processes, it has been used to ECG analysis (Varotsos et al., 2004).
Second, the entropy employed in the above method has been defined in the natural time domain which differs essentially from others (Varotsos et al., 2011; Varotsos et al., 2023). Both the entropy S in natural time as well as the entropy in natural time under time reversal S− along with their difference ΔS ≡ S − S− have been found of paramount importance in the analysis of ECGs. Such an application to the analysis of ECG reveals that we can separate ECG of H individuals from those suffering from CHF and are at risk of SCD (Varotsos et al., 2007). This successful separation has been achieved because the quantity ΔS -which did not exist in other types of entropies published in the literature-identifies when a dynamic system approaches criticality.
Beyond the standard ECG characterized by a sequence of P, QRS, and T waves, in recent years, a technique termed photoelectric plethysmography, also known as photoplethysmography (PPG), has simplified the recording of heart rate in an easy and reliable way (Allen, 2007; Tamura et al., 2014; Park et al., 2022). We have recently constructed a portable PPG electronic device which gives results comparable with a standard ECG. This enables remote sensing natural time analysis of heartbeat data and achieves a distinction between H and CHF patients.
In the present work, we focus our study in the case of 10 min recordings by employing a variety of modern methods of machine learning. The novel e-health cloud-based system consists of three distinct parts: the PPG device, the application, and the web service. The objective of the e-health cloud-based system is twofold. First, we need to obtain not only reliable results, as demonstrated in following sections, but also results that are instant and understandable, e.g., similar to the indication of a body temperature thermometer. Second, we focus on the simplicity and portability of the system so that it can be used anywhere and by anyone. The system can be used anywhere, at home or in a non-healthcare setting. This is vital since the majority of cardiovascular risk assessment methods require medical equipment and qualified medical personnel in a hospital or in a medical Centre while on the other hand, most out-of-hospital cardiac arrests occur in private homes (Milan and Perman, 2016). The remainder of this paper is organized in the following Sections: Section 2 presents material and methods; in Section 3 Results and Discussion are given and the Conclusions follow in Section 4.
2 Materials and methods
2.1 Data analyzed
The present database contains PPG recordings from 32 H individuals (9 women and 23 men), aged 24 to 58, and 171 recordings from CHF patients (33 women and 138 men), aged 31 to 89, which were collected in the setting of the second Department of Cardiology, University Hospital of Ioannina, Ioannina, Greece. Thus, we studied in total
For all patients, data regarding personal medical history, current medications, and recent biochemical/metabolic profile were recorded. The measurements of healthy subjects, who were selected among the medical and nursing staff of the cardiology department, were performed in a quiet room with the same methodology as described above for CHF patients.
2.2 Photoplethysmography
This technique has been employed for measuring blood volume changes in the extremity tissues. In 1938, Hertzman found a correlation between the intensity of the light reflection of the skin and its blood supply in several body skin locations (Hertzman, 1938). From 1980 the PPG method is used in pulse oximetry for monitoring a person’s oxygen saturation into clinical care. Nowadays the PPG technology is included in many modern wearable devices such as smart phones, smart watches, tablets, bracelets, rings, etc. It is a simple technique with low cost that provides important health-related information such as heart rate variability (HRV), blood oxygen saturation (SpO2), blood pressure and the respiratory rate (Park and Jayaraman, 2003; Elgendi, 2012).
The concept of the PPG methodology is simple and requires a light source especially Infra-Red Light Emitting Diode (IR-LED) or a red LED which illuminates the tissue such as finger, earlobe and forehead(Moraes et al., 2018). A photodetector measures the intensity variations of reflected or transmitted light from the blood volume variation in the tissue (Jayadevappa and Holi, 2016). Figure 1 illustrates a typical PPG signal that was captured from a healthy 34-year-old man. It has a triangular shape with two peaks and for our convenience, the upper peak was labeled as P peak-pulse. The inter beat interval (IBI) is defined as the interval between two consecutive P peaks, and this is why it is called PP interval.
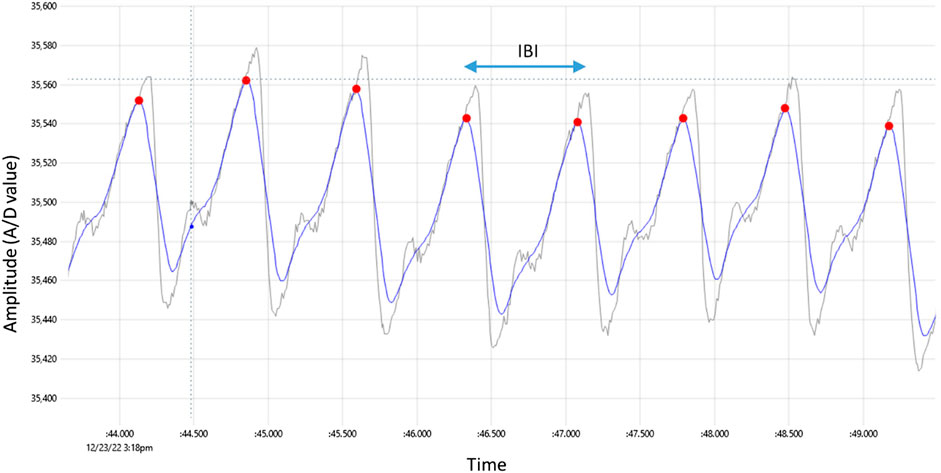
FIGURE 1. Typical PPG signal captured by the prototype device, with red dots indicating detected peaks. The raw signal has gray color whereas the smoothed signal has blue color. The time difference between two consecutive peaks is the inter-beat interval labeled IBI.
2.3 The e-health cloud-based system architecture and specifications
The novel e-health cloud-based system consists of three distinct parts: the PPG device, the application, and the web service as shown in Figure 2.
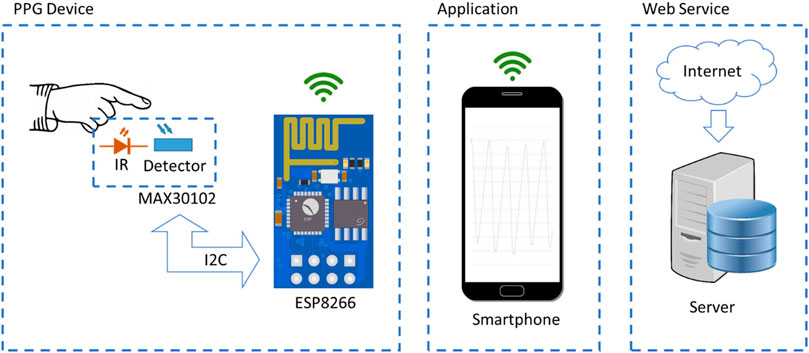
FIGURE 2. The system architecture.
2.3.1 The PPG device
The first part is the prototype circuit of the measuring device manufactured in the Electronics—Telecommunications and Applications Lab of the University of Ioannina. Figure 3 shows a photograph of the implemented PPG device and Table 1 shows its technical specifications. Its purpose is to sample continuously the heart rate signal of an individual using the method of PPG (Park et al., 2022). A proper case is constructed to fit the person’s finger. The prototype integrates the pulse oximeter chip MAX30102 by Analog Devices Inc, which utilizes an IR-LED and a photodetector. The infrared light illuminates the fingertip and the reflection is detected and measured by the photodetector. Small variations due to blood circulation causes the reflection level to fluctuate accordingly. The signal is captured with the help of the Wifi module ESP-01 having onboard the system on chip (SoC) ESP8266 by Espressif Systems. The microprocessor communicates with the oximeter via the I2C interface and acts as a Wifi access point (WiFi-AP) to communicate with a smartphone with a dedicated in-house application developed. The device is equipped with its own Li-ion battery and a usb charging circuit resulting in a total portable solution with autonomy of 12 hours.
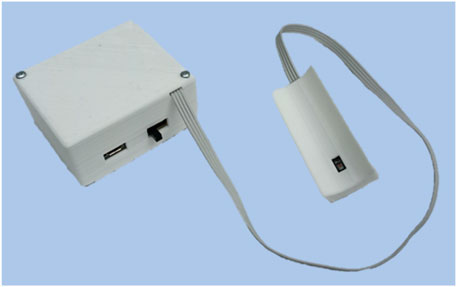
FIGURE 3. The PPG device.

TABLE 1. PPG device technical details.
2.3.2 The application
The high-level user interface is an application (app) that can be installed on any smartphone or tablet running Android 4 or higher. The app helps the user to quickly start a recording of the PPG signal and save these signals in files. The files have a unique serial number for each subject along with a timestamp that identifies them. The whole processing of the files with the innovative algorithm is conducted in a server installed in our laboratory. The recordings may take place off-line, the smartphone connects directly to the Wifi-capable prototype device. For the rest of the operation, an internet connection is required. The users can view the results via the web interface of the website developed. The users have access only to their specific recordings by logging in with credentials. It is important to note that no personal information is stored on the server, only encoded serial numbers for names, protecting individual’s privacy. Figure 4, shows the graphical user interface of the Android application. Apart from the possibility of language selection, there are also 3 additional buttons. By selecting the quit button the application can be closed and by selecting the recording button we have the ability to see previous results (Figure 4A). By pressing new recording the right window opens. We enter the unique serial number of the subject and then press the start recording button. The cardiogram is displayed in real time (Figure 4B). When the required time has elapsed, we press the stop recording button and by pressing yes, the data is stored in the local memory of the android device and processed online (Figure 4C). The user simply selects and uploads the recordings that have been chosen to process and in few seconds the results are reported in a web page while simultaneously the status is changed to “OK” (Figure 4D).
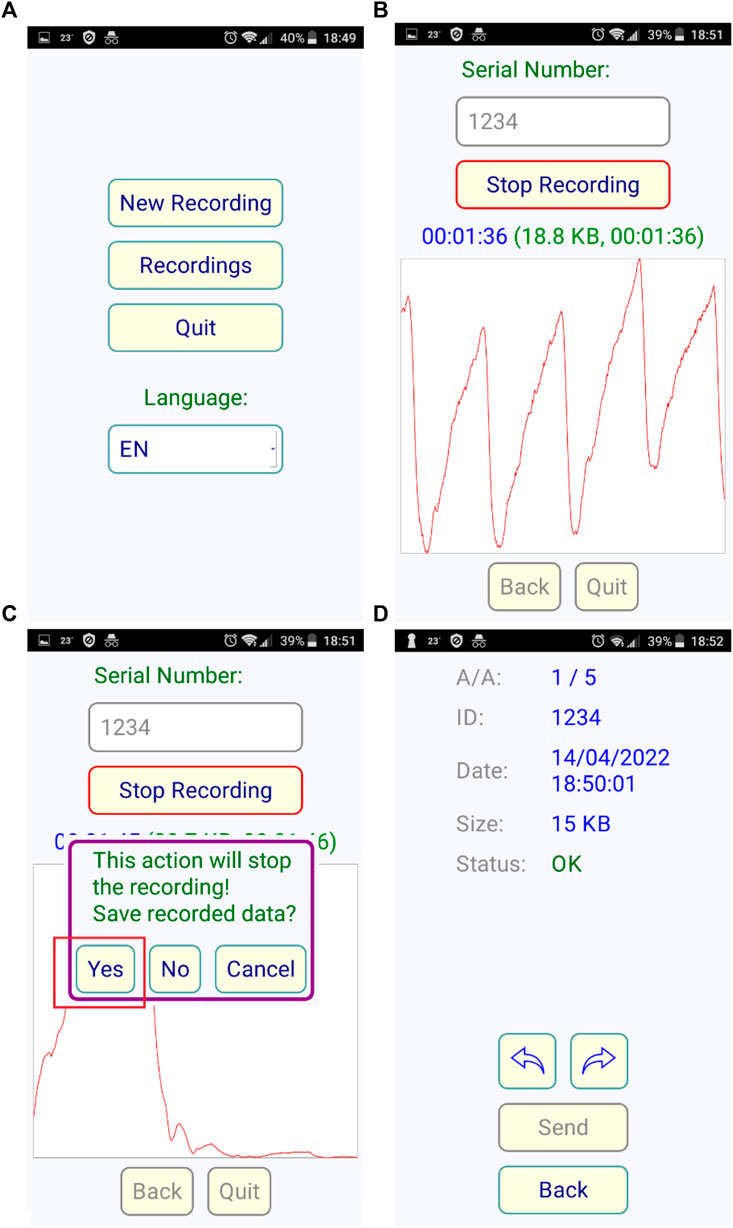
FIGURE 4. Screenshots of the Android application, (A) the starting screen, (B) the recording progress with visualization for checking signal quality (C) Stop and save data screen (D) the uploading to server menu.
2.3.3 Signal processing
The innovative algorithm applied in this research data is based on the concept of Natural Time Analysis (NTA) (Varotsos et al., 2011; Varotsos et al., 2023) and the parameter extracted from the signal is the IBI that is the time between two sequential heart beats or pulses (PP). We may also think this parameter as the RR equivalent in an ECG. This metric measured with the PPG device is found to be in excellent agreement compared to the standard of an ECG. The raw signal that the oximeter produces is shown in Figure 2. The sampling rate is set to 400 samples/sec while an automatic averaging is also performed every 4 samples in order to reduce the noise thus getting and store 100 samples/sec. The smartphone stores the files that have a total duration of about 20 min each. The files are uploaded to the server as mentioned in a previous Section and are simultaneously processed. The PP metric extraction from the signal follows a simple peak detection method. First, we smooth the signal by moving average with a window length of 0.1 s. This typically ensures that in every period only one local maximum exists by removing any high frequency noise spikes in between. In Figure 2, the initial raw signal has gray color and the smoothed has blue. Inevitably the smoothing acts as a low pass filter which slightly distorts the signal but without altering the low frequency components which include the information needed. Then a peak search algorithm follows; that finds the local maxima in a moving time-window that must be narrow enough to contain at most 1 peak and wide enough to include the ascending-descending sides of the peak as well. We used the value of 0.3 s, which is an empirical limit that is always less than a period for measurements in the relaxed state, corresponding to an equivalent heart-rate of 180 bpm. The above procedure ends with a list of PP values in a vector array that is used to feed the feature extraction algorithm employed by the classification method we choose.
2.3.4 The web service
The processing of the uploaded files in the server is done automatically once the files are transferred. The results are organized in a simple user-based manner. The user is the owner of a device that has a unique code (password) that gives access to his/her data only. A user may be a doctor or a clinician or an individual who is responsible to organize the patients giving them a corresponding identification number (ID). The mapping of the IDs with the patients is an information known only to the user. There is no personal information in the server, thus protecting sensitive data. If the owner is an individual that uses the device for his/her measurements only, then he/she may view the results of the process directly in the web interface. If the user is a doctor and with the same device makes measurements with more than one patient, then the doctor is responsible to give the results to the patient, for example, by sending them via email. The web interface can filter patients by their ID and the doctor may print the results of a specific patient. In Figure 5, a screenshot of the web interface is depicted, where a user may retrieve information regarding specific measurements taken. Each point corresponds to a single measurement. The number in the labels are the patients’ IDs.
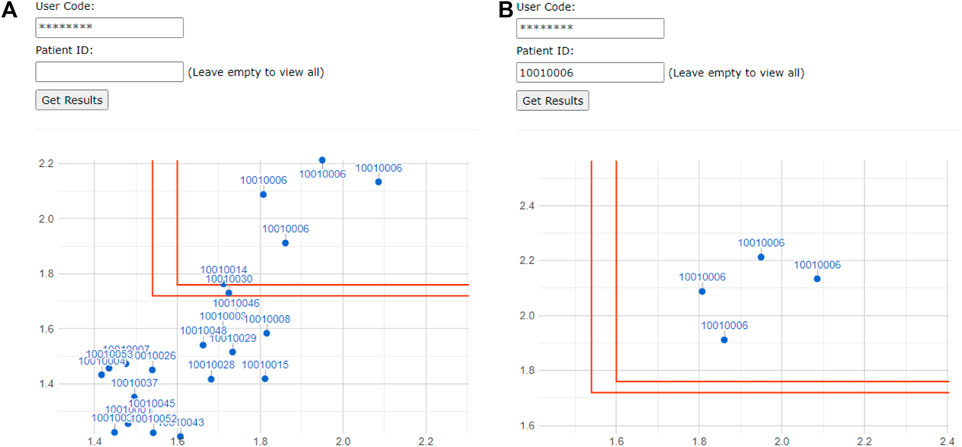
FIGURE 5. Screenshot of the web interface for the user showing all individual’s/patient’s measurements (A) and filtered by ID (B) in a two-dimensional diagram with the two complexity measures Λ7 and Λ49 of the classification. The regions defined by the red lines distinguish the healthy population from the CHF one.
3 Results and discussion
The results come from the entropy variation analysis which has as a theoretical background the monographs (Varotsos et al., 2011; Varotsos et al., 2023) describing natural time analysis. After data acquisition from the PPG system and the completion of the signal processing, including calculation of PP time series, the quantities σ[ΔS3], σ[ΔS5], σ[ΔS7], σ[ΔS35], and σ[ΔS49] for each individual, have been determined, see Figure 6. These quantities allow, for example, the estimation of the two complexity measures Λ7 and Λ49 shown in Figure 5.
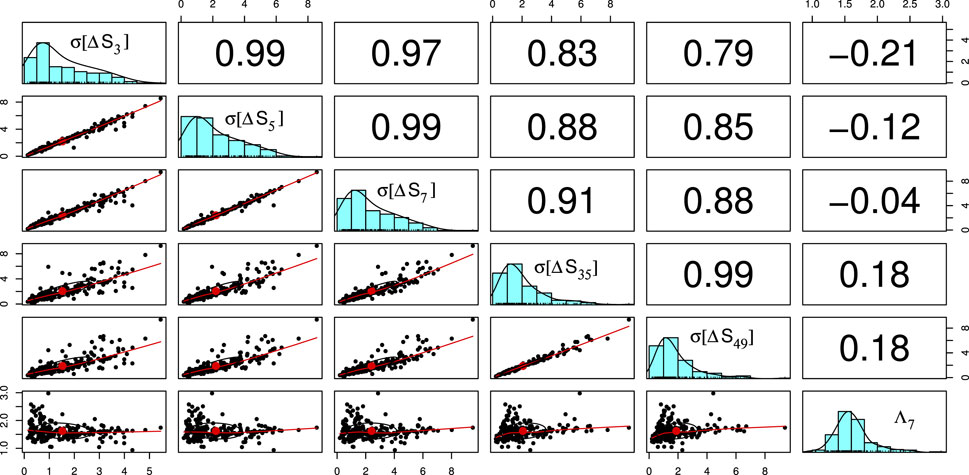
FIGURE 6. Exploratory data analysis of the database in the form of a matrix of figures: The elements of the cross-correlation matrix between the quantities (σ[ΔS3], σ[ΔS5], σ[ΔS7], σ[ΔS35], σ[ΔS49], Λ7) are shown in the upper triangle. In the lower triangle, each quantity is plotted versus another. The average values are shown with a red dot and a correlation ellipse is also drawn, for details see the pairs.panels command of the psych package (William Revelle, 2023) of R that has been used. In the diagonal, the distribution of each quantity is shown.
Figure 6 summarizes the results and the interrelations between the components of the six-vectors.(σ[ΔS3], σ[ΔS5], σ[ΔS7], σ[ΔS35], σ[ΔS49], Λ7) that constitute the parameter space used for the optimization of the separation of CHF from H. To this end, we employed the C5.0 decision tree algorithm the application of which leads (see Figure 7, 8) to a CHF sensitivity sCHF = 99.4% and an H sensitivity sH = 93.75%. This method is easily adopted by the web service server of Figure 2, and screenshots similar to Figure 7, 8 can be provided to the users.
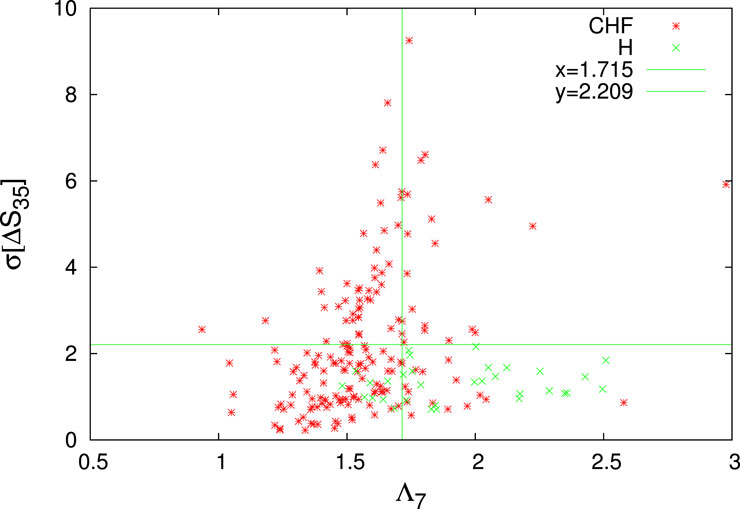
FIGURE 7. The quantity σ[ΔS35] versus Λ7 for both CHF (red asterisks) and H (green crosses). For a simpler visualization the quantity σ[ΔS35] depicted is 1000 times larger (cf. this convention applies to all the figures, hereafter). The H-limits identified by the decision tree of the first trial of the (majority rule of the) C5.0 classification (Kuhn and Quinlan, 2023) employed is depicted by the green lines in the lower rightmost quadrant.

FIGURE 8. The H-limits identified by the decision tree of the first trial of the majority rule of the C5.0 classification employed: How the quantity σ[ΔS5](>0.491) allows the identification 22 H (green candlesticks ending at crosses) with a mixing of 7 CHF (red candlesticks) within the lower rightmost quadrant of Figure 7. This decision tree, which can be simplified to the rule that a subject is H if Λ7 > 1.715, σ[ΔS35] ≤ 2.209, and σ[ΔS5] > 0.491 leads to a CHF sensitivity sCHF = 164/171 = 95.9% and an H sensitivity sH = 22/32 = 68.75%. The latter quantities are drastically increased to sCHF = 170/171 = 99.4% and sH =30/32 = 93.75%, respectively, when employing a majority rule with 20 trials.
The five scales l = 3, 5, 7, 35, and 49 involved, as well as the complexity measure Λ7 are closely related to the spectral density study of HRV (Taskforce ESC/NASPE, 1996) since the following two clear frequency bands in heart rate and blood pressure with autonomic involvement have been established (Malpas, 2002): 1) A higher frequency (HF) band, which lies in (Bigger et al., 1995; Prokhorov et al., 2003) the range 0.15–0.40 Hz and 2) A lower frequency (LF) band from 0.04 to 0.15 Hz (i.e., at around 0.1 Hz). In addition, the existence of a very low frequency band (VLF) in the region 0.003–0.04 Hz has been identified (Taskforce ESC/NASPE, 1996). Hence the scales l = 3 and 5 correspond to HF, whereas the scales l = 7, 35, and l = 49 lie near to the transition from the HF to the LF band and from the LF band to the VLF band, respectively.
As an additional check of the consistency of the parameter space employed and the results found, we used the K-means unsupervised classification algorithm. Of note, the K-means problem (Hartigan and Wong, 1979) consists of dividing a set of multivariate data into k non-overlapping groups in such a way as to minimize the sum (across the groups) of the sums of squared residual distances to the group centroids (this statistic is usually called Sum of Squared Errors, SSE). Figures 9, 10 show that the two clusters labeled 5 and 8 contain the vast majority of H, 28 out of 32. It is worth mentioning that two H-clusters spontaneously surface upon the application of the K-means algorithm.
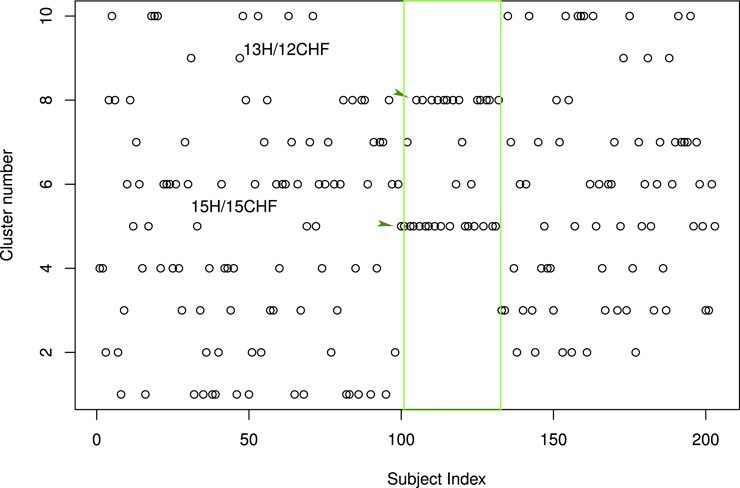
FIGURE 9. Results of the application of the K-means unsupervised classification algorithm: The distribution of the 203 subjects of our study into 10 classes. The H correspond to subject indices 101 to 132 and are indicated by the green rectangle. They mainly concentrate into two classes the one labeled 5 and the one labeled 8. By selecting these two clusters as H-clusters, we are led to a CHF sensitivity sCHF = 144/171 = 84.2% and an H sensitivity sH = 28/32 = 87.5%. Here, the kmeans clustering function of the stats package of R has been employed (R Core Team, 2013) together with the common (Lantz, 2013) rule of thumb to set k equal to
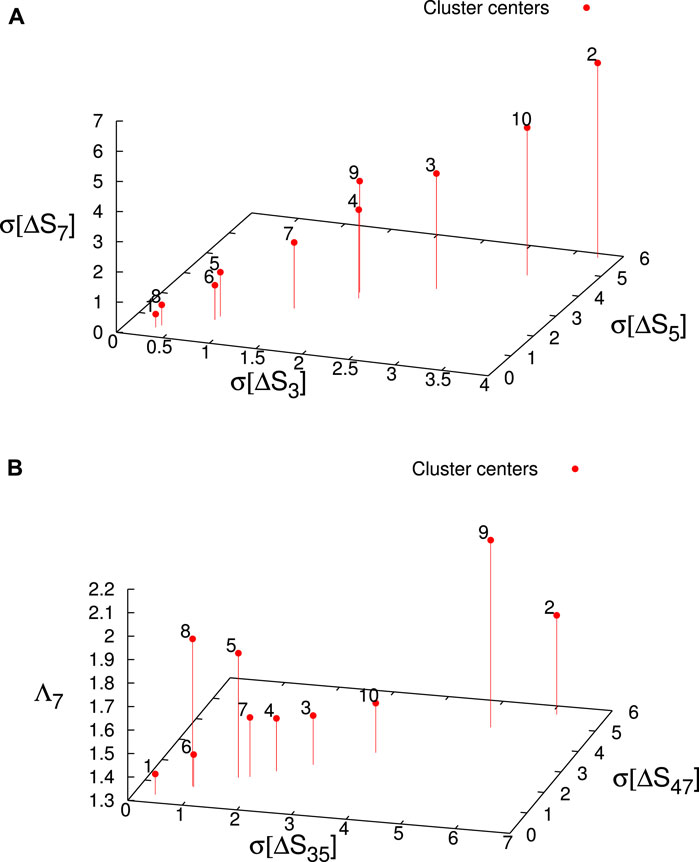
FIGURE 10. The location of the K-means cluster centers in the parameter space (red candlesticks ending at solid circles). The clusters labeled 5 and 8 correspond to the H. (A) The K-means cluster centers in the (σ[ΔS3], σ[ΔS5], σ[ΔS7]) subspace labeled according to their cluster name. (B) The K-means cluster centers in the (σ[ΔS35], σ[ΔS49], Λ7) subspace labeled according to their cluster name.
The originality of the present work lies primarily in the fact that the application, the processing, and the service that supports all the functionalities have been integrated for the first time in a prototype system that has also reduced the convergence times, using real data for more than two hundred individuals, giving accurate results. In the future, and when larger studies have further validated the present e-health cloud-based system, then it can be integrated into a new commercial device.
4 Conclusion and future research trends
An innovative e-health cloud-based system that allows an estimation of SCD risk based on the method of natural time entropy was presented. This system is able to sample continuously the HRV of an individual by means of PPG. The users that have access only to their records by logging in with credentials, can view the NTA results via the web interface of the website developed. No personal information is stored on the server. Focusing on 10 min recordings, we presented various classifiers in NTA that allow the discrimination of CHF patients from the healthy controls. Although these results indicated a very good separation between the two groups, even from samples taken in a 10 min time window larger studies are needed to draw solid conclusions.
The restrictions along with future research trends follow: The robustness of PPG signals remains a challenging issue. It is known that even the slightest movement at the fingertip alters the PPG signal. For this reason, advanced processing techniques and algorithms must be developed for signal recovery. In addition, ergonomic design improvements for enhanced user comfort could significantly increase the system’s practicality and user adherence. One of the next research directions include receiving PPG signals from a different spot, such as the earlobe. In combination with all the above, the main scope of future research is the further reduction of convergence time in combination with accurate individuals’ classification.
Data availability statement
The raw data supporting the conclusion of this article will be made available by the authors, without undue reservation.
Author contributions
GT: Methodology, Software, Writing–original draft, Writing–review and editing. GB: Data curation, Writing–review and editing. VC: Methodology, Writing–review and editing. PK: Conceptualization, Project administration, Writing–review and editing. PV: Conceptualization, Methodology, Writing–review and editing. NS: Conceptualization, Methodology, Validation, Writing–original draft, Writing–review and editing. ES: Conceptualization, Methodology, Validation, Writing–review and editing. AB: Data curation, Methodology, Writing–review and editing. LM: Data curation, Methodology, Writing–review and editing. KN: Data curation, Methodology, Writing–review and editing.
Funding
The author(s) declare that no financial support was received for the research, authorship, and/or publication of this article. This research received no external funding.
Conflict of interest
The authors declare that the research was conducted in the absence of any commercial or financial relationships that could be construed as a potential conflict of interest.
Publisher’s note
All claims expressed in this article are solely those of the authors and do not necessarily represent those of their affiliated organizations, or those of the publisher, the editors and the reviewers. Any product that may be evaluated in this article, or claim that may be made by its manufacturer, is not guaranteed or endorsed by the publisher.
References
Allen, J. (2007). Photoplethysmography and its application in clinical physiological measurement. Physiol. Meas. 28, R1–R39. doi:10.1088/0967-3334/28/3/R01
Arora, R., Frisch, D. R., and Kadish, A. H. (2007). “Chapter 21 - the role of implantable cardioverter-defibrillators in primary and secondary prevention of sudden cardiac death,” in Cardiovascular therapeutics (3). Editors E. M. Antman, M. M. Givertz, M. E. Josephson, J. de Lemos, S. Oparil, and F. M. Sacks (Philadelphia: W.B. Saunders), 459–471. doi:10.1016/B978-1-4160-3358-5.50027-9
Bigger, J., Thomas, J., Fleiss, J. L., Steinman, R. C., Rolnitzky, L. M., Schneider, W. J., et al. (1995). RR variability in healthy, middle-aged persons compared with patients with chronic coronary heart disease or recent acute myocardial infarction. Circulation 91, 1936–1943. doi:10.1161/01.cir.91.7.1936
Costa, M., Goldberger, A. L., and Peng, C.-K. (2002). Multiscale entropy analysis of complex physiologic time series. Phys. Rev. Lett. 89, 068102. doi:10.1103/physrevlett.89.068102
Costa, M., Goldberger, A. L., and Peng, C.-K. (2005). Broken asymmetry of the human heartbeat: loss of time irreversibility in aging and disease. Phys. Rev. Lett. 95, 198102. doi:10.1103/physrevlett.95.198102
Elgendi, M. (2012). On the analysis of fingertip photoplethysmogram signals. IEEE Eng. Med. Biol. Mag. 8, 14–25. doi:10.2174/157340312801215782
Hartigan, J. A., and Wong, M. A. (1979). Algorithm as 136: a k-means clustering algorithm. J. R. Stat. Soc. Ser. C Appl. Statistics) 28, 100–108. doi:10.2307/2346830
Hertzman, A. B. (1938). The blood supply of various skin areas as estimated by the photoelectric plethysmograph. Am. J. Physiology-Legacy Content 124, 328–340. doi:10.1152/ajplegacy.1938.124.2.328
Jayadevappa, B. M., and Holi, M. S. (2016). Photoplethysmography: design, development, analysis and applications in clinical and physiological measurement – a review. Int. J. Innovative Res. Sci. Eng. Technol. 5, 3519–3531.
Kuhn, M., and Quinlan, R. (2023). C50: C5.0 decision trees and rule-based models. R package version 0.1.8.
Malpas, S. C. (2002). Neural influences on cardiovascular variability: possibilities and pitfalls. Am. J. Physiol. Heart. Circ. Physiol. 282, H6–H20. H6–20. doi:10.1152/ajpheart.2002.282.1.h6
Milan, M., and Perman, S. M. (2016). Out of hospital cardiac arrest: a current review of the literature that informed the 2015 American heart association guidelines update. Curr. Emerg. Hosp. Med. Rep. 4, 164–171. doi:10.1007/s40138-016-0118-x
Moraes, J., Rocha, M., Vasconcelos, G., Vasconcelos Filho, J., de Albuquerque, V., and Alexandria, A. (2018). Advances in photopletysmography signal analysis for biomedical applications. Sensors 18, 1894. doi:10.3390/s18061894
Park, J., Seok, H., Kim, S.-S., and Shin, H. (2022). Photoplethysmogram analysis and applications: an integrative review. Front. Physiology 12, 808451. doi:10.3389/fphys.2021.808451
Park, S., and Jayaraman, S. (2003). Enhancing the quality of life through wearable technology. IEEE Eng. Med. Biol. Mag. 22, 41–48. doi:10.1109/MEMB.2003.1213625
Prokhorov, M. D., Ponomarenko, V. I., Gridnev, V. I., Bodrov, M. B., and Bespyatov, A. B. (2003). Synchronization between main rhythmic processes in the human cardiovascular system. Phys. Rev. E 68, 041913. doi:10.1103/physreve.68.041913
R Core Team (2013). R: a language and environment for statistical computing. Vienna, Austria: R Foundation for Statistical Computing.
Revelle, W. (2023). Psych: procedures for psychological, psychometric, and personality research. Evanston, Illinois: Northwestern University. R package version 2.3.6.
Tamura, T., Maeda, Y., Sekine, M., and Yoshida, M. (2014). Wearable photoplethysmographic sensors—past and present. Electronics 3, 282–302. doi:10.3390/electronics3020282
Taskforce ESC/NASPE (1996). Heart rate variability: standards of measurement, physiological interpretation, and clinical use. Circulation 93, 1043–1065. doi:10.1161/01.cir.93.5.1043
Varotsos, P. A., Sarlis, N. V., and Skordas, E. S. (2011). “Natural Time Analysis: the new view of time,” in Precursory seismic electric signals, earthquakes and other complex time-series (Berlin Heidelberg: Springer-Verlag). doi:10.1007/978-3-642-16449-1
Varotsos, P. A., Sarlis, N. V., and Skordas, E. S. (2023). “Natural Time Analysis: the new view of time, Part II,” in Advances in disaster prediction using complex systems (Cham: Springer Nature Switzerland AG). doi:10.1007/978-3-031-26006-3
Varotsos, P. A., Sarlis, N. V., Skordas, E. S., and Lazaridou, M. S. (2004). Entropy in the natural time domain. Phys. Rev. E 70, 011106. doi:10.1103/physreve.70.011106
Keywords: natural time analysis, electrocardiography, photoplethysmography, chronic heart failure, sudden cardiac death
Citation: Tatsis G, Baldoumas G, Christofilakis V, Kostarakis P, Varotsos PA, Sarlis NV, Skordas ES, Bechlioulis A, Michalis LK and Naka KK (2023) A new e-health cloud-based system for cardiovascular risk assessment. Front. Electron. 4:1315132. doi: 10.3389/felec.2023.1315132
Received: 10 October 2023; Accepted: 13 December 2023;
Published: 22 December 2023.
Edited by:
Longhui Zeng, Hong Kong Polytechnic University, Hong Kong SAR, ChinaReviewed by:
Yunrui Jiang, University of California, San Diego, United StatesZhaoyu Lai, University of California, San Diego, United States
Jiajia Wu, University of California, San Diego, United States
Copyright © 2023 Tatsis, Baldoumas, Christofilakis, Kostarakis, Varotsos, Sarlis, Skordas, Bechlioulis, Michalis and Naka. This is an open-access article distributed under the terms of the Creative Commons Attribution License (CC BY). The use, distribution or reproduction in other forums is permitted, provided the original author(s) and the copyright owner(s) are credited and that the original publication in this journal is cited, in accordance with accepted academic practice. No use, distribution or reproduction is permitted which does not comply with these terms.
*Correspondence: V. Christofilakis, dmFjaHJpc3RAdW9pLmdy