 Petter I. Larsson
 Anneli Ekblom
 Kristin Ilves
- 1Department of Cultures, University of Helsinki, Helsinki, Finland
- 2Department of Archaeology, Ancient History and Conservation, Uppsala University, Uppsala, Sweden
This study was undertaken to address the question on anthropogenic landscape modification and how to use such signals within palynology. Pollen, spores, and microscopic charcoal from Lake Dalsträsk in the northern Åland Islands are analyzed, covering the period from 741 BCE (Late Bronze Age) to the early twentieth century. Percentage and influx data are compared as a means of disentangling different land use practices. The results of the palynological analysis are further explored through correlation analysis of influx data and Relative Pollen Productivity (RPP) values. Our findings confirm the presence of modest cereal cultivation and grazing activities from the beginning of the Late Bronze Age a hypothesis that has previously been debated. The study also shows variations in land use after the Bronze Age, with an increase in farming from around 398 CE (Migration Period) and an intensification of grazing activities around 823 CE (Viking Age). Our study shows how land use practices have shifted over the centuries and how these shifts have modified taxa composition. Commonly used 'anthropogenic indicator' pollen taxa show weak or indirect correlations with cereal cultivation and grazing, while some taxa display positive correlations. Our results point to the need to refine the use of anthropogenic taxa in a local context to better elucidate small-scale land use.
1 Introduction
Small-scale and low-intensity agricultural practices, such as grazing, are easily missed in the palynological record due to the lack of ecological proxies or the very small signatures such practices leave behind (e.g., Wehlin et al., 2023). As a result, landscape histories of regions deemed unfavorable for agrarian activities have remained largely unexplored in terms of early and small-scale farming. Palynological studies from the boreal forests of Scandinavia have demonstrated that even early and small-scale agrarian activities contributed significantly to landscape modification (Svensson, 1998; Emanuelsson et al., 2003; Eddudóttir et al., 2021). These findings indicate that agrarian practices were more widespread and varied than previously assumed, underscoring the importance of studying small-scale farming also in other northern environments, including the Åland Islands.
The primary method for tracing past agricultural activities relies on the use of “anthropogenic indicators”—heliophilous ruderal species and other taxa favored by human land use (cf. Iversen, 1941: p. 39–43). Such indicator taxa are routinely used to infer anthropogenic impacts (e.g., Behre, 1981; Bottema et al., 2004) and have been calibrated against modern pollen assemblages (Gaillard et al., 1992; Hjelle, 1999). These taxa are also incorporated into the “open land” category of the “Regional Estimates of Vegetation Abundance from Large Sites” (REVEALS) model (Sugita, 2007b; Githumbi et al., 2022). However, pollen productivity and dispersal of species vary according to landscape characteristics and degree of openness (Broström et al., 2005, 2008; Hellman et al., 2008; Mazier et al., 2015). In addition, Relative Pollen Productivity (RPP) differs across regions (Wieczorek and Herzschuh, 2020; Githumbi et al., 2022; Wan et al., 2023). Here we assess “anthropogenic” pollen indicators against cereal pollen and coprophilous spores using the RPP estimates of the Northern Hemisphere published by Wieczorek and Herzschuh (2020).
In this study, we assess the correlation between anthropogenic indicator taxa and evidence of cereal cultivation and grazing practices in sediment core data from Lake Dalsträsk, located in the northern parts of the Åland Islands. Land use shifts from the Late Bronze Age to the present are analyzed by examining tree and shrub pollen, “open land” indicators, cereal pollen, and charcoal. Additionally, coprophilous fungi spores—rarely included as proxies in pollen studies of the Nordic countries—are incorporated, using percentage and influx data. Furthermore, potential anthropogenic indicators are assessed statistically, based on influxes and recalibrated RPP estimates (Broström et al., 2008; Wieczorek and Herzschuh, 2020; Githumbi et al., 2022).
2 Background
The Åland Islands, in the Baltic Sea, are a group of islands that are largely characterized by rocky terrain. The characteristics of the terrain have historically caused the population on these islands to face a shortage of arable land suitable for farming (Jaatinen et al., 1989). Consequently, prehistoric and historic subsistence strategies on Åland are believed to have relied heavily on maritime resources (e.g., Storå, 2002; Storå and Lõugas, 2005). Nonetheless, some evidence of small-scale agrarian practices has been identified. Osteological material not only evidences the utilization of maritime and coastal resources, but also domesticated animals (e.g., Forsten, 1974; Storå, 2000). Animal husbandry seems to have been centered mainly around sheep (Ovis aries), although other taxa are also present. There is also evidence for small-scale cereal cultivation in the archaeobotanical record (e.g., Vanhanen et al., 2019; Larsson et al., 2023). According to palynological investigations, cereal cultivation has focused on barley (Hordeum spp.) and rye (Secale cereale). A debate remains about when such farming practices began on the Åland Islands.
Large parts of the Åland Islands remained submerged until the end of the 6th millennium BCE, when hunter-gatherer groups and fishers associated with the Comb Ceramic Culture began visiting the islands (Stenbäck, 2003; Vanhanen et al., 2019). Later Neolithic communities (3300–1500 BCE, Table 1) primarily relied on seal hunting (Storå, 2000, 2002). Only a few examples of cereal grains dating back to the Neolithic period have been identified on Åland so far (Vanhanen et al., 2019). The combination of domestic animals and cereal grains from the Bronze Age (1500–500 BCE, Table 1) (e.g., Forsten, 1974; Vanhanen et al., 2019) has been interpreted as small-scale experimentation with farming. Palynological investigations are few, but those available suggest that agrarian land use during the Early Iron Age (500 BCE−550 CE, Table 1) remained small-scale, with low frequencies of cereal pollen and other “anthropogenic” indicators recorded in pollen signals (Larsson et al., 2023). It is only in the Late Iron Age (550–1050 CE, Table 1) that evidence of increasing agrarian land use appears, marked by a higher density of archaeological sites, an increase in cereal pollen, and open-land indicators that are linked to population growth (Larsson et al., 2023). An agrarian expansion is also suggested during the medieval period (1050–1520 CE, Table 1) (Alenius et al., 2022; Larsson et al., 2023).
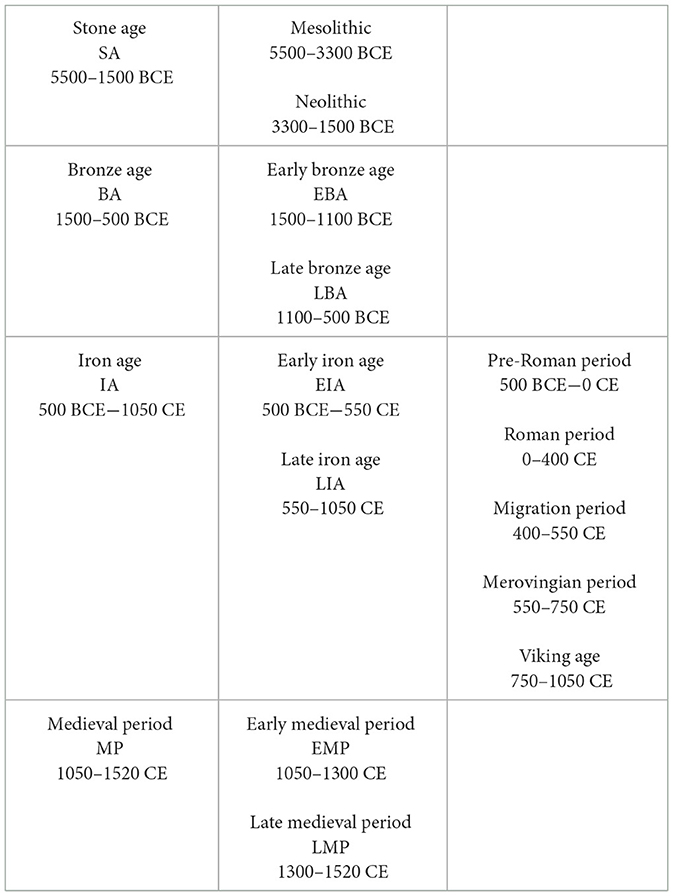
Table 1. Ålandic time periods, including pre-historic, phases and sub-periods as well as the medieval periods with dates and abbreviations provided.
2.1 Study area
Lake Dalsträsk (Reference system: ERTS-TM35FIN, coordinates: N = 5709389.754, E = 113952.236), from which the pollen core was retrieved, is located in the northern parts of the main Åland Islands (Figure 1). The lake lies at 17.7 m a.s.l., in hilly terrain that ranges between c. 0–66 m a.s.l. (Figure 1).
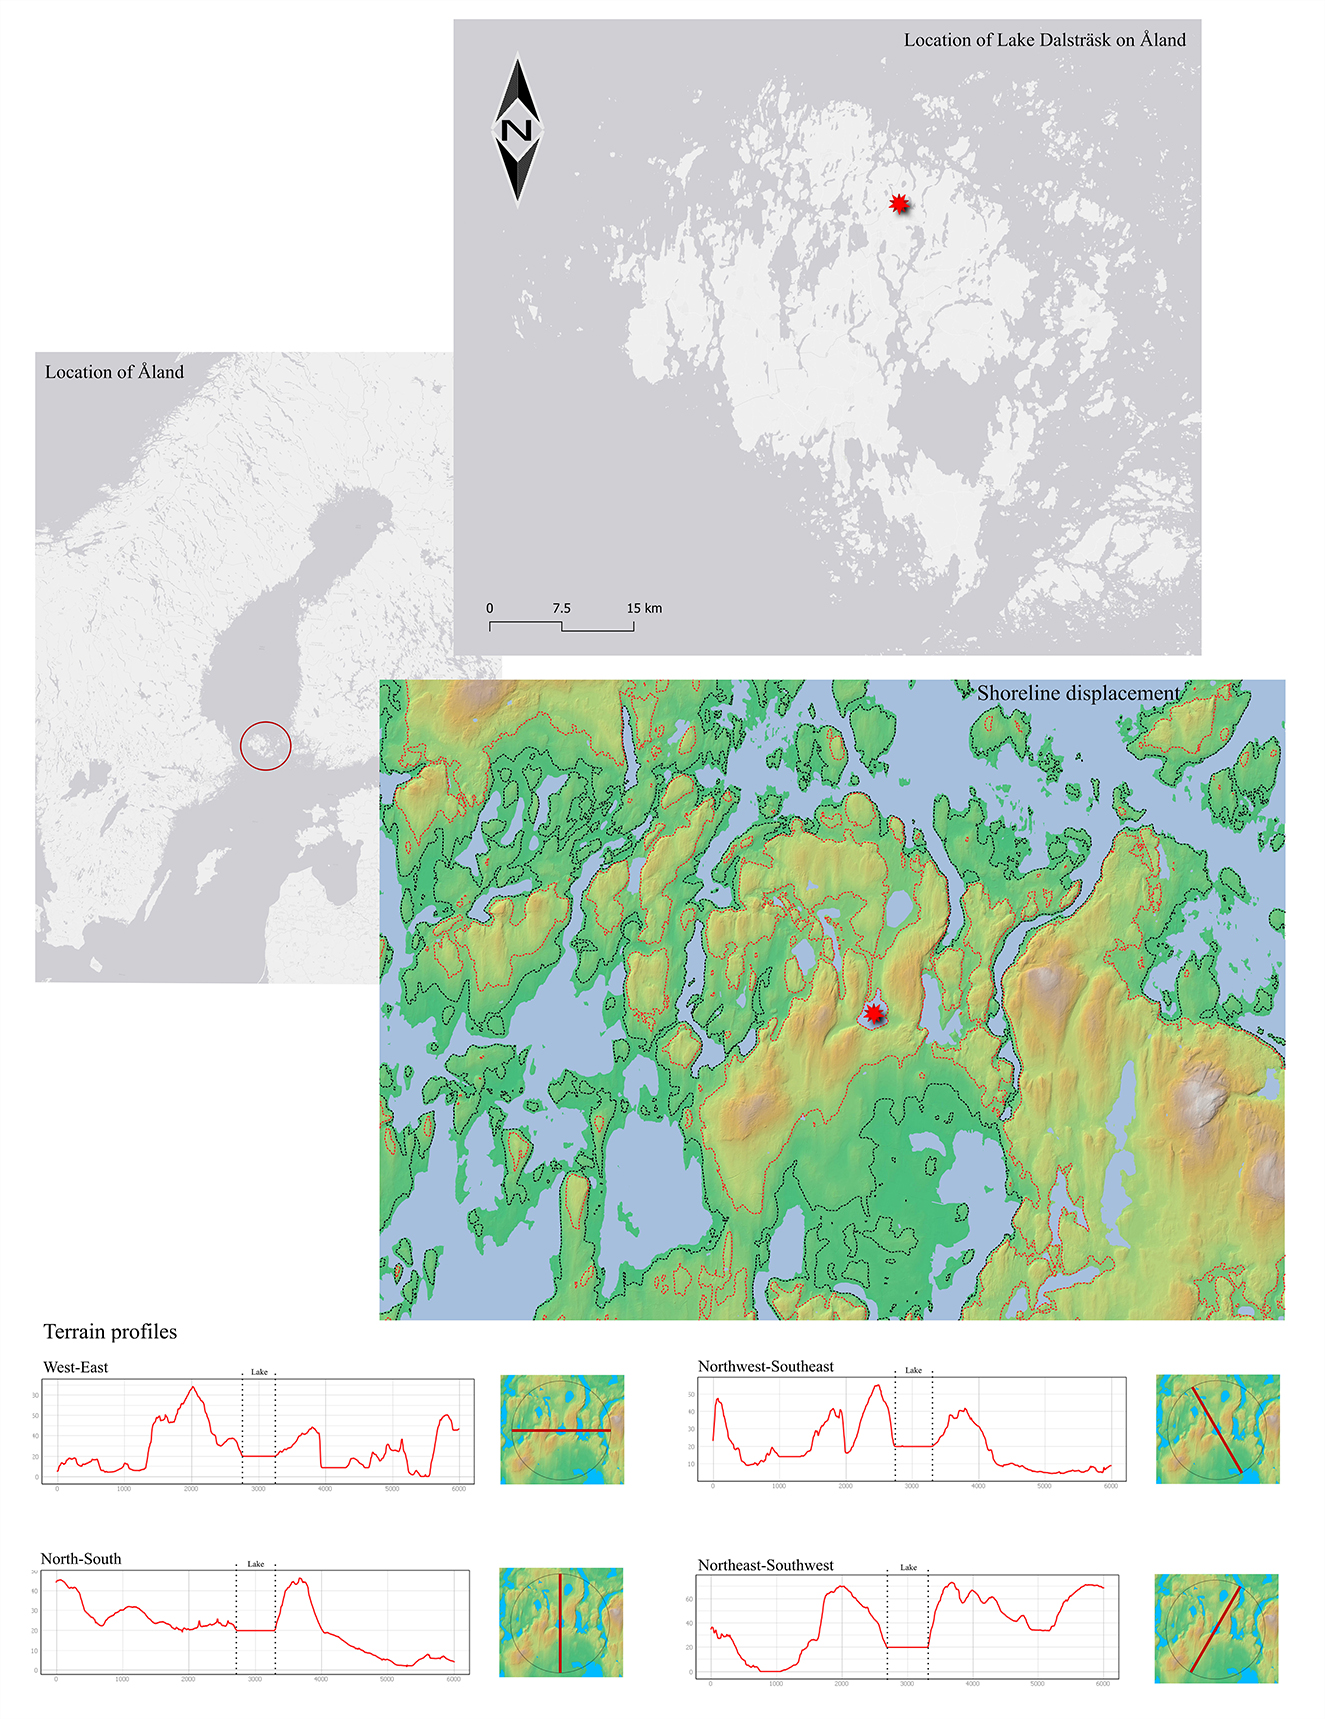
Figure 1. Maps displaying the location of the Åland Islands and the location of Lake Dalsträsk (i.e., gray maps); map data: ©ESRI. The colorized map shows the approximate shoreline displacement in prehistoric times; map data: ©MAANMITTAUSLAITOS (Maanmittauslaitos, 2023): the red dotted line represents a 20-meter higher shoreline compared to today, representing approximately the Bronze Age, the black dotted line represents the shoreline placement at the end of the Late Iron Age, ~5 meters higher than today. In the bottom part of the image, terrain profiles of a 6 km buffer diameter (3 km radius from the center of the lake) are displayed. Maps created in QGIS (3.22.14).
During the Bronze Age, the shoreline was more than 20 meters above its current level, and the availability of land suitable for cultivation was quite limited. By the end of the Late Iron Age, the shoreline had receded to ~5 meters above the present position (Figure 1; see Ekman, 2017 for calculations on historic shoreline levels). Archaeological evidence of human activity in the immediate vicinity of Lake Dalsträsk is scarce. A Neolithic/Bronze Age dwelling area and burial ground have been recorded on the steep rocky hill west of the lake (Nunez, 1990). Given the limited availability of farmland and the absence of settlement evidence, a low level of anthropogenic land use is hypothesized for the Lake Dalsträsk area.
Lake Dalsträsk is a small lake, measuring 460 meters in width (W-E) and 765 meters in length (S-N). Its hydrological source area is well-defined by the surrounding hilly topography (Figure 1). As a result, the pollen record should largely reflect an extra-local signal, with some regional influence (Jacobson and Bradshaw, 1981; Sugita, 2007a,b). However, the hilly terrain around Lake Dalsträsk leads to significant surface run-off into the lake, which enhances the local pollen signal. Spores are predominantly transported via surface run-off and may therefore reflect a localized signal (Lee et al., 2022).
3 Methods
3.1 Chronology and stratigraphy
A 2.24-meter-long core was retrieved with a piston corer in 2020, from the central parts of the lake (at a depth of 5 meters). The sediment consists of dark, homogeneous and structureless, coarse detritus gyttja. The total organic content of the sediment was measured through loss on ignition (LOI). Magnetic susceptibility was measured following standard procedures (Bengtsson and Enell, 1986).
Five radiocarbon (14C) dates (Table 2) from bulk sediment samples were dated, calibrated (Reimer et al., 2020), and used together with the year of sampling to generate an Age-Depth model. The Bacon package in R was used to produce a Bayesian Age-Depth model (Blaauw and Christen, 2011), where the prior of the model was set to 10 yr/cm.
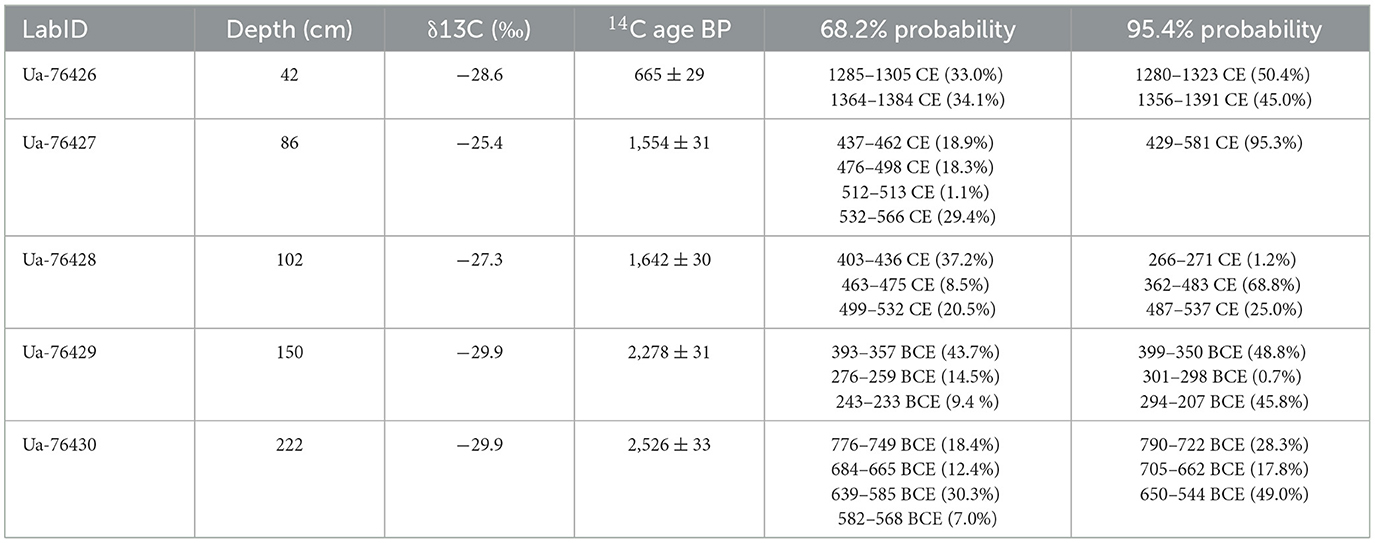
Table 2. Radiocarbon dating results of the five bulk samples out of the core Lake Dalsträsk.
3.2 Palynology
Potassium hydroxide (KOH) was used to remove organic material and hydrofluoric acid (HF) to remove mineral material. A known amount of Lycopodium spores was added to the samples to calculate pollen concentration and influx (Faegri et al., 1989: p. 84). The samples were mounted onto slides (25.4 × 76.2 mm, with a thickness of 1–1.2 mm, Cat. No. 7101S), with cover glasses (22 × 22 mm, thickness No.1, Cat. No. 641-0124). A total of 55 levels were counted using a light microscope at ×200– ×1000 magnification, with a minimum of 500 terrestrial pollen grains counted for each level.
Spores and microscopic charcoal particles were counted alongside the pollen. The microscopic charcoal particles have been classified into two categories, small charcoal (<50 μm) and large charcoal (≧50 μm). The larger particles are likely to originate from a more local area, while the smaller particles may be of a regional origin (cf. Clark, 1988; Segerström et al., 2008). Pollen was identified using the key presented by Moore et al. (1991), except for cereal grains—where the key of Faegri et al. (1989) was used. Spores were identified and analyzed based on published papers as well as the Non-Pollen Palynomorph Image Database (Van Geel, 1978; Aptroot and Van Geel, 2006; Van Geel et al., 2007; Cugny et al., 2010; Shumilovskikh et al., 2022, 2023). Cannabaceae pollen grains were separated by size, grains ≦25 μm are classified as Humulus, while grains ≧30 μm are classified as Cannabis. Types that fall in-between these size categories have been grouped as Cannabis/Humulus-t. Due to morphological similarities, pollen grains of Corylus and Myrica have been merged into a Corylus/Myrica group.
The pollen diagram is expressed in percentages, based on the terrestrial pollen sum (P). Spores, charcoal particles, and aquatics have been calculated into percentages by adding the sum of the respective group to the pollen sum (e.g., P + sum of charcoal). The most common taxa and taxa often used as anthropogenic indicators have also been presented with influx values. The influx values allow for assessment of the relative changes as suggested by the percentages. The pollen diagrams have been constructed in R (Version 4.3.2; R Core Team., 2022), using the riojaPlot package (Juggins, 2023). Zonation was carried out using cluster analysis based on pollen percentages of terrestrial taxa and the results are presented by pollen assemblage zones (PAZ).
3.3 Statistical analyses
A non-metric multidimensional scaling (NMDS) was carried out, followed by correlation analyses.
First, the NMDS was applied to the percentage values of the data. This was done in R, using the metaMDS function in the vegan package (Oksanen et al., 2022). The Bray-Curtis dissimilarity index (Bray and Curtis, 1957) was applied, and the results were plotted in two dimensions where the taxa were color-coded using the ggplot2 package (Wickham, 2016).
In the NMDS, the taxa identified in the palynological analysis was included. The taxa have been categorized following the classification used in the pollen percentage diagram (Table 3). To avoid cluttering, aquatic taxa were excluded from the analyses as were most spores except for coprophilous spores, Equisetaceae, and Pteridium aquilinum, which were included. The stress value of the NMDS was 0.196066, thus falling below the critical significance value of 0.2 (cf. Clarke, 1993).
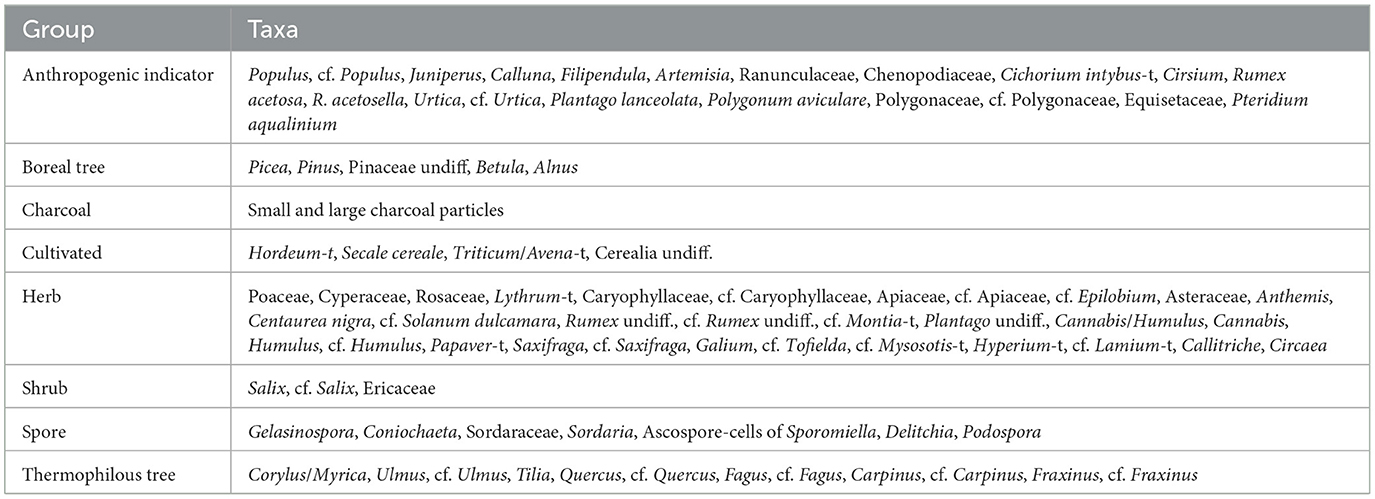
Table 3. Table of the taxa included and their grouping in the NMDS.
Since the majority of the taxa of interest here have poor pollen dispersal (Table 4), the pollen sum was recalculated, based on all herb taxa, along with the taxa included in the analyses. The influx of each taxon was divided by the RPP values of the northern hemisphere published by Wieczorek and Herzschuh (2020). Since no RPP values are available for Pteridium aquilinum and Polygonum aviculvare, these taxa had to be excluded from the correlation analysis.
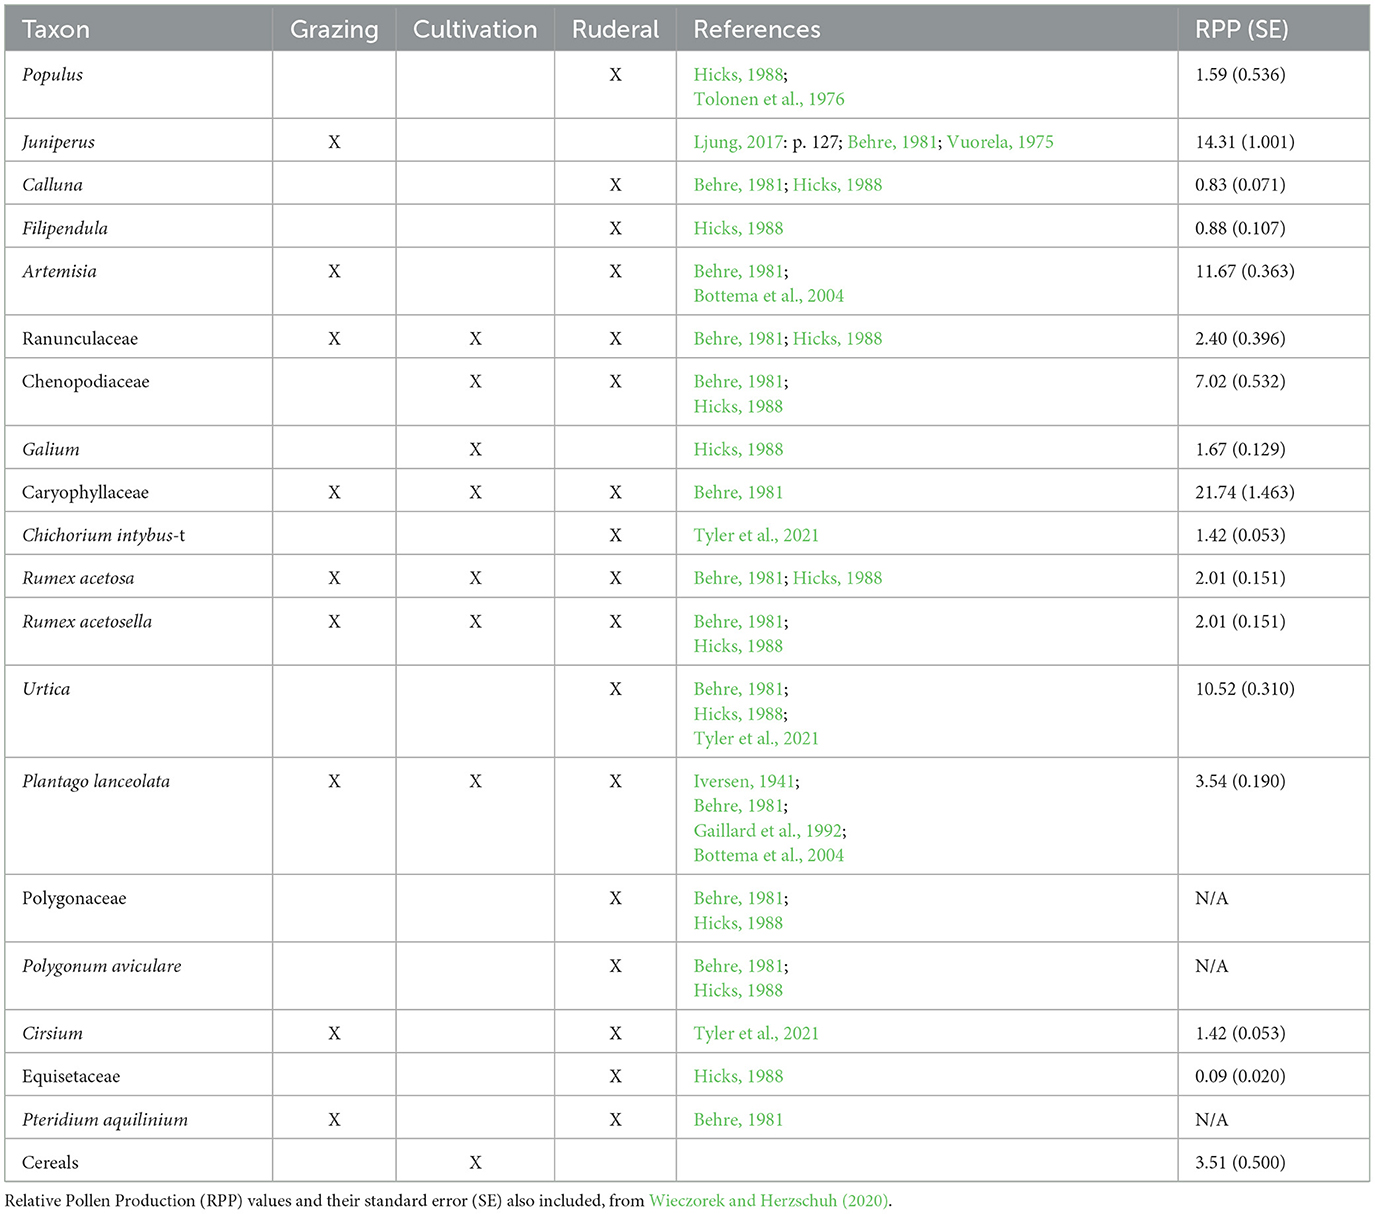
Table 4. Taxon included in the correlation analysis with markers of earlier interpretation regarding type of land use and selected references to where such use can be found.
A Shapiro–Wilk test of normality (implemented in R) was applied (Supplementary Table 1). This confirmed that the pollen data do not follow a normal distribution; as such, the Spearman correlation model was used for the correlation analysis (cf. Hauke and Kossowski, 2011). The correlation analysis was carried out in R, using the Hmisc package (Harrell, 2024).
In the correlation analysis cereal types (a grouping of Hordeum-t, Secale cereale, Avena/Triticum-t, and Cerealia undiff.) were used as a variable to investigate correlation between cereal cultivation and anthropogenic indicator taxa. Cannabis and Humulus were excluded as they are dioecious and the tracing of these in palynology is uncertain (Grönlund et al., 1986; Skoglund, 2021). Poaceae and Cyperaceae have also been excluded alongside charcoal. The taxa included in the analyses are those which are identified as “anthropogenic” in the literature (see reference in Table 4) and consists mainly of herbs. For testing vegetational response to grazing practices, we have grouped taxa of coprophilous spores (Table 5). Coprophilous spores have proven valuable for tracing grazing practices via palynology, although somewhat more challenging to interpret in areas where wild grazers may provide similar signals. However, on Åland, careful reviews of the osteological material (e.g., Forsten, 1974; Storå, 2000, 2012), gathered from archaeological excavations, have yielded no evidence for wild grazers beyond hare (Lepus), and as such it is highly likely that coprophilous occurrences in prehistoric periods represent the presence of domesticated animals. The fungi-types included are mostly strictly coprophilous and typically associated as indicative of grazing practices (Table 5). Gelasinospora is a fungus that is partly coprophilous, but which is also carbonicolous (i.e., grows on burnt material) and lignicolous (i.e., growing on wood and trees; Van Geel, 1978). The other exception is Coniochaeta, which besides being coprophilous (Cugny et al., 2010; Leal et al., 2021; Lee et al., 2022), also grows on dying wood (Van Geel, 1978).
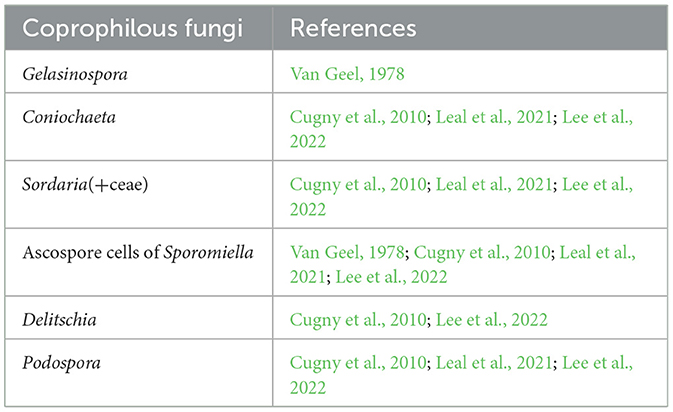
Table 5. Coprophilous spores included in the analyze to test for correlation to grazing practices with references where these ecological traits can be found.
We have interpreted the level of significance as a value of 0.3 (also including negative correlation values of −0.3). Values of 0.3 are interpreted as weak but still indicatively correlated. Correlation values of 0.4 and 0.5 are interpreted as significant. Additionally, p-values of the correlation matrix were obtained through the Hmisc package in R (Harrell, 2024). P-values below 0.05 are highlighted in Tables 6, 7. P-values above the critical limit of 0.05 do not necessarily have to be rejected (cf. Betensky, 2019). However, in this case the taxa with significant correlation coefficient values also have a p-value below 0.05.
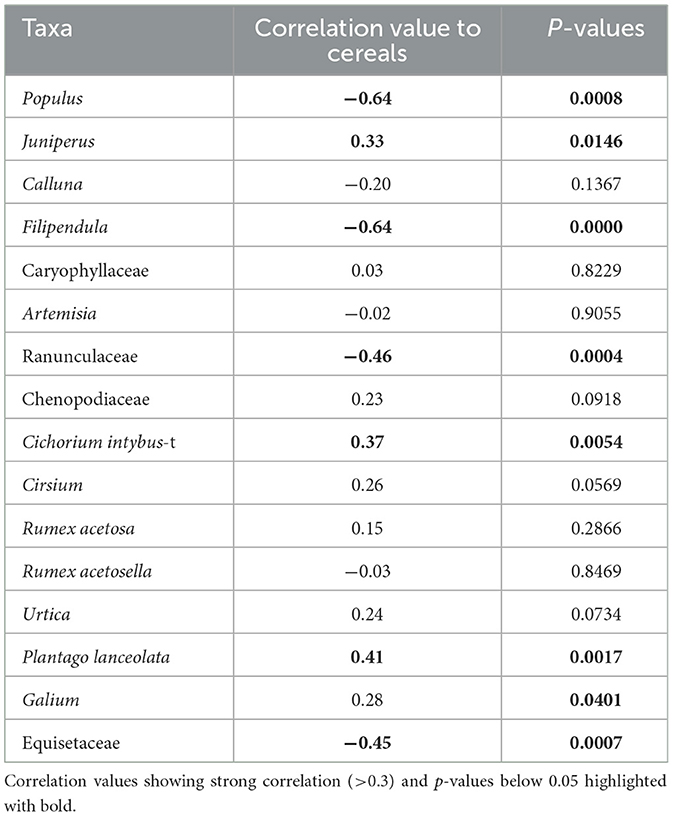
Table 6. Results of correlation analysis, visualizing correlation coefficient values between taxa and cereals and p-values of the correlation matrix.
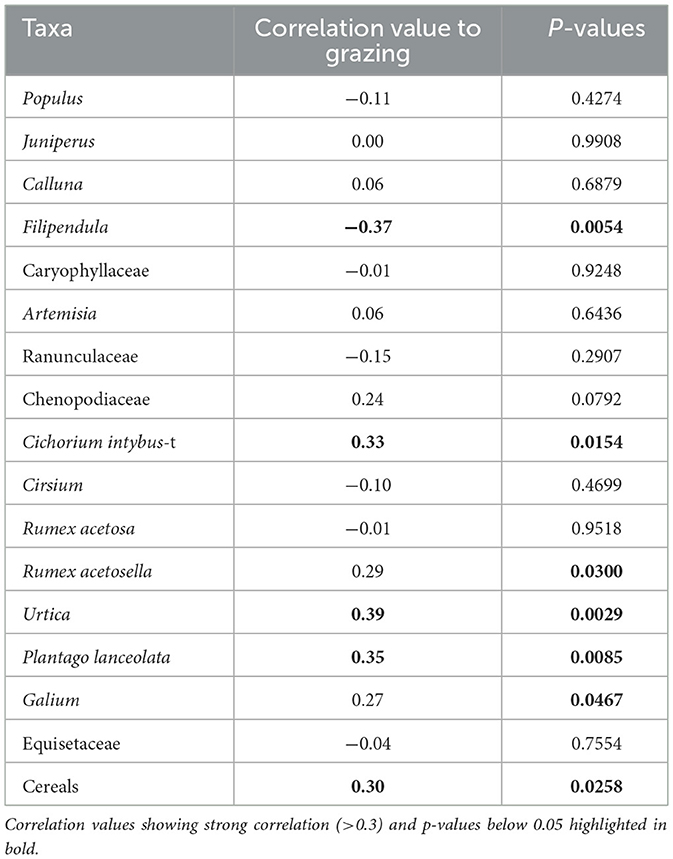
Table 7. Results of correlation analysis, visualizing correlation coefficient values between taxa and coprophilous spores (indicating grazing) and p-values of the correlation matrix.
4 Results and interpretation
4.1 Chronology and stratigraphy
The Age-Depth Model suggests continuous sedimentation from c. 741 BCE until the year the core was collected (2020 CE, Figure 2). Sediment accumulation was calculated based on the Age-Depth Model.
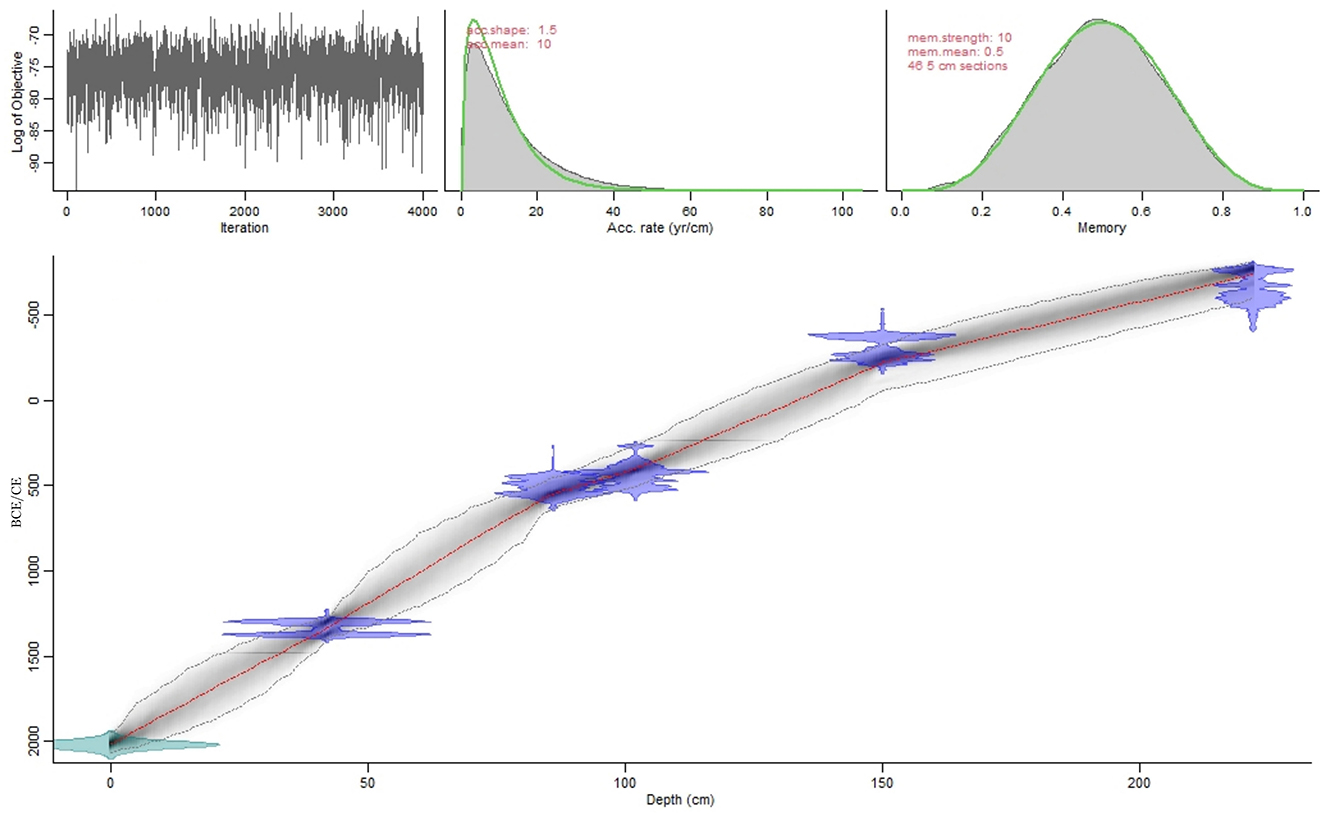
Figure 2. Age-Depth Model based on five 14C dates combined with the year of the retrieving of the core (2020 CE).
The total organic content in the LOI values falls within the range of 30–50% throughout most of the core (Figure 3). The lowest LOI is found in the oldest parts of the core (PAZ 1) and in the uppermost part (PAZ 5). The highest values are reached in the transition between PAZ 2 and PAZ 3. The magnetic susceptibility lies between −5 and −15 (10−6) throughout the core, with a reversed pattern of variation relative to the LOI as would be expected (Figure 3).
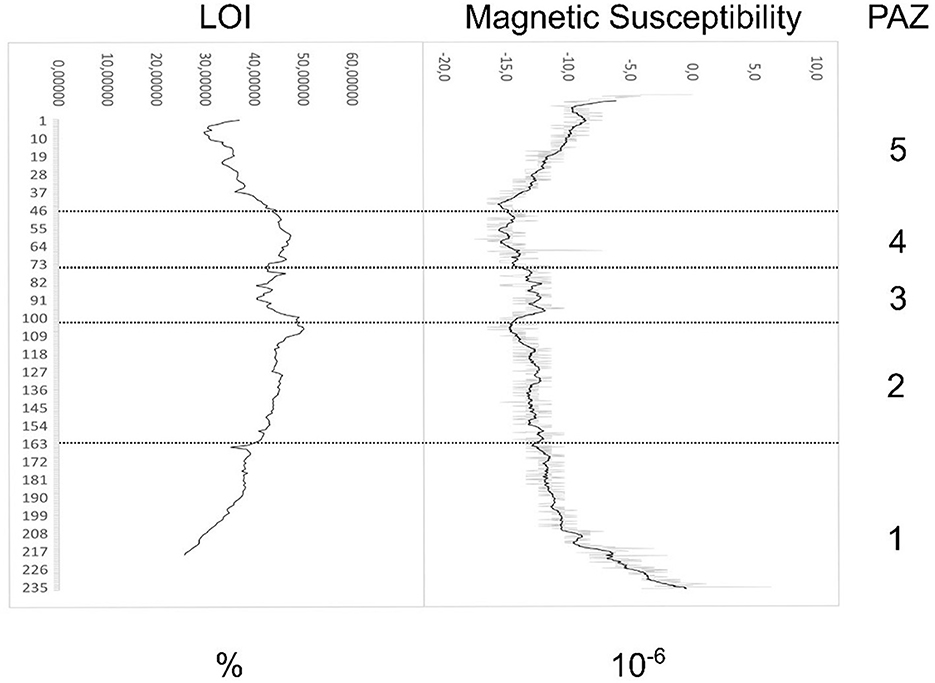
Figure 3. Diagram displaying loss on ignition and magnetic susceptibility measurements.
4.2 Palynology
4.2.1 PAZ 1 (222–162 cm, c. 741–307 BCE)
PAZ 1 is heavily dominated by forest taxa (Figure 4), with Pinus, Betula, and Alnus. Herb taxa are also present in low amounts (including Filipendula, Rosaceae, Artemisia, Apiaceae, Asteraceae, Caryophyllaceae, cf. Epilobium, Rumex acetosa, Rumex acetosella, Urtica, and Plantago spp.) (Figure 4). Humulus and Cannabis/Humulus occur occasionally. Cerealia, Hordeum-t, occurs at two levels (218 and 206 cm). The spores are dominated by Equisetaceae, Pteropsida monolete, and Sphagnum. Coprophilous spores occur sporadically <1% (Coniochaeta at 210–206 and 194 cm, Sordariaceae at 178 cm, and Gelasinospora at 162 cm). Charcoal fragments fluctuate throughout the zone. Small charcoal particles (<50 μm) vacillate mostly between 30 and 40%, peaking at 218–214 cm, while large charcoal particles (≧50 μm) are only found in small quantities (<1%).
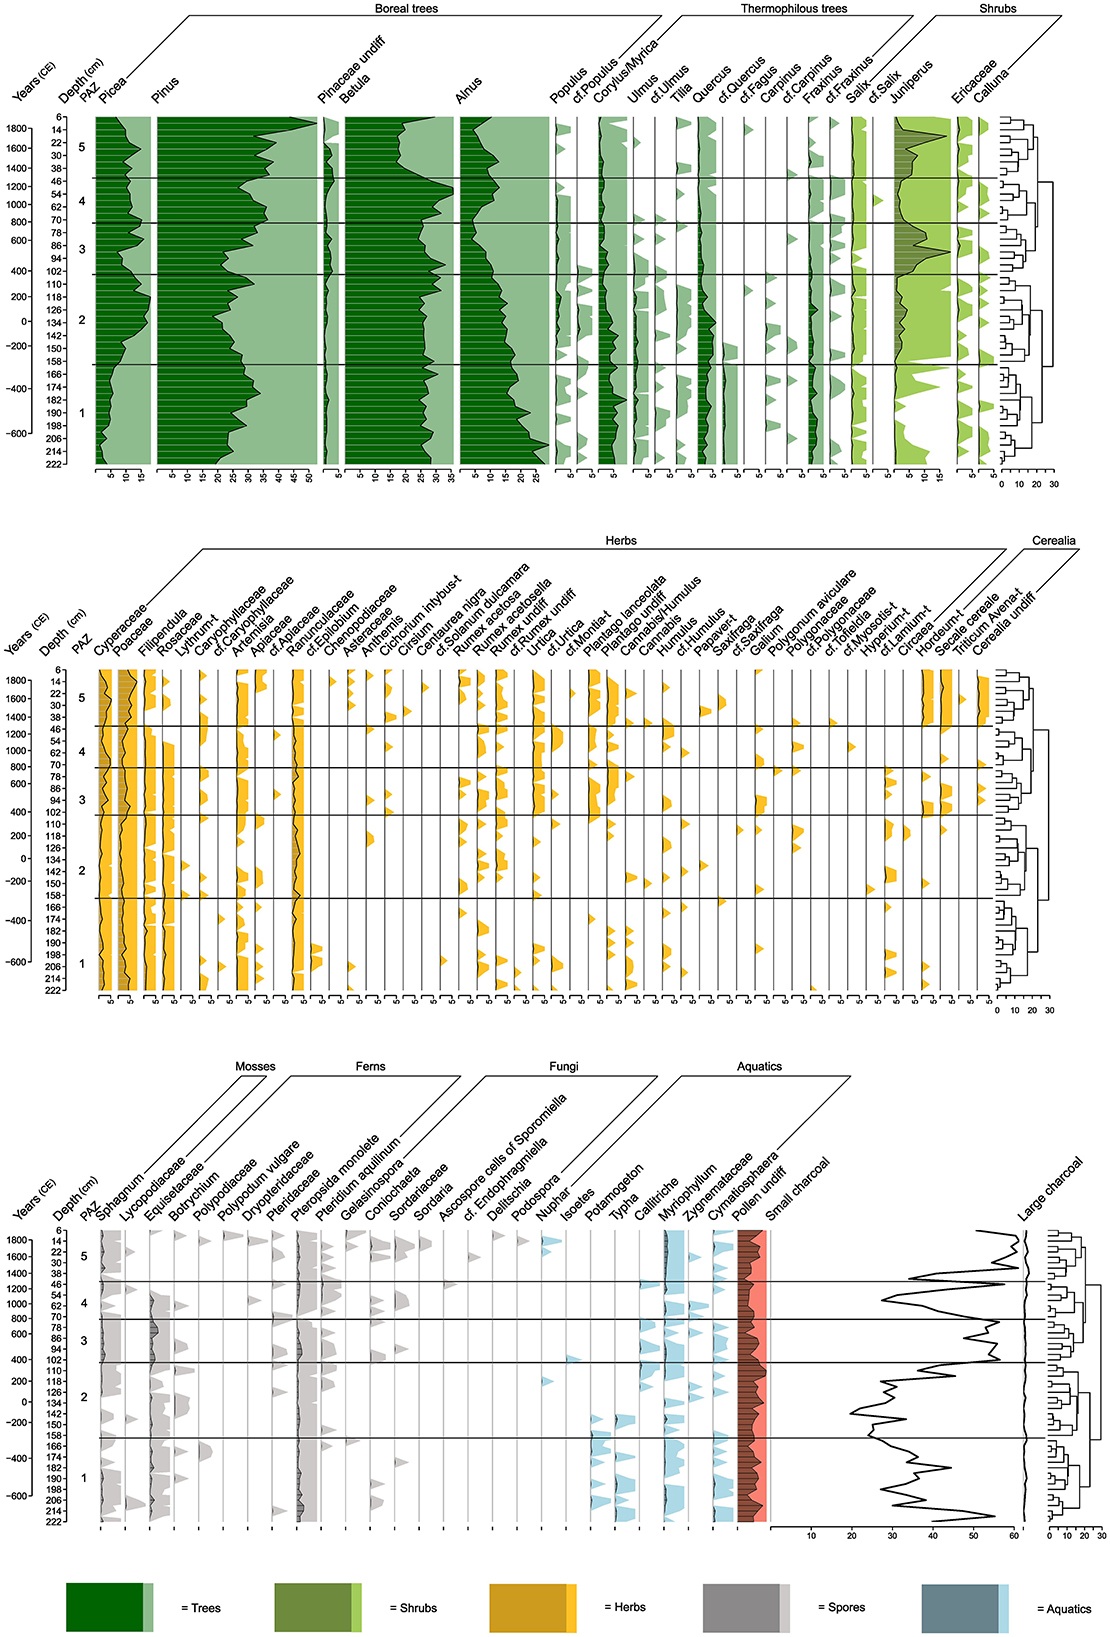
Figure 4. Pollen, spore and charcoal percentage diagram. The vertical axes show calibrated years (BCE/CE) and depth (cm). Dark colored silhouettes demonstrate the percentages of each taxon with exaggeration of percentages (×20) in light colors. Tree diagram from zonation included.
4.2.2 PAZ 2 (158–106 cm, c. 279 BCE−352 CE)
Boreal trees are still dominant in PAZ 2 (Figure 4), but Picea (c. 8–18%) is established as a major taxon while there is a decline in Pinus (c. 20–30%). Populus (with values mostly <1%) and Juniperus (c. 1–3%) occur with higher percentages (Figure 4). Herbs are dominated by Cyperaceae, Poaceae, and Ranunculaceae with a low representation of other herb taxa. Hordeum-t is present at 150 cm and Secale cereale at 114 cm. Fern spores are present in the zone but there are no coprophilous spores. Small charcoal fragments first decrease, with the lowest value of 19.6% at 142 cm and then increase throughout the zone, with a peak of 45.5 at 114 cm, while large charcoal fragments remain at low levels (<1%).
4.2.3 PAZ 3 (102–74 cm, c. 398 CE−753 CE)
Percentages of all trees decline in this period (Figure 4), apart from Populus, which remains stable. There is an increase of Juniperus pollen (6–10 %, peaking at 18.7% at 90 cm). Cyperaceae, Poaceae, and Ranunculaceae are well-represented, together with Caryophyllaceae, Rosaceae, Filipendula, Artemisia, Urtica, Rumex undiff., R. acetosella, Plantago lanceolata, as well as Plantago undiff. Hordeum-t, Secale cereale and Cerealia undiff. occur in low numbers (<1%). Among the coprophilous spores Coniochaeta appears at 66 and 58 cm, Sordariaceae at 62–54 cm and Sporomiella at 46 cm. Small charcoal fragments increase to around 55%, while the amount of larger particles remains low (<1%).
4.2.4 PAZ 4 (70–46 cm, c. 823–1261 CE)
In PAZ 4, there is a decrease in both Picea (15–11%) and Pinus (36.5–29.5%). By contrast there is an increase in Betula (25–35%) and Alnus (up to 11%). Meanwhile, Populus, Ulmus, Quercus, and Fraxinus decrease toward the upper parts of the zone. Corylus/Myrica remains relatively stable (c. 1–2 %). Juniperus percentages are lower compared to the previous zone (c. 1–3%). Cyperaceae, Poaceae, and Ranunculaceae are still the dominant herb taxa. Other common herbs are Rosaceae, Filipendula, Caryophyllaceae, Artemisia, Urtica, P. lanceolata, R. acetosella (<1%). Overall, there is a reduction in Cerealia—now only occurring sporadically (<1%; Cerealia undiff. at 70 cm, Secale cereale at 66 and 46 cm). Coprophilous spores are still present (Coniochaeta at 66 and 58 cm, Sordariaceae at 62–54 cm, and Sporomiella at 46 cm). Small charcoal first declines sharply, reaching the lowest value of 27% at 58 cm depth, then increases in the younger parts of the zone, reaching 57 % at 46 cm. Larger charcoal particles remain low (<1%).
4.2.5 PAZ 5 (42–6 cm, c. 1332–1917 CE)
Percentages of trees in PAZ 5 are relatively stable throughout this zone until the uppermost part (Figure 4), where Pinus becomes very dominant (c. 44–52 %). In addition, Juniperus occurs in higher percentages from 6% peaking at 17% at 18 cm, after which percentages are low (c. 3–0.6%). Cyperaceae (mostly 2.5–5%) and Poaceae (mostly 3–5%) dominate the herb taxa, but Ranunculaceae, Filipendula, Artemisia, Rumex undiff., R. acetosa, R. acetosella, Urtica, Plantago undiff., and P. lanceolata are also frequent. Hordeum-t (<1%) and Secale cereale (0.3–1.44 %) increase and are present in all levels of the zone, with one occurrence of Avena/Triticum-t at 26 cm (<1%). Coprophilous spores are more frequent in this zone, with Coniochaeta (26, 18–14 cm), Gelasinospora (18, 10–6 cm), Sordariaceae (26–14 cm), Sordaria (18–14 cm), Delitschia (10 cm), and Podospora (14 cm). Small charcoal particles are common (34–61%), while larger charcoal particles are present at low levels (0.3–1.3%) (Figure 4).
4.3 Pollen influx
In PAZ 1 (741–307 BCE), the influx values of boreal forest taxa (Pinus, Picea, and Betula) are relatively low while broadleaf forest trees (Quercus, Fraxinus) are dominant alongside Alnus and Corylus/Myrica (Figure 5). In PAZ 2 (279 BCE−352 CE), the arboreal pollen (AP) increases but decreases again in the younger parts of the zone (Figure 5). In parallel, heliophilous taxa such as Populus and Juniperus increase (Figure 5). In PAZ 3 (398–753 CE), there are initially low values of all AP types, though Juniperus is well-represented. From 86 cm depth, the influx of boreal pollen and Juniperus increases significantly. In the uppermost part there is a parallel progressive increase in Poaceae and Cyperaceae (Figure 5). In PAZ 4 (823–1261 CE), the influx of boreal trees remains high together with Alnus and Salix, while Juniperus decreases markedly. The influx of Pteridium aquilinum is higher in the upper part of the zone and coprophilous spores are present continuously (Figure 5). In the upper zone, PAZ 5 (1332–1917 CE), the influx of boreal trees remains high together with Salix and an increase in Juniperus (both declining in the very top of the zone). Cereal influx is high and continuous throughout PAZ5. In the upper half of PAZ 5, coprophilous spores increase markedly (Figure 5).
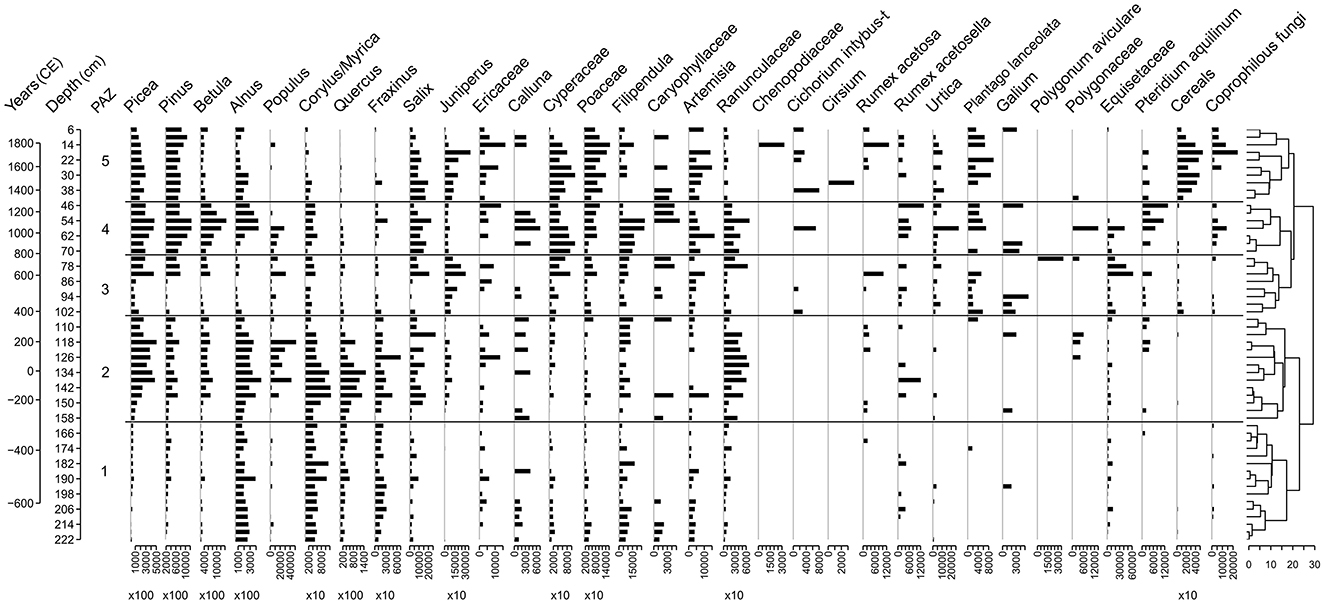
Figure 5. Pollen influx diagram of selected taxa, notice variances in x-axis scales.
4.4 Statistical analyses
The NMDS (Figure 6) shows that cultivated taxa (i.e., cereal pollen), charcoal, boreal trees, thermophilus trees, shrubs, and to some extent also coprophilous spores show some clustering tendencies. Herbs and the anthropogenic indicator taxa are more dispersed.
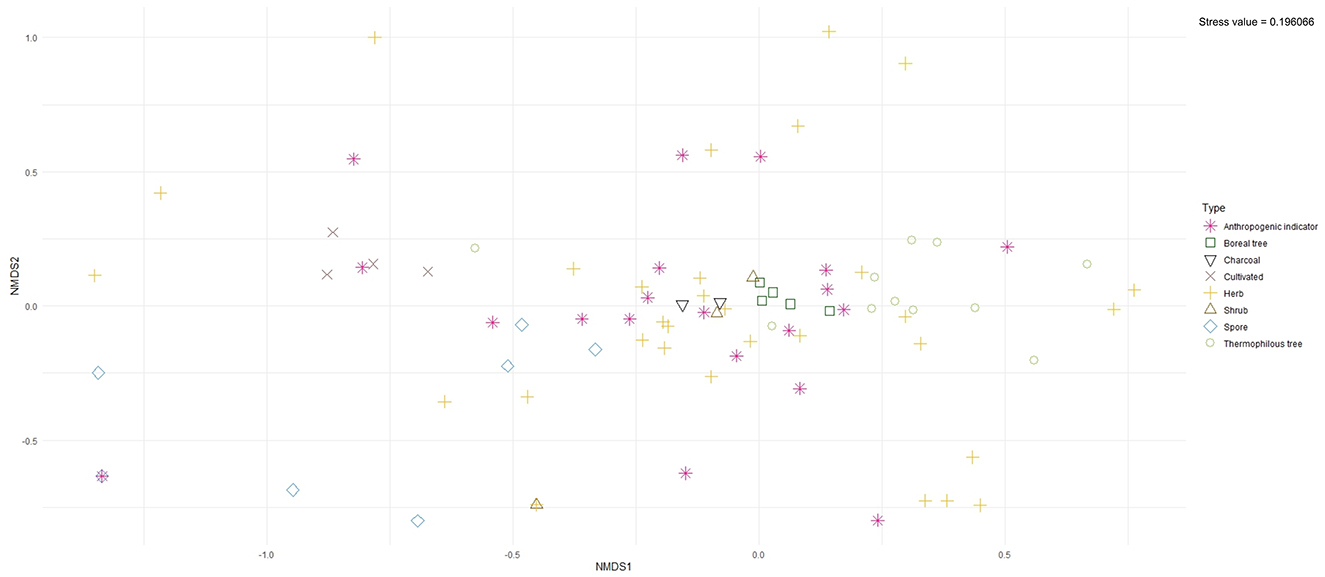
Figure 6. NMDS plot for the pollen data of Lake Dalsträsk.
Based on the influx values divided by RPP values, several of the taxa that are often used as anthropogenic indicators in palynology do not display a correlation to cereal pollen (Table 6). Some taxa are close to reaching the limit of 0.3, such as Cirsium, Urtica, and Galium, while others show remarkably low correlation, such as Caryophyllaceae, Artemisia, R. acetosa, and R. acetosella (Table 4). Populus (−0.64), Filipendula (−0.64), Ranunculaceae (−0.64) and Equisetaceae (−0.45) show a negative correlation, meaning that these taxa appear to decline with cereal pollen (Table 6).
Cereal pollen shows a positive correlation coefficient of 0.30 with coprophilous spores (Table 7). Cichorium intybus-t (0.33), Urtica (0.39), and P. lanceolata (0.35) have a positive correlation, the p-values of these taxa falling below 0.05 (Table 7). A negative correlation is found in Filipendula (−0.37).
4.5 Interpretation of results
4.5.1 Land use changes based on percentage and influx
In the first pollen zone (PAZ 1), dated to 741–307 BCE the influx values of boreal trees are low, while broadleaved trees are common together with herbs. There are many factors that can influence the dynamics of open land species. Various processes and disturbances prompt changes over time (e.g., Holling, 1973; Harrison, 1999; Gunderson, 2000). Fraxinus and Myrica (grouped with Corylus) may have colonized recently exposed, and temporarily waterlogged areas. Retreating shorelines were likely favorable to some of the heliophilous herbs. The sporadic presence of coprophilous spores and Hordeum-t pollen together with relatively high values of charcoal suggest some small presence of farming activities and grazing already from around 708 BCE.
From 279 BCE (PAZ 2) the percentages and influx of forest trees (boreal and broadleaf forest) increase, and Picea colonizes hilly areas as well as open land, including newly exposed areas. Nonetheless, there is also an increase in Juniperus—a heliophilous taxon. In this case, the increase in both shade trees and heliophilous taxa may result from the glade effect (Feeser and Dörfler, 2014), i.e., where flowering and pollen production of sun-loving taxa are facilitated by sunlight reaching glades or the edges of forest vegetation. At the end of the zone (118 cm, c. 197 CE), there is a significant decline in forest (shown both in percentages and influx). However, Salix increases, and Betula increases slightly—both being fast-growing colonizers in open land. This shift is preceded by a peak in small charcoal particles, the combination of which may be linked with human-made clearings of vegetation. Although Hordeum-t and Secale cereale occur only in two instances, there is no evidence of coprophilous taxa, and the percentages and influx of “anthropogenic” herb taxa are generally low.
Juniperus continues to increase markedly at the beginning of PAZ 3 (starting from c. 398 CE). The low percentages and influx values of trees persist. Cyperaceae and Poaceae are well-represented, and the combination of a higher representation of Juniperus along with occurrences of coprophilous spores may indicate landscape modification through grazing (cf. Vuorela, 1975). Possible “anthropogenic indicators,” such as Urtica, P. lanceolata, R. acetosella, as well as Plantago undiff. are also common. Additionally, cereal cultivation seems to have increased during this period, as indicated by occurrences of Hordeum-t, Secale cereale, and Cerealia undiff., observed in both percentages and influx. A regrowth of forest appears to have occurred from around 612 CE (82 cm), as the percentages and influx of boreal pollen increase significantly. In the upper part of the zone, there is a progressive increase in Poaceae and Cyperaceae. Small charcoal fragments are also well-represented during this period.
Juniperus decreases markedly in the following zone, PAZ 4, which begins around 823 CE (visible both in percentages and influx), while the percentages and influx of boreal trees remain high. Alnus and Salix are also well-represented. Coprophilous spores are continuously present, and based on influx values, grazing pressure appears to increase. Cereal cultivation declines markedly, with only a few occurrences of Secale cereale and Cerealia undiff. Charcoal particles also decrease. Altogether, this may suggest a shift in land use toward less cultivation.
The period after 1332 (PAZ 5) represents a phase of continuous intensification of land use. Juniperus increases progressively, and this, combined with the presence of some anthropogenic indicator taxa (e.g., P. lanceolata and Urtica) may reflect grazing practices. Poaceae and Cyperaceae also increase, possibly as a result of hay-making activities. There is a clear increase in cereal pollen, evident in both percentages and influx values. Coprophilous spores indicate increased grazing in the upper half of the zone. In the upper half of the zone, Pinus becomes dominant in the percentages (c. 44–52%), though less so in the influx values, which may be linked to plantations and/or the abandonment of agricultural land.
4.5.2 Assessing the “anthropogenic indicators”
Small-scale and low-intensity land use is often challenging to interpret in the pollen record. Cereal pollen, most of the “anthropogenic taxa” (Table 4), and coprophilous spores have low pollen productivity and/or poor dispersal. However, the landscape surrounding Lake Dalsträsk offers a possibility to test vegetational responses to anthropogenic land use practices, as the slopes around the lake provide increased input of pollen and spores via surface runoff (cf. Lee et al., 2022). As such, we have taken advantage of this increased signal to test the correlation of “anthropogenic indicators” with cereal pollen and coprophilous spores. Cereal pollen is normally the most reliable source for interpreting agrarian land use signals. However, as described above, the lack of evidence for wild grazers on Åland suggests that the use of coprophilous spores in this context is more reliable than it is in areas with wild grazers.
The combination of NMDS and correlation analysis was used to aid the interpretation of anthropogenic land use. The analysis established that Juniperus, C. intybus-t, and P. lanceolata show a positive correlation with cereal pollen and local cereal farming, while Populus, Filipendula, Ranunculaceae, and Equisetaceae have a negative correlation with cereal pollen. Urtica, P. lanceolata, and C. intybus-t, and cereals correlate positively with grazing (as inferred from coprophilous spores), while Filipendula shows a negative correlation. Several taxa commonly used as “anthropogenic indicators” show no correlation with cereal pollen or coprophilous spore taxa (Tables 6, 7).
Some taxa thrive when the forest canopy opens—a process that can be linked to grazing and cultivation practices but may also result from various natural processes that increase sunlight exposure. Consequently, such taxa may also benefit from natural disturbance regimes, such as forest fires or storms (Miller et al., 2008; Fourrier et al., 2013; Marzen et al., 2017). In this study, Juniperus is correlated with cereal cultivation rather than grazing practices. However, elsewhere in south-western Finland, Juniperus has been used as a grazing indicator (cf. Vuorela, 1975). Our results suggest that Juniperus is primarily favored by open landscapes rather than any specific land use practice, and that grazing pressure at this site was not sufficient to create an open landscape. Examining the percentage diagram (Figure 4), the highest values of Juniperus coincide with increased charcoal particle levels and cereal pollen. This pattern suggests that fire may have been used to clear the forest areas for permanent fields or it might even reflect early slash-and-burn cultivation (cf. Tolonen, 1985; Lindman, 1991; Ponomarenko et al., 2019).
Interestingly, in our study, cereal cultivation shows a negative correlation with Populus, despite its common presence in fields and settlements elsewhere (Tolonen et al., 1976; Hicks, 1988). Populus is often underrepresented in pollen records due to its low pollen production and limited dispersal (e.g., Chevalier et al., 2020, Table 4). However, on Åland, Populus has been used for pollarding and leaf-fodder production (Curman, 1993). This practice could have reduced pollination, and the negative correlation coefficients may reflect the early implementation of leaf-fodder production on Åland.
5 Discussion
In this study, we set out to assess possible evidence of small-scale agrarian land use in the northern part of the Åland Islands, an area without clear archaeological evidence of human land use practices. Additionally, we have assessed anthropogenic modification as part of this land use.
Even though the prehistoric population on Åland—alongside many other prehistoric populations in coastal areas, archipelagos, and islands—has been assumed to have relied heavily on maritime resources, our study clearly shows that terrestrial resources were also utilized. Although osteological material shows that maritime and coastal resources have been of great importance for the Ålandic population throughout the millennia, the evidence for agrarian land use is steadily increasing as more research is being conducted on the subject. Our study is the latest example of agrarian land use on Åland, extending further back than most earlier studies. The oldest part of the pollen core shows that agrarian land use practices date back to the Late Bronze Age and then progressively increase over the following centuries—thus adding further evidence for the relatively widespread practice of agriculture on these islands in prehistory. The agrarian practices that have been identified via palynological analysis from Lake Dalsträsk are cereal cultivation (of Hordeum spp. and Secale cereale) and grazing. These practices were small-scale, but there is a clear increase from the Migration Period onward. We have also identified shifts in land use. In the Viking Age, there is a decrease in cereal cultivation, accompanied by an increased signal of coprophilous spores, which we interpret as likely representing a growing focus on animal husbandry. In the medieval period, cereal cultivation is re-established and progressively intensified. These shifts have made it possible to investigate how small-scale and low-intensity land use of different kinds has shaped the landscape and the taxa composition. In particular, we have focused on taxa commonly used as “anthropogenic indicators” to identify how these respond to the kind of small-scale land use practiced on Åland in the past.
Certain aspects of landscape modification through anthropogenic land use may be interpreted using traditional methods of pollen analyses, such as visually interpreting percentage (Figure 4) and influx (Figure 5) diagrams. An example of this is the interpretation of landscape openness, based on the ratio between arboreal and non-arboreal pollen types (AP/NAP), as well as the occurrence of heliophilous taxa in combination with the directly linked signals of cereal pollen and coprophilous spores. However, to aid the interpretation of more subtle changes, it was necessary to apply statistical tests. Intentionally, we chose to use rather simple statistical approaches to investigate anthropogenic landscape modification and to test the response of “anthropogenic indicators” to small-scale land use, consisting of both cereal cultivation and grazing practices. This choice was made to encourage more frequent statistical applications in palynological research.
The NMDS clearly highlights the different ecologies of these “anthropogenic indicators,” evidenced by a clear dispersion in the plot (Figure 6). To better understand the lack of clustering tendency among the “anthropogenic indicators,” we applied correlation analyses (Tables 6, 7). Through this, we were able to establish which taxa were favored by the anthropogenic land use around Lake Dalsträsk and which were not. As a result of the clear shifts in land use practices, we could also determine differences and similarities in the vegetational response to cereal cultivation and grazing practices separately.
Our results may primarily serve as a tool to interpret palynological data from the Åland Islands, although local variability must be considered. However, our findings on “anthropogenic indicators” may not be applicable to sites outside of Åland, as landscapes are highly complex and influenced by many simultaneous processes affecting ecosystems and taxa composition. Nonetheless, we have successfully highlighted the need to utilize statistical approaches to support palynological interpretations. Such statistical approaches are not limited to NMDS and correlation analyses, but these relatively simple methods are, in fact, useful for gaining a deeper understanding of anthropogenic landscape modification over long periods of time. Further testing on larger datasets, with a broader geographical scope, may provide a more detailed and updated understanding of the application of “anthropogenic indicators” in palynology.
6 Conclusion
Our results demonstrate that even in areas with low suitability for agrarian practices, both cereal cultivation and grazing were practiced in the vicinity of Lake Dalsträsk and can be traced palynologically. In this study, NMDS and correlation analyses proved invaluable for assessing the relationship between specific “anthropogenic” taxa and land use practices.
Several taxa often used to interpret anthropogenic land use had no correlation with other, more direct, evidence such as cereal pollen or coprophilous spores. Some taxa were indicative of cereal cultivation, others of grazing, while some showed correlations with both land use practices—likely because these practices were carried out side by side.
The methodological approach used in this study revealed evidence of relatively small-scale agrarian activity in the Lake Dalsträsk area from the Late Bronze Age onwards, which—despite some indicators—is earlier than generally assumed. During the end of the Bronze Age and most of the Early Iron Age, cereal cultivation and domesticated grazing were practiced on a limited scale. However, from around 398 CE, there was a significant decline in forest cover. This was accompanied by an increase in Juniperus, charcoal particles, cereal-type pollen, and coprophilous spores. The combination of these indicators points to intensified agrarian land use that resulted in landscape modification. During the Viking Age and early medieval period, forest cover increased and cereal cultivation largely ceased, as indicated by the minimal occurrence of cereal-type pollen. Yet, the presence of coprophilous spores suggests continuous—and possibly intensified—grazing pressure. However, the intensity of this forest grazing was not sufficient to prevent a reforestation process. By 1332 CE, cereal cultivation resumed, and from the early modern period onward, there was again an increase in coprophilous spores, indicating intensified grazing.
Given the scarcity of archaeologically identified sites in the studied area, interpreting palynological data becomes critical for reconstructing past activities. The use of anthropogenic indicator taxa is well-established methodologically; however, understanding small-scale land use through these taxa presents challenges due to the complexity of landscape and ecosystems. In this study, NMDS and correlation analyses proved invaluable in addressing these challenges, offering deeper insights into the interplay between specific taxa and land use practices. This study highlights the importance of including statistical tests, such as correlation analysis (as applied here), in refining the interpretation of “anthropogenic” taxa in local contexts.
Data availability statement
The original contributions presented in the study are publicly available. This data can be found here: Neotoma database (ID: 65292).
Author contributions
PL: Methodology, Validation, Investigation, Writing – review & editing, Formal analysis, Writing – original draft, Conceptualization, Data curation, Visualization. AE: Methodology, Validation, Writing – original draft, Supervision, Writing – review & editing. KI: Investigation, Data curation, Funding acquisition, Conceptualization, Project administration, Writing – review & editing, Resources, Writing – original draft.
Funding
The author(s) declare that financial support was received for the research and/or publication of this article. This article and the research behind it were funded by The Research Council of Finland project no. 332396.
Acknowledgments
First and foremost, we want to thank Timo Saarinen and Teija Alenius at the University of Turku for their help with the coring samples; Teija Alenius is also acknowledged for the LOI and magnetic susceptibility analyses. Our thanks also go to Tuukka Mäkiranta for preparing the pollen samples.
Conflict of interest
The authors declare that the research was conducted in the absence of any commercial or financial relationships that could be construed as a potential conflict of interest.
Generative AI statement
The author(s) declare that Gen AI was used in the creation of this manuscript. Generative AI was used for checking languages and focus of the scope statement.
Publisher's note
All claims expressed in this article are solely those of the authors and do not necessarily represent those of their affiliated organizations, or those of the publisher, the editors and the reviewers. Any product that may be evaluated in this article, or claim that may be made by its manufacturer, is not guaranteed or endorsed by the publisher.
Supplementary material
The Supplementary Material for this article can be found online at: https://www.frontiersin.org/articles/10.3389/fearc.2025.1606122/full#supplementary-material
References
Alenius, T., Ilves, K., and Saarinen, T. (2022). Pollen evidence in exploring settlement dynamics, land use, and subsistence strategies in the Åland islands through multiproxy analyses from the lake Dalkarby Träsk sediment record. Environ. Archaeol. 29, 295–309. doi: 10.1080/14614103.2022.2053826
Aptroot, A., and Van Geel, B. (2006). Fungi of the colon of the Yukagir Mammoth and from stratigraphically related permafrost samples. Rev. Palaeobot. Palynol. 141, 225–230. doi: 10.1016/j.revpalbo.2005.04.006
Behre, K.-E. (1981). The interpretation of anthropogenic indicators in pollen diagrams. Polen Spores. 23, 225–245.
Bengtsson, L., and Enell, M. (1986). “Chemical analysis,” in Handbook of Holocene Palaeoecology and Paleohydrology, ed. B. E. Berglund (Chichester; New York, NY; Brisbane, QLD; Toronto, ON; Singapore: John Wiley and Sons Ltd.), 423–54.
Betensky, R. A. (2019). The p-value requires context, not a threshold. Am. Stat. 73, 115–117. doi: 10.1080/00031305.2018.1529624
Blaauw, M., and Christen, J. A. (2011). Flexible paleoclimate age-depth models using an autoregressive gamma process. Bayesian Anal. 6, 457–474. doi: 10.1214/11-BA618
Bottema, S., Cappers, R. T. J., and Kloosterman, A. (2004). The pollen signal of early neolithic farming along a habitation gradient in northern Drenthe. Palaeohistoria 45/46, 37–57.
Bray, J. R., and Curtis, J. T. (1957). An ordination of the upland forest communities of southern Wisconsin. Ecol. Monogr. 27, 325–349. doi: 10.2307/1942268
Broström, A., Nielsen, A. B., Gaillard, M.-J., Hjelle, K., Mazier, F., Binney, H., et al. (2008). Pollen productivity estimates of key European plant taxa for quantitative reconstruction of past vegetation: a review. Veg. Hist. Archaeobot. 17, 461–78. doi: 10.1007/s00334-008-0148-8
Broström, A., Sugita, S., Gaillard, M.-J., and Pilesjö, P. (2005). Estimating the spatial scale of pollen dispersal in the cultural landscape of southern Sweden. Holocene 15, 252–262. doi: 10.1191/0959683605hl790rp
Chevalier, M., Davis, B. A. S., Heiri, O., Seppä, H., Chase, B. M., Gajewski, K., et al. (2020). Pollen-based climate reconstruction techniques for late Quaternary studies. Earth-Sci. Rev. 210:103384. doi: 10.1016/j.earscirev.2020.103384
Clark, J. S. (1988). Particle motion and the theory of charcoal analysis: source area, transport, deposition, and sampling. Quat. Res. 30, 67–80. doi: 10.1016/0033-5894(88)90088-9
Clarke, K. R. (1993). Non-parametric multivariate analyses of changes in community structure. Austral. Ecol. 18, 117–143. doi: 10.1111/j.1442-9993.1993.tb00438.x
Cugny, C., Mazier, F., and Galop, D. (2010). Modern and fossil non-pollen palynomorphs from the Basque mountains (western Pyrenees, France): the use of coprophilous fungi to reconstruct pastoral activity. Veg. Hist. Archaeobot. 19, 391–408. doi: 10.1007/s00334-010-0242-6
Curman, J. (1993). Lövfoder och skottskogar. Noteringar till en sextusenårig tradition. KSLA 132, 47–78.
Eddudóttir, S. D., Svensson, E., Nilsson, S., Ekblom, A., Lindholm, K.-J., and Johansson, A. (2021). The history of resource coloniasation and agrarian land use in boreal forest in Värmland, Sweden. New evidence from pollen analysis. Veg. Hist. Archaeobot. 30, 759–771. doi: 10.1007/s00334-021-00829-y
Ekman, M. (2017). “Calculations of Historical Shore Levels back to 500 A.D.,” in The Baltic Sea Area due to Postglacial Rebound (Small Publications in Historical Geophysics 31) (Åland Islands: Summer Institute for Historical Geophysics).
Emanuelsson, M., Johansson, A., Nilsson, S., Pettersson, S., and Svensson, E. (2003). Settlement, Shieling and Landscape: the Local History of a Forest Hamlet [500 to 1800] (Lund Studies in Medieval Archaeology 32). Stockholm: Almqvist and Wiksell International.
Faegri, K., Kaland, P. E., and Krzywinski, K. (1989). Textbook of Pollen Analysis, 4th Edn. Chichester; New York, NY; Brisbane, QLD; Toronto, ON; Singapore: John Wiley and Sons Ltd.
Feeser, I., and Dörfler, W. (2014). The glade effect: vegetation openness and structure and their influences on arboreal pollen production and the reconstruction of anthropogenic forest opening. Anthropocene 8, 92–100. doi: 10.1016/j.ancene.2015.02.002
Fourrier, A., Pothier, D., and Bouchard, M. (2013). A comparative study of long-term stand growth in eastern Canadian boreal forest: fire versus clear-cut. For. Ecol. Manag. 310, 10–18. doi: 10.1016/j.foreco.2013.08.011
Gaillard, M.-J., Birks, H. J. B., Emanuelsson, U., and Berglund, B. E. (1992). Modern pollen/land-use relationships as an aid in the reconstruction of past land-uses and cultural landscapes: an example from south Sweden. Veg. Hist. Archaeobot. 1, 3–17. doi: 10.1007/BF00190697
Githumbi, E., Fyfe, R., Gaillard, M.-J., Trondman, A.-K., Mazier, F., Nielsen, A.-B., et al. (2022). European pollen-based REVEALS land-cover reconstructions for the Holocene: methodology, mapping and potentials. ESSD 14, 1581–1619. doi: 10.5194/essd-14-1581-2022
Grönlund, E., Simola, H., and andHuttunen, P. (1986). Paleolimnological reflections of fiber-plant retting in the sediment of a small clear-water lake. Hydrobiologia 143, 425–431. doi: 10.1007/BF00026693
Gunderson, L. H. (2000). Ecological resilience—in theory and application. Annu. Rev. Ecol. Evol. Syst. 31, 425–439. doi: 10.1146/annurev.ecolsys.31.1.425
Harrell, F. E. Jr. (2024). Hmisc: Harell Miscellaneous. R package version 5.2-0. R (version 5.2-0). Available online at: https://cran.r-project.org/web/packages/Hmisc/index.html (Accessed November 28, 2024).
Harrison, S. (1999). Local and regional diversity in a patchy landscape: native, alien, and endemic herbs on serpentine. Ecology 80, 70–80. doi: 10.1890/0012-9658(1999)080[0070:LARDIA]2.0.CO;2
Hauke, J., and Kossowski, T. (2011). Comparison of values of Pearson's and Spearman's correlation coefficients on the same sets of data. QUAGEO 30, 87–93. doi: 10.2478/v10117-011-0021-1
Hellman, S., Gaillard, M.-J., Broström, A., and Sugita, S. (2008). The REVEALS model, a new tool to estimate past regional plant abundance from pollen data in large lakes: validation in southern Sweden. J. Quat. Sci. 23, 21–42. doi: 10.1002/jqs.1126
Hicks, S. (1988). “The representation of different farming practices in pollen diagrams from northern Finland,” in The Cultural Landscape. Past, Present and Future, eds. H. H. Birks, H. J. B. Birks, P. E. Kaland, and D. Moe (Bergen: Botanical Institute University of Bergen; Cambridge University Press), 189–208.
Hjelle, K. L. (1999). Modern pollen assemblages from mown and grazed vegetation types in western Norway. Rev. Palaeobot. Palynol. 107, 55–81. doi: 10.1016/S0034-6667(99)00015-9
Holling, C. S. (1973). Resilience and stability of ecological systems. Annu. Rev. Eco. Syst. 4, 1–23. doi: 10.1146/annurev.es.04.110173.000245
Iversen, J. (1941). “Landnam i Danmarks Stenalder,” in En pollenanalytisk Undersøgelse over det første Landbrugsn Indvirkning paa Vegetationsudviklingen (Danmarks Geologiska Undersøgelse II) (København: C. A. Reitzels Forlag). doi: 10.34194/raekke2.v66.6855
Jaatinen, S. T. H., Peltonen, A., and Westerholm, J. (1989). Ålands kulturlandskap, 1700-talet (Bidrag till kännedom av Finlands natur och folk 137). Helsingfors: Societatis Scientiarum Fennica.
Jacobson, G. L., and Bradshaw, R. H. W. (1981). The selection of sites for paleovegetational studies. Quat. Res. 16, 80–96. doi: 10.1016/0033-5894(81)90129-0
Juggins, S. (2023). riojaPlot: Stratigraphic Diagrams in R. (version 0.1-20). Available online at: https://github.com/nsj3/riojaPlot (Accessed December 10, 2024).
Larsson, P. I., Alenius, T., and Ilves, K. (2023). Versatility as a cultural niche: palynological evidence on Iron Age and medieval land use on the Åland Islands. Acta Boreal. 40, 1–27. doi: 10.1080/08003831.2023.2257072
Leal, A., Martínez-Blanco, X., Beri, A., and Del Puerto, L. (2021). A combined catalog of non-pollen palynomorphs (NPPs) of fungal origin from soil and airborne samples of Uruguay. Rev. Palaeobot. Palynol. 293:104488. doi: 10.1016/j.revpalbo.2021.104488
Lee, C. M., Van Geel, B., and Gosling, W. D. (2022). On the use of spores of coprophilous fungi preserved in sediments to indicate past herbivore presence. Quaternary 5:30. doi: 10.3390/quat5030030
Lindman, G. (1991). Forntida Svedjebruk: Om möjligheterna att spåra forntidens svedjebruk (Arkeologiska Undersökningar, Skrifter 1). Stockholm: Riksantikvarieämbetet.
Ljung, T. (2017). Vårt levande arv: minnen och spår i landskapet. Dalarnas fornminnes- och hembygdsföi samarbete med Dalarnas museum.
Maanmittauslaitos. (2023). Available online at: https://www.maanmittauslaitos.fi/ (accessed January 17, 2023).
Marzen, M., Iserloh, T., De Lima, J. L. M. P., Fister, W., and Ries, J. B. (2017). Impact of severe rain storms on soil erosion: Experimental evaluation of wind-driven rain and its implications for natural hazard management. Sci. Total Environ. 590–591, 502–13. doi: 10.1016/j.scitotenv.2017.02.190
Mazier, F., Broström, A., Bragée, P., Fredh, D., Stenberg, L., Thiere, G., et al. (2015). Two hundred years of land-use change in the South Swedish Uplands: comparison of historical map-based estimates with a pollen-based reconstruction using the landscape reconstruction algorithm. Veg. Hist. Archaeobot. 24, 555–570. doi: 10.1007/s00334-015-0516-0
Miller, P. A., Giesecke, T., Hickler, T., Bradshaw, R. H. W., Smith, B., Seppä, H., et al. (2008). Exploring climatic and biotic controls on Holocene vegetation change in Fennoscandia. J. Ecol. 96, 247–259. doi: 10.1111/j.1365-2745.2007.01342.x
Moore, P. D., Webb, J. A., and Collinson, M. E., (Ed.). (1991). Pollen Analysis, 2nd Edn. Oxford: Blackwell Sience Ltd.
Nunez, M. (1990). Sa 21.11 Nääs, Härdalen. Utgrävning av skärvstensröset anl, 46 samt provundersökning av boplatsområdet från sten/bronsåldern.
Oksanen, J., Simpson, G. L., Blanchet, F. G., Kindt, R., Legendre, P., Minchi, P. R., et al. (2022). vegan: Community Ecology Package. (version 2.6-4). Available online at: https://CRAN.R-project.org/package=vegan (Accessed July 17, 2021).
Ponomarenko, E., Tomson, P., Ershova, E., and Bakumenko, V. (2019). A multi-proxy analysis of sandy soils in historical slash-and-burn sites: a case study from southern Estonia. Quat. Int. 516, 190–206. doi: 10.1016/j.quaint.2018.10.016
R Core Team. (2022). R: A Language and Environment for Statistical Computing. R (version 4.1.3). Vienna, Austria: R Foundation for Statistical Computing. Available online at: https://www.R-project.org/ (Accessed April 26, 2022).
Reimer, P. J., Austin, W. E. N., Bard, E., Bayliss, A., Blackwell, P. G., Ramsey, C. B., et al. (2020). The IntCal20 northern hemisphere radiocarbon age calibration curve (0–55 cal kBP). Radiocarbon 62, 725–757. doi: 10.1017/RDC.2020.41
Segerström, U., Von Stedingk, H., and Hörnberg, G. (2008). Long-term sustainability of a northern boreal deciduous swamp forest in northern Sweden: succession in the absence of fire. Holocene 18, 1113–1122. doi: 10.1177/0959683608093539
Shumilovskikh, L. S., Shumilovskikh, E. S., Schlütz, F., and Van Geel, B. (2022). NPP-ID: Non-pollen palynomorph image database as a research and educational platform. Veg. Hist. Archaeobot. 31, 323–328. doi: 10.1007/s00334-021-00849-8
Shumilovskikh, L. S., Shumilovskikh, E. S., Schlütz, F., and Van Geel, B. (2023). Correction: NPP-ID: non-pollen palynomorph image database as a research and educational platform. Veg. Hist. Archaeobot. 32, 109–109. doi: 10.1007/s00334-022-00889-8
Skoglund, G. (2021). Traditional manufacture of hemp and hop textiles: why botany and agronomy matter. J. Anthropol. Archaeol. 9, 1–16. doi: 10.15640/jaa.v9n1a1
Stenbäck, N. (2003). Människorna vid havet: platser och keramik på Ålandsöarna perioden 3500-2000 f.Kr. Stockholm: Stockholm University.
Storå, J. (2000). Sealing and animal husbandry in the Ålandic Middle and Late Neolithic. Fennosc. Archaeol. XVI, 57–81.
Storå, J. (2002). Neolithic seal exploitation on the Åland Islands in the Baltic Sea on the basis of epiphyseal fusion data and metric studies: neolithic seal exploitation. Int. J. Osteoarchaeol. 12, 49–64. doi: 10.1002/oa.612
Storå, J. (2012). “Late iron age subsistance in the Åland Islands in light of osteoarchaeology,” in Stones, Bones and Thoughts: Festschrift in Honor of Milton Núñez, eds. S. Niinimäki, A.-K. Salmi, J.-M. Kuusela, J. Okkonen, J. Hillborg, R. Lindblad, J. Lindberg, et al. (Uleåborg: Milton Núñezin juhlakirjan toimituskunta), 175–189.
Storå, J., and Lõugas, L. (2005). “Human exploitation and history of seals in the Baltic during Late Holocene,” in The Exploitation and Cultural Importance of Sea Mammals, ed. G. G. Monks (Durham, NC: Oxbow Books), 96–106.
Sugita, S. (2007a). Theory of quantitative reconstruction of vegetation II: all you need is LOVE. Holocene 17, 243–257. doi: 10.1177/0959683607075838
Sugita, S. (2007b). Theory of quantitative reconstruction of vegetation I: pollen from large sites REVEALS regional vegetation composition. Holocene 17, 229–241. doi: 10.1177/0959683607075837
Tolonen, K., Siiriäinen, A., and Hirviluoto, A.-L. (1976). Iron Age Cultivation in SW Finland. Finska Fornminnesföreningen.
Tolonen, M. (1985). Palaeoecological record of local fire history from a peat deposit in SW Finland. Ann. Bot. Fenn. 22, 15–29.
Tyler, T., Herbertsson, L., Olofsson, J., and Olsson, P. A. (2021). Ecological indicator and traits values for Swedish vascular plants. Ecol. Indic. 120:106923. doi: 10.1016/j.ecolind.2020.106923
Van Geel, B. (1978). A paleoecological study of Holocene peat bog sections in Germany and the Netherlands, based on the analysis of pollen, spores and macro- and microscopic remains of fungi, algae, cormophytes and animals. Rev. Palaeobot. Palynol. 25, 1–120. doi: 10.1016/0034-6667(78)90040-4
Van Geel, B., Zazula, G. D., and Schweger, C. E. (2007). Spores of coprophilous fungi from under the Dawson tephra (25,300 14C years BP), Yukon Territory, northwestern Canada. Palaeogeogr. Palaeoclimatol. Palaeoecol. 252, 481–485. doi: 10.1016/j.palaeo.2007.04.017
Vanhanen, S., Gustafsson, S., Ranheden, H., Björck, N., Kemell, M., and Heyd, V. (2019). Maritime hunter-gatherers adopt cultivation at the farming extreme of Northern Europe 5000 years ago. Sci. Rep. 9:4756. doi: 10.1038/s41598-019-41293-z
Vuorela, I. (1975). Pollen Analysis as a Means of Tracing Settlement History in SW-Finland (Acta Bot. Fenn. 104). Helsinki: Societas Pro Fauna et Flora Fennica.
Wan, Q., Huang, K., Chen, C., Tang, Y., Zhang, X., Zhang, Z., et al. (2023). Relative pollen productivity estimates for major plant Taxa in middle subtropical China. Land 12:1337. doi: 10.3390/land12071337
Wehlin, J., Ljunge, M. O., Larsson, P. I., Eddudóttir, S. D., Ekblom, A., and Eriksson, J. A. (2023). Hunter-gatherer farming during the first millennium bce in inland, boreal landscapes: new pollen analytical and archaeological evidence from Dalarna, central Sweden. Veg. Hist. Archaeobot. 32, 615–633. doi: 10.1007/s00334-023-00933-1
Wickham, H. (2016). ggplot2: Elegant Graphics for Data Analysis. 2nd Edn.. Cham: Springer International Publishing: Imprint: Springer.
Keywords: Åland Islands, palynology, coprophilous spores, correlation analysis, NMDS, anthropogenic landsacpe
Citation: Larsson PI, Ekblom A and Ilves K (2025) Tracing anthropogenic indicators for small-scale land use on the Åland Islands: palynological and correlation analyses. Front. Environ. Archaeol. 4:1606122. doi: 10.3389/fearc.2025.1606122
Received: 04 April 2025; Accepted: 07 July 2025;
Published: 12 August 2025.
Edited by:
Claudia Speciale, Institut Català de Paleoecologia Humana i Evolució Social (IPHES), SpainReviewed by:
Ayako Shibutani, The University of Tokyo, JapanJavier Ruiz-Pérez, Texas A&M University, United States
Copyright © 2025 Larsson, Ekblom and Ilves. This is an open-access article distributed under the terms of the Creative Commons Attribution License (CC BY). The use, distribution or reproduction in other forums is permitted, provided the original author(s) and the copyright owner(s) are credited and that the original publication in this journal is cited, in accordance with accepted academic practice. No use, distribution or reproduction is permitted which does not comply with these terms.
*Correspondence: Petter I. Larsson, UGV0dGVyLmxhcnNzb25AaGVsc2lua2kuZmk=