 Rebecca E. Campbell
 D. Roger Wallis2
- 1Epidemiology & Disease Management, The New Zealand Institute for Plant and Food Research Ltd, Motueka, New Zealand
- 2Adaptive Entomology, The New Zealand Institute for Plant and Food Research Ltd, Motueka, New Zealand
- 3Innovative Plant Pathology, The New Zealand Institute for Plant and Food Research Ltd, Te Puke, New Zealand
Many microorganisms can be dispersed by rain-splash, whereby spores become suspended in water and are spread via droplets. The resulting dispersal gradient is dependent on several factors including rainfall intensity, the nature of the plant canopy and its effects on splash, deposition, redistribution (secondary splash) and filtering. Gradients of spore dispersal with distance are important for understanding epidemics, and the primary dispersal gradient can shape an epidemic for several pathogen generations. However, microorganisms are difficult to trap, identify and enumerate efficiently. This makes it difficult to study the spread and dispersal of pathogens to aid in biosecurity responses and management of epidemics. We used macroconidia of Neonectria ditissima, the causal organism of apple canker, to explore patterns of rain-splash dispersal in tree canopies. We investigated the use of a fluorescent tracer dye, PTSA (1,3,6,8-pyrenetetrasulfonic acid), as a surrogate to conidia capture during natural and artificial rain events, and lens tissue as ‘surrogate leaves’ to recapture tracer dye. Conidia and dye were released from central point sources 2.5 m above the ground and recaptured in passive rainwater traps or artificial ‘leaves’. Quantile regression and exponential models were used to explore variation and dispersal gradients derived for both conidia and dye, with and without tree canopy and with natural or artificial precipitation. Estimated dispersal gradients were steeper with a flatter tail when no tree canopy was present, whereas presence of tree canopy resulted in more variation and shallower predicted dispersal gradients, with fatter tails, predicting potential dispersal to further distances from the source. The majority of conidia and dye were recaptured at less than 1 m from the source, but small concentrations of spores were detected up to 3 m and dye more than 6 m. High variation in natural conditions requires further investigation to fully quantify natural dispersal gradients. Nevertheless, these results show the merit of tracer dye, artificial leaves, and quantile regression as tools to estimate potential dispersal patterns of N. ditissima and other rain-splash dispersed microorganisms, considering rain-splash factors in real canopies and natural situations for predicting inoculum dispersal.
1 Introduction
Rain-splash dispersal is important in the spread of many microorganisms, whereby spores become suspended in water droplets which are subsequently redistributed by gravity, droplet splash and aerial dispersion (Madden, 1997; Pielaat and van den Bosch, 1998; Pietravalle et al., 2001; Saint-Jean et al., 2004; Farber et al., 2019). Determining and quantifying propagule movement can be difficult, and detecting an inoculum source or sampling inoculum both have many practical difficulties across spatial and temporal scales (Lacey and West, 2006; Mahaffee et al., 2023). Knowledge of the distance that splash droplets travel and the variability between occasions or situations, is useful for determining the nature of disease spread from a focal point through a crop (Shaw, 1991; Zadoks and Van den Bosch, 1994). Information about dispersal of pathogens is critical for understanding epidemics, particularly in defining how fast and far disease can spread (Fountaine et al., 2010; Cunniffe et al., 2016; Farber et al., 2019; Mahaffee et al., 2023).
Neonectria ditissima, the causal agent of apple canker (also called European canker), is an ascomycete fungus which can produce two spore types year round, with seasonal peaks (Amponsah et al., 2015; Amponsah et al., 2017; Araujo and Pinto, 2022): ascospores from perithecia (sexual spores) and conidia from sporodochia (asexual spores). Conidia range from small single-celled microconidia to relatively large multi-celled cylindrical spores (macroconidia, up to approximately 76 × 7 μm) which form in spore piles (sporodochia), while ascospores are two-celled and approximately 14 × 7 μm (Araujo et al., 2021). Conidia are released and spread by rain (Amponsah et al., 2017; Araujo and Pinto, 2022) and most conidia are generally released within the first 30 minutes of rain (Walter et al., 2018). Ascospores can be actively released but are found only during, or after rainfall, and can also be collected in passive rainfall traps (Amponsah et al., 2017; Araujo and Pinto, 2022). The seasonality of spore types varies with region, and in New Zealand apple orchards, lesions producing conidia are found more frequently than those producing perithecia (Campbell et al., 2016). The focus of this publication is on macroconidia because of their importance to apple canker epidemiology (Wesche and Weber, 2023) and therefore ascospore and microconidia dispersal were not explicitly investigated.
Conidia are splashed or dripped onto wounds such as those from leaf fall, picking and pruning (Campbell et al., 2016), where they germinate to establish infection. Visible cankers form on woody tissue, after an incubation period ranging from a few weeks to multiple years (McCracken et al., 2003; Weber, 2014). In temperate conditions (most of New Zealand) most infections are expressed within months (Scheper et al., 2019). If not removed from the orchard, these lesions then become sources of inoculum and periods of wetness, high frequency of rainfall and temperatures particularly between 11-16°C, favor conidia production and lesion extension (Walter et al., 2018; Scheper et al., 2019).
Dispersal distances of N. ditissima conidia have been recorded of between 1 and 4 m for conidia (Nunes and Alves, 2019; Araujo and Pinto, 2022), and ascospores have the potential to travel hundreds of meters to a few kilometers (Weber, 2014). However, dispersal distances have not been adequately quantified. Even a small probability of spores reaching susceptible tissue can be important for disease spread because as few as three macroconidia are needed to initiate infection under conducive conditions, and 10-30 conidia under New Zealand field conditions (Walter et al., 2016). Furthermore, each lesion has the potential to produce large numbers of spores, up to 14,000 conidia per mm of lesion or up to 7,000,000 conidia per rain event (Walter et al., 2018; Scheper et al., 2019).
Rain-splash is very effective in the process of short distance dispersal (typically 0.01–1 m) (Saint-Jean et al., 2004). However, different rain events with similar characteristics (amount, duration, rate) can produce variability in splash height and distance (Shaw, 1987; Shaw, 1991; Pietravalle et al., 2001; Vidal et al., 2017), making rain-splash dispersal difficult to predict. Additionally, extended or heavy rain can wash spores off and remove them from surfaces (Wadia et al., 1998; Sache, 2000). Furthermore, the plant canopy structure influences movement and deposition of spores (Ahimera et al., 2004; Vidal et al., 2017; Mahaffee et al., 2023). Likewise, the plant canopy architecture has an effect on dispersal variability, distances and filtering effects (McCartney and Fitt, 1985; Shaw, 1987; Pietravalle et al., 2001; Ahimera et al., 2004; Saint-Jean et al., 2006; Penet et al., 2014; Vidal et al., 2017; Mahaffee et al., 2023). Therefore, the local conditions and architecture of plants is important in the spread of diseases, highlighting the difficulty, yet importance, of quantifying dispersal in actual crops and real settings.
Much can be learnt from controlled experiments. Many previous rain-splash dispersal studies have been for applications in cereal crops (Shaw, 1987; Aylor, 1999; Saint-Jean et al., 2004; Vidal et al., 2017), however, there is a need for understanding splash dispersal in horticultural tree crops and orchard situations (Ahimera et al., 2004; Viruega et al., 2013; Everett et al., 2018). Variation is introduced at many levels, including height, droplet size, surface, rainfall intensity and turbulence. However, at the tree to orchard scale we still need to be able to have robust predictions of potential spread to assess risk and manage diseases in heterogeneous environments (Karisto et al., 2023; Mahaffee et al., 2023). Empirical models describing dispersal gradients commonly use power or exponential functions. These are valuable to comparative epidemiology and incorporation into spatio-temporal modelling at larger spatial scales (Madden, 1997; Saint-Jean et al., 2004; Lacey and West, 2006; Farber et al., 2019), yet, under field settings dispersal and variability are often not adequately quantified.
A tracer dye travels with the water front (Roten et al., 2014) and therefore could provide the worst-case scenario of potential spread of rain-splash organisms from a point source. Furthermore, it provides an experimental option when actual spores are inappropriate to be used in an orchard setting. A tracer dye has potential to be used as a surrogate to explore patterns of rain-splash dispersal in apple canopies under different rainfall events and to quantify potential dispersal patterns in actual landscapes of interest. Furthermore, tracer dyes are easy to use in the field, highly sensitive to detection and quick to analyze reliably and consistently.
Understanding inoculum dispersal in orchard systems will facilitate decision making and disease control through exploring disease spread in relation to row spacing, planting density and barriers to pathogen dispersal (Ahimera et al., 2004; Di Iorio et al., 2019). In turn, this information can lead to assessing rates of disease spread and subsequent requirements for containment and frequency of removal of diseased tissue to minimize epidemic spread and impact (Xu and Ridout, 1998; White et al., 2017).
The aims of this research were to: 1) test splash dispersal methodology in an orchard system by a) estimating the relationship between a fluorescent tracer dye and N. ditissima macroconidia, b) assessing methodology with and without tree canopy and c), testing the relationship between passive rain trap and artificial leaf substrate collection; and 2) explore dispersal gradients for N. ditissima conidia using these methods, including capturing levels of natural variability from field settings.
2 Materials and methods
Experiments were conducted in The New Zealand Institute for Plant and Food Research Ltd. research orchards in the Motueka, Tasman region of the South Island of New Zealand, between February 2016 and November 2016. Macroconidia (sterile, hereafter referred to as conidia), dye release and re-trapping events were carried out in either an artificial setting of a frame with no tree canopy (events 1–2, Table 1), or an orchard setting with apple (events 6–12, Table 1, Figure 1) or pear tree canopies (events 3–5, Table 1). A pear tree canopy was included because of availability of a suitable canopy where overhead sprinklers were able to be set up to be used for artificial events only. The apple and pear tree canopy structure were similar, mature, central leader trees that were not heavily pruned (experimental orchard rather than a commercial production orchard). Pear is also a susceptible host for N. ditissima. Events were distributed throughout the year for logistical reasons, tree availability and to explore potential effects of seasonal variation in the canopy growth.
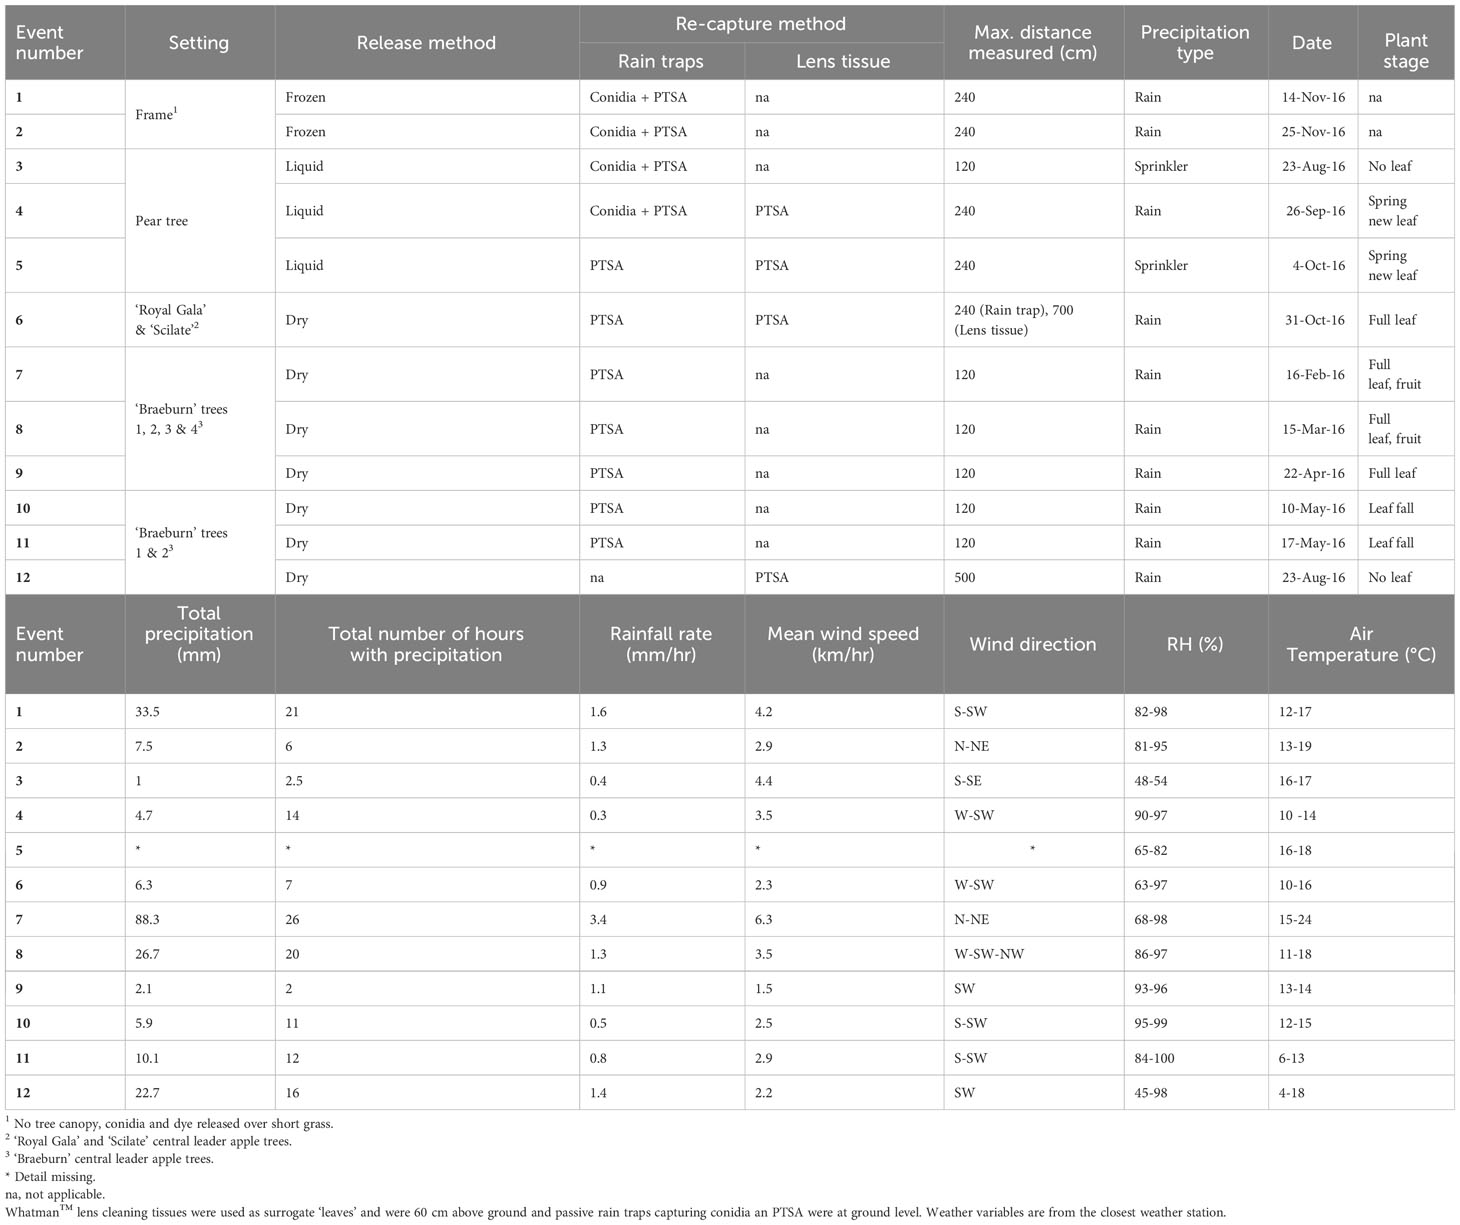
Table 1 Experiments on the release and recapture of Neonectria ditissima macroconidia and 1,3,6,8-pyrenetetrasulfonic acid (PTSA) tracer dye, with and without a tree canopy.
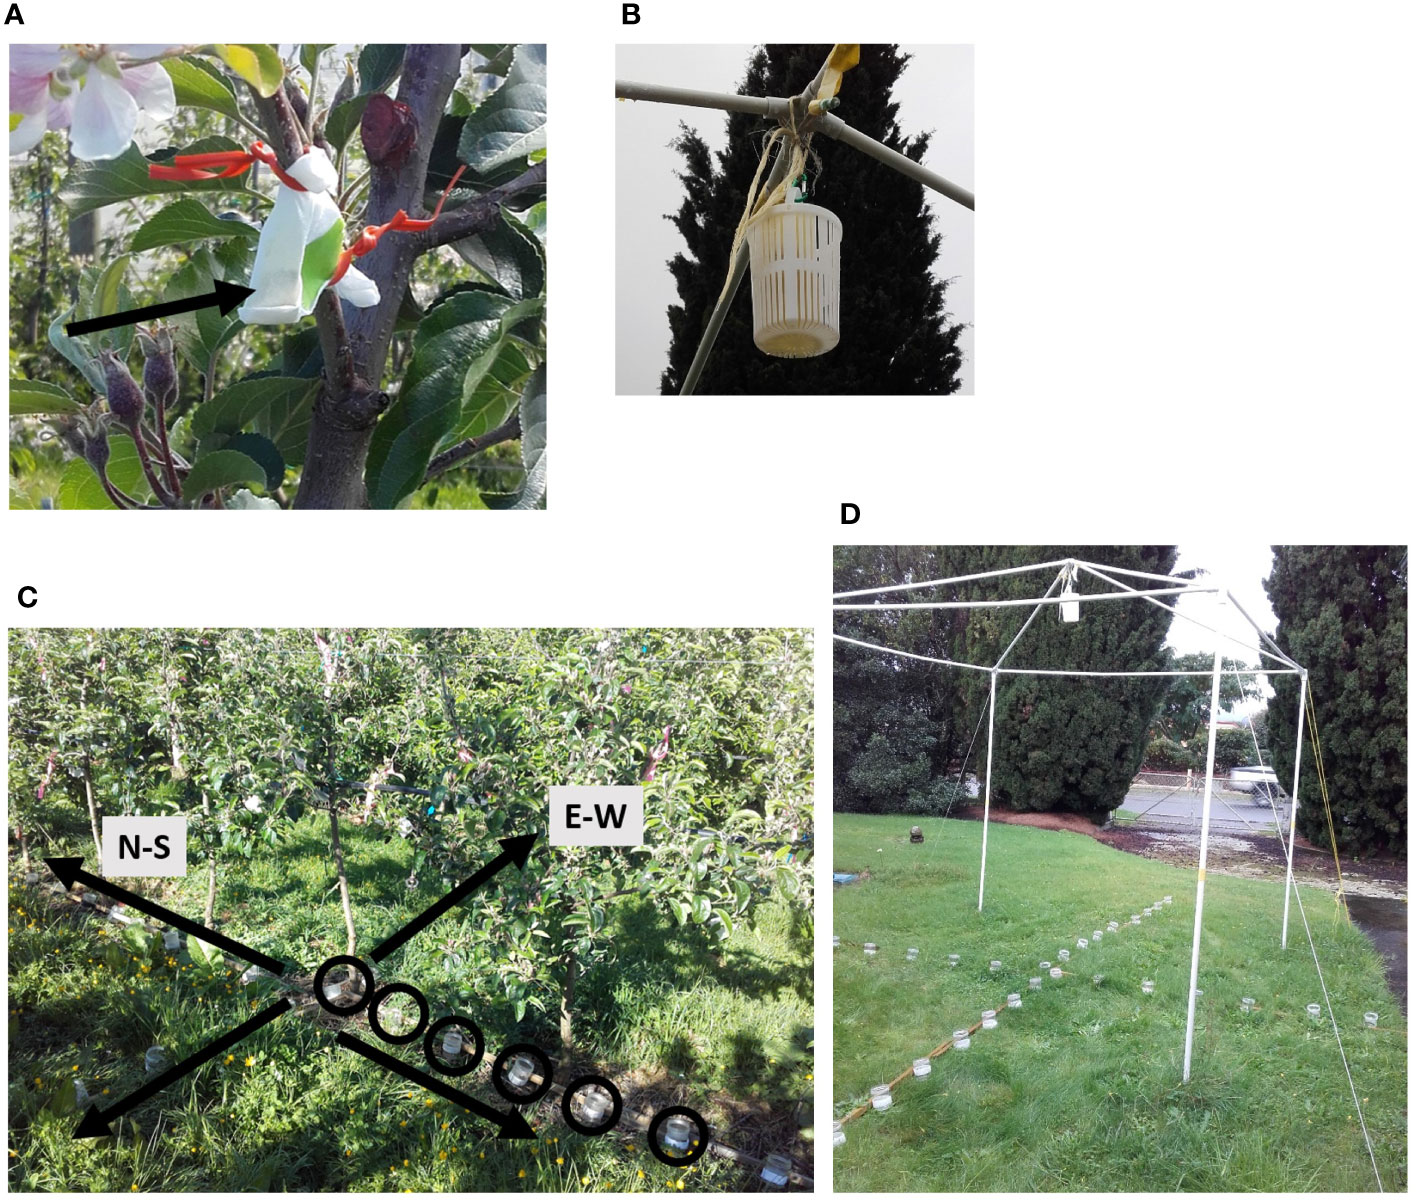
Figure 1 Experimental arrangement for releasing Neonectria ditissima macroconidia and 1,3,6,8-pyrenetetrasulfonic acid (PTSA) tracer dye from a point source and recapturing in rain traps. (A) Dry powdered dye within a single ply facial tissue pocket, to be released during wetting by rain. (B) Frozen conidia suspension in a dye solution melting during rain producing drops containing conidia and dye. (C) Rain traps under an apple tree. Arrows indicate the direction of a series of rain traps spaced 30 cm apart in four cardinal directions. N–S along the tree row is indicated and E–W across the tree rows. (D) Rain traps set up at 30 cm spacing under the frame during a rain event. Conidia and dye were released from a frozen solution hanging above.
Hourly weather data was downloaded from Metwatch (Hortplus.com) for the nearest weather station approximately 100 m from the frame, 600 m from the pear tree and ‘Braeburn’ trees 1, 2, 3 and 4, and 2 km from the ‘Royal gala’ and ‘Scilate’ apple trees (Table 1). Total volume of precipitation, precipitation per hour, wind speed, wind direction, air temperature and relative humidity (RH) were summarized for each experimental event. For the events under artificial precipitation, a manual rain gauge was used to record precipitation volume.
2.1 Surrogate tracer dye and conidia release
PTSA (1,3,6,8-pyrenetetrasulfonic acid) is a water soluble, non-toxic, fluorescing dye used for tracing spray application (Fritz et al., 2011; Hoffmann et al., 2014; Roten et al., 2017). It is highly soluble, easily recoverable, stable in solution and not easily degraded in sunlight (Hoffmann et al., 2014). PTSA dye was released either dissolved within a conidial suspension (0.4 g/L) or from a single ply of facial tissue (Tork® premium, 2 ply separated into single ply) folded around 0.2 g of dry dye powder which was released on wetting by natural rain (Figure 1A).
Sterile (autoclaved) N. ditissima macroconidia were used in a conidial suspension, either as a liquid or frozen. The conidial suspensions were created from field collected cankers resulting in mixed isolates (Orchard et al., 2018; Walter et al., 2018). Only macroconidia (>2 septate) were considered so that they could be easily identified and enumerated using a hemocytometer. Macroconidia were potentially amongst microconidia and other microorganisms present in field collected samples. Macroconidia are also considered to be more important in the epidemiology of apple canker than microconidia (Wesche and Weber, 2023). The conidial suspension (1×10⁵ spores/mL in 400–600 mL) was autoclaved to sterilize the conidia before use for field releases, to prevent unwanted infection in the host trees. The liquid conidial suspensions were dripped from a plastic 1.5 L bottle through an irrigation tap at approximately one drop per second. The frozen suspension of the same concentration of conidial suspension (frozen in a 1 L Cylindrical Sistema® sprout colander (100 mm diameter)) was removed from the plastic container but remained in the plastic sprout colander for hanging, after which it thawed during natural or artificial rain over a period of approximately 4–6 hours dripping from a point (Figure 1B). For both liquid and frozen conidial suspension release, spores settled to the bottom and were therefore released at a greater rate at the initial onset of rainfall. Release of most conidia at the onset of rainfall has previously been observed from canker lesions in the field (Walter et al., 2018). Overhead irrigation sprinklers were set up above the pear tree canopy to provide artificial precipitation for events 3 and 5 and were only turned on during these events (Table 1); all other events were under natural rain.
2.2 Conidia and dye capture
Conidia and PTSA were passively collected in rainwater traps at ground level. Rain traps were plastic Labserv jars (250 mL, 6.5 cm diameter collection area) which were placed centrally under the dye-spore release points and every 30 cm in four perpendicular directions (Figure 1C). Distances were selected based on preliminary experiments indicating that most spores were recaptured within the first meter from the source. All experiments had at least four rain traps in each direction (out to 120 cm horizontal distance from the inoculum source, events 3, 7–11), with some up to eight traps (240 cm from the source, events 1, 2, 4–6, Table 1). After artificial or natural rainfall, rain traps were retrieved and water volume, dye and conidia concentration were quantified. The volume of water in the jars was measured by weight. The liquid was agitated to resuspend conidia and avoid them adhering to the jar, and a 170-μL sample was transferred using a pipette to a black Greiner 96 Fbottom microplate well for fluorometric analysis of PTSA. The rest of the sample was frozen for later conidia counts. When defrosted, the samples were centrifuged to concentrate conidia, the supernatant was removed with a pipette, and conidia were enumerated using a hemocytometer and compound microscope at 100 times magnification (Walter et al., 2018). The concentration of N. ditissima conidia in the rainwater traps was expressed as the number of conidia per mL of water collected.
Single Whatman™ lens cleaning tissues (100 × 150 mm) were used to represent artificial leaves in the dye capture experiments (events 4–6, Table 1). The lens tissues were stapled into the trees around twigs/small branches at the height of 60 cm (the bottom orchard wire) at the same distances as rain traps for comparison of PTSA concentrations. For the ‘Royal Gala’ and ‘Scilate’ apple dry-dye release experiments (event 6, Table 1), lens tissues to recapture dye were attached up to 7 m from the PTSA dye source to extend the distance of the measured gradient. Twigs and leaves were also collected for comparison; however, tannins prevented reliable fluorescence readings.
To redissolve the PTSA dye from lens tissue samples, collected lens tissues were placed in plastic zip lock bags, 30 ml of 10% isopropyl alcohol was added, gently shaken (Hoffmann et al., 2014) and left for 10 minutes on the laboratory bench at room temperature. From this sample, after re-agitating to ensure a mixed solution, 170 μL was pipetted into black Greiner 96 Fbottom microplates. These were sealed with foil (inhibiting light exposure) and refrigerated (4°C) until measurements were taken using a CLARIOstar plate reader (BMG Labtech, Ortenburg, Germany). An excitation wavelength of 375 nm and an emission wavelength of 405 nm was used (Hoffmann et al., 2014; Roten et al., 2017), and concentrations were calculated from the fluorescence using a 4-parameter fit and blank-corrected data (Armbruster and Pry, 2008). Blank controls for samples from rainwater traps were 170 μL of distilled water, and blank controls for lens tissue were 10% isopropyl alcohol (Armbruster and Pry, 2008). Calibration used 26 standard solutions of known serial dilutions (0.4 g/L to 1.19 × 10⁻⁸ g/L) of PTSA in distilled water. Calibration with distilled water was appropriate because the inclusion of the blank controls of isopropyl alcohol accounted for any offsets (undetectable). Final PTSA concentrations were reported in μg/L, to 2 decimal places (within the Limit of Detection and Limit of Quantification). No significant change in concentration with storage was detected over 8 weeks, confirming the results of Hoffmann et al. (2014).
2.3 Conidia and dye dispersal in the absence of canopy
Conidia and PTSA in a frozen suspension were released in an artificial setting of a marquee frame (frame only, no fabric, hereafter referred to as ‘frame’) over short (2-5 cm) perennial rye grass (Figures 1B, D). The conidia and dye were released from a central point source 2.5 m above the ground and recaptured in 33 rain traps at ground level (eight in each cardinal direction, 30 cm spacing (as above), and one central point). Rain traps under the frame were retrieved for two different natural rain events (Table 1).
2.4 Dispersal using natural and artificial rain events
A pear canopy was used as a surrogate for an apple tree canopy because overhead irrigation sprinklers were only possible to install in the pear tree, and the tree had similar architecture to the apple trees in the same orchard. Liquid suspension of sterile N. ditissima conidia in a PTSA dye solution (0.4 g/L) was released and recaptured in rain traps and dye was also captured on lens tissues (events 3 and 5, Table 1). Sprinklers set up above the canopy were used to create two artificial precipitation events running for 2-3 hours with a rainfall equivalence of approximately 0.4 mm/h. Release and re-capture was also carried out for one natural rain event in the same pear tree (event 4, Table 1).
2.5 Dispersal during natural rain events
Natural canker lesions in the tops of ‘Braeburn’ apple trees, approximately 2.5 m high, were producing conidia. Conidia release was validated with glass slides placed directly under the lesions before dispersal experiments. Dye was released from a tissue pocket (0.2 g PTSA powder) tied directly next to the natural branch canker and released during wetting each time by a single natural rain event. Experiments in these trees were included in the analyses of distances travelled by the PTSA dye only, not for conidia counts, because not enough naturally released conidia were recaptured (Table 1, trees 1–4). Trees were mature, central leader, ‘Braeburn’ apple and the orchard was removed after the experiments. Rain traps under apple trees 1–4 were retrieved for five rain trap events and lens tissues for one rain event from trees 1 and 2 (Table 1).
For event 6 (Table 1), dry dye powder in a tissue pocket was released under one natural rain event in two trees, one of ‘Royal Gala’ (RG) and one of ‘Scilate’, in adjacent blocks. Trees were seven-year-old, central leader architecture, with 3.5 m wide row spacing and 1.5 m tree spacing in an experimental apple orchard (Figures 1A, C). PTSA was collected in four compass directions at 30 cm spacing using lens tissues up to 7 m from the central dye release location (2.5 m high) and in rain traps up to 240 cm from the central release location (Figures 1A, C).
2.6 Statistical analysis
Statistical analyses were carried out in R (RCoreTeam, 2021, v. 4.0.5) to examine the relationship between concentrations of conidia and PTSA dye captured in rain traps, comparison of dye captured on lens tissues and rain traps, and dispersal distance of conidia and dye in natural (tree) and artificial (frame) settings, with natural and artificial rain events.
Pooled data across all events that had both conidia and dye capture were used to test the conidia-dye relationships (events 1-4). The relationships between recapture methods rain trap and lens tissue also used pooled data from experiments which had both rain traps and lens tissues for dye recapture (events 4-6). For the pooled data, significance of covariates was tested with linear models on natural log (ln) transformed data, to determine whether these had effects on the methodology relationships: distance, tree/frame, rainfall/sprinkler, cardinal direction, release method, wind speed, precipitation per hour and total precipitation. Linear model assumptions were met for these comparisons. Quantiles were shown on plots to show median, 25th, 40th, 60th and 75th quantiles to indicate differences from the 1:1 ratio. Using the pooled data with the range of events and canopy was intended to test the robustness of the conidia-dye relationship and explore the variability in concentrations recaptured using the methodology for field sampling in this pathosystem.
2.7 Dispersal distances
Natural log (ln) of the concentration of conidia or dye were plotted against distance and analyzed with quantile regression. Quantile regression on the 50th, 75th and 90th quantiles were presented for distance relationships to illustrate how distance relationships differed between median (50th quantile) and upper limits (e.g. 90th quantile) while considering the variance in the re-capture data. Quantile regression was used because statistical assumptions of normality and homogeneity of variance (close distances often had more variable concentrations than further distances) were not met for ordinary linear regression over the series of experiments and comparisons, and there were a large number of potential outliers which would create bias through leverage (Koenker, 2022). This was partly because zero or low detection of conidia or dye occurred at any distance owing to variability of dispersal, recapture and detection in natural settings. Quantile regression relaxes these statistical assumptions, avoids disproportionate influence of outliers (Koenker, 2022) and enables conditional and heterogenous effects of covariates (Huang et al., 2017). Default recommended inference methods (‘nid’) were used for the quantile regression in R (RCoreTeam, 2021; Koenker, 2022).
Exponential model equations were used to characterize the exponential decay of conidia or dye dispersal with distance, typical of pathogens dispersed by splashing water (Aylor, 1990; Madden et al., 2007). The parameters were derived from quantile regression, for 50th (median), 75th, and 90th quantiles, of the natural log of conidia or dye concentration (+1, to avoid non-definable ln(0)) against distance from the source, as follows:
and the exponential equation used was
where b is the gradient (slope parameter from ln(y)~distance linear quantile regression), a is the intercept (inverse of ln(a) intercept in linear quantile regression) and s is the distance from the source. The source strength or amount of inoculum at distance s = 0 is a. The spread parameter, b, is the steepness of the gradient with units 1/distance (s-1). The spatial scale over which spread is occurring can be indicated by 1/b, which has units of distance (Madden et al., 2007). The power law was also explored, however, it did not provide a better fit to the dispersal data and supplied other complications with biologically meaningful interpretation (Madden et al., 2007). Mean and standard deviation were also plotted to illustrate another measure of the data.
Concentration (y) over distance for frame vs. canopy for both conidia and dye (events 1-4) were fitted separately to get estimated dispersal gradients for comparison between the canopy settings. Likewise, the response for artificial (sprinkler) and natural rain for both conidia and dye (events 3 and 4) were fitted separately. Consideration of covariates (e.g. rainfall rate (mm/h), wind speed (km/h), wind direction) was attempted when fitting the exponential models, however, the data available were not sufficient for robust analysis.
To estimate average dispersal gradients for dye and conidia for comparison, all events with rain traps (events 1-11) were pooled and a gradient for each of dye and conidia were fitted separately. Pooled data with the range of events and canopy was intended to explore the variability in potential dispersal gradients derived using the methodology for field sampling in this pathosystem, illustrating a range of possibilities across the settings. Influence of the covariates was explored using quantile regression for the pooled data.
For dye and lens tissue only, concentration over distance was fitted to each cardinal direction for along row and across row comparisons (events 4, 5, 6, 12). Again, covariates were explored using quantile regression, but data were limited and effects were unable to be separated robustly.
3 Results
Concentrations of conidia and dye decreased with distance from the release point; however, counts of zero conidia and dye were found at all distances. Over all experiments, rain traps recaptured 30–50% of the dye that was released, whereas for conidia released, it was 3–30%. In the tree canopies, 11–43% of the total recaptured conidia and 45–63% of the total recaptured dye were collected directly under the source (Table 2). In contrast, under the frame (events 1 and 2), 97% of the recaptured conidia and 99% of the recaptured dye were collected directly under the source (Table 2).
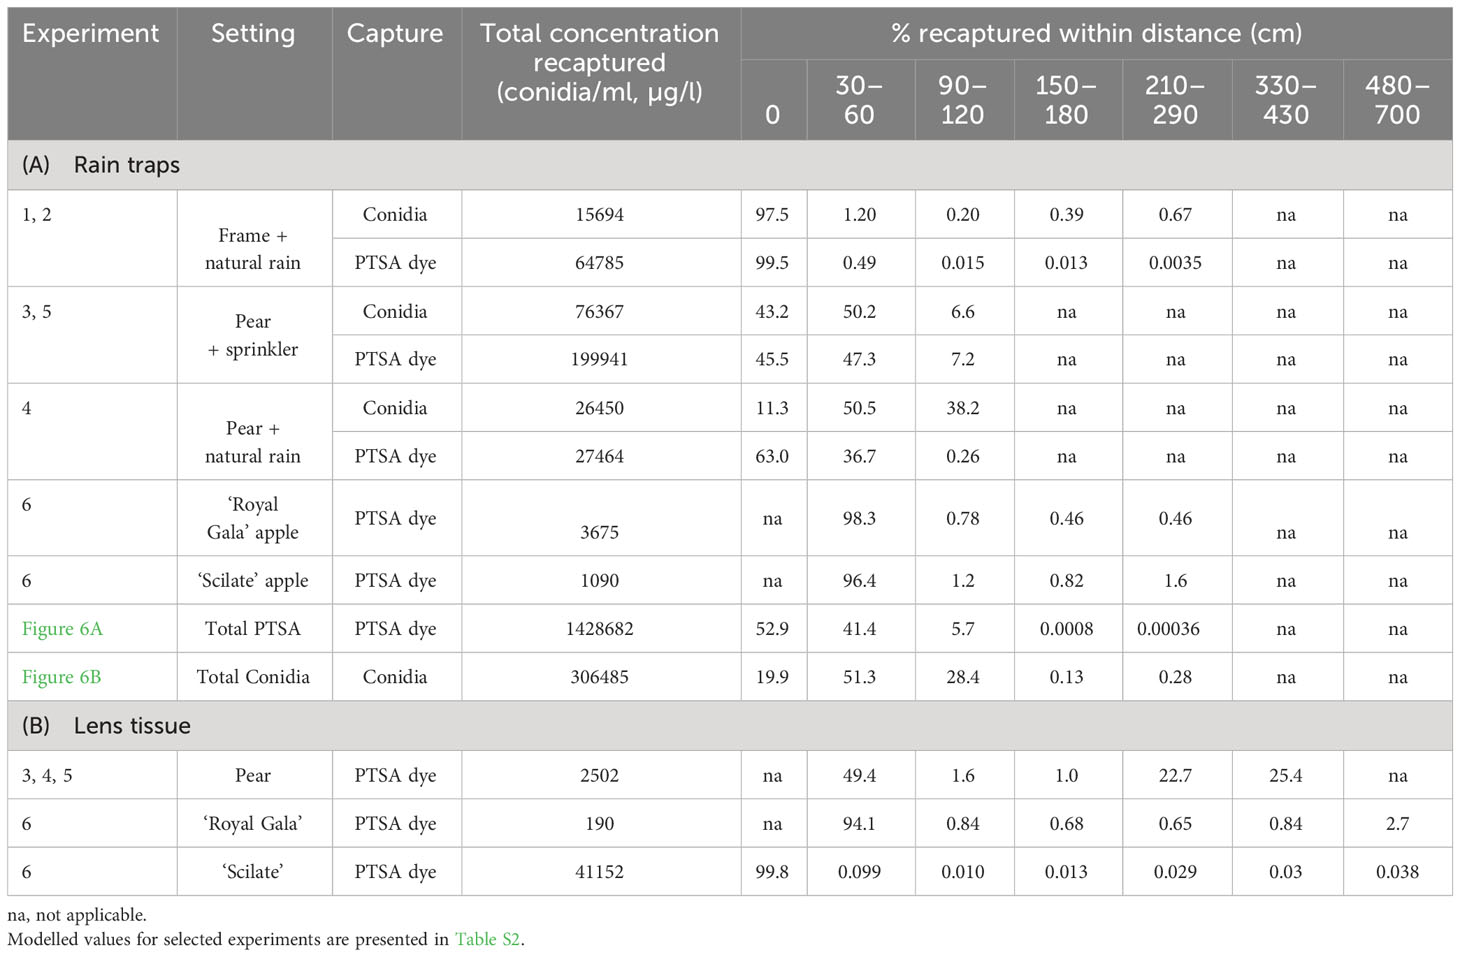
Table 2 Percentage concentration recaptured at distances from the source of inoculum for Neonectria ditissima conidia and 1,3,6,8-pyrenetetrasulfonic acid (PTSA) dye. For rain trap capture (A) and lens tissue dye capture (B).
3.1 Conidia-dye relationships
The R2adj for the relationship between the concentration of the recaptured condia and PTSA dye was 0.58, and when covariate interactions accounted for, 0.89. The median quantile for the relationship between conidia and dye captured in rain traps differed from the 1:1 gradient but was mostly between the 25th and 75th quantiles (Figure 2, events 1–4) indicating variation within these quantiles in the average ratios of conidia to PTSA between captures. Whether the release was from the pear tree or frame did not have a significant interaction in the conidia-dye relationship (p=0.91). This indicated that the conidia-dye relationship was consistent for either setting, but the tree canopy did result in greater deviation from the median. There were no significant interactions between rainfall volume, windspeed or sprinkler/rain and the conidia-dye relationship (p>0.1). Rainfall rate (mm/hr) had a significant interaction effect (p=0.02), intermediate rainfall was closer to 1:1 and higher and lower rainfall resulted in higher dye concentrations than conidia recaptured. The conidia-dye relationship had a significant interaction effect with distance from the source (p=0.006), where concentrations from 30 cm indicated the closest fit to the 1:1 line. Compass direction also resulted in a significant interaction with the south and west resulting in relatively more dye than conidia (p>0.001).
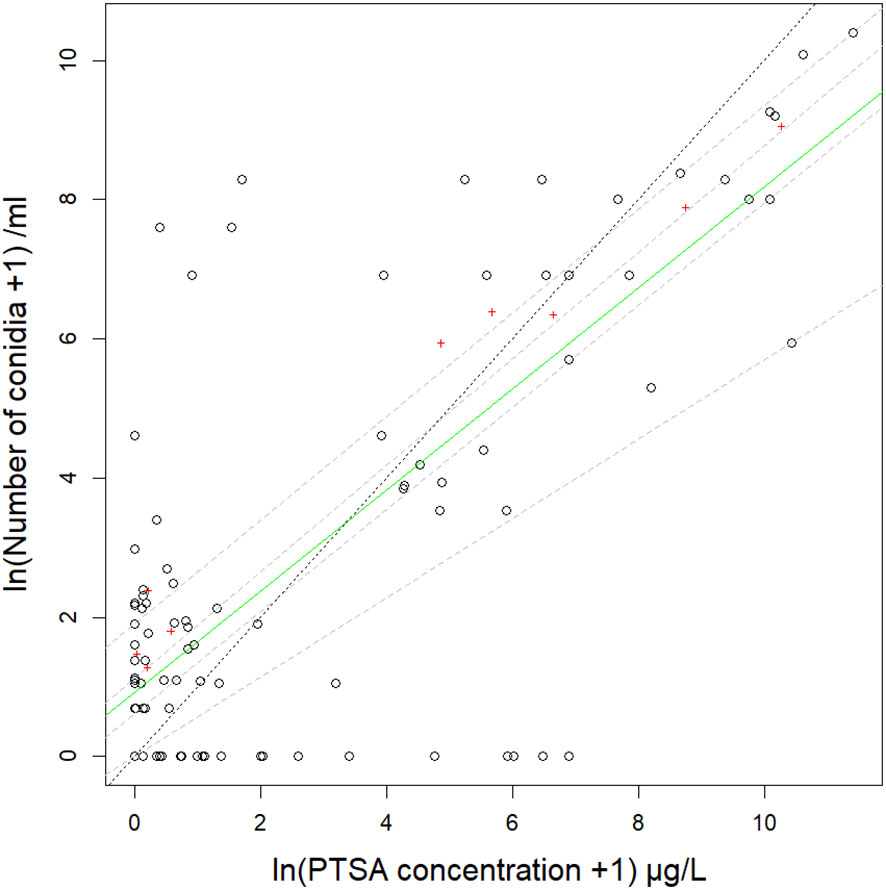
Figure 2 Relationship between number of Neonectria ditissima macroconidia and concentration of 1,3,6,8-pyrenetetrasulfonic acid (PTSA) dye captured in rain traps on the ground at various distances from a source in a pear tree canopy and a frame over grass (events 1–4). Data are from four events with different natural or artificial rainfall and delivery by a liquid suspension or a frozen/thawing suspension. The solid green line is the median (50th) quantile and dashed grey lines are 25th, 40th, 60th and 75th quantiles on natural log (ln) transformed data. The dotted black line shows the 1:1 ratio of conidia to PTSA dye. Mean values summarised by distance from the source are indicated by red crosses.
3.2 Lens tissue and rain trap dye relationships
The R2adj for the relationship between the concentration of the PTSA dye captured on lens tissue compared to PTSA dye captured in raintraps was 0.56 and when covariate interactions accounted for, 0.77. The median quantile for the relationship between PTSA dye recovered from lens tissue and water from rain traps was similar in slope to all the shown quantile regression lines but differed in intercept from the 1:1 line which was most similar (in intercept and slope) to the 25th quantile (Figure 3, events 4–6). This indicated that on average more dye was recovered from the lens tissues than from the rain traps. The intercept differed with distance from the source (p=0.0003), in particular the close (0 cm) and far (240 cm) distances. There was a marginally significant interaction with compass direction (p=0.05) with the E–W axis (across orchard rows) producing a flatter relationship between the lens tissue-rain trap PTSA concentration. This indicated more dye was captured in the rain traps relative to the lens tissues, across the rows, for higher concentrations. Alternatively, at low concentrations, lens tissues recaptured more dye than rain traps. There was also more variation around the median with the E-W axis (across orchard rows) than the N–S axis (along the orchard row). Windspeed did not show significant interactions with the lens tissue-rain trap dye relationship (p>0.12). Wind direction and rainfall rate or volume did not have enough levels to test statistically.
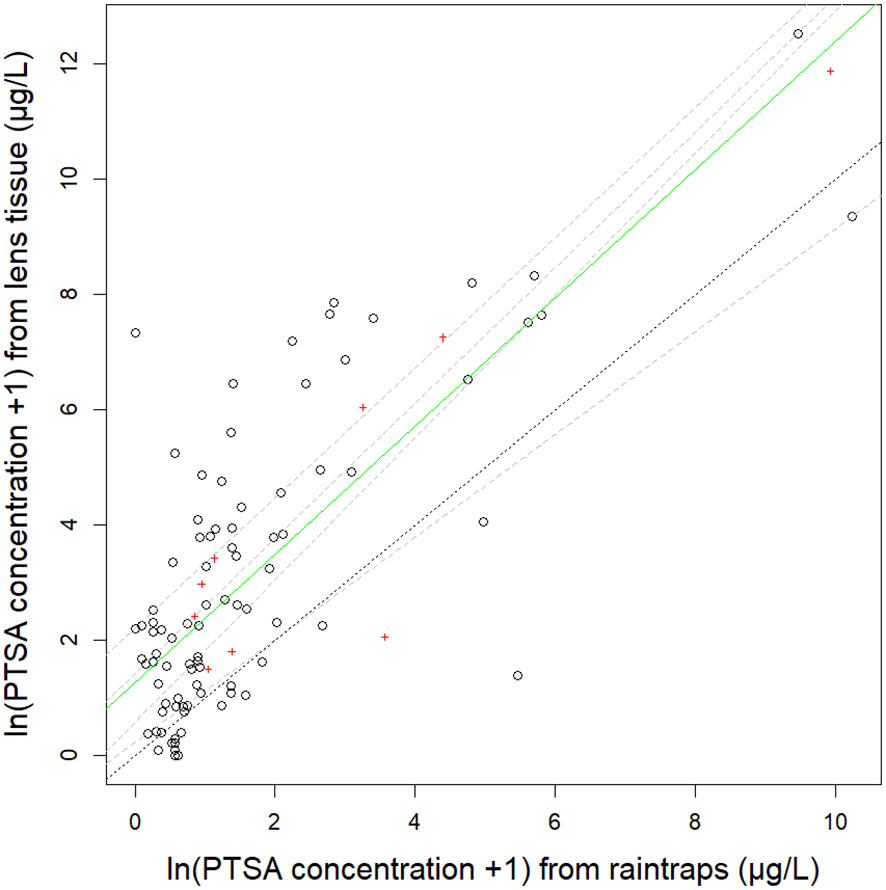
Figure 3 Relationship between 1,3,6,8-pyrenetetrasulfonic acid (PTSA) dye recovered from lens tissue (as artificial leaves) and water from rain traps. The green solid line is the median (50th) quantile regression line, grey dashed lines are 25th, 40th, 60th, 75th quantiles on natural log (ln) transformed data from three different trees: pear (events 4-5), ‘Royal Gala’ apple and ‘Scilate’ apple (event 6). The black dotted line shows the 1:1 ratio. Mean values summarised by distance from the source are indicated by red crosses.
3.3 Distance relationships
The gradient of dye concentration from rain traps was steeper than the gradient of conidia concentration in both the frame and the pear tree (Figure 4, events 1–4). Mean concentrations from the frame events over distance retained some curvature after log transforming and concentrations were more variable from the tree events than the frame (Figure 4). The intercept from the frame was lower compared with that of the tree canopy, particularly the 75th and 50th quantiles, for both conidia and dye. The gradients for the frame were flatter than those from the tree canopy, except for the 90th quantiles, for both conidia and dye (Figure 4, Table 3). The differences in slope between the tree canopy and frame were greater than the differences between dye and conidia (Table 3). Both conidia and dye were captured more at closer distances with tree canopy than without. With no canopy, the equivalent of 31 conidia (0.2% of captured) were captured between 90–120 cm from the source, whereas with tree canopy, 10,000 conidia were captured at this distance (38% of total conidia captured in events 1–4, over all four cardinal directions) (Table 2). There were not enough data to show trends in the dispersal distances with rainfall volume, rate or wind speed. The predominant wind directions were generally from the south-west and showed no clear trends with the concentration of dye or conidia to the distances collected.
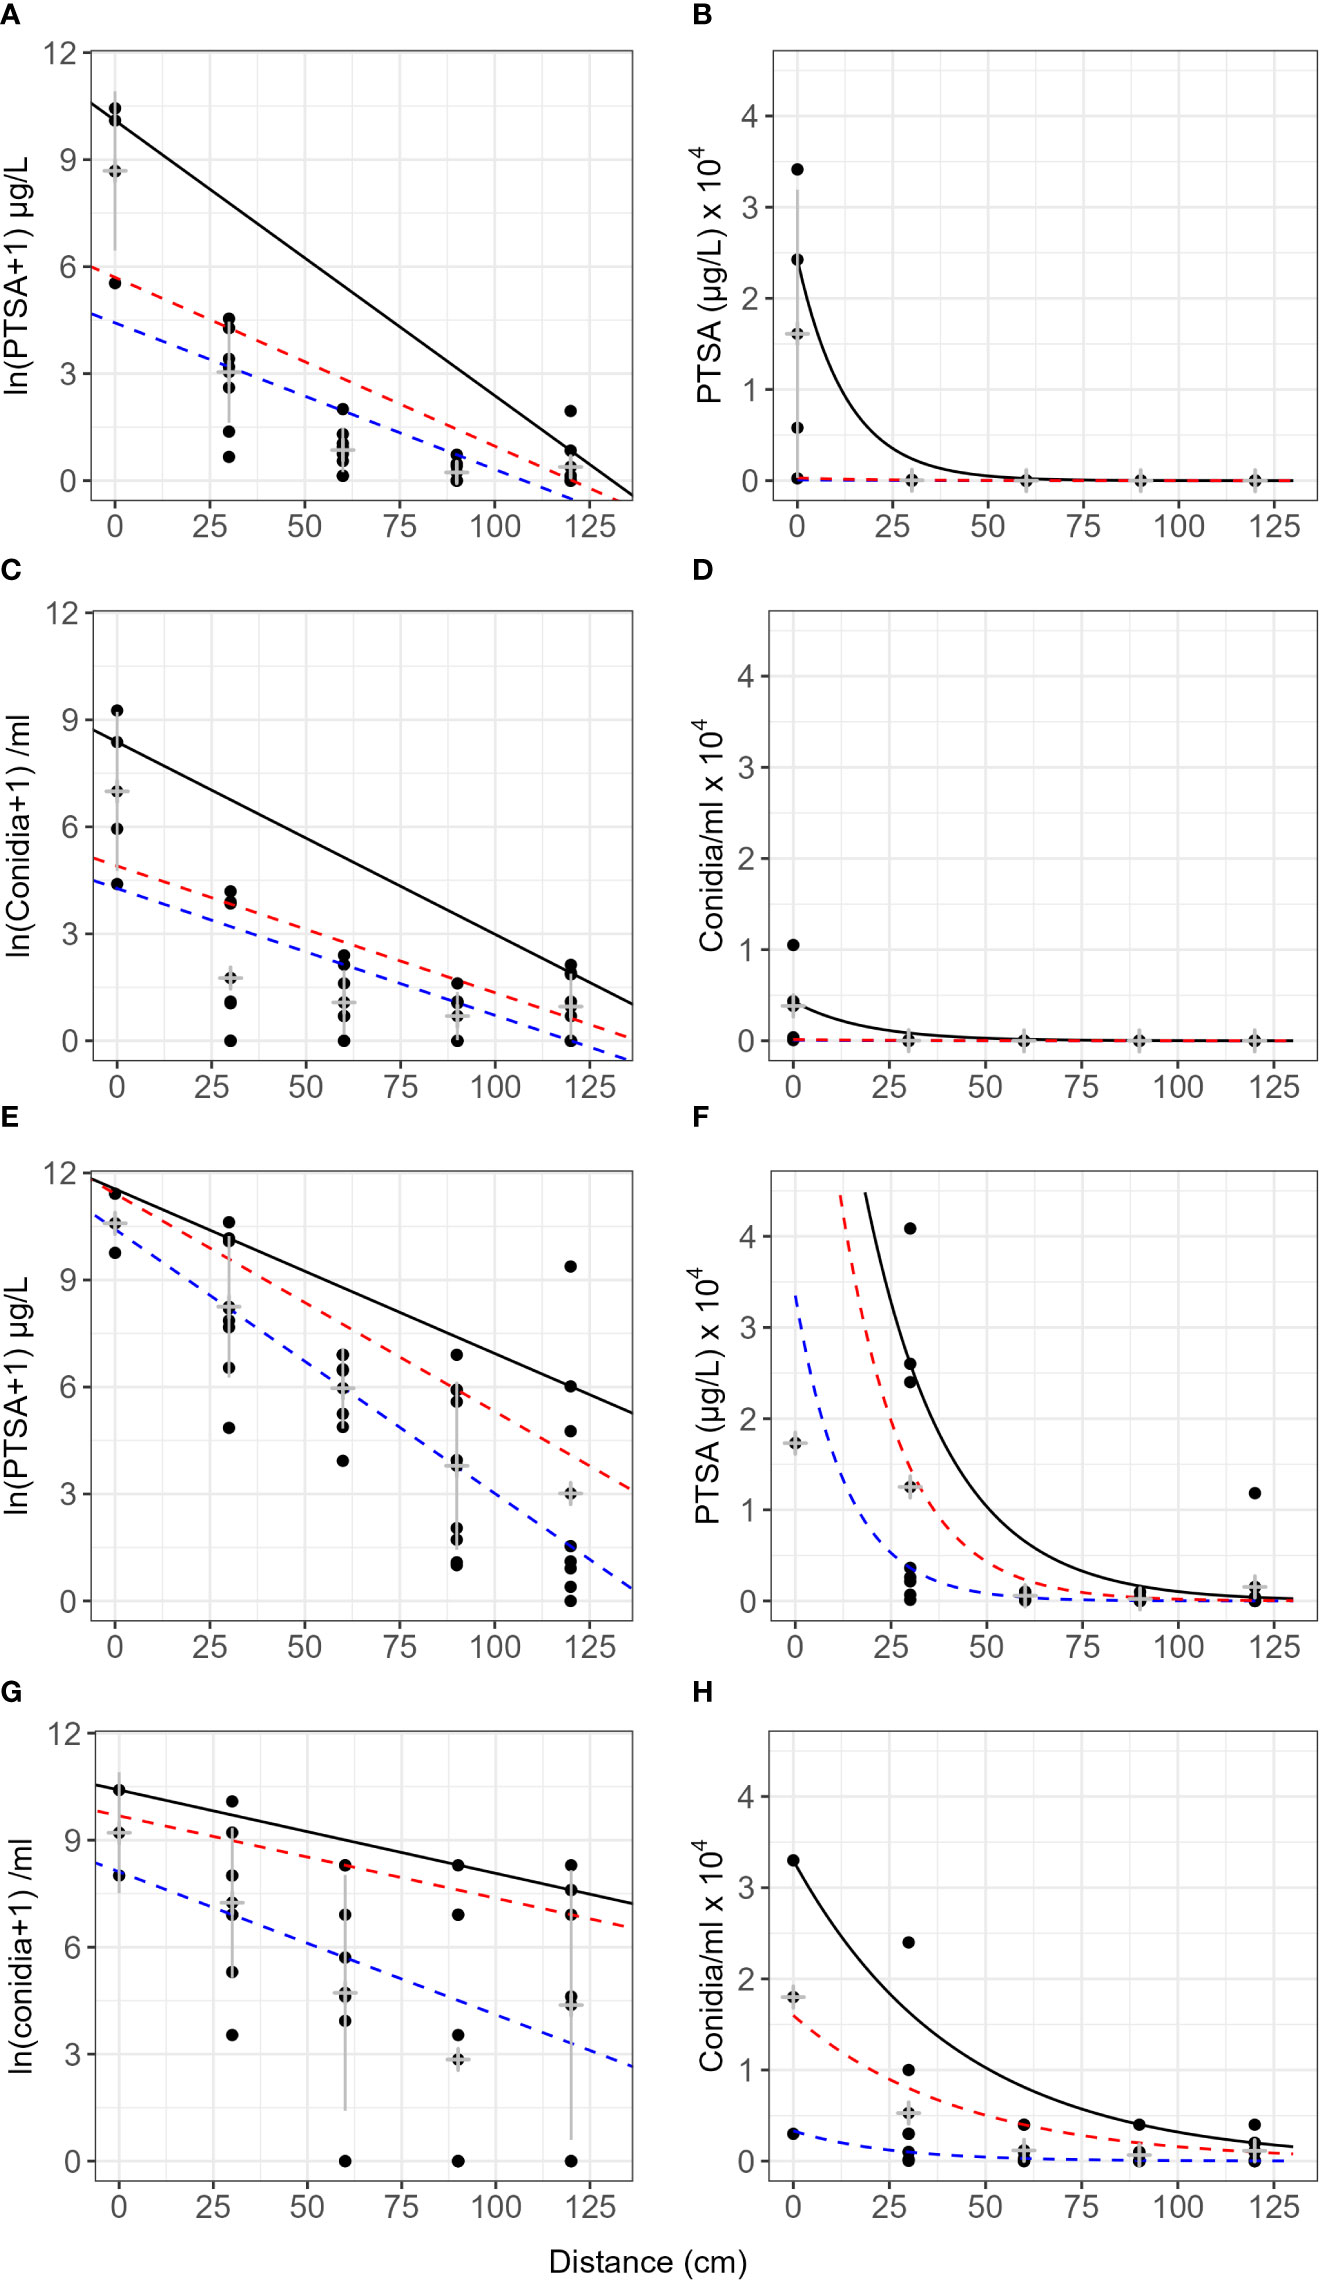
Figure 4 Concentration of conidia and 1,3,6,8-pyrenetetrasulfonic acid (PTSA) dye over distance from a point source comparing no canopy (frame) with tree canopy. Graphs (A–D) are results with natural rain and no canopy (frame, events 1 and 2). Graphs (A, B) are for PTSA tracer dye with distance, and (C, D) are for Neonectria ditissima macroconidia with distance. Graphs (E–H) are results with both artificial and natural rain in a pear tree canopy (events 3 and 4). Graphs (E, F) are for PTSA tracer dye with distance and (G, H) are for conidia with distance. Results are from rain trap experiments where both condia and dye were released together. The black line represents the 90th quantile, the red line the 75th and the blue line the 50th (median). Grey crosses indicate the mean and standard deviation for each distance.
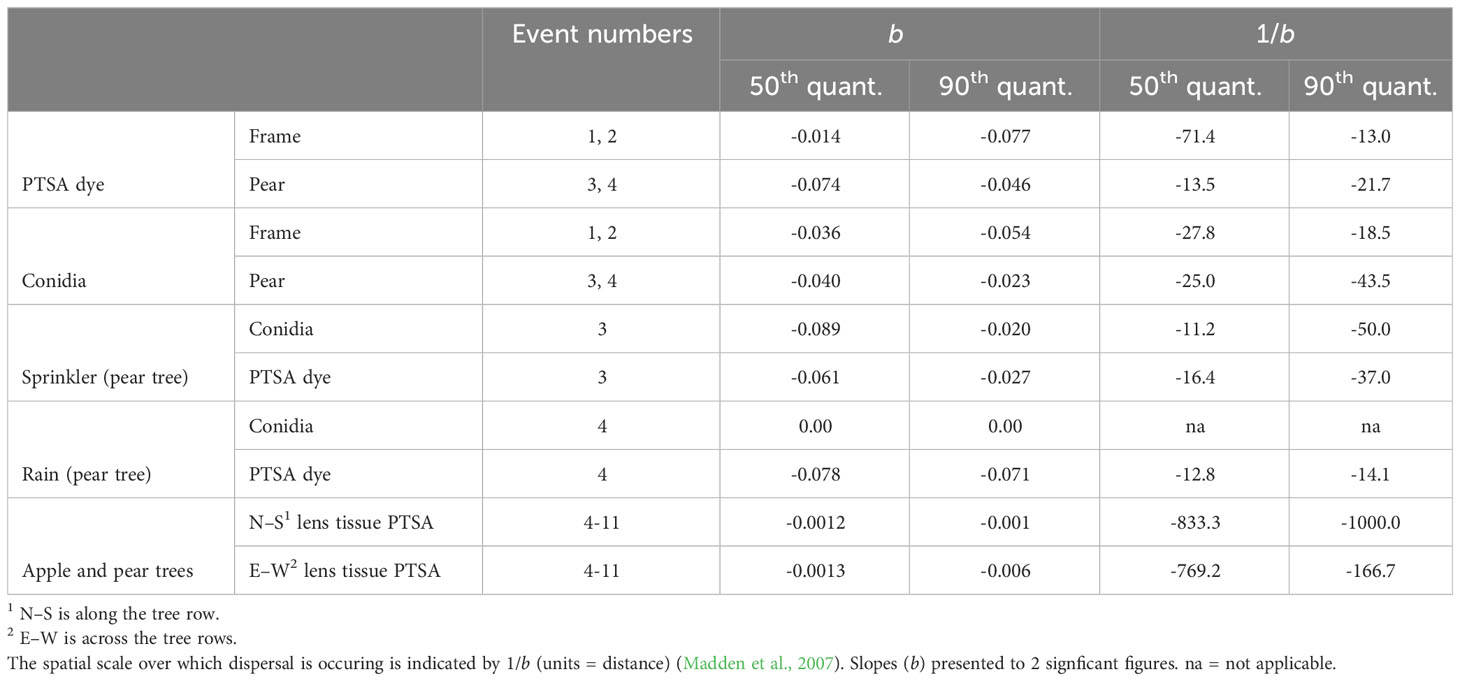
Table 3 Gradients of concentration of Neonectria ditissima conidia and 1,3,6,8-pyrenetetrasulfonic acid (PTSA) dye with distance estimated from quantile regression. Median (50th quantile) and 90th quantile slopes.
There were differences in slope of concentration over distance between sprinkler and a rain event for dye and conidia captured in rain traps. The rain event produced a steeper slope for dye and a shallower slope for conidia (Figure 5, events 3 and 4). Mean log transformed concentrations were more linear with distance for the rain event, while those from the sprinkler event retained some curvature (Figure 5). The rainfall rate (mm/h) was similar for the natural rain and sprinkler events; however, the total rain volume was higher during the natural rain event.
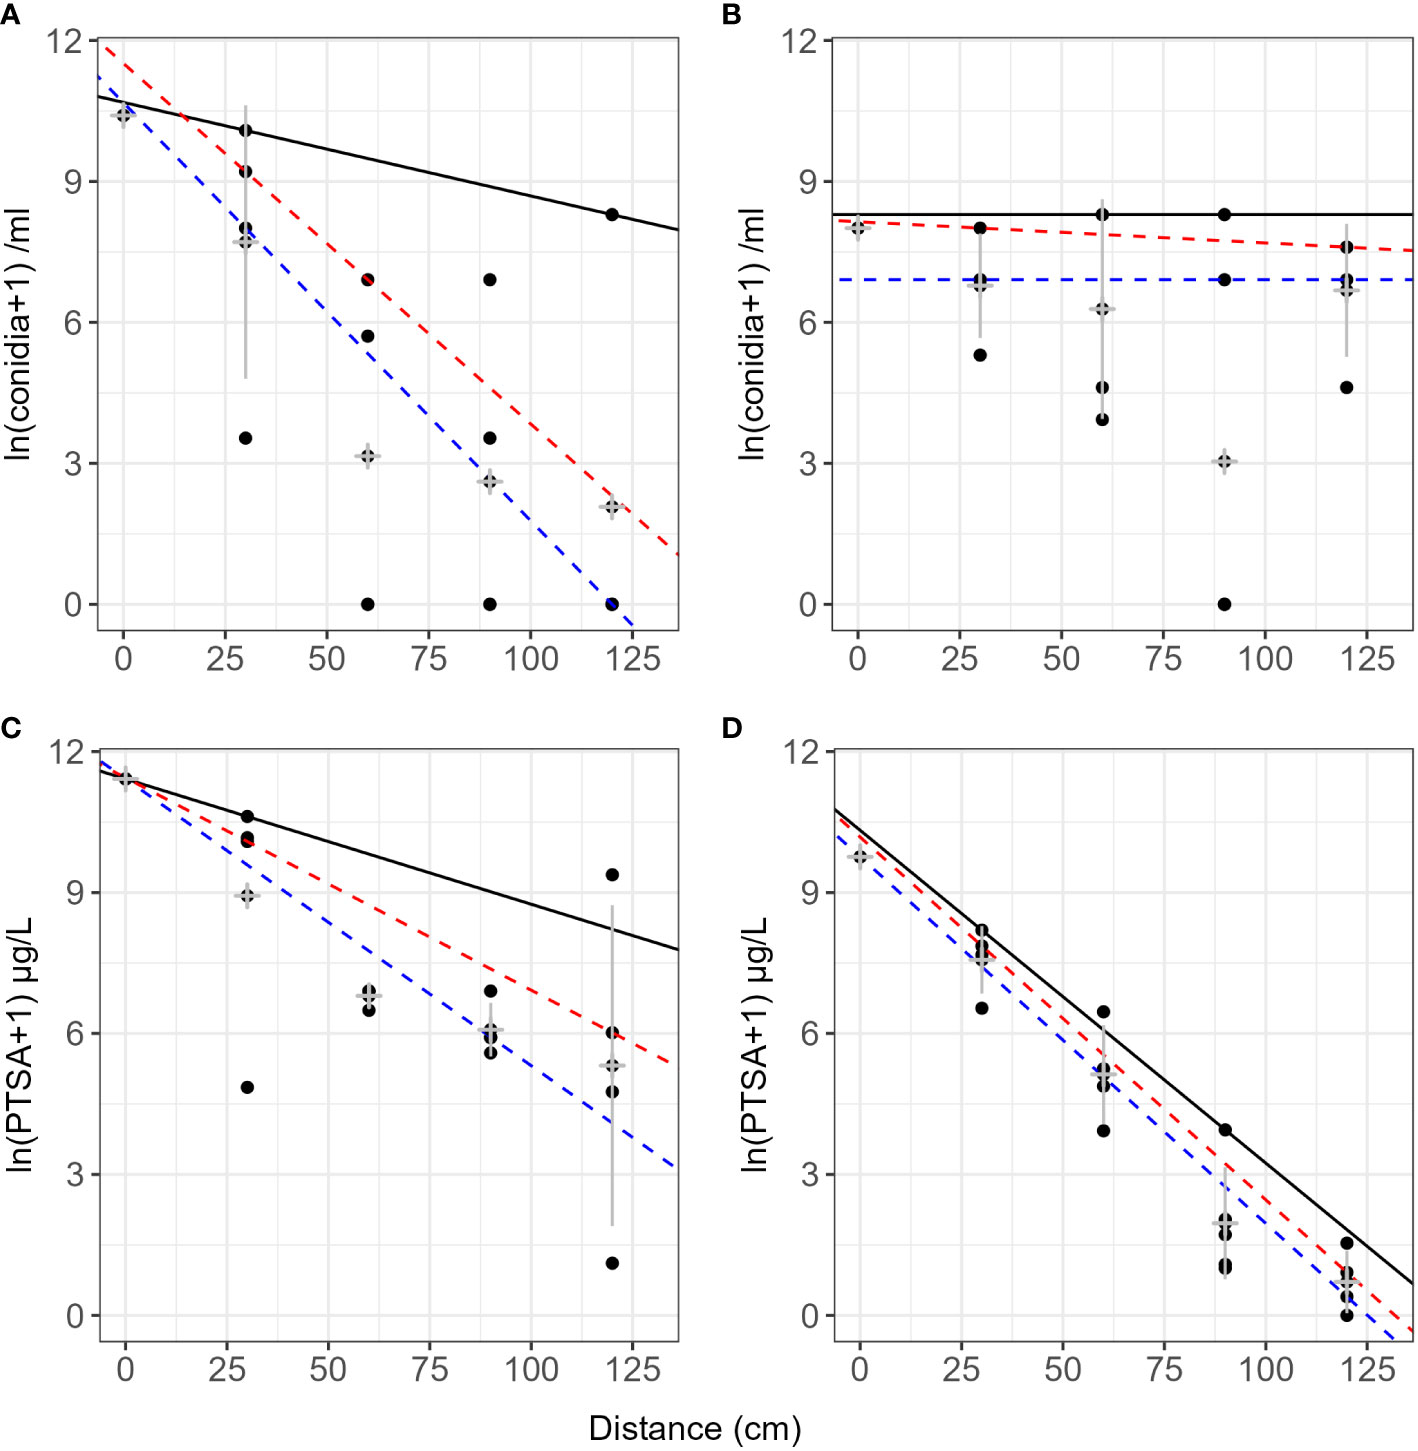
Figure 5 Comparison of concentration and dispersal distance with natural rainfall or overhead sprinkler precipitation event delivery. All examples are captured from beneath the pear tree canopy (events 3 and 4). (A) Neonectria ditissima macroconidia in rain traps under a single sprinkler event. (B) Conidia in rain traps after a single natural rain event. (C) 1,3,6,8-pyrenetetrasulfonic acid (PTSA) dye concentration in rain traps after a sprinkler event. (D) PTSA concentration in rain traps after a natural rain event. The black line represents the 90th quantile, the red line the 75th and the blue line the 50th (median). Grey crosses indicate the mean and standard deviation for each distance.
Dispersal gradients for all directions and all events with trees and rain traps (events 3–11) resulted in higher proportions of concentration at closer distances for conidia than dye (Figure 6). Natural log transformed data with quantiles, means and standard deviation are presented in Figure S1. Most conidia and dye were captured directly under the source or within 60 cm of the source (Table 2). Up to 1.6% of dye captured in rain traps was captured over 2 m from the source, while up to 0.7% of conidia were captured in the same rain traps over 2 m from the source (Table 2). Modelled concentrations with distance and the model equations are presented in Tables S2 and S3. For PTSA and distance relationship for the 50th quantile regression there was a significant influence from rainfall rate (p<0.0001), other covariates had no detectable effects or not enough comparisons. For conidia and distance, again for the 50th quantile regression, rainfall rate and compass direction showed no significant effect, however, wind direction (SE and SW) indicated a marginal effect (p=0.06). Rain volume and wind speed had significant effects (p<0.0003).
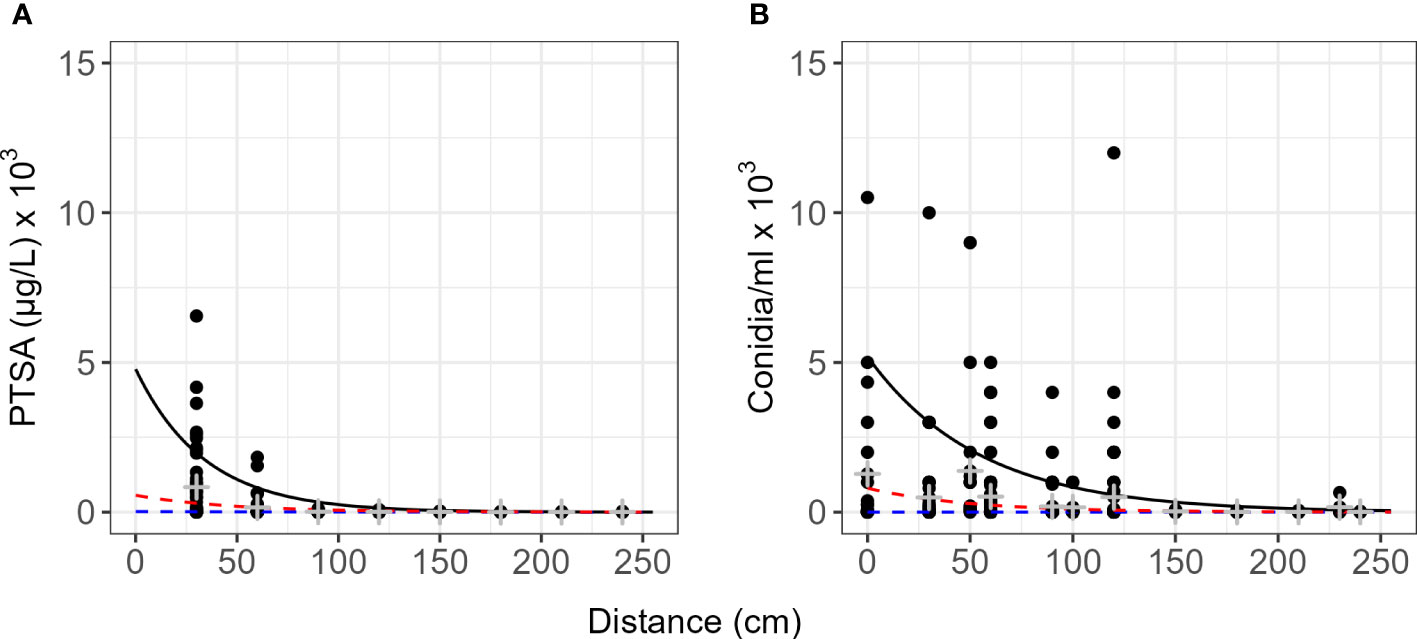
Figure 6 Quantile dispersal gradients summarized for the range of events as captured by rain traps. (A) 1,3,6,8-pyrenetetrasulfonic acid (PTSA) dye and (B) Neonectria ditissima macroconidia. Data include all experiments with rain traps for dye or conidia (events 1–11). The black line represents the 90th quantile, red line 75th and the blue line the 50th (median) quantile. Grey crosses indicate the mean and standard deviation for each distance. Natural log transformed concentration against distance are plotted in Figure S1.
3.4 In orchard: across row, along row (lens tissues)
On lens tissue, up to 2.7% dye was recaptured up to 7 m from the source and up to 25% beyond 3 m (Table 2). Dispersal gradients determined from lens tissues in the orchard were shallower along the orchard row (continuous canopy, N–S) than across the rows (gap in canopy, E–W) (Figure 7, events 4–6 and 12). Prevalent wind was from the south-west direction. Some curvature was still present in the mean concentrations in all directions after log transforming, and variability was high, particularly at close distances to the source and along the orchard row, N-S. No covariates showed a significant effect on the dye concentration captured with distance due to lack of representative events and there were no visible trends relating the covariates to the dispersal distances.
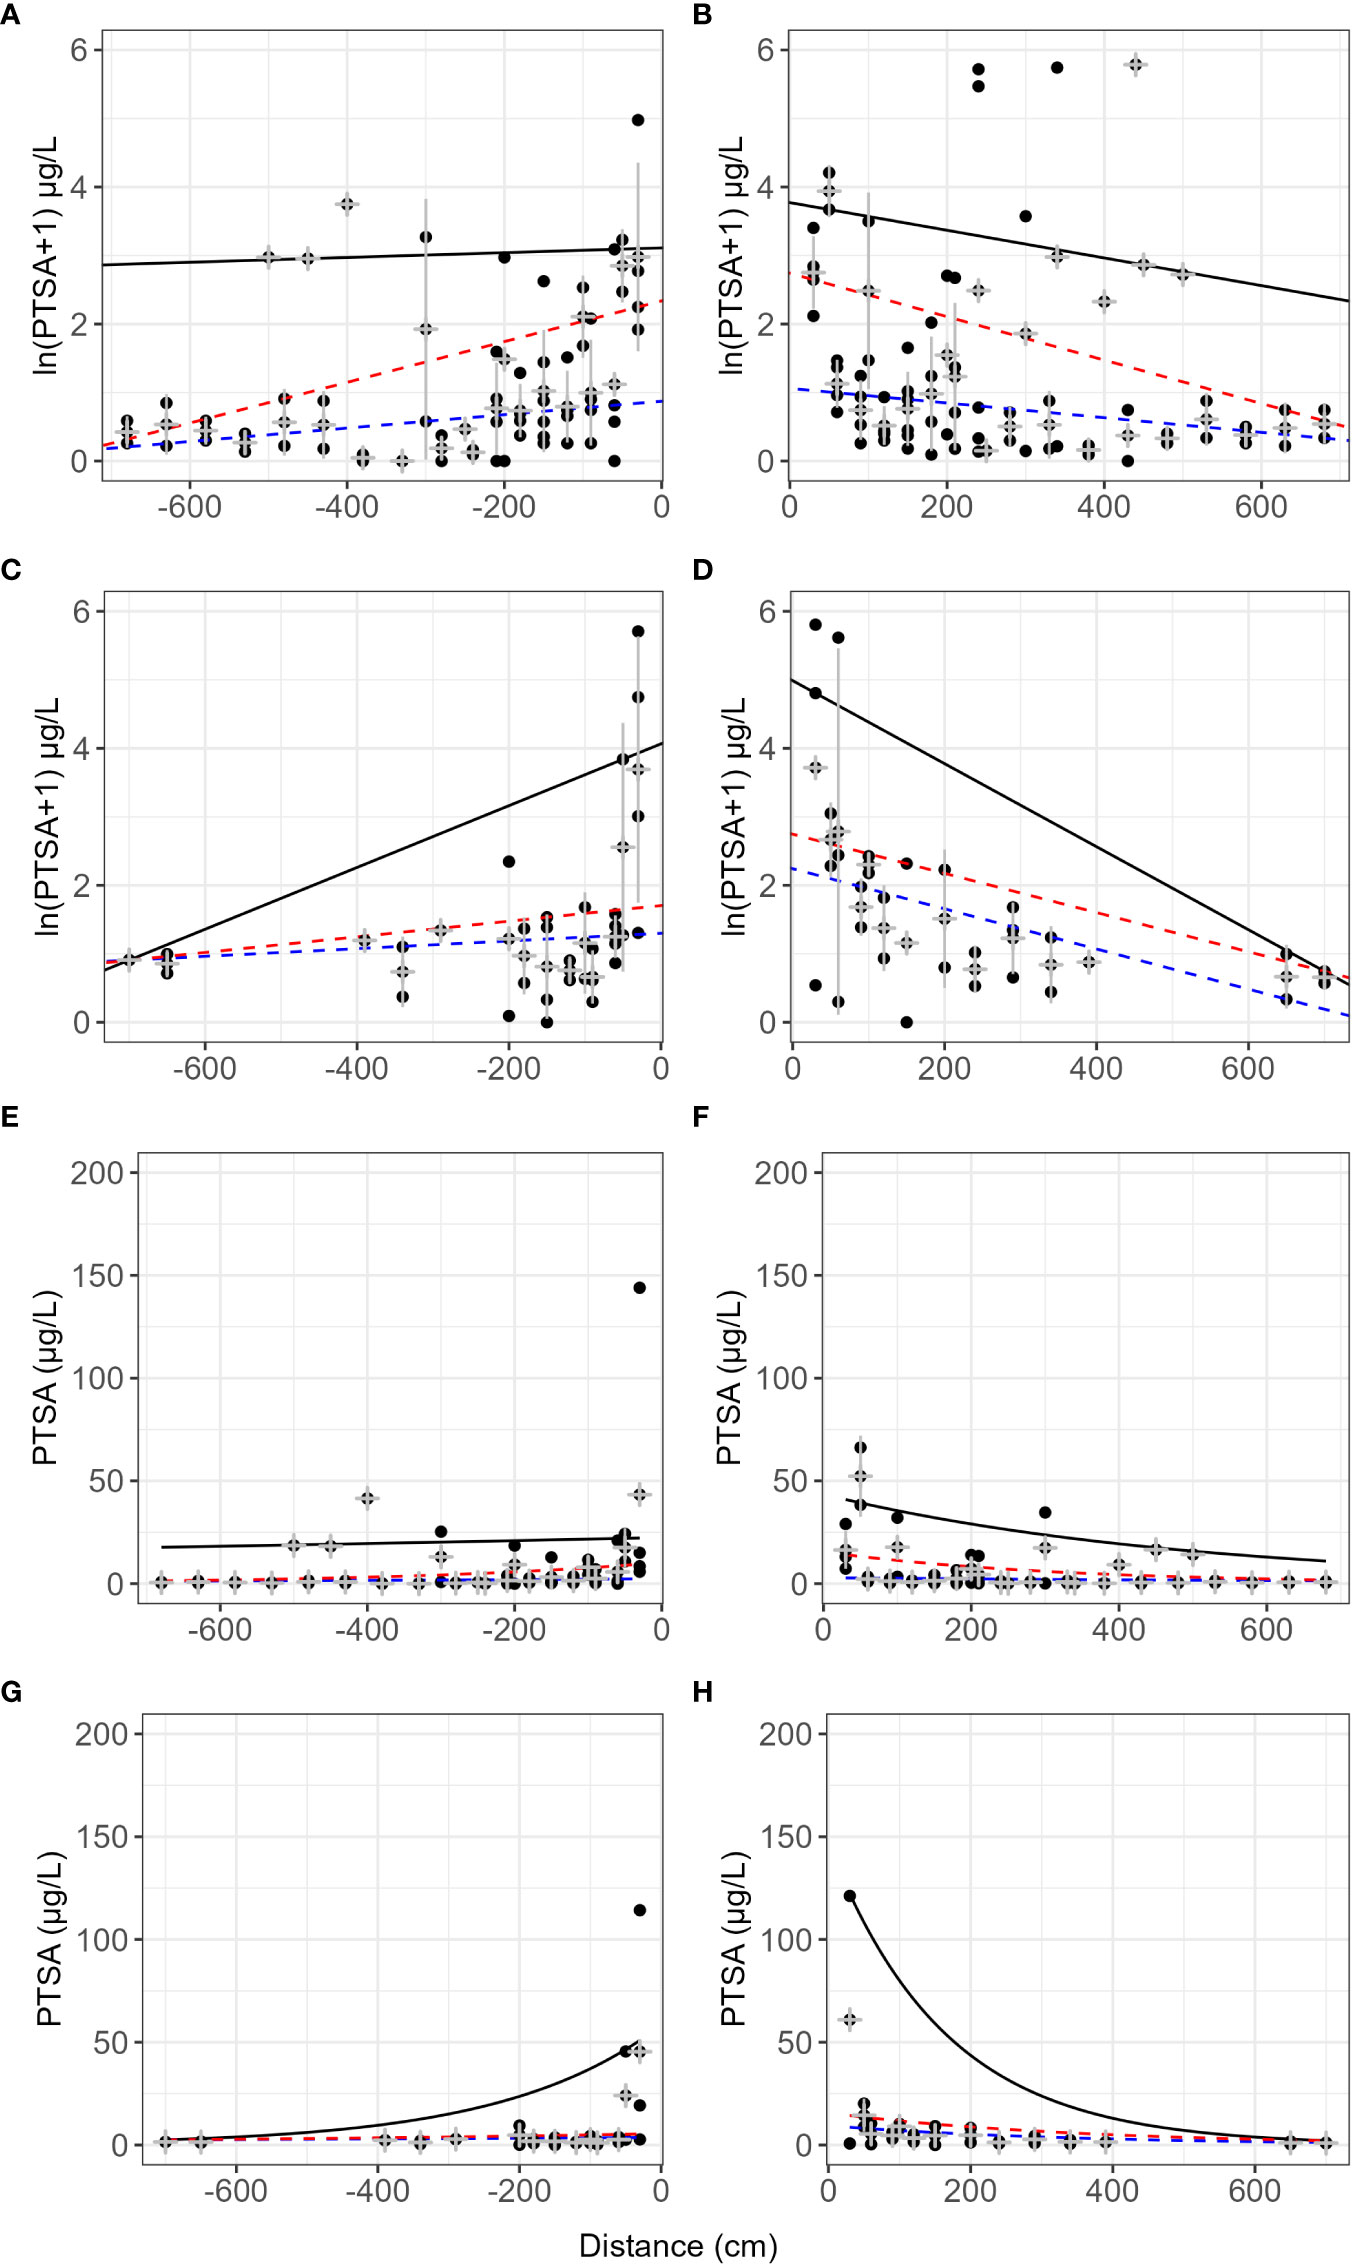
Figure 7 Lens tissue captured 1,3,6,8-pyrenetetrasulfonic acid (PTSA) dye with distance from source and direction. N–S (A, B, E, F) is along the orchard row and E–W (C, D, G, H) is across the orchard rows. Data from events 4–6 and 12 (pear and apple trees). Plots (E–H) are exponential models fitted to the same data, respectively. The black line represents the 90th quantile, the red line the 75th and the blue line the 50th (median) quantile. Grey crosses indicate the mean and standard deviation for each distance.
4 Discussion
Real orchard settings present many complexities when trying to understand rain-splash dispersal mechanisms and patterns. We found that estimated dispersal distance from a point source and the nature of the gradient varied with the field conditions, which is typical of rain-splash studies with multiple factors involved (Shaw, 1987; Ahimera et al., 2004; Vidal et al., 2017). While concentrations of both conidia and tracer dye captured tended to be greater closer to the source, variation was high at close distances and zero values could be found. Conversely, concentrations and variation were generally lower at distances further from the source, however, the tree canopy provided variation at all distances. One of the purposes of this study was to investigate how to negotiate this variation when estimating dispersal distances that could be representative in real situations, over time. One option to help quantify a dispersal gradient would be more intensive sampling over a range of conditions allowing better replication over a wider natural variation in rain events. Unfortunately, resources were not available to take a more intensive sampling approach in this study. Our analyses using quantile regression took into account this variation, providing an option to generalize relationships of dispersal with distance for apple canopies, while retaining information about the nature of variability. The use of quantile regression on data collected here under the various different scenarios captured the dispersal slopes at different quantiles. This effectively estimated a cumulative potential dispersal gradient while still accounting for the variability in field conditions beyond our control. The upper quantiles present maximum potential concentrations dispersed to distances from a point source, or ‘worst case’ scenarios, while the lower quantiles present a more conservative dispersal gradient, where the 50th quantile represents the median. This could relate to the effectiveness of infection when conidia arrive at these distances with the 90th quantile presenting the possible case where infection success is high and lower quantiles when infection success is lower. Thus, we could estimate a range of dispersal gradients between these quantiles in real canopy situations. It would be informative to compare these dispersal gradients with infection gradients to compare the variation. Previous studies have fitted exponential decay functions to the mean concentration of spores for each distance without characterizing variability around their means (Pietravalle et al., 2001; Viruega et al., 2013). Furthermore, they often did not explicitly mention variability or outliers, or alternatively they conducted highly controlled experiments to reduce this inherent variability (Vidal et al., 2017). Making these assumptions or not adequately considering variation when quantifying dispersal gradients can lead to different interpretations in orchard situations. While data from highly controlled, small-scale experiments or individual droplets are useful in understanding the mechanisms of splash potential (Aylor, 1999; Pietravalle et al., 2001; Vidal et al., 2017), empirical data from real orchard situations represent dispersal potential from the tree to the orchard scale (Ahimera et al., 2004). This includes recognizing and quantifying variability (Shaw, 1987; Pietravalle et al., 2001), which can then be taken into account when modeling disease spread (Farber et al., 2019; Karisto et al., 2023).
In the presence of the tree canopy, there was evidence that dispersal gradients were shallower, and splash travelled further, producing fatter-tailed dispersal kernels, than unimpeded dispersal without a tree canopy. This was observed particularly for N. ditissima conidia compared with tracer dye. The dye concentrations with distance more often retained curvature in the means when log transformed, indicating that an exponential decay was not fully capturing the dye dispersal dynamics. While exponential dispersal gradients are widely accepted as appropriate for rain splash dispersal and are easier to interpret than more complex models (Aylor, 1999; Pietravalle et al., 2001; Ahimera et al., 2004; Madden et al., 2007; Vidal et al., 2017), further work is needed to find models that can account for the changes in dispersal pattern with changes in conditions such as canopy structure or rainfall type. Both dye and conidia capture decreased from the source in all our experiments; however, within the canopy we were able to recapture a higher percentage of conidia at further distances, suggesting that redistribution of splash droplets (secondary splash) within the canopy is important in shaping the dispersal gradient for rain-splash in apple canopies. A sharper initial drop-off of dye concentration was found in our experiments both under the frame, and across the gaps between rows in an apple orchard, compared with a tree canopy. Similarly, Ahimera et al. (2004) found spore counts dropped off sharply from the canopy edge of pistachio trees. In contrast to our results, Vidal et al. (2017) found that spores travelled up to four times the distance when unobstructed by a wheat canopy, where dense canopies restricted horizontal transfer and intercepted more spores. Thus, conclusions between tree crop and annual crop canopy need to be carefully considered. Prevalent wind direction in our study also aligned with the canopy direction, however, the clearest evidence comes from the events with the frame which provided all directions with no canopy. Air movement within a row structured orchard is likely to influence directional patterns in addition to the effects of canopy on splash (Aylor, 1999; Mahaffee et al., 2023; Vidal et al., 2017). Furthermore, the prevalent wind condition and the potential for forced air movement from air blast sprayers need to be considered for pathogen dispersal within orchards. Tree row spacing and planting density are important considerations for disease spread (Calonnec et al., 2013), and dispersal distances with canopy structure further emphasize this. Our results indicated higher variability in conidia dispersal within a canopy than without canopy, which agrees with Shaw (1987), who found more variability between experiments and repeats when measured in a wheat crop canopy than over grass. This illustrates the variability that canopy structure can introduce in field settings and highlights that canopy heterogeneity is important to understanding spore dispersal (Birch et al., 2003; Mahaffee et al., 2023), and methods are needed to accommodate this when estimating dispersal gradients. Plant and plant-row architecture have effects on spore interception, deposition and airflow, influencing the shape of the dispersal function and have significant roles in disease epidemic development (Aylor, 1999; Vidal et al., 2017; Mahaffee et al., 2023). Larger proportions of potential inoculum tended to travel further distances when measured under canopy than over grass, indicating the importance of redistribution of splash within the tree canopy. Without a canopy present, conidia concentrations were lower than dye recapture with distance from the source, suggesting loss of inoculum to the grass surface, rather than redistribution and capture in the rain traps. Without redistribution, rain-dispersed spores rarely travel further than 1 m from their source (Vidal et al., 2017). However, N. ditissima conidia have been shown to disperse up to 4 m from a source as measured by a disease gradient in Brazil (Araujo and Pinto, 2022). Based on our suggested differences in dispersal decay with and without canopy, redistribution with an apple canopy could result in even greater potential dispersal distances. However, the number of spores and probability of dispersing to these further distances are still small, relative to concentrations within 1 m of the inoculum source. Furthermore, under optimal New Zealand conditions, very few conidia of N. ditissima are needed for successful infection (Walter et al., 2016), lesions produce large numbers of conidia (Walter et al., 2018; Scheper et al., 2019), wounds are readily available, and rainfall can be frequent (Amponsah et al., 2015; Amponsah et al., 2017). Therefore, small numbers of conidia dispersing could be biologically meaningful, and physical removal of inoculum remains the most effective way to control disease spread.
The use of a surrogate tracer dye could help quantify dispersal patterns in actual landscapes of interest, with natural rain events, where releasing spores into an orchard could be unacceptable or unrealistic, especially in commercial orchards where disease epidemic data has the most beneficial application. The conidia-dye relationship did vary slightly with rainfall rate and the predominant wind directions under these varied conditions, though the canopy effect was most clear. Taking these limitations into account, methods with tracer dye provide tools to look at splash dispersal more generally in orchard settings and could be used to look effectively at changes in rain dispersal patterns, considering factors such as seasonal changes in canopy, row spacing, canopy architecture and proximity to shelterbelts or other landscape features. Thus, the methodology developed in this study could be further used to tease apart and quantify individual components of the variability in empirically estimating dispersal gradients using higher replication over a wider range of field conditions. Factors such as barriers to dispersal, tree spacing and tree architecture should be more critically considered to help mitigate disease spread by rainsplash in orchard settings.
We saw some indication of differences in the estimated dispersal distances under the sprinkler/artificial rain compared with natural rainfall in a pear tree canopy. Dispersal gradients dropped off less steeply under the sprinkler for dye; however, not for conidia, where concentrations were more variable, with a steeper decay in concentration under the sprinkler. More work is needed to characterize the differences between artificial and natural rainfall when using these in experiments to explore rainsplash patterns, however, it is likely that drop size and duration of precipitation influence this. Drop size distribution during rainfall is complex and real rain is patchy. Few higher energy drops or extremes of drop size could have disproportionate influences on dispersal (Pietravalle et al., 2001). It is possible that the misting sprinkler nozzles provide finer initial droplets than rain, providing the potential for more dispersal of the finer droplets via turbulence but less potential for splash impact until droplets coalesce on canopy surfaces (Ahimera et al., 2004). Rain intensity and droplet size have been determined more important for splash dynamics than mean rain volume (Fitt and McCartney, 1986; Lacey and West, 2006). In this study, the volume per hour of precipitation was similar (0.4 mm/h sprinkler, 0.3 mm/h rain), however, the total volume of rain was higher (1 and 4.7 mm, respectively) and the wind was slightly stronger during the sprinkler event. However, the number of replicate events, droplet size and rain intensity measures were not sufficient in this study to confirm these mechanisms. The finer droplets would still coalesce within the canopy (Ahimera et al., 2004) and redistribute from accumulated moisture on the plant surface and create run-off and secondary droplets, which would be larger than the droplets from the sprinkler output or the initial rainfall (Ahimera et al., 2004). While release of N. ditissima conidia is a function of time and water volume (Walter et al., 2018), theoretically, splash dispersed spore deposition is greater during rainfall rates of 1–2 mm/h than for lower or higher rainfall rates (Aylor, 1999). From this knowledge, we could hypothesize that 1–2 mm/h for approximately 1 h would both optimize release and deposition, creating most risk of infection.
Our rain traps captured conidia in water dripping out of the canopy, but using a surrogate leaf (lens tissue) to capture dye allowed us to identify the potential inoculum that could remain deposited within the canopy where actual infection occurs. The dye concentration tended to decrease more steeply with distance than the conidia, possibly because dye could escape in small droplets associated with turbulence, whereas macroconidia are relatively large, could be travelling in clumps or have settling behavior. Alternatively there could have been increased wash-off of dye to the ground compared with conidia deposited within the canopy, again potentially due to spore size and weight or their ability to adhere to plant surfaces. Generally, more dye was recaptured from the lens tissue than the rain traps, where at higher concentrations we detected more dye in the rain traps and at lower concentrations the lens tissue was more sensitive. The potential wash-off and loss of dye from the lens tissue, could be more representative of loss of inoculum from the canopy from wash-off, compared to capturing dye in rain traps as water leaving the canopy. The rain traps capture a sample that is no longer retained in the tree canopy, therefore measuring the concentrations washed through the tree to the ground. While concentrations retrieved from lens tissue would supposedly be what remains in that part of the tree canopy where infection would normally occur. Furthermore, conidia in suspension could be travelling in clumps, while dye in solution may be more evenly distributed, released and captured. Previous studies have found that spores removed and dispersed in clumps were more efficiently deposited than singular spores (McCartney and Fitt, 1987; Lacey and West, 2006). Our dye dispersal methods would not account for clumped conidia dispersal, but the conidia suspensions could have, which could be a more accurate representation for N. ditissima conidia that are produced in sporodochia. Clumping could also partially explain the generally larger variation in conidia concentrations than dye concentrations. While clumping affects the deposition and dispersal via the terminal velocity and impact on a surface (Saint-Jean et al., 2006), it also has implications for successful infection when reaching a wound, with higher numbers of spores increasing the likelihood of successful infection (Swinburne, 1971; Walter et al., 2016). Therefore, surrogate dye may not accurately represent deposition, but may be a useful tool in understanding canopy effects on rain-splash and variability in dispersal distances produced by field conditions.
The advance rate of the disease frontal boundary is potentially a result of multiple waves of inoculum from the same or subsequent sources (Aylor, 1999; Karisto et al., 2023). These waves would occur over different rainfall events, and for a deciduous, perennial tree like apple, different canopy conditions would result in different splash conditions over time in the same location (Aylor, 1999). Therefore, exploring methods to realize this variability such as quantile regression and capturing data from a series of events provides a cumulative estimate of potential dispersal gradients on average over differing conditions. How much inoculum is deposited close to the initial source and how much is deposited in an extended long tail of dispersal has implications for the rate of spread of disease from a point source (Aylor, 1999; Karisto et al., 2023), and dispersal gradients can differ between locations and years (Ahimera et al., 2004). We also recognize that the distance tested in this paper might not capture all the details of the dispersal gradients, but they do provide a representative comparison for the methodology explored in this study. Our results suggest dispersal gradients could also change notably between rain events and canopy structure, adding complexity to how to determine an ‘average’ dispersal gradient for meaningful spread modelling. Furthermore, the long and variable latent period of apple canker means that it is difficult to assess pathogen dispersal dynamics using disease expression (Vidal et al., 2017; Mahaffee et al., 2023), especially under field conditions. Therefore, empirical modelling or prediction of inoculum dispersal needs to be able to capture and interpret data with high variability.
This study highlights the variability and complexities in estimating dispersal gradients for field conditions over time and under natural rainfall conditions. Dispersal gradients change over time and this range of variation needs to be considered when estimating average dispersal gradients for further purposes such as modelling spread. We show that quantile regression offers one option to capture an upper limit or other quantiles for spread, while accounting for the variability. In this example we showed it in application with an exponential dispersal kernel, however, further dispersal models should be explored, including a dispersal kernel dependent on wind and rain influences. We showed that a tracer dye was not able to fully represent conidia dispersal dynamics, however, it was able to distinguish patterns with canopy structure. Surrogate leaves were also practical, effective and sensitive at recapturing dye, however, more needs to be understood about wash-off with varying rainfall. Our study explored methodology to estimate a dispersal gradient of N. ditissima in apple orchards. Predominant wind direction and rainfall rate showed some indication of importance to this and to complete the picture, future research is needed to estimate how the duration, rate and volume of rain and direction and speed of wind affect the relative importance of redistribution and distance travelled by water droplets carrying conidia. Additionally, further experiments with more replication and experimental consistency are needed to understand the relative importance of the canopy and field conditions in empirically quantifying splash dispersal gradients. Furthermore, not enough is known about the risk from ascospores and their dispersal to apple canker disease risk. Perithecia are only seen rarely in the orchards in New Zealand, but the potential for these to contribute to the epidemiology, particularly long-distance dispersal events, could be significant for initiating epidemics and disease spread, especially over longer periods of time.
Data availability statement
The raw data supporting the conclusions of this article will be made available by the authors, without undue reservation.
Author contributions
All authors contributed to designing the experiments. RC and DW conducted the experiments. RC and MW developed the research. RC analyzed and interpreted the data, and wrote the manuscript. All authors contributed to the article and approved the submitted version.
Funding
The author(s) declare financial support was received for the research, authorship, and/or publication of this article. We acknowledge funding through Better Border Biosecurity (B3) and Plant & Food Research to carry out the experiments. RC was funded by the New Zealand Ministry of Business, Innovation and Employment (MBIE) Science Whitinga fellowship (administered by the Royal Society New Zealand) for the data analysis and writing of the manuscript. Publication fees were funded by The New Zealand Institute for Plant and Food Research Growing Futures Program. The funders were not involved in the study design, collection, analysis, interpretation of data, the writing of this article or the decision to submit for publication.
Acknowledgments
We thank our colleagues Robert Beresford, Dion Mundy and Kumar Vetharaniam for comments on the draft manuscript. We also thank Tahlia Curnow for assistance with earlier experiments. Many thanks to the three reviewers for comments to improve this manuscript.
Conflict of interest
All authors were employed by The New Zealand Institute for Plant and Food Research ltd.
Publisher’s note
All claims expressed in this article are solely those of the authors and do not necessarily represent those of their affiliated organizations, or those of the publisher, the editors and the reviewers. Any product that may be evaluated in this article, or claim that may be made by its manufacturer, is not guaranteed or endorsed by the publisher.
Supplementary material
The Supplementary Material for this article can be found online at: https://www.frontiersin.org/articles/10.3389/fhort.2023.1242335/full#supplementary-material
References
Ahimera N., Gisler S., Morgan D. P., Michailides T. J. (2004). Effects of single-drop impactions and natural and simulated rains on the dispersal of Botryosphaeria dothidea conidia. Phytopathology 94, 1189–1197. doi: 10.1094/PHYTO.2004.94.11.1189
Amponsah N. T., Walter M., Beresford R. M., Scheper R. W. A. (2015). Seasonal wound presence and susceptibility to Neonectria ditissima infection in New Zealand apple trees. New Z. Plant Prot. 68, 250–256. doi: 10.30843/nzpp.2015.68.5799
Amponsah N. T., Walter M., Scheper R. W. A., Beresford R. M. (2017). Neonectria ditissima spore release and availability in New Zealand apple orchards. New Z. Plant Prot. 70, 78–86. doi: 10.30843/nzpp.2017.70.32
Araujo L., Pinto F. A. M. F. (2022). Neonectria ditissima spore release in apple plants and detached branches in Brazil. J. Plant Pathol. 71, 654–667. doi: 10.1111/ppa.13508
Araujo L., Pinto F. A. M. F., Andrade C. C. L., Duarte V. (2021). Viability and release of Neonectria ditissima ascospores on apple fruit in Brazil. Plant Pathol. 71, 654–667. doi: 10.1111/ppa.13508
Armbruster D. A., Pry T. (2008). Limit of blank, limit of detection and limit of quantitation. Clin. Biochem. Rev. 29, 49–52.
Aylor D. E. (1990). The role of intermittent wind in the dispersal of fungal pathogens. Ann. Rev. Phytopathol. 28, 73–92. doi: 10.1146/annurev.py.28.090190.000445
Aylor D. E. (1999). Biophysical scaling and the passive dispersal of fungus spores: relationship to integrated pest management strategies. Agric. For. Meteorology 97, 275–292. doi: 10.1016/S0168-1923(99)00072-6
Birch C. J., Andrieu B., Fournier C., Vos J., Room P. (2003). Modelling kinetics of plant canopy architecture - concepts and applications. Eur. J. Agron. 19, 519–533. doi: 10.1016/S1161-0301(02)00183-1
Calonnec A., Burie J.-B., Langlais M., Guyader S., Saint-Jean S., Sache I., et al. (2013). Impacts of plant growth and architecture on pathogen processes and their consequences for epidemic behaviour. Eur. J. Plant Pathol. 135, 479–497. doi: 10.1007/s10658-012-0111-5
Campbell R. E., Roy S., Curnow T., Walter M. (2016). Monitoring methods and spatial patterns of European canker disease in commercial orchards. New Z. Plant Prot. 69, 213–220. doi: 10.30843/nzpp.2016.69.5883
Cunniffe N. J., Cobb R. C., Meentemeyer R. K., Rizzo D. M., Gilligan C. A. (2016). Modeling when, where, and how to manage a forest epidemic, motivated by sudden oak death in California. Proc. Natl. Acad. Sci. 113, 5640–5645. doi: 10.1073/pnas.1602153113
Di Iorio D., Walter M., Lantinga E., Kerckhoffs H., Campbell R. E. (2019). Mapping European canker spatial pattern and disease progression in apples using GIS, Tasman, New Zealand. New Z. Plant Prot. 72, 176–184. doi: 10.30843/nzpp.2019.72.305
Everett K. R., Pushparajah I. P. S., Timudo O. E., Chee A. A., Scheper R. W. A., Shaw P. W., et al. (2018). Infection criteria, inoculum sources and splash dispersal pattern of Colletotrichum acutatum causing bitter rot of apple in New Zealand. Eur. J. Plant Pathol. 152, 367–383. doi: 10.1007/s10658-018-1481-0
Farber D. H., Leenheer P. D., Mundt C. C. (2019). Dispersal Kernels may be Scalable: Implications from a Plant Pathogen. J. Biogeography 46, 2042–2055. doi: 10.1111/jbi.13642
Fitt B. D. L., McCartney H. A. (1986). Spore dispersal in splash droplets. In Ayres P. G., Boddy L. (Eds.) Water, Fungi and Plants (pp. 87–104). Cambridge: Cambridge University Press.
Fountaine J. M., Shaw M. W., Ward E., Fraaije B. A. (2010). The role of seeds and airborne inoculum in the initiation of leaf blotch (Rhynchosporium secalis) epidemics in winter barley. Plant Pathol. 59, 330–337. doi: 10.1111/j.1365-3059.2009.02213.x
Fritz B. K., Hoffmann W. C., Jank P. (2011). A fluorescent tracer method for evaluating spray transport and fate of field and laboratory spray applications. J. ASTM Int. 8, 1–9. doi: 10.1520/JAI103619
Hoffmann W. C., Fritz B. K., Ledebuhr M. A. (2014). Evaluation of 1, 3, 6, 8-Pyrene Tetra Sulfonic Acid Tetra sodium salt (PTSA) as an agricultural spray tracer dye. Appl. Eng. Agric. 30, 25–28. doi: 10.13031/aea.30.10313
Huang Q., Zhang H., Chen J., He M. (2017). Quantile regressions models and their applications: a review. J. Biometrics Biostatistics 8(3), 354–360. doi: 10.4172/2155-6180.1000354
Karisto P., Suffert F., Mikaberidze A. (2023). Spatially explicit ecological modeling improves empirical characterization of plant pathogen dispersal. Plant-Environment Interactions 4, 86–96. 10.1002/pei3.10104
Koenker R. (2022). quantreg: Quantile Regression. R package version 5.88. Available at: https://CRAN.R-project.org/package=quantreg.
Lacey M. E., West J. S. (2006). The Air Spora: a manual for catching and identifying airborne biological particles (Dordrecht: The Netherlands, Springer).
Madden L. V. (1997). Effects of rain on splash dispersal of fungal pathogens. Can. J. Plant Pathol. 19, 225–230. doi: 10.1080/07060669709500557
Madden L. V., Hughes G., van den Bosch F. (2007). The study of plant disease epidemics (St Paul: Amer Phytopathological Society).
Mahaffee W. F., Margairaz F., Ulmer L., Bailey B. N., Stoll R. (2023). Catching spores: linking epidemiology, pathogen biology, and physics to ground-based airborne inoculum monitoring. Plant Dis. 107, 13–33. doi: 10.1094/PDIS-11-21-2570-FE
McCartney H. A., Fitt B. D. L. (1985). “Construction of dispersal models,” in Advances in Plant Pathology Volume 3 Mathematical modelling of crop disease. Ed. Gilligan C. A. (London: Academic Press Inc.), 107–143.
McCartney H. A., Fitt B. D. L. (1987). “Spore dispersal gradients and disease development,” in Population of plant pathogens: their dynamics and genetics/edited for the British Society for Plant Pathology. Eds. Wolfe M. S., Caten C. E. (Oxford: Blackwell Scientific), 109–118.
McCracken A., Berrie A., Barbara D., Locke T., Cooke L., Phelps K., et al. (2003). Relative significance of nursery infections and orchard inoculum in the development and spread of apple canker (Nectria galligena) in young orchards. Plant Pathol. 52, 553–566. doi: 10.1046/j.1365-3059.2003.00924.x
Nunes C. C., Alves S. A. M. (2019). “Progress and distribution of the disease in orchards,” in European canker in Brazil, 1. Eds. Alves S. A. M., Czermainski A. B. C. (Brazil: Embrapa, Brasília, DF), 107–118.
Orchard S., Campbell R. E., Turner L., Butler R. C., Curnow T., Patrick E., et al. (2018). Long-term deep-freeze storage of Neonectria ditissima conidium suspensions does not reduce their ability to infect apple trees. New Z. Plant Prot. 71, 158–165. doi: 10.30843/nzpp.2018.71.129
Penet L., Guyader S., Pétro D., Salles M., Bussière F. (2014). Direct splash dispersal prevails over indirect and subsequent spread during rains in Colletotrichum gloeosporioides infecting yams. PloS One 9, e115757. doi: 10.1371/journal.pone.0115757
Pielaat A., van den Bosch F. (1998). A model for dispersal of plant pathogens by rainsplash. IMA J. Mathematics Appl. Med. Biol. 15, 117–134. doi: 10.1093/imammb/15.2.117
Pietravalle S., van den Bosch F., Welham S. J., Parker S. R., Lovell D. J. (2001). Modelling of rain splash trajectories and prediction of rain splash height. Agric. For. Meteorology 109, 171–185. doi: 10.1016/S0168-1923(01)00267-2
RCoreTeam (2021). R: A language and environment for statistical computing (Vienna, Austria: R Foundation for Statistical Computing). Available at: https://www.R-project.org/.
Roten R. L., Ferguson J. C., Hewitt A. J. (2014). Drift reducing potential of low drift nozzles with the use of spray-hoods. New Z. Plant Prot. 67, 274–277. doi: 10.30843/nzpp.2014.67.5725
Roten R. L., Post S. L., Werner A., Safa M., Hewitt A. J. (2017). Phase doppler quantification of agricultural spray compared with traditional sampling materials. New Z. Plant Prot. 70, 142–151. doi: 10.30843/nzpp.2013.66.5690
Sache I. (2000). Short-distance dispersal of wheat rust spores. Agronomie 20, 757–767. doi: 10.1051/agro:2000102
Saint-Jean S., Chelle M., Huber L. (2004). Modelling water transfer by rain-splash in a 3D canopy using Monte Carlo integration. Agric. For. Meteorology 121, 183–196. doi: 10.1016/j.agrformet.2003.08.034
Saint-Jean S., Testa A., Madden L. V., Huber L. (2006). Relationship between pathogen splash dispersal gradient and Weber number of impacting drops. Agric. For. Meteorology 141, 257–262. doi: 10.1016/j.agrformet.2006.10.009
Scheper R. W. A., Vorster L., Turner L., Campbell R. E., Colhoun K., McArley D., et al. (2019). Lesion development and conidial production of Neonectria ditissima on apple trees in four New Zealand regions. New Z. Plant Prot. 72, 123–134. doi: 10.30843/nzpp.2019.72.302
Shaw M. W. (1987). Assessment of upward movement of rain splash using a fluorescent tracer method and its application to the epidemiology of cereal pathogens. Plant Pathol. 36, 201–213. doi: 10.1111/j.1365-3059.1987.tb02222.x
Shaw M. W. (1991). Variation in the height to which tracer is moved by splash during natural summer rain in the UK. Agric. For. Meteorology 55, 1–14. doi: 10.1016/0168-1923(91)90018-L
Swinburne T. (1971). The seasonal release of spores of Nectria galligena from apple cankers in Northern Ireland. Ann. Appl. Biol. 69, 97–104. doi: 10.1111/j.1744-7348.1971.tb04663.x
Vidal T., Lusley P., Leconte M., Vallavieille-Pope C. D., Huber L., Saint-Jean S. B. (2017). Cultivar architecture modulates spore dispersal by rain splash: A new perspective to reduce disease progression in cultivar mixtures. PloS One 12, e0187788. doi: 10.1371/journal.pone.0187788
Viruega J. R., Moral J., Roca L. F., Navarro N., Trapero A. (2013). Spilocaea oleagina in olive groves of southern Spain: survival, inoculum production, and dispersal. Plant Dis. 97, 1549–1556. doi: 10.1094/PDIS-12-12-1206-RE
Wadia K. D. R., McCartney H. A., Butler D. R. (1998). Dispersal of Passalora personata conidia from groundnut by wind and rain. Mycological Res. 102, 355–360. doi: 10.1017/S0953756297004887
Walter M., Chevalier C. E., Turner L., Campbell R. E. (2018). Neonectria ditissima conidium production and release in planta. New Z. Plant Prot. 71, 174–179. doi: 10.30843/nzpp.2018.71.131
Walter M., Roy S., Fisher B. M., Mackle L., Amponsah N. T., Curnow T., et al. (2016). How many conidia are required for wound infection of apple plants by Neonectria ditissima? New Z. Plant Prot. 69, 238–245. doi: 10.30843/nzpp.2016.69.5886
Weber R. W. S. (2014). Biology and control of the apple canker fungus Neonectria ditissima (syn. N. galligena) from a Northwestern European perspective. Erwerbsobstbau 56, 95–107. doi: 10.1007/s10341-014-0210-x
Wesche J., Weber R. W. S. (2023). Are microconidia infectious principles in Neonectria ditissima? J. Plant Dis. Prot. 130, 157–162. doi: 10.1007/s41348-022-00669-6
White S. M., Bullock J. M., Hooftman D. A. P., Chapman D. S. (2017). Modelling the spread and control of Xylella fastidiosa in the early stages of invasion in Apulia, Italy. Biol. Invasions 19, 1825–1837. doi: 10.1007/s10530-017-1393-5
Xu X. M., Ridout M. S. (1998). Effects of initial epidemic conditions, sporulation rate, and spore dispersal gradient on the spatio-temporal dynamics of plant disease epidemics. Phytopathology 88, 1000–1012. doi: 10.1094/PHYTO.1998.88.10.1000
Keywords: apple, tracer dye, Neonectria ditissima, spore dispersal, rain-splash, orchard, European canker, canopy
Citation: Campbell RE, Wallis DR and Walter M (2023) Methods for quantifying rain-splash dispersal of Neonectria ditissima conidia in apple canopies. Front. Hortic. 2:1242335. doi: 10.3389/fhort.2023.1242335
Received: 19 June 2023; Accepted: 21 November 2023;
Published: 14 December 2023.
Edited by:
Marcel Wenneker, Wageningen University and Research, NetherlandsReviewed by:
Larisa Garkava-Gustavsson, Swedish University of Agricultural Sciences, SwedenSeona Gae Casonato, Sugar Research Australia (Australia), Australia
Arne Stensvand, Norwegian University of Life Sciences, Norway
Copyright © 2023 Campbell, Wallis and Walter. This is an open-access article distributed under the terms of the Creative Commons Attribution License (CC BY). The use, distribution or reproduction in other forums is permitted, provided the original author(s) and the copyright owner(s) are credited and that the original publication in this journal is cited, in accordance with accepted academic practice. No use, distribution or reproduction is permitted which does not comply with these terms.
*Correspondence: Rebecca E. Campbell, cmViZWNjYS5jYW1wYmVsbEBwbGFudGFuZGZvb2QuY28ubno=