 Shaun J. Clare1,2†
 Mandie Driskill1,3Timothy R. Millar4,5†
 David Chagné6†
 Sara Montanari7†
 Susan Thomson4
 Richard V. Espley8
 Patricio Muñoz9†
 Juliana Benevenuto9†Dongyan Zhao10†Moira J. Sheehan10†
 Molla F. Mengist11Lisa J. Rowland12
 Hamid Ashrafi13
 Kalpalatha Melmaiee14
 Krishnanand P. Kulkarni14
 Ebrahiem Babiker15
 Dorrie Main16
 James W. Olmstead17Jessica L. Gilbert17
 Paul Havlak17
 Hsiaoyi Hung17
 Joel Kniskern17David Percival18Patrick Edger19
 Massimo Iorizzo13,20
 Nahla V. Bassil1*†
- 1USDA-ARS National Clonal Germplasm Repository, United States Department of Agriculture (USDA) Agricultural Research Service (ARS), Corvallis, OR, United States
- 2Department of Crop and Soil Science, Washington State University, Pullman, WA, United States
- 3Fall Creek Farm & Nursery, Inc., Lowell, OR, United States
- 4The New Zealand Institute for Plant & Food Research Ltd, Lincoln, New Zealand
- 5Department of Biochemistry, School of Biomedical Sciences, University of Otago, Dunedin, New Zealand
- 6The New Zealand Institute for Plant & Food Research Ltd, Palmerston North, New Zealand
- 7The New Zealand Institute for Plant & Food Research Ltd, Motueka, New Zealand
- 8The New Zealand Institute for Plant & Food Research Ltd, Auckland, New Zealand
- 9Horticultural Sciences Department, University of Florida, Gainesville, FL, United States
- 10Breeding Insight, Cornell Institute of Biotechnology, Cornell University, Ithaca, NY, United States
- 11Agriculture Research Station, College of Agriculture, Virginia State University, Petersburg, VA, United States
- 12United States Department of Agriculture (USDA) Agricultural Research Service (ARS), Genetic Improvement of Fruits and Vegetables Lab, Beltsville, MD, United States
- 13Department of Horticultural Science, North Carolina State University, Raleigh, NC, United States
- 14Department of Agriculture and Natural Resources, Delaware State University, Dover, DE, United States
- 15United States Department of Agriculture (USDA) Agricultural Research Service (ARS) Southern Horticultural Laboratory, Poplarville, MS, United States
- 16Department of Horticulture, Washington State University, Pullman, WA, United States
- 17Driscoll’s, Inc., Watsonville, CA, United States
- 18Department of Plant, Food, and Environmental Sciences, Faculty of Agriculture, Dalhousie University, Halifax, NS, Canada
- 19Department of Horticulture, Michigan State University, East Lansing, MI, United States
- 20Plants for Human Health Institute, North Carolina State University, Kannapolis, NC, United States
Blueberry (Vaccinium spp.) is one of the most economically important berry crops worldwide. Validation of genetic mapping studies is often hindered by asynchronous marker technology. The development of a standardized genotyping platform that targets a specific set of polymorphic loci can be a practical solution to unify the scientific and breeding community toward blueberry improvement. The objective of this study was to develop and evaluate a targeted genotyping platform for cultivated blueberries that is affordable, reproducible, and sufficiently high density to warrant large-scale adoption for genomic studies. The Flex-Seq platform was developed in a two-step procedure that resulted in 22,000 loci that yielded 194,365 single nucleotide polymorphisms when assessed in a diversity set of 192 samples including cultivated and other related wild Vaccinium species. Locus recovery averaged 89.4% in the cultivated polyploid blueberry (northern highbush [NHB], southern highbush [SHB], and rabbiteye [RE]) and on average 88.8% were polymorphic. While recovery of these loci was lower in the other Vaccinium species assayed, recovery remained high and ranged between 60.8% and 70.4% depending on the taxonomic distance to the cultivated blueberry targeted in this platform. NHB had the highest mean number of variants per locus at 9.7, followed by RE with 9.1, SHB with 8.5, and a range between 7.7 and 8.5 in other species. As expected, the total number of unique-in-state haplotypes exceeded the total number of variants in the domesticated blueberries. Phylogenetic analysis using a subset of the SNPs and haplotypes mostly conformed to known relationships. The platform also offers flexibility about the number of loci, depth of sequencing for accurate dosage calling, loci and haplotype reconstruction from increased fragment length. This genotyping platform will accelerate the development and improvement of blueberry cultivars through genomic-assisted breeding tools.
Introduction
Vaccinium is a genus of the Ericaceae family of shrub/small tree species that includes cultivated fruit crops such as blueberry (V. corymbosum and V. virgatum), cranberry (V. macrocarpon), and lingonberry (V. vitis-idea), as well as many edible wild stands of berry crops such as lowbush blueberry (V. angustifolium and V. myrtilloides), billberry (V. cespitosum, V. deliciosum, V. myrtillus, V. uliginosum), sparkleberry (V. arboreum), deerberry (V. stamineum) and some species of huckleberry (V. deliciosum, V. membranaceum, V. parvifolium, V. ovatum) (Ballington, 2001; Manzanero et al., 2023). This genus is divided into 30 sub-generic sections according to Stevens (Stevens, 1969; Luby et al., 1991). Sections Cyanococcus, Oxycoccus, Vitis-idaea, Myrtillus, and Vaccinium include species that are either cultivated or extensively collected from native stands for their edible fruit, of which blueberries are in the Cyanococcus section (Galletta and Ballington, 1996).
The wild progenitors of the cultivated blueberry are native to North America along with cranberry, some strawberry, and caneberry crops (Carter et al., 2019; Colle et al., 2019). Cultivation of blueberry is recent in comparison to other established crops with the lowbush blueberry (V. angustifolium) beginning in the mid-19th century (Ballington, 2001), whereas domestication and cultivation of the more widespread tetraploid highbush blueberry (V. corymbosum L.) began in the early 20th century (Colle et al., 2019). Production continued to increase in subsequent decades due to their status of “superfood” like other berry species (Burton-Freeman et al., 2016; Davidson et al., 2018). Cultivated highbush blueberry is differentiated into northern highbush blueberry (NHB) and southern highbush blueberry (SHB) based on the chilling requirement sourced by introgression of low or no chill from V. darrowii into SHB which allowed expansion to warmer climates (Manzanero et al., 2023). In addition, the hexaploid rabbiteye (RE) blueberry (V. virgatum syn. ashei) is also cultivated but in smaller quantities (Ballington, 2001). Lowbush blueberries (V. angustifolium and V. myrtilloides), also referred to as the wild blueberry, are grown in limited native stands in Northern US (Maine) and Canada (Maritime provinces and Quebec) (Strik and Yarborough, 2005). A key contributing factor to the appeal of blueberries are the presence of phenolic compounds, sugars, acids and volatile organic compounds that contribute to flavor perception (Gilbert et al., 2015; Klee and Tieman, 2018). In 2021, approximately 320,000 thousand tons of fresh weight cultivated blueberry valued at $1.02 billion was produced in the United States (USDA NASS, 2022). The top five producing states include Washington (180 million tons, 26.9%), Oregon (151 million tons, 22.6%), Georgia (86.5 million tons, 12.9%), California (74.5 million tons, 11.1%), and Michigan (72.9 million tons, 10.9%). The blueberry market is divided approximately evenly between fresh and processed blueberries. Fresh blueberries are produced in multiple states whereas processed blueberries are primarily from Washington and Oregon.
To meet the demands from industry and consumers, modern breeding programs have been developing and employing genomics tools to accelerate cultivar development. However, the utilization of asynchronous marker technologies across studies hampers utilization of their discoveries. A crucial tool missing from the blueberry community is an affordable genotyping platform that can facilitate genome-wide association mapping and yield reproducible results and consolidation of the vast array of genetic studies being conducted. Considerable technological advancements have been made in the field of genotyping from the initial, gel-based genotyping methods (Jones et al., 1997). These include the widespread development of rapid fluorescent SNP maker technologies such as Kompetitive Allele Specific PCR (KASP™, LGC Biosearch Technologies), PCR Allelic Competitive Extension (PACE®, 3CR Bioscience) and RNase H-dependent PCR (RhAmp™, IDT Technologies) (Dobosy et al., 2011; Semagn et al., 2014); the scale and repeatability of array-based sequencing (Schenk et al., 2000); complexity reduction for repetitive genomes of Restriction site-Associated Digest-Genotyping By Sequencing (RAD-GBS, Elshire et al., 2011); and cost-effectiveness of targeted amplicon sequencing (Lundberg et al., 2013). Other recent developments aim to increase the cost-effectiveness of array-based technology by developing multi-species arrays that can multiplex multiple organisms together with the same barcode (Montanari et al., 2022). There is a wealth of platforms and novel ideas aimed to encourage more repeatable and more affordable genotyping for different end goals such as mapping or predicting target traits, genome-wide association mapping, pedigree analysis, DNA fingerprinting, or diversity analysis. Amongst these, Capture-Seq (LGC Biosearch Technologies, do Amaral et al., 2015) and DArTag (Diversity Array Technologies, Jaccoud et al., 2001; Wenzl et al., 2004) are similar to Allegro (Tecan Genomics) and SeqSNP (discontinued, LGC Biosearch Technologies) using Single Primer Extension Technology (Scolnick et al., 2015), in that a single oligonucleotide probe is used for enrichment of a target variant, either through hybridization or amplification. These platforms have advantages over array-based or RAD-GBS approaches that were either repeatable but expensive to develop or cheap but have low repeatability.
The application of marker-assisted selection (MAS) using genetic markers linked to traits of economic importance has not yet been widely implemented in blueberry despite progress in identifying a small number of loci controlling fruit characteristics and high-quality genome assemblies becoming available (reviewed by Edger et al., 2022). To fill the existing gaps toward MAS in blueberry, the U.S. Vaccinium breeders, allied scientists, and extension specialists, with strong international participants, are collaborating in the VacCAP project to address major bottlenecks for growth of the U.S. Vaccinium industry (Iorizzo et al., 2023). This project is an international coordinated transdisciplinary research approach that was funded in 2019 by the United States Department of Agriculture to develop and implement MAS for fruit quality traits in Vaccinium breeding programs. Its objectives are reviewed by Iorizzo et al. (2023) and described at https://www.vacciniumcap.org/. The first objective was to develop a cost-effective high throughput genotyping platform that works across the cultivated NHB and SHB germplasm to advance genetic studies (in particular genome-wide association mapping) and enable downstream application of MAS in blueberry. In this study, we describe the development of a Flex-Seq platform panel for blueberry that uses two probes for increased specificity and haplotype reconstruction. A total of 22,000 targeted loci were designed and assessed in a diversity panel of 192 accessions made up of 72 NHB, 72 SHB, 21 RE, and 27 wild relatives of interest to the blueberry research community.
Materials & methods
Plant materials
A total of 192 diverse Vaccinium accessions (Supplementary Table 1) obtained from blueberry researchers worldwide from public and private institutions were submitted for DNA extraction, library preparation, and genotyping to RAPiD Genomics (LGC Group, Gainesville, FL). The 192 accessions consisted of 72 NHB, 72 SHB, 21 RE, and 27 accessions considered wild for the purpose of the study. Wild accessions included one to two accessions of each Vaccinium species that were split further into Cyanococcus species: lowbush blueberry (V. angustifolium), common/Canadian blueberry (V. myrtilloides), evergreen blueberry (V. darrowii), Elliotts’s blueberry (V. elliottii), small black blueberry (V. tenellum); and Non-Cyanococcus species: Madeira blueberry (V. padifolium), northern billberry (V. uliginosum), deerberry (V. stamineum), evergreen huckleberry (V. ovatum), lingonberry (V. vitis-idaea) and sparkleberry (V. arboreum). In addition, hybrids between NHB with common blueberry, evergreen blueberry, and northern billberry, as well as evergreen blueberry with Azores blueberry (V. cylindraceum) were grouped with wild Cyanococcus.
Catalogue data collection and quality control
Genomic and transcriptomic sequencing data files were collected from NCBI and collaborators to obtain a de novo variant catalogue. Files collected from NCBI were downloaded as fastq files using Fastq-dump v2.10.9 (Sayers et al., 2021). The data consisted of 50 cultivars and seven projects containing transcriptomic data of 16 additional cultivars from NCBI (Supplementary Table 2). Data types were comprised of paired-ended whole genome sequences, 15 paired-ended transcriptomic sequences, and one single-ended transcriptomic sequence. Collaborator data files were provided as files with flanking sequences approximately 150 to 250 bp in length with the variant positioned in the middle of the sequence, fastq files, or a coordinate file that consisted of a chromosome and position on an associated reference genome. Data were obtained from nine collaborators that encompassed 13 different studies that included eight diversity panels and four mapping populations (Supplementary Table 3).
Fastq files were evaluated with FastQC v0.11.9 using default setting to identify sequence contamination such as sequence adapters, poly-tail SNP repeats, and over-represented fungal, bacterial, and plasmid sequences. Contamination was removed with BBDuk v03.28.2018 (Bushnell, 2022) using the following parameters: ktrim right, mink 11, hdist 2, tpe, tbo, maq 25, minlen 25. Files were re-evaluated with FastQC to determine quality of curated data. Curated genomic fastq files were indexed and aligned to the W85 Phase 0 (P0) reference genome (Mengist et al., 2023) with bwa-mem v0.7.12 using default settings (Li et al., 2009) and bam files sorted by genomic coordinates with samtools v1.18 sort (Li et al., 2009).
Transcriptomic fastq files were indexed and aligned to the W85 P0 reference genome (Mengist et al., 2023) with STAR’s v2.7.10a 2 Pass Mode (Dobin et al., 2013). For more accurate mapping, intron length statistics were calculated with a publicly available AWK v10.29.2014 script (Weeks, 2014). The minimum and maximum intron lengths were supplied to STAR during the first round of mapping using the alignIntronMin and alignIntronMax options, respectively. After mapping, STAR produced a tab-delimited file with the SJ.out.tab prefix for each alignment. These files contain coordinates for high confidence collapsed splice junctions with associated strand orientation. A second tab-delimited file with the SJ.in.tab prefix was created from the SJ.out.tab file using a publicly available AWK v05.14.2014 script (Dobin, 2014). This second file contained four columns, the chromosome, the first base of the intron, the last base of the intron, and strand orientation (e.g., + or -). During the second round of indexing and mapping, all program settings were kept the same, except that the SJ.in.tab file was supplied to STAR during the genomeGenerate run mode using the sjdbFileChrStartEnd option. The resulting bam files were coordinate sorted with samtools v1.18 sort (Li et al., 2009). Genomic and transcriptomic bam files were processed with GATK v4.2.0 MarkDuplicate to remove PCR duplicates arising from library construction and single amplification clusters (McKenna et al., 2010; Van der Auwera et al., 2013). The bam files were processed to add read groups for traceability with GATK v4.2.0 AddorReplaceReadGroups (McKenna et al., 2010; Van der Auwera et al., 2013). To determine the depth and coverage across the genome, each bam file was processed with samtools v1.18 coverage (Li et al., 2009).
De novo variant calling
Files with the highest depth and uniform coverage across the genome were used in building the de novo variant catalogue to ensure the most accurate variant calling. All bam files were merged into a single bam file using samtools v1.18 merge and sorted by genomic coordinates with samtools v1.18 sort (Li et al., 2009). The bam file was split into smaller regions, approximately 300 equally sized regions per chromosome and once to three times for larger scaffolds. Freebayes v1.3.2-38-g71a3e1c-dirty (Garrison and Marth, 2012) fasta_generate_regions.py and a custom Snakemake v6.3.0 (Mölder et al., 2021) script were used to generate bed files containing the start and stop positions of each split region for each chromosome. All of the chromosome region bed files were concatenated together into a single bed file that was supplied to samtools v1.18 view to perform partitioning (Li et al., 2009).
Variant calling was performed on each split bam file using Freebayes and Snakemake with the options cnv-map to enter the correct ploidy per sample and use-best-n-allele to use the best 3 alleles (Garrison and Marth, 2012). The resulting VCF files were concatenated per chromosome using bcftools v1.9 concat (Danecek et al., 2021). The program vcflib v09.28.2015 vcfuniq (Garrison et al., 2022) was used to ensure there were no duplicate calls. The concatenated files were sorted by coordinates with bcftools v1.9 sort and calls were filtered for the following requirements using bcftools v1.9 view option i and bcftools filter option e: 1) call quality >=20, 2) minor allele frequency >= 10%, 3) max depth +2 standard deviations of the mean depth, 4) alternative and reference supported by at least 5 reads, and 5) missing genotypes >= 20% (Danecek et al., 2021).
The flanking sequences 250 base pairs in length from the filtered calls were extracted from the W85 P0 reference genome and converted to fastq format using a custom python script. The flanking sequences with the variant were re-aligned to the W85 P0 reference genome with bwa-mem and sorted with samtools sort. A custom python script was created to identify single mapping variants using the bitwise FLAG, XA, and SA alignment fields. The filtered bwa single mapping variant sequences were aligned a second time with BLASTn v2.14.0 (Sayers et al., 2022). A second python script was created to identify single mapping variants based on alignments that only had one hit.
A priori variant calling
Transcriptomic files not used for de novo variant calling were used in a second catalogue called the a priori variant catalogue, comprised mostly of collaborator data that had a priori variant calling. Freebayes was used to joint call all the transcript files using the same options in the de novo variant calling. Additionally, the transcriptomic VCF files went through the same filtering and single mapping process as the de novo pipeline.
Collaborator data provided as genomic coordinates had 250 base pair flanking sequences extracted from the associated reference genome as a fasta file using a custom python script. Collaborator data provided as a file with flanking sequences were converted to fasta format. All fasta files were aligned to the W85 P0 reference genome with bwa-mem. Each alignment file, the associated fasta file with the variant in square brackets (e.g., [A]), and the W85 P0 reference genome, were utilized in a custom python script that created liftover coordinates for the sequences between the two assemblies while considering and adjusting for the CIGAR string alignment information. This custom script generated two data files, a visual alignment file between the reference and query sequence and an alignment data file that contained the following information: 1) primary and secondary alignment, 2) strand orientation (forward or reverse), and 3) chromosome and SV position(s). Each of the alignment data files for the 13 collaborator studies and the single mapping transcriptomic VCF files were parsed to extract the chromosome and position for each SV into a text file.
Final variant catalogue development
To create both the de novo and a priori variant catalogue, the text file that contained the existing chromosomes and position information, the W85 P0 hard and soft core pangenome (Yocca et al., 2023), the W85 GFF3, and the de novo single mapping variants per chromosome were put into a custom Snakemake and python script. The function of these scripts were to compile existing variants and associated information and to identify variants shared between all the collaborator studies, the transcriptomic data, and the de novo data for each chromosome. The same information was entered for the de novo variant catalogue, except for the text file that contained the existing chromosomes and position information which was omitted and the a priori variant catalogue per chromosome was provided. The function of this script was to compile for each chromosome the de novo variants and associated information that were not present in the a priori variant catalogue. The a priori and de novo variant catalogue is a tab-separated text file that contains the following columns: 1) the variant name, 2) the chromosome, 3) the position(s), 4) the origin of the data (existing collaborators, transcriptomic, or de novo as E, TR, or D, respectively), 5) the type (DP for diversity panel, MP for mapping population, or TR for transcriptome) as counts, respectively, 6) the collaborator, 7) variant location in the hard core, soft core, or intergenic region of the genome, and 8) gene information if available.
Additionally, a trait text data file was created that contained the collaborator variants associated with a study and corresponding trait data. The trait file contained four columns that had the variant name, the importance or “Priority” coded as 1 for important and 0 as not important, the trait, and the reference publication. This file along with the a priori and de novo variant catalogues for each chromosome were the input for a custom Snakemake and python script to generate a per chromosome master catalogue. The catalogue had the same columns as the a priori and de novo catalogues with the addition of three columns that contained the priority, trait, and citation information.
Flex-seq platform design and genotyping
The de novo SNPs and the existing SNPs were provided to RAPiD Genomics/LGC Group (Gainsville, FL, USA) for filtering down to 50,000 variants. SNPs located within core or accessory genes, and SNPs previously associated with a trait were prioritized over intergenic SNPs. Flex-Seq probes were designed by RAPiD Genomics using a proprietary in-house pipeline based on target SNPs identified through previous genotyping efforts. A 1 bp sliding window was applied to the 300-500 bp of the flanking sequence for each target, generating a list of all possible probe sequences. Candidate probes were filtered to remove probes with extreme GC content, homopolymer runs, and ambiguous bases. The remaining probes were evaluated for uniqueness within the reference genome using BLASTn (Camacho et al., 2009). Probes were assigned a weighted score based on their properties maximizing uniqueness within the genome (i.e., specificity), uniformity of GC content and Tm (melt temperature) across all loci, and dimer and hairpin potential. The final probe pairs for each locus were selected based on the optimization of the previous parameters and ensuring that the target SNP would be fully sequenced by 2x150bp Illumina sequencing and maintained a minimum fragment length of at least 300bp. The design and selection of the final panel utilized a two-step approach, with step one consisting of the design and synthesis of a larger ~50,000 panel which was then tested by genotyping a set of representative test samples that included an equal number of NHB and SHB accessions (Supplementary Table 1). In the second step, the final probe panel was selected based on the analysis of step one to empirically identify the loci that performed the best in the Flex-Seq reaction. Loci were selected to optimize recovery across all samples in the initial test set, minimizing variation within a locus among samples, and optimizing data uniformity across loci. This resulted in a final panel consisting of 22,000 loci (Flex-Seq Panel Code: FS_1903). Samples were paired-end sequenced using 2x150 Illumina NovaSeq Platform. Individual fastq and haplotype files are provided for each sample from RAPiD Genomics as well as one raw and one curated VCF file for all samples combined. The raw and filtered VCF file were generated using a tetraploid calling format using FreeBayes for all accessions.
Platform assessment
Marker overlap between platforms
Loci overlapping between Flex-Seq platform and previously developed Capture-Seq and DArTag genotyping platforms were evaluated. This was performed by first obtaining genomic positions of Capture-Seq and DArTag probes using blastn 2.13.0+ (Camacho et al., 2009) against the W85 P0 genome assembly. The Flex-Seq platform consists of 22,000 loci, whereas the Capture-Seq and DArTag platforms consist of 10,000 and 3,000 loci, respectively. Only the top hit with query coverage and percent identity of 90% was obtained. The subsequent outputs were converted to bed files and overlap within all three bed files were compared using bedtools 2.30.0 intersect (Quinlan and Hall, 2010) and -wa and -wb options, whereas unique loci were identified using the -v option.
Variant filtering and locus recovery
The unfiltered VCF file was subsampled into respective classes (NHB, SHB, RE, Cyanococcus, and Non-Cyanococcus, Supplementary Table 1) using bcftools 1.9 view subcommand. Data was filtered using vcflib vcffilter (Garrison et al., 2022) for biallelic SNPs, quality scores of more than 30, forward and reverse mapping scores of more than 30, and sequencing depth exceeding ten reads per sample to ensure realistic odds that each of the four homologous chromosomes within tetraploid NHB and SHB were sampled. Raw and filtered sequencing depth across variants was assessed using vcftools 0.1.16. A locus was determined to be recovered if a single variant was retained within the locus post-filtering and investigated by chromosome and SNP class to ascertain any performance bias. Loci were further filtered to remove monomorphic sites within a specific subset. The number of polymorphisms per locus and mean number of variants per locus were calculated based on post-filtering.
Haplotype reconstruction
More stringent filtering on the raw VCF file was performed considering variant, forward and reverse mapping quality scores higher than 30, biallelic SNPs, alternative alleles present in at least ten individuals, population level sequencing depth of 9,600 (50x/individual mean), allelic balance between 0.25 and 0.75 resulting in 53,557 SNPs. Haplotypes of each locus were constructed using only recovered high-quality biallelic SNPs identified from the previous filtering steps using MCHap 0.8.1 assemble (https://github.com/PlantandFoodResearch/MCHap). Firstly, raw fastq files were trimmed using fastp 0.22.0 (Chen et al., 2018), after being assessed with fastqc 0.12.1 https://www.bioinformatics.babraham.ac.uk/projects/fastqc/ and multiqc 1.14 (Ewels et al., 2016). Trimmed reads were aligned to W85 P0 using bwa-mem2 2.2.1 (Vasimuddin et al., 2019) and converted to bam files using samtools 1.6 view, sort, and index commands (Li et al., 2009). MCHap 0.8.1 assemble was supplied with a list of all bam files, a bed file containing all target loci, a compressed and indexed VCF file containing all high-quality variants, and an indexed reference genome of W85 P0. The options for ploidy were set to 4 and the prior for the inbreeding coefficient to 0.01. The number of called haplotypes per locus were extracted from the subsequent haplotype VCF file.
Phylogenetic tree
The 53,557 high-quality SNP set used for haplotype reconstruction was filtered for any missing data leaving a total of 10,388 SNPs. For constructed haplotypes using the high-quality SNP set, monomorphic haplotypes were filtered for a total of 10,683 haplotype blocks. The 10,388 SNP set and 10,683 haplotype blocks were considered sufficiently similar to construct and compare phylogenetic trees. Phylogenetic trees were constructed using 10,388 SNPs and 10,683 haplotype blocks using unweighted pair group method with arithmetic mean (UPGMA) hierarchical clustering using 100 bootstraps and the aboot command and neinan genetic distance within poppr 2.9.3 (Kamvar et al., 2014). The phylogenetic tree was plotted using the ggtree 3.4.2 (Yu, 2020) extension of ggplot2 3.3.6 (Wickham, 2016) within R 4.2.1. (R Core Team, 2021).
Results
SNP catalogue composition
The SNP catalogue contained 7,571,026 variants that included 444,908 submitted by collaborators based on previous studies in mapping populations or diversity panels (Supplementary Table 3). Of these, 4,675 variants were indicated to be associated with traits evaluated in blueberry including fruit firmness, weight, diameter, size, volatiles, color, flavor, titratable acidity, soluble solids, full bloom, chilling requirement, and cold hardiness. A total of 7,527,230 (or 99.4%) of these variants were distributed across the 12 chromosomes while the remaining (30,514 and 13,282) mapped to 191 contigs and 12 scaffolds, respectively of the W85 P0 assembly (Mengist et al., 2023).
Data curation and Flex-Seq platform composition
This SNP catalogue was used to develop a probe set targeting ~50,000 loci (Flex-Seq Panel Code: FS_1902, RAPiD Genomics) within blueberry. These loci contained 194,365 variants, the majority of which were located in core genes of the genome (124,629, 64.1% of total), with the remaining in accessory genes (12,928, 6.7%), intergenic regions (56,494, 29%), or mixed regions (core and accessory, 314, 0.2%). Up to 1,345 variants in this design were associated with blueberry traits as provided by collaborators. This design was assessed in an equal number of SHB and NHB samples and reduced to a final probe set targeting 22,000 loci (Flex-Seq Panel Code: FS_1903, RAPiD Genomics) distributed evenly throughout the genome (Figure 1). These loci were selected by RAPID Genomics to optimize recovery across the genotyped samples, minimizing variation within a locus among samples, and optimizing data uniformity across loci. Of these 20,000 loci: 15,992 (72.7%) were in core genes, 1,872 (8.5%) were in accessory genes, 4,037 (18.4%) were in intergenic regions, and 34 (0.2%) were mixed (core and accessory). The remaining 65 loci (0.3%) were not assigned. Up to 205 loci were in regions reported to control blueberry traits. A total of 99% of the loci in the final design were distributed across the 12 chromosomes (between 1,620 loci on Chromosome 07 and 2,156 loci on Chromosome 02) and the remaining 1% on contigs and scaffolds (215 loci).
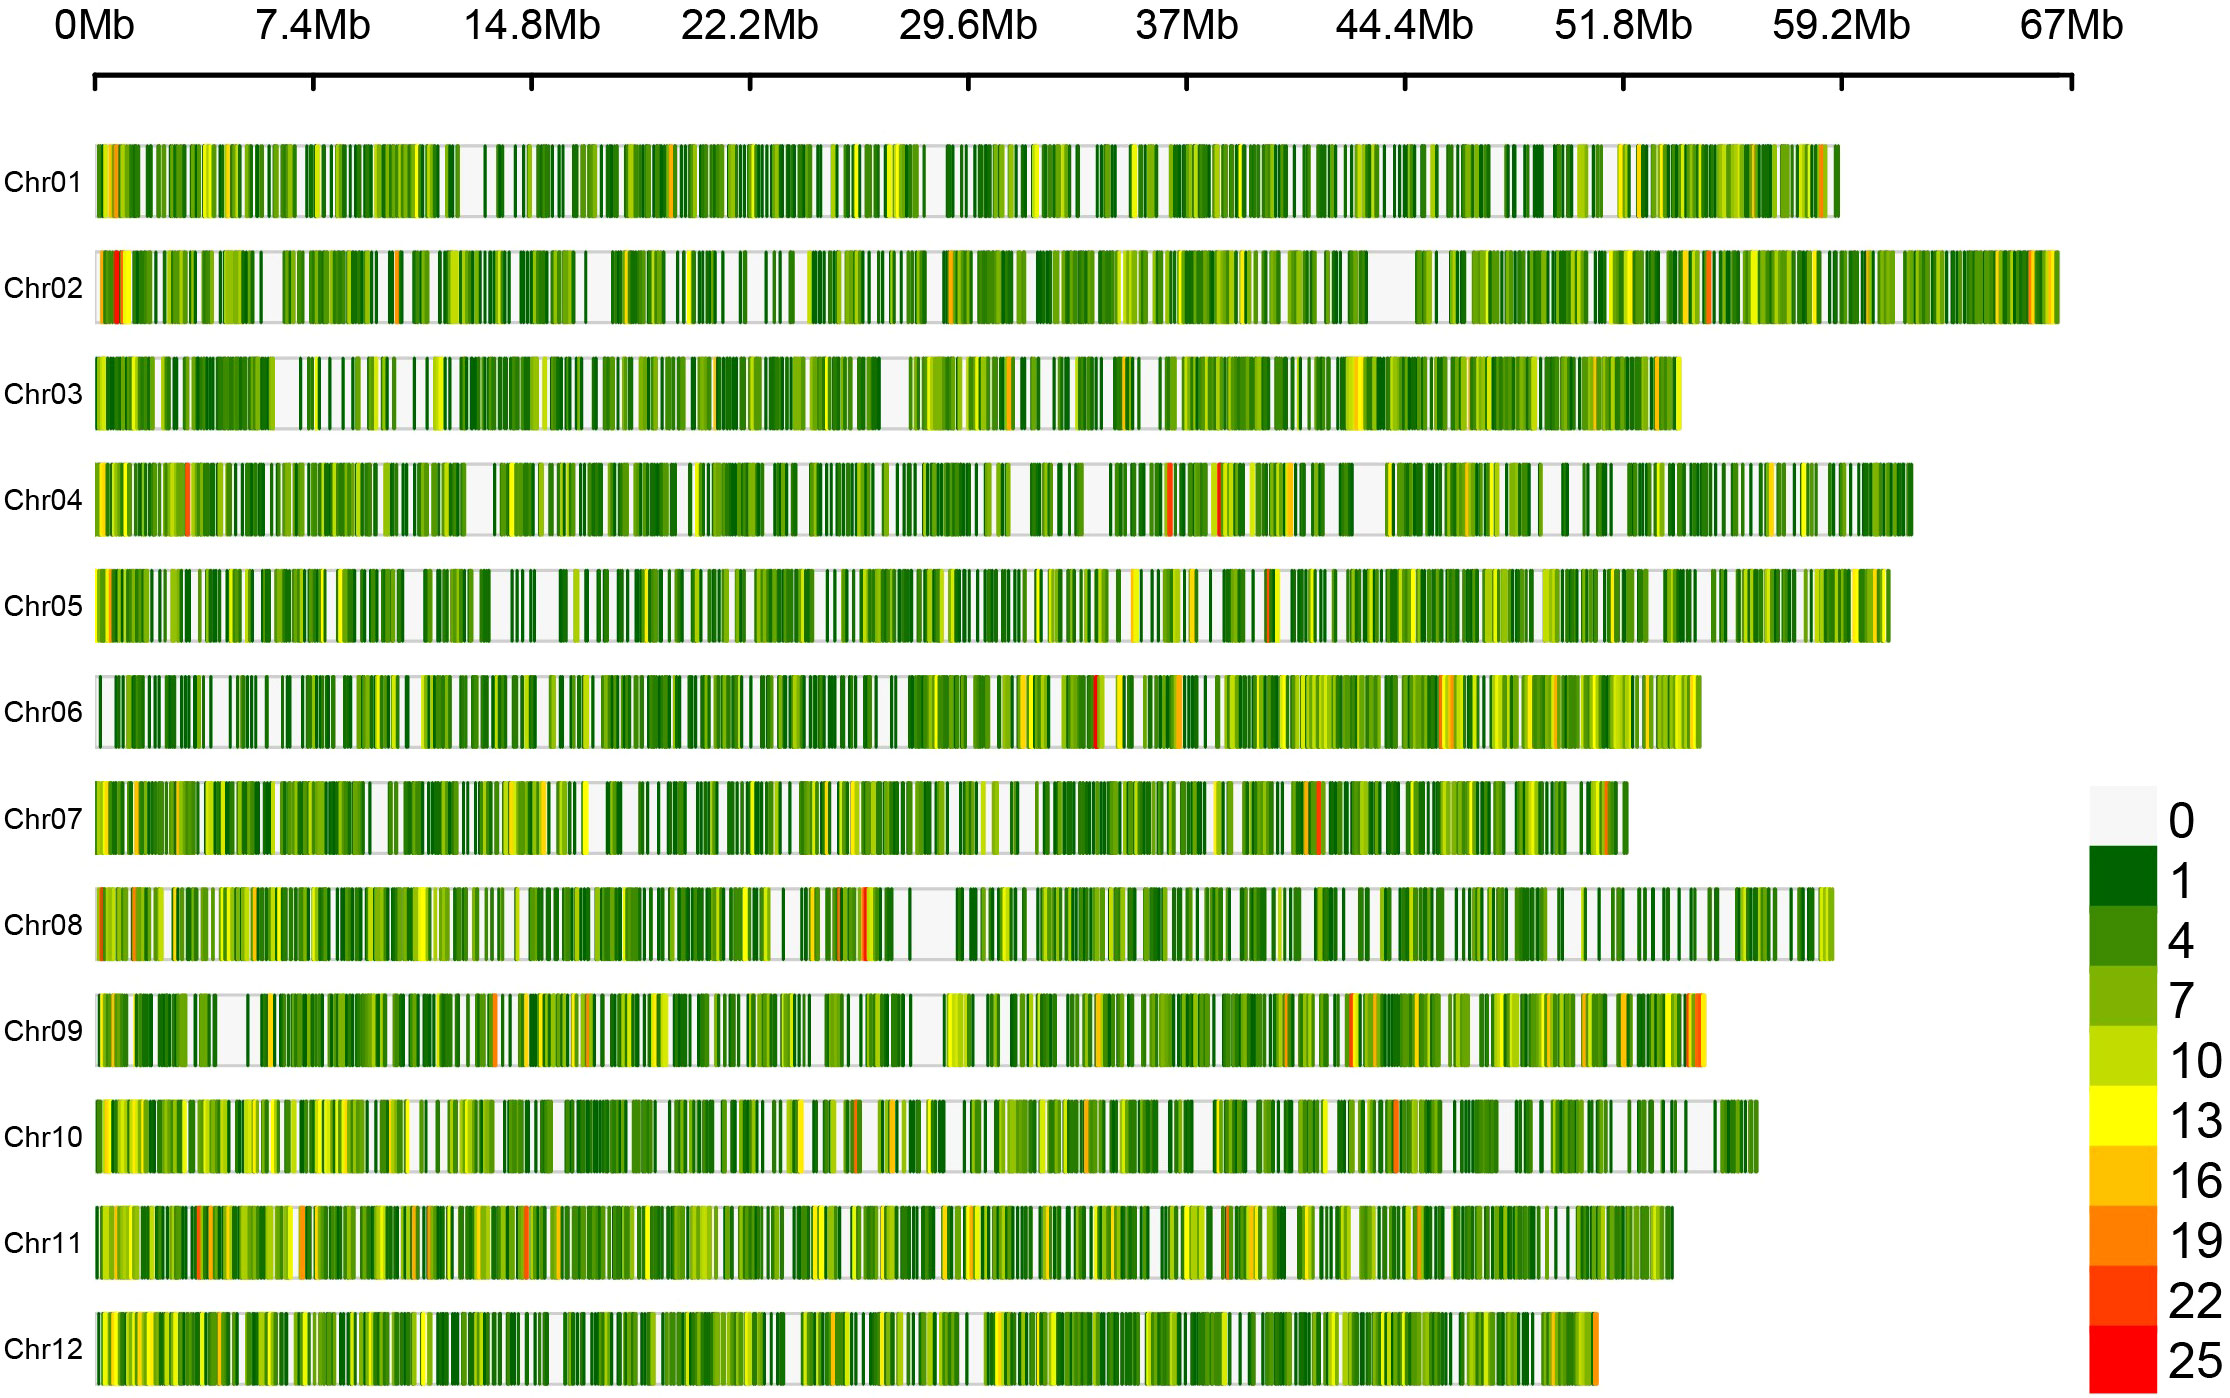
Figure 1 Loci density plot of the Flex-Seq platform across the W85 Phase 0 reference genome assembly. Loci density is displayed with low (green) to high (red) density across the twelve chromosomes within the W85 Phase 0 reference genome assembly in a window size of 100 kb. Contigs and scaffolds are removed to aid visualization. Figure produced using CMplot.
The 192 blueberry samples (Supplementary Table 1) were genotyped with the Flex-Seq 22K (FS_1903). A total of 3.96 million variants were identified including single nucleotide polymorphisms (SNPs), multi-nucleotide variants, insertions and deletions, and other complex variants with an average read depth of 66x. The combined dataset was subsampled to each blueberry subclass and filtered for high-quality biallelic SNPs resulting in approximately ~430,000 variants for NHB (81x average read depth), SHB (75x average read depth), and RE (84x average read depth), ~350,000 variants in Cyanococcus (55x average read depth) and ~275,000 variants in Non-Cyanococcus (52x average read depth). A total of four samples were observed to skew data retention within Cyanococcus and Non-Cyanococccus and were therefore removed from further analysis. These included one Cyanococcus (V. tenellum) and three Non-Cyanococcus (one V. stamineum and both V. arboreum). On closer inspection, these samples with low recovery appeared directly correlated to DNA concentration provided by RAPiD Genomics.
Platform assessment
Marker overlap between platforms
On average, each fragment is approximately 191, 119, and 54/81 bp in length for the Flex-Seq, Capture-Seq, and DArTag genotyping platforms, respectively. A total of 22,000, 9,486 (94.8%), and 2,633 (87.7%) fragments within the Flex-Seq, Capture-Seq, and DArTag platforms were able to identify W85 P0 genomic positions. A total of 400 fragments from DarTag overlap with either or both the Flex-Seq and Capture platforms, whereas 4,568 fragments from the Capture-Seq overlap with Flex-Seq or DarTag (Figure 2). The Flex-Seq platform has 4,607 fragments that overlap with Capture-Seq or DarTag. Lastly, a total of 17,392, 5,057, and 2,317 fragments are unique to the Flex-Seq, Capture-Seq, and DArTag genotyping platforms, respectively. A further 375 and 283 fragments within the Capture-Seq and DArTag platforms are left unaccounted for due to the lack of W85 P0 genomic positions. Specific target variants may not be captured by the same platform with overlapping fragments due to the varying fragment length in each platform. The number of variants and number of reconstructed haplotypes for Capture-Seq and DArTag were not calculated as these files are not publicly available or are in manuscript preparation, respectively.
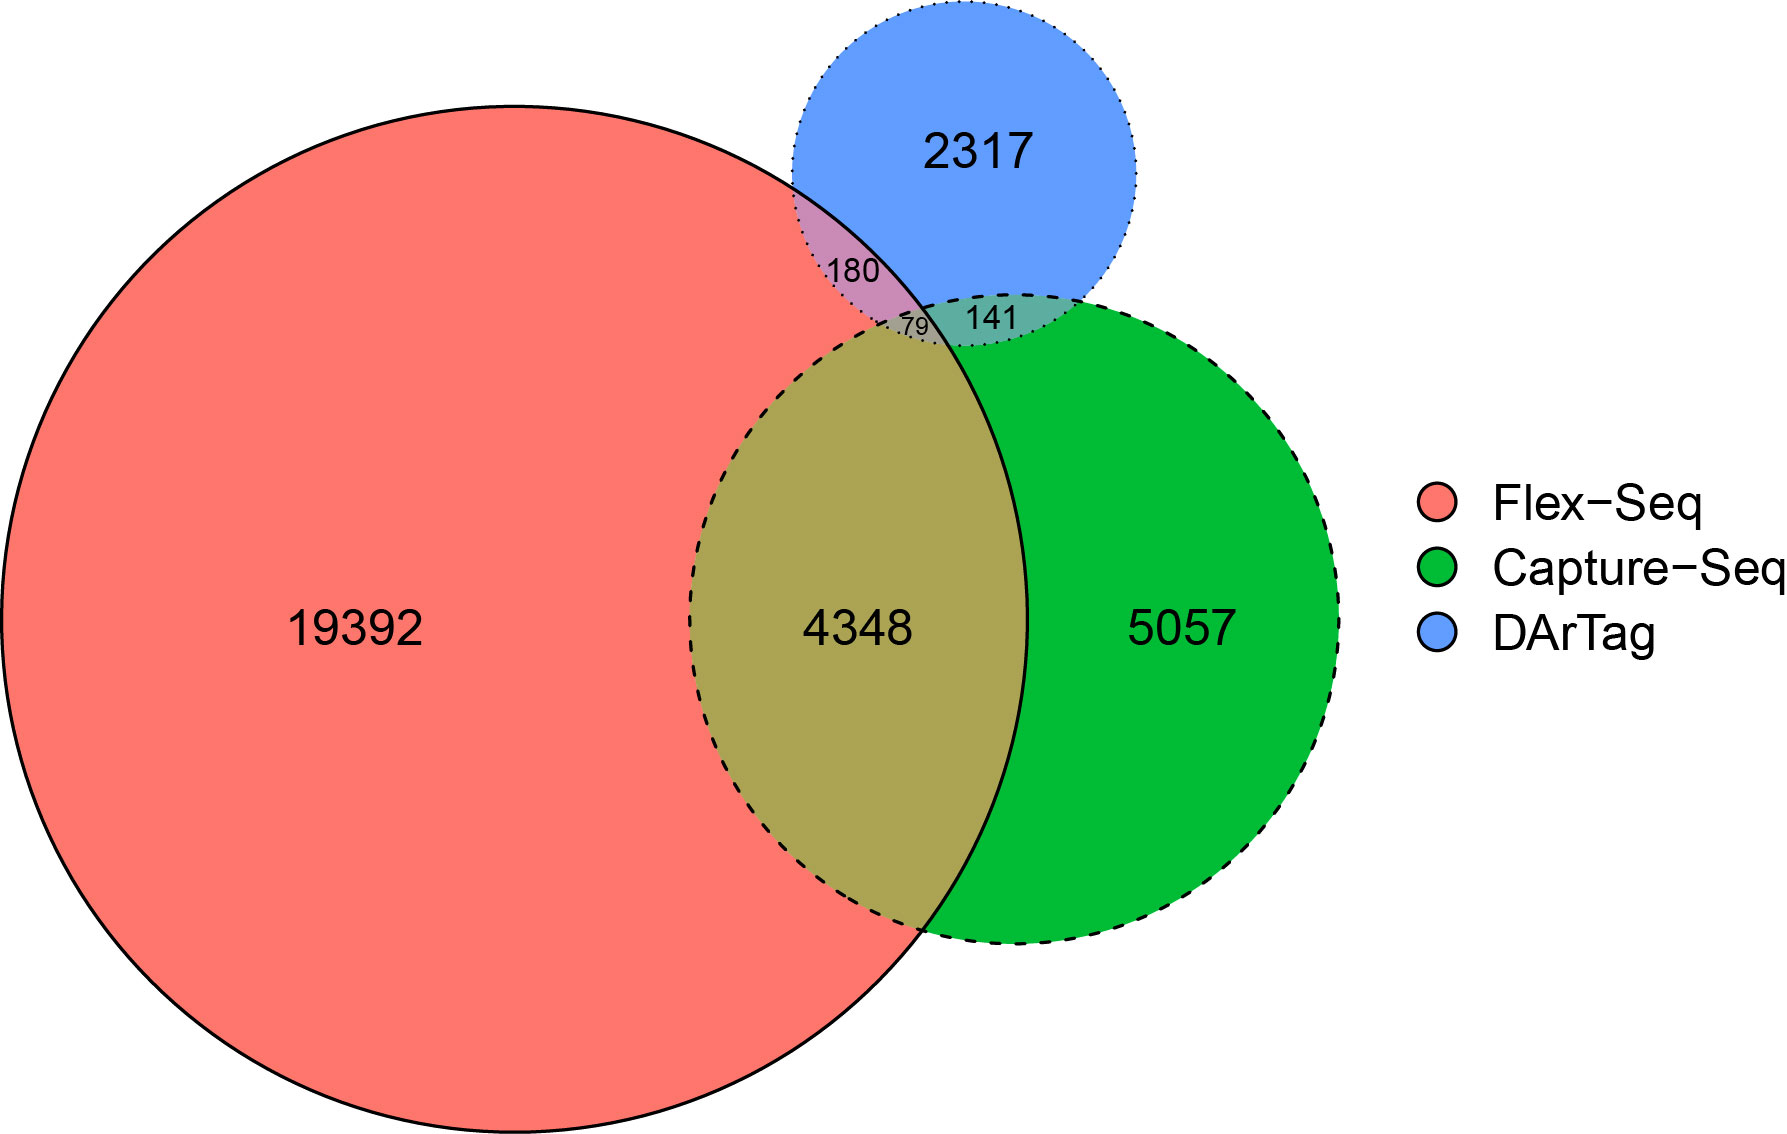
Figure 2 Proportional overlap Venn diagram of the three existing sequencing-based genotyping platforms of blueberries. The platforms include Flex-Seq (red), Capture-Seq (green) and DArTag (blue). Figure produced using eulerr.
Variant filtering and locus recovery
The initial design of the probe set has a mean inter locus distance of 32 kb. This remained stable post-filtering at 35 kb across all domesticated blueberry classes (NHB, SHB, and RE), decreasing to 45 kb in wild Cyanococcus and 54 kb in wild Non-Cyanococcus (Table 1). This is due to the gradual decline in locus recovery across the blueberry classes. A total of 21,312 (96.9%) loci were recovered across all blueberry classes provided by RAPiD Genomics before filtering. After subsampling and filtering for each blueberry class, a total of 19,582 (89.0%), 19,737 (89.7%), and 19,727 (89.7%) were recovered in NHB, SHB, and RE, respectively (Table 1). However, of these only 19,439 (88.4%), 19,557 (88.9%), and 19,513 (88.7%) were polymorphic for NHB, SHB, and RE, respectively. The platform achieved uniform recovery across chromosome and locus class within all blueberry classes (data not shown). However, there was an overall decline from domesticated to more distantly related accessions. The number of recovered loci that were also considered polymorphic within each blueberry class remained high (difference between recovered and polymorphic recovered) with a decrease of 0.6%, 0.8%, 1.0%, 3.0%, and 3.6% in NHB, SHB, RE, Cyanococcus, and Non-Cyanococcus samples, respectively (Table 1).
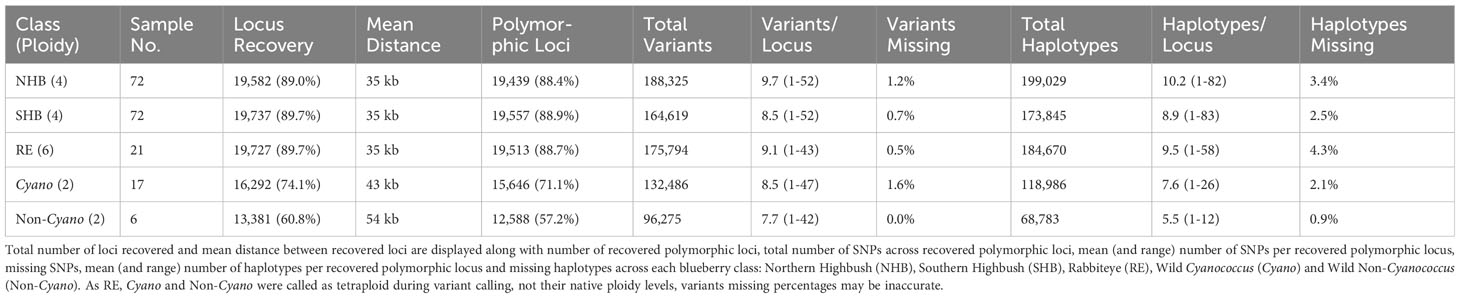
Table 1 Summary statistics for Flex-Seq loci genotyping platform.
Both NHB and SHB had the largest range of variants per locus from 1-52, decreasing to 1-47 in Cyanococcus, 1-43 in RE, and 1-42 in Non-Cyanococcus. However, NHB had the highest mean number of variants per locus at 9.7, followed by RE with 9.1, SHB and Cyanococcus with 8.5, and Non-Cyanococcus with 7.7. Interestingly, despite NHB having the lowest number of recovered polymorphic loci amongst domesticated blueberry classes, NHB had the highest number of variants per locus (Table 1). In all classes, the mean number of variants per locus increased from core genes to, accessory genes, intergenic regions, and unknown (Table 2). NHB increased from 9.0 to 14.4 variants per locus from core genes to unknown loci. SHB had the smallest increase from 7.8 to 12.1 variants per locus from core genes to unknown loci, whereas Non-Cyanococcus had the largest increase from 7.4 to 13.6 variants per locus. Due to one Cyanococcus and three Non-Cyanococcus samples significantly skewing the results mentioned earlier, all samples within these classes were individually subsampled and assessed. Results reveal that using this approach, recovery was similar to the remaining samples, but the total number of variants was significantly reduced (Table 3).
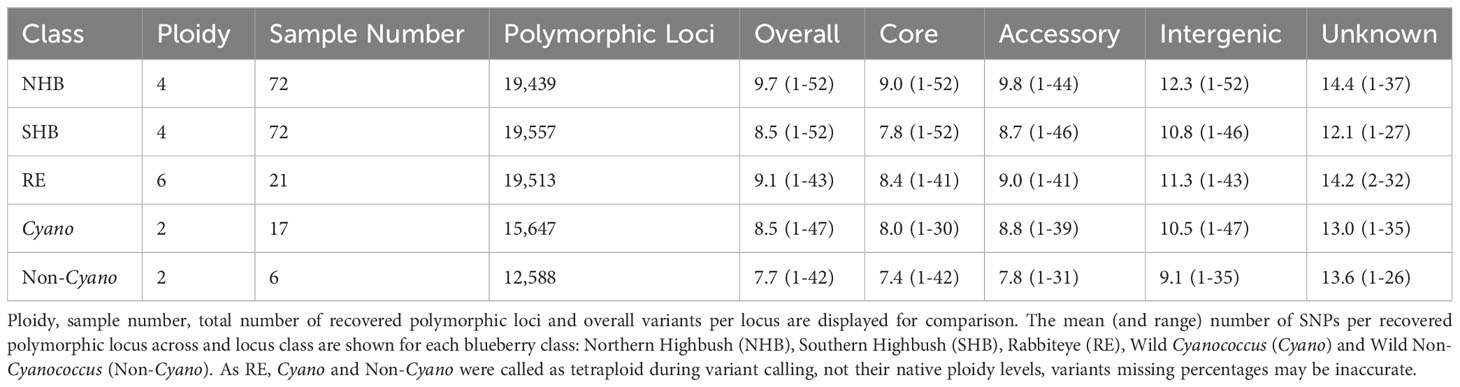
Table 2 Summary statistics of variants within each locus class of recovered polymorphic Flex-Seq loci.
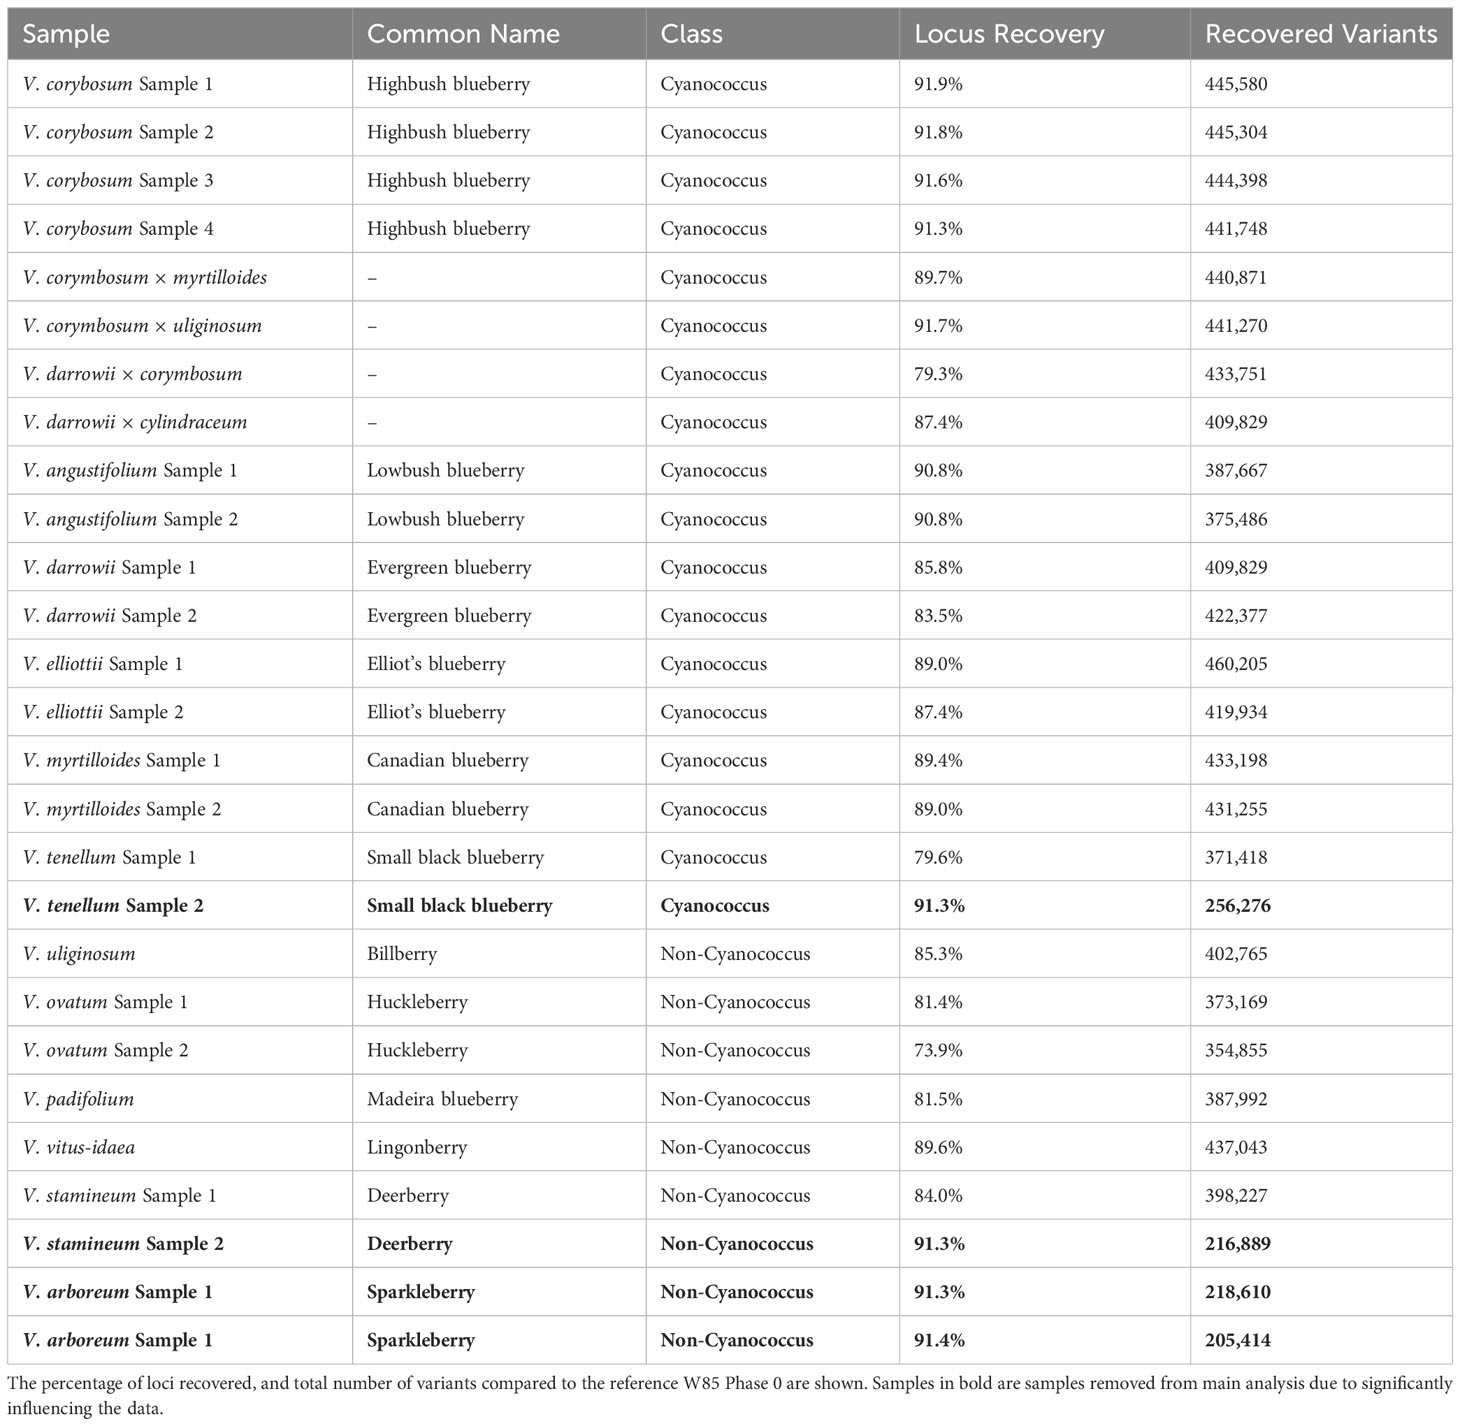
Table 3 Locus recovery in wild blueberry accessions separated by Cyanococcus and Non-Cyanococcus.
Haplotype reconstruction
Haplotypes were reconstructed utilizing variants from polymorphic loci recovered for each respective blueberry class (Table 1). However, only loci that were recovered and contained polymorphic variants are reported. Despite this, a proportion of loci that appear to contain at least one variant, only contain one haplotype suggesting there is no variant. Overall, the number of unique-in-state haplotypes per locus has the potential to exceed the number of variants per locus but is ultimately determined by the evolutionary history of the locus and linkage between each individual variant distributed throughout the locus. In all domesticated blueberries: NHB, SHB, and RE, the total number of unique-in-state haplotypes exceeded the total number of variants with 199,029 (+5.7%), 173,845 (+5.6%), and 184,670 (+5.0%) haplotypes, respectively (Table 1). Whereas the opposite was observed in wild blueberry classes with Cyanococcus and Non-Cyanococcus containing 118,986 (-10.2%) and 68,783 (-28.6%) haplotypes, respectively.
A total of 3.4% and 2.5% of all possible haplotypes calls (loci × samples × ploidy) were unresolved in NHB and SHB blueberry classes, an increase from 1.2% and 0.7% when considering missing variants. The RE shows a larger increase in missing data from 0.5% missing variants to 4.3% unresolved haplotypes calls in comparison to NHB and SHB. However, both Cyanococcus and Non-Cyanococcus classes showed a smaller increase of 1.6% and 0.0% missing variants to 2.1% and 0.9% of unresolved haplotypes calls. The mean number of reconstructed unique-in-state haplotypes per locus stayed in line with the mean number of polymorphic variants per locus for each blueberry class remaining in the same order: NHB, RE, SHB, Cyanococcus, and Non-Cyanococcus with 10.2, 9.5, 8.9, 7.6, and 5.5, respectively (Figure 3). In addition, in only the cultivated blueberry classes (NHB, SHB, RE) did the mean number of reconstructed unique-in-state haplotypes increase by 0.4-0.5 from the mean number of variants per locus, whereas the mean number of unique-in-state haplotypes decreased by 0.9-2.2 in comparison to the mean number of variants in the wild blueberry classes (Cyanococcus and Non-Cyanococcus). The largest number of unique-in-state haplotypes per locus across an entire blueberry class was 82; however, this was only recorded in NHB and SHB classes. Again, no difference was detected across chromosomes and thus it is not reported.
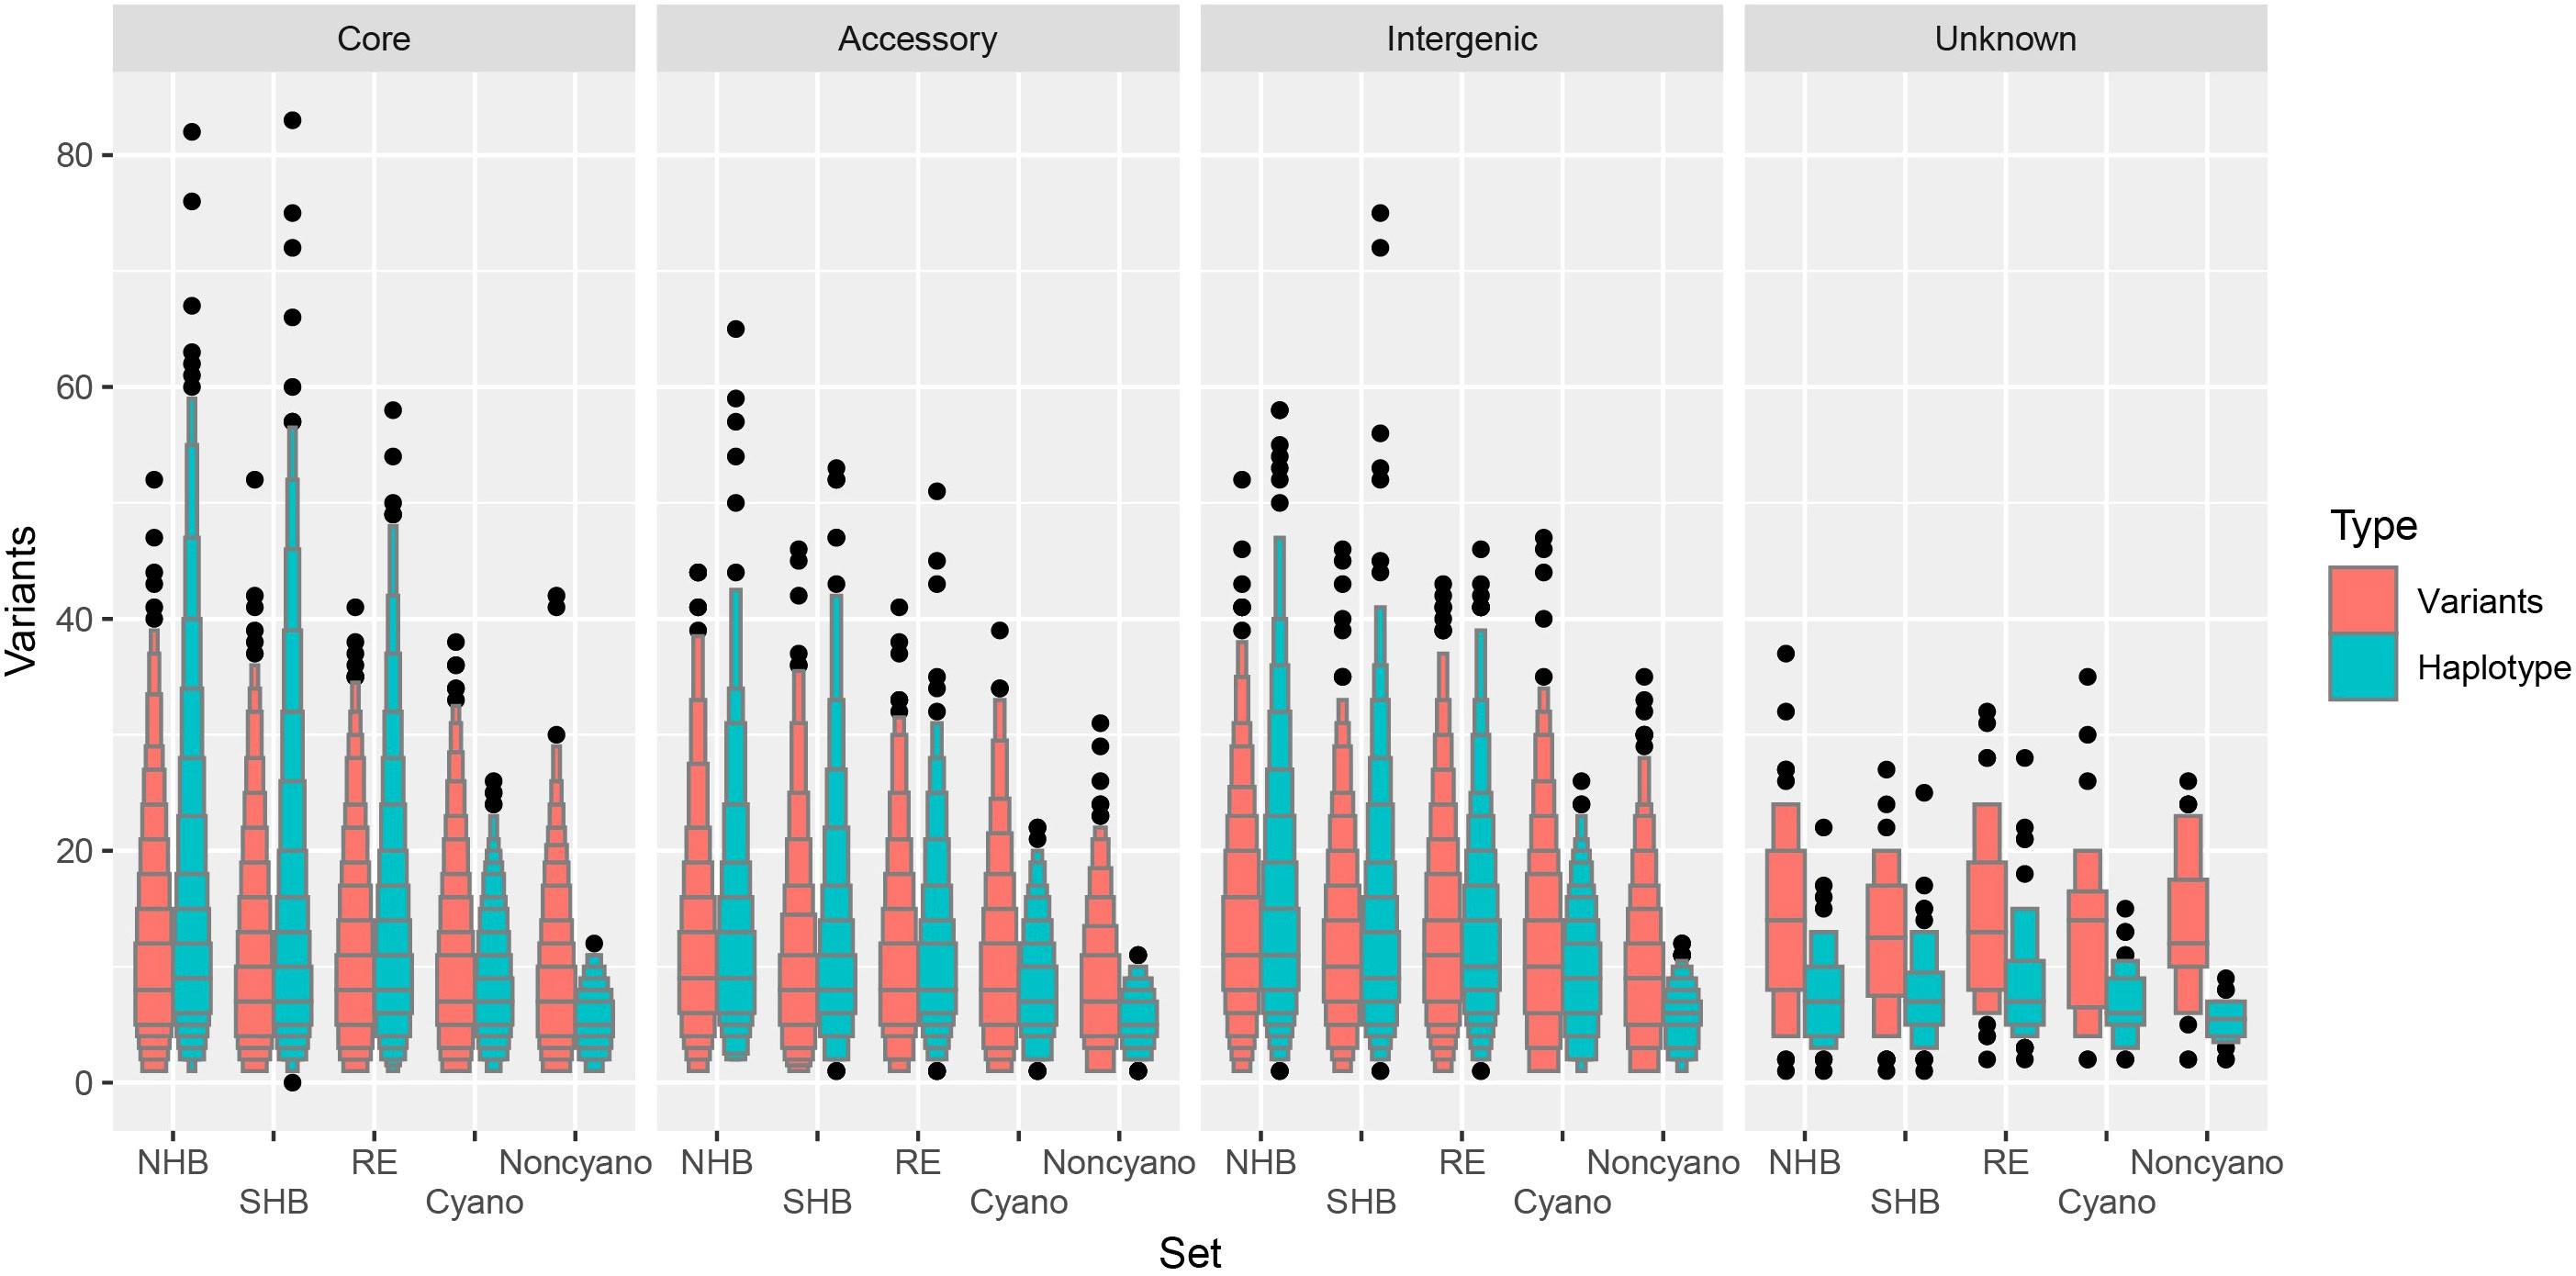
Figure 3 Letter value boxplot of number of variants within blueberries. Number of variants for biallelic single nucleotide polymorphisms (red) and haplotypes (blue) for Northern Highbush (NHB), Southern Highbush (SHB), Rabbiteye (RE), wild Cyanococcus (Cyano) and wild Non-Cyanococcus (Noncyano) and faceted by locus class that are located within core genes, accessory genes, intergenic or unknown. Figure produced using the lvplot extension of ggplot2.
Phylogenetic tree
To confirm the quality of the genotypic data, a phylogenetic tree was generated using a subsample of the biallelic SNPs (variants) to determine if the known phylogenetic relationships with blueberry could be recapitulated (Figure 4A). In addition, a haplotype-based phylogenetic tree was constructed to determine whether additional information can be extracted from the platform (Figure 4B). For both the SNP- and haplotype-based phylogenetic trees, clades clustered into approximately six groups primarily consisting of wild Non-Cyanococcus, wild Cyanococcus, RE, mixed and other wild accessions, NHB, and SHB (Figure 4), largely confirming the known phylogenetic relationships within blueberry. The diploid wild Non-Cyanococcus accessions formed the root of the tree followed by monophyletic clades of diploid wild Cyanococcus, hexaploid RE, and there was clear separation between tetraploid NHB and SHB, although some accessions appeared in opposing groups. A paraphyletic clade of accessions that appears to be a mix of NHB, SHB, RE, and wild accessions formed between the divergence of wild/RE and NHB/SHB indicating their complex ancestry. The wild W85 (V. caesariense syn. diploid V. corymbossum) accession is within the Wild & Mixed ancestry clade, corroborating the hypothesis that W85 is a possible progenitor accession of tetraploid blueberry. These results also suggest that RE originated from a separate progenitor of NHB/SHB. Both the SNP and haplotype-based phylogenetic trees support these conclusions.
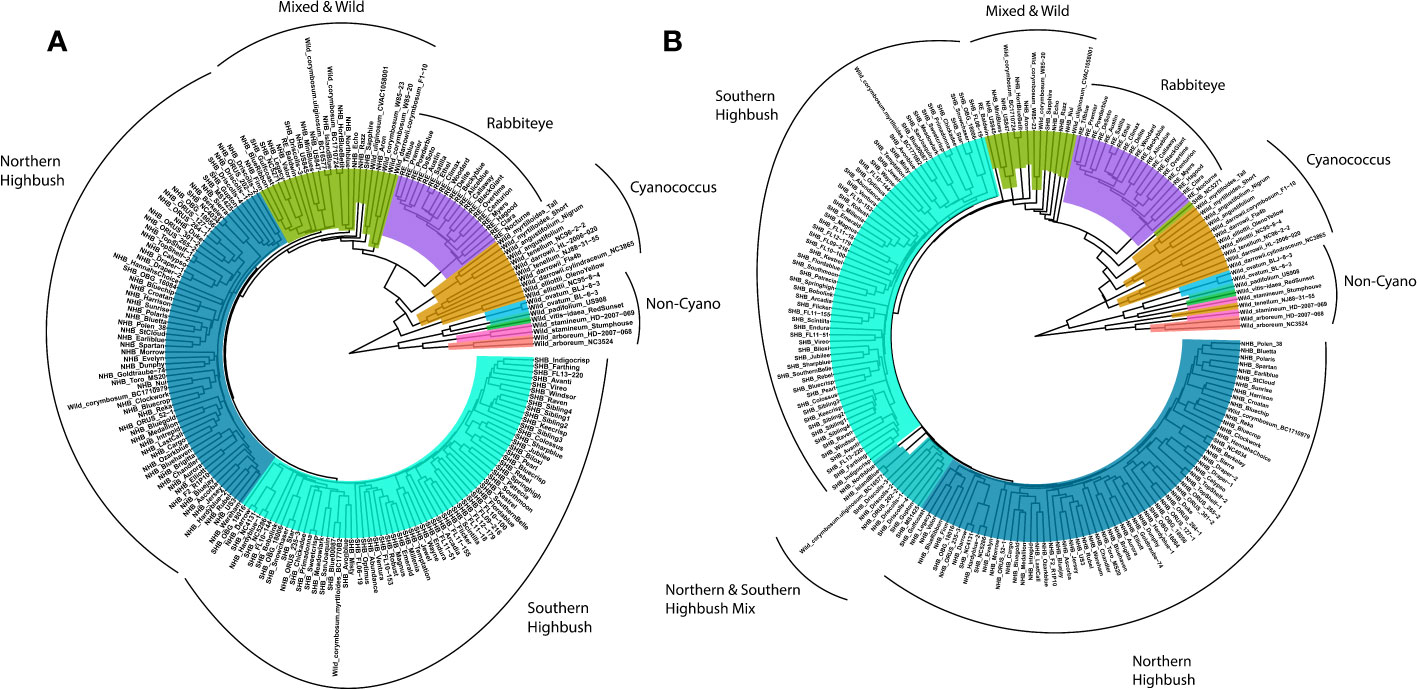
Figure 4 Phylogenetic tree of blueberry accessions included in this study constructed using (A) single nucleotide polymorphisms and (B) haplotypes. Non-Cycanococcus samples are shown in the multicolored clade, Cyanococcus are shown in mustard yellow, Rabbiteye are shown in purple, mixed accessions in green, Northern Highbush in dark blue and Southern Highbush in turquoise. Figure produced using ggtree extension of ggplot2.
However, there were multiple key differences between the SNP and haplotype-based phylogenetic trees. The main difference was the inversion of NHB and SHB clades, with the SHB clade more closely related to the Wild and RE accessions. Additionally, the NHB and SHB clades appear more resolved, with zero NHB accessions present in the SHB clade and a reduction in the number of SHB accessions in the NHB clade from five to four. The appearance of a paraphyletic clade between NHB and SHB that contains accessions previously present in the Wild & Mixed and NHB clades indicates the complex pedigrees of these blueberry cultivars. Other key differences were that the V. tenellum accession NJ88-31-55 clustered with V. darrowii in the SNP-based tree, while it clustered with V. stamineum accessions in the haplotype-based phylogenetic tree. The Wild & Mixed cluster is reduced in the haplotype-based phylogenetic tree compared with the SNP-based phylogenetic tree, primarily due to the emergence of the NHB/SHB paraphyletic clade. However, this was also contributed by the SHB accession NC5271 diverging before the RE clade, the hybrid Wild accession F1-10 (V. darrowii × corymbosum) clustering with V. darrowii in the true Wild clade, as well as the NHB cultivar Niu moving from the NHB clade to the Mixed and Wild clade.
Discussion
Researchers and breeders rely upon repeatable genotyping platforms for crop improvement to relate their research to previous studies utilizing the platform. However, a consistent marker panel under a reliable genotyping platform was lacking in blueberry. Recently, a phased reference quality genome assembly and blueberry pangenome were completed (Colle et al., 2019; Mengist et al., 2023; Yocca et al., 2023). These resources facilitated the development of a SNP catalogue that could target polymorphic regions for consistent genotyping across a diverse range of blueberry accessions. The Flex-Seq platform has numerous advantages that include high accuracy, affordability, and consistently high recovery and repeatability. The platform is also flexible to exchange probes to target different loci in the future, facilitates dosage calling and larger haplotype reconstruction, and restores the loss of information that could previously be generated with microsatellites. Lastly, the current probe panel is sufficiently dense to perform association mapping with the average distance between loci being 35 kb amongst the domesticated blueberry classes. This is lower than the predicted linkage disequilibrium decay of 73-80 kb detected in a diverse SHB population (Ferrão et al., 2018). Although variable among populations, marker density greater than the mean calculated linkage disequilibrium is critical for robust association mapping.
As the vast majority of blueberry studies are conducted within domesticated blueberry germplasm, this Flex-Seq panel will provide excellent recovery as was observed in this study (95% before filtering and 90% variant post-filtering). On the other hand, a lower recovery rate was observed in the wild blueberry classes, with a 25.9 and 39.2% loss of recovered loci within the Cyanococcus and Non-Cyanococcus classes. This could be explained by the further evolutionary distance resulting in polymorphisms within the binding sites of probes or the fact that a small number of samples were utilized in this study. Furthermore, the panel of accessions that were sequenced and used for initial variant detection using the ~50,000 fragments (FS_1902) primarily targeted highbush blueberry. Therefore, recovery may still increase with a larger sample size of wild accessions. Unrecovered loci could be recovered with increased sequencing depth and/or spiking diversity into the library from loci that were removed during filtering for low sequencing depth or not containing polymorphic loci. Nevertheless, the Flex-Seq platform would remain highly useful for genotyping wild Vaccinium samples with a known set of polymorphic loci that can be linked to domesticated Vaccinium samples.
A total of four samples within the two wild blueberry classes were also removed before further analysis due to their low number of recovered variants in comparison to other samples (Table 3). However, the reduction in total variants in these four accessions can be attributed to lower DNA quality and quantity, which resulted in the lower sequencing depth/quality. This highlighted the importance of collecting young actively growing leaves for high-quality DNA extraction to obtain a normalized library prep and uniform sequencing across all samples. Lastly, the number of variants increased steadily from the core genes to the accessory genes, intergenic regions and unknown loci. This can be explained by the higher selection pressures imposed on core genes to maintain core functions, whereas accessory genes and intergenic regions have lower selection pressures to accumulate mutations.
Average locus length of 191 bp in Flex-Seq was substantially larger than the 119 bp and 54/81 bp of Capture-Seq (Benevenuto et al., 2019) and DArTag (https://breedinginsight.org/blueberry/), respectively. Currently only a single target variant per locus can be submitted to the DArTag pipeline. However, if additional variants exist on the recovered reads, fastq data can be used to reconstruct haplotypes. This haplotype reconstruction is already a feature of the Capture-Seq technology and is significantly improved within Flex-Seq as more uniform coverage across the fragment resulting in longer, more accurate haplotype blocks. With an average of 9.7 high-quality biallelic SNP variants per recovered polymorphic locus in NHB, this results in a theoretical maximum of 831 (29.7) unique-in-state haplotypes. In reality, the mean number of unique-in-state haplotypes per locus across all NHB was 10.2 (minimum 1, maximum 82), significantly lower than the theoretical maximum due to the evolutionary history and linkage within the locus. In addition, NHB and SHB had the highest number of unique-in-state haplotypes per locus compared to other classes included in this study, however, this can be explained by the larger number of samples in these groups. Additional unique-in-state haplotypes could be achieved with the inclusion of multiallelic markers (as opposed to biallelic), more complex marker classes (multiple nucleotide polymorphism, insertions, and deletions), or increased diversity of the genotyped panel. The number of unresolved haplotype calls appears correlated with ploidy level with diploid Cyanococcus and Non-Cyanococcus classes having the least missing data, followed by tetraploid NHB/SHB classes and subsequently hexaploid RE. This would be consistent with all samples being sequenced at the same time to approximately the same depth. Therefore, proportional sequencing based on sample ploidy could help decrease the amount of missing haplotype calls in the future.
Currently we are at the beginning of haplotype analysis with no standard format for reporting haplotypes and therefore difficulty in utilizing the full power of the Flex-Seq genotyping platform. Several software packages are actively being developed, for example HapCUT2 (Edge et al., 2017) and PolyTetra/PolyOrigin (Zheng et al., 2016; Zheng et al., 2021) for haploblock reconstruction of diploids and polyploids, respectively, and whatshap (Schrinner et al., 2020) that can perform polyploid phasing and haplotagging visualization. However, these packages are limited to biallelic variants. More recently, MCHap (https://github.com/PlantandFoodResearch/MCHap) can perform polyploid haplotype reconstruction with multiallelic variants and stores haplotypes in a standard variant call format. Additional downstream software such as mpQTL (Thérèse Navarro et al., 2022), polymapR/polyqtlR, mappoly/qtlpoly (Mollinari and Garcia, 2019; da Silva Pereira et al., 2020; Mollinari et al., 2020) are able to perform multiallelic marker QTL mapping, or GridLMM (https://github.com/deruncie/GridLMM) and RAINBOWR (Hamazaki and Iwata, 2020) for multiallelic marker association mapping. However, interfaces are not always user friendly. Therefore, as the software to analyze haplotypes becomes more robust, standardized and accessible, haplotyping in addition to genotyping can be performed using Flex-Seq. Additionally, multiallelic variants or more complex marker classes could be incorporated, further increasing the number of possible unique-in-state haplotypes per locus, and making downstream analyses more accurate and informative. Preliminary analysis constructing haplotype-based phylogenetic trees may be more powerful in resolving the complex ancestry within blueberries than SNP-based phylogenetic trees. For example, the inversion of the NHB and SHB clades observed in this study utilizing haplotypes suggests that SHB is more closely related to wild blueberry accessions than NHB, whereas the SNP-based phylogenetic tree suggested SHB is derived from NHB. Both these scenarios can be argued as true as SHB originated from NHB crossed with V. darrowii to introgress the lower chilling requirement. In addition, the appearance of a paraphyletic clade between NHB and SHB in the haplotype-based phylogenetic tree suggests that these accessions are hybrids between the two classes and not more closely related to wild accessions as the SNP-based phylogenetic tree suggested. Further work is needed to investigate these complex ancestries present in blueberry.
As blueberries have the added caveat of differing ploidy levels (tetraploid in the case of NHB/SHB and hexaploid in RE), they require proportional sequencing depth to accurately call allele dosage. Previous research has shown that a depth of 25x and 90x is sufficient for accurate dosage calling in tetra- and hexaploid species, respectively (Gerard et al., 2018; Wadl et al., 2018). Accurate dosage calling is important for mapping studies (association or biparental) to determine the true gene action and contribution of allele dosage to the subsequent phenotype. Therefore, it is important to adjust sequencing depth on the Flex-Seq platform to ensure uniform recovery of loci and accurately call dosage. The Flex-Seq platform targets significantly higher number and length of loci compared to previously developed fixed loci genotyping platforms, which is advantageous for accurate polyploid dosage.
Conclusions
The Flex-Seq genotyping method provides an excellent platform that not only facilitates accurate, affordable, and reproducible marker calling but also has a consistently high recovery of targeted loci across different accessions. In addition, the Flex-Seq platform offers flexibility to alter and substitute probes to target different loci, adjust the depth of sequencing for accurate dosage calling for different ploidy levels, and larger haplotype reconstruction compared to previous platforms. The Flex-Seq platform uses two probes per locus to increase specificity and using propriety technology is able to boost the length and number of targeted loci significantly higher than previous platforms. While targeting the tetraploid cultivated northern and southern highbush blueberries, it has proven useful in the hexaploid rabbiteye blueberry as well as other species in the same Cyanococcus section and in many Non-Cyanococcus species.
Data availability statement
The datasets presented in this study can be found in online repositories. The names of the repository/repositories and accession number(s) can be found below: https://www.ncbi.nlm.nih.gov/, PRJNA687008.
Author contributions
SC: Data curation, Formal analysis, Methodology, Software, Validation, Visualization, Writing – original draft, Writing – review & editing. MD: Data curation, Formal analysis, Methodology, Software, Writing – original draft, Writing – review & editing. TM: Software, Writing – review & editing. DC: Funding acquisition, Resources, Writing – review & editing. SM: Resources, Writing – review & editing. ST: Resources, Writing – review & editing. RE: Resources, Writing – review & editing. PM: Funding acquisition, Resources, Writing – review & editing. JB: Data curation, Resources, Writing – review & editing. DZ: Resources, Writing – review & editing. MS: Resources, Writing – review & editing. MM: Resources, Writing – review & editing. LR: Resources, Writing – review & editing. HA: Resources, Writing – review & editing. KM: Resources, Writing – review & editing. KK: Resources, Writing – review & editing. EB: Resources, Writing – review & editing. DM: Funding acquisition, Resources, Writing – review & editing. JO: Resources, Writing – review & editing. JG: Resources, Writing – review & editing. PH: Resources, Writing – review & editing. HH: Resources, Writing – review & editing. JK: Resources, Writing – review & editing. DP: Resources, Writing – review & editing. PE: Funding acquisition, Investigation, Resources, Writing – review & editing. MI: Conceptualization, Funding acquisition, Methodology, Project administration, Resources, Supervision, Writing – original draft, Writing – review & editing. NB: Conceptualization, Funding acquisition, Project administration, Resources, Supervision, Writing – original draft, Writing – review & editing.
Funding
The author(s) declare financial support was received for the research, authorship, and/or publication of this article. This work was supported by SCRI-NIFA Award 2019-51181-30015, VacciniumCAP: Leveraging genetic and genomic resources to enable development of blueberry and cranberry cultivars with improved fruit quality attributes and by USDA-ARS-NCGR CRIS Project 2072-21000-059-000D.
Acknowledgments
Authors would like to thank the Bassil Genetics Lab Team at the USDA ARS NCGR and Janice Turner at PFR for plant care, sample collection and submission. We would like to acknowledge Mark Ehlenfeldt, Ed Wheeler, Michael Dossett, Adam Wagner, Paul Sandefur, and Joel Abbey for submission of samples.
Conflict of interest
Author MS was employed by company Fall Creek Farm & Nursery, Inc. Authors JO, JG, PH, HH and JK were employed by company Driscoll’s, Inc.
The remaining authors declare that the research was conducted in the absence of any commercial or financial relationships that could be construed as a potential conflict of interest.
Publisher’s note
All claims expressed in this article are solely those of the authors and do not necessarily represent those of their affiliated organizations, or those of the publisher, the editors and the reviewers. Any product that may be evaluated in this article, or claim that may be made by its manufacturer, is not guaranteed or endorsed by the publisher.
Supplementary material
The Supplementary Material for this article can be found online at: https://www.frontiersin.org/articles/10.3389/fhort.2023.1339310/full#supplementary-material
References
Ballington J. R. (2001). Collection, utilization, and preservation of genetic resources in Vaccinium. HortScience 36, 106–213. doi: 10.21273/HORTSCI.36.2.213
Benevenuto J., Ferrão L. F. V., Amadeu R. R., Munoz P. (2019). How can a high-quality genome assembly help plant breeders? GigaScience 8, giz068. doi: 10.1093/gigascience/giz068
Burton-Freeman B. M., Sandhu A. K., Edirisinghe I. (2016). Red raspberries and their bioactive polyphenols: cardiometabolic and neuronal health links. Adv. Nutr. 7, 44–65. doi: 10.3945/an.115.009639
Bushnell B. (2022). BBMap, SourceForge. Available at: https://sourceforge.net/projects/bbmap/ (Accessed 01 June 2020).
Camacho C., Coulouris G., Avagyan V., Ma N., Papadopoulos J., Bealer K., et al. (2009). BLAST+: architecture and applications. BMC Bioinf. 10, 421. doi: 10.1186/1471-2105-10-421
Carter K. A., Liston A., Bassil N. V., Alice L. A., Bushakra J. M., Sutherland B. L., et al. (2019). Target capture sequencing unravels Rubus evolution. Front. Plant Sci. 10. Available at: https://www.frontiersin.org/articles/10.3389/fpls.2019.01615 (Accessed October 13, 2022).
Chen S., Zhou Y., Chen Y., Gu J. (2018). fastp: an ultra-fast all-in-one FASTQ preprocessor. Bioinformatics 34, i884–i890. doi: 10.1093/bioinformatics/bty560
Colle M., Leisner C. P., Wai C. M., Ou S., Bird K. A., Wang J., et al. (2019). Haplotype-phased genome and evolution of phytonutrient pathways of tetraploid blueberry. GigaScience 8, giz012. doi: 10.1093/gigascience/giz012
Danecek P., Bonfield J. K., Liddle J., Marshall J., Ohan V., DePristo M. A., et al. (2021). Twelve years of SAMtools and BCFtools. GigaScience 10, giab008. doi: 10.1093/gigascience/giab008
da Silva Pereira G., Gemenet D. C., Mollinari M., Olukolu B. A., Wood J. C., et al. (2020). Multiple QTL mapping in autopolyploids: A random-effect model approach with application in a hexaploid sweetpotato full-sib population. Genetics 215, 579–595. doi: 10.1534/genetics.120.303080
Davidson K. T., Zhu Z., Balabanov D., Zhao L., Wakefield M. R., Bai Q., et al. (2018). Beyond conventional medicine - a look at blueberry, a cancer-fighting superfruit. Pathol. Oncol. Res. 24, 733–738. doi: 10.1007/s12253-017-0376-2
do Amaral F. R., Neves L. G., R M. F. R. Jr, Mobili F., Miyaki C. Y., Pellegrino K. C.M., et al. (2015). Ultraconserved elements sequencing as a low-cost source of complete mitochondrial genomes and microsatellite markers in non-model amniotes. PloS One 10, e0138446. doi: 10.1371/journal.pone.0138446
Dobin A. (2014). If building genome index with transcriptome GTF, is 2-Pass scheme needed/ relevant then? Available at: https://groups.google.com/g/rna-star/c/yvJ6C3h7OMk?pli=1 (Accessed 1 June 2020).
Dobin A., Davis C. A., Schlesinger F., Drenkow J., Zaleski C., Jha S., et al. (2013). Star: Ultrafast universal RNA-seq aligner. Bioinformatics 29 (1), 15–21. doi: 10.1093/bioinformatics/bts635
Dobosy J. R., Rose S. D., Beltz K. R., Rupp S. M., Powers K. M., Behlke M. A., et al. (2011). RNase H-dependent PCR (rhPCR): improved specificity and single nucleotide polymorphism detection using blocked cleavable primers. BMC Biotechnol. 11, 80. doi: 10.1186/1472-6750-11-80
Edge P., Bafna V., Bansal V. (2017). HapCUT2: robust and accurate haplotype assembly for diverse sequencing technologies. Genome Res. 27, 801–812. doi: 10.1101/gr.213462.116
Edger P. P., Iorizzo M., Bassil N. V., Benevenuto J., Ferrão L. F. V., Giongo L., et al. (2022). There and back again; historical perspective and future directions for Vaccinium breeding and research studies. Horticulture Res. 9, uhac083. doi: 10.1093/hr/uhac083
Elshire R. J., Glaubitz J. C., Sun Q., Poland J. A., Kawamoto K., Buckler E. S., et al. (2011). A robust, simple genotyping-by-sequencing (GBS) approach for high diversity species. PLoS One 6, e19379. doi: 10.1371/journal.pone.0019379
Ewels P., Magnusson M., Lundin S., Käller M. (2016). MultiQC: summarize analysis results for multiple tools and samples in a single report. Bioinformatics 32, 3047–3048. doi: 10.1093/bioinformatics/btw354
Ferrão L. F. V., Benevenuto J., de B. Oliveira I., Cellon C., Olmstead J., Kirst M., et al. (2018). Insights into the genetic basis of blueberry fruit-related traits using diploid and polyploid models in a GWAS context. Front. Ecol. Evol. 6. doi: 10.3389/fevo.2018.00107
Galletta G. J., Ballington J. R. (1996). “Chapter 1: Blueberries, cranberries, and lingonberries,” in Fruit Breeding, in Volume II: Vine and Small Fruits Crops (New York: John Wiley and Sons).
Garrison E., Kronenberg Z. N., Dawson E. T., Pedersen B. S., Prins P. (2022). A spectrum of free software tools for processing the VCF variant call format: vcflib, bio-vcf, cyvcf2, hts-nim and slivar. PLoS Comput. Biol. 18, e1009123. doi: 10.1371/journal.pcbi.1009123
Garrison E., Marth G. (2012). ‘Haplotype-based variant detection from short-read sequencing. arXiv preprint arXiv 1207, 3907. doi: 10.48550/arXiv.1207.3907
Gerard D., Ferrão L. F. V., Garcia A. A. F., Stephens M. (2018). Genotyping polyploids from messy sequencing data. Genetics 210, 789–807. doi: 10.1534/genetics.118.301468
Gilbert J. L., Guthart M. J., Gezan S. A., de Carvalho M. P., Schwieterman M. L., Colquhoun T. A., et al. (2015). Identifying breeding priorities for blueberry flavor using biochemical, sensory, and genotype by environment analyses. PLoS One 10, e0138494. doi: 10.1371/journal.pone.0138494
Hamazaki K., Iwata H. (2020). RAINBOW: Haplotype-based genome-wide association study using a novel SNP-set method. PLoS Comput. Biol. 16, e1007663. doi: 10.1371/journal.pcbi.1007663
Iorizzo M., Lila M. A., Perkins-Veazie P., Luby C., Vorsa N., Edger P., et al. (2023). VacciniumCAP, a community-based project to develop advanced genetic tools to improve fruit quality in blueberry and cranberry. Acta Hortic. 1362, 71–80. doi: 10.17660/ActaHortic.2023.1362.11
Jaccoud D., Peng K., Feinstein D., Kilian A. (2001). Diversity Arrays: a solid state technology for sequence information independent genotyping. Nucleic Acids Res. 29, e25. doi: 10.1093/nar/29.4.e25
Jones N., Ougham H., Thomas H. (1997). Markers and mapping: we are all geneticists now. New Phytol. 137, 165–177. doi: 10.1046/j.1469-8137.1997.00826.x
Kamvar Z. N., Tabima J. F., Grünwald N. J. (2014). Poppr: an R package for genetic analysis of populations with clonal, partially clonal, and/or sexual reproduction. PeerJ 2, e281. doi: 10.7717/peerj.281
Klee H. J., Tieman D. M. (2018). The genetics of fruit flavour preferences. Nat. Rev. Genet. 19, 347–356. doi: 10.1038/s41576-018-0002-5
Li H., Durbin R. (2009). Fast and accurate short read alignment with Burrows–Wheeler transform. Bioinformatics 25, 1754–1760. doi: 10.1093/bioinformatics/btp324
Li H., Handsaker B., Wysoker A., Fennell T., Ruan J., Homer N., et al. (2009). The sequence alignment/map format and SAMtools. Bioinformatics 25, 2078–2079. doi: 10.1093/bioinformatics/btp352
Luby J. J., Ballington J. R., Draper A. D., Pliszka K., Austin M. D. (1991). Blueberries and cranberries (Vaccinium). Acta Hortic. 290, 393–456. doi: 10.17660/ActaHortic.1991.290.9
Lundberg D. S., Yourstone S., Mieczkowski P., Jones C. D., Dangl J. L. (2013). Practical innovations for high-throughput amplicon sequencing. Nat. Methods 10, 999–1002. doi: 10.1038/nmeth.2634
Manzanero B. R., Kulkarni K. P., Vorsa N., Reddy U. K., Natarajan P., Elavarthi S., et al. (2023). Genomic and evolutionary relationships among wild and cultivated blueberry species. BMC Plant Biol. 23, 126. doi: 10.1186/s12870-023-04124-y
McKenna A., Hanna M., Banks E., Sivachenko A., Cibulskis K., Kernytsky A., et al. (2010). The Genome Analysis Toolkit: A MapReduce framework for analyzing next-generation DNA sequencing data. Genome Res. 20, 1297–1303. doi: 10.1101/gr.107524.110
Mengist M. F., Bostan H., De Paola D., Teresi S. J., Platts A. E., Cremona G., et al. (2023). Autopolyploid inheritance and a heterozygous reciprocal translocation shape chromosome genetic behavior in tetraploid blueberry (Vaccinium corymbosum). New Phytol. 237, 1024–1039. doi: 10.1111/nph.18428
Mölder F., Jablonski K. P., Letcher B., Hall M. B., Tomkins-Tinch C. H., Sochat V., et al. (2021). Sustainable data analysis with Snakemake. F1000Research 10. doi: 10.12688/f1000research.29032.2
Mollinari M., Garcia A. A. F. (2019). Linkage analysis and haplotype phasing in experimental autopolyploid populations with high ploidy level using hidden Markov models. G3 Genes|Genomes|Genetics 9, 3297–3314. doi: 10.1534/g3.119.400378
Mollinari M., Olukolu B. A., da S. Pereira G., Khan A., Gemenet D., Yencho G. C., et al. (2020). Unraveling the hexaploid sweetpotato inheritance using ultra-dense multilocus mapping. G3 Genes|Genomes|Genetics 10, 281–292. doi: 10.1534/g3.119.400620
Montanari S., Deng C., Koot E., Bassil N. V., Zurn J. D., Morrison-Whittle P., et al. (2022). A multiplexed plant-animal SNP array for selective breeding and species conservation applications. G3 Genes|Genomes|Genetics 13, jkad170. doi: 10.1101/2022.09.07.507051
Quinlan A. R., Hall I. M. (2010). BEDTools: a flexible suite of utilities for comparing genomic features. Bioinformatics 26, 841–842. doi: 10.1093/bioinformatics/btq033
R Core Team (2022). R: A language and environment for statistical computing. Vienna, Austria. Available at: https://www.R-project.org/.
Sayers E. W., Bolton E. E., Brister J. R., Canese K., Chan J., Comeau D. C., et al. (2022). Database resources of the national center for biotechnology information. Nucleic Acids Res. 50 (D1), D20–D26. doi: 10.1093/nar/gkab1112
Schenk P. M., Kazan K., Wilson I., Anderson J. P., Richmond T., Somerville S. C., et al. (2000). Coordinated plant defense responses in Arabidopsis revealed by microarray analysis. Proc. Natl. Acad. Sci. 97, 11655–11660. doi: 10.1073/pnas.97.21.11655
Schrinner S. D., Mari R. S., Ebler J., Rautiainen M., Seillier L., Reimer J. J., et al. (2020). Haplotype threading: accurate polyploid phasing from long reads. Genome Biol. 21, 252. doi: 10.1186/s13059-020-02158-1
Scolnick J. A., Dimon M., Wang I.-C., Huelga S. C., Amorese D. A. (2015). An efficient method for identifying gene fusions by targeted RNA sequencing from fresh frozen and FFPE samples. PloS One 10, e0128916. doi: 10.1371/journal.pone.0128916
Semagn K., Babu R., Hearne S., Olsen M. (2014). Single nucleotide polymorphism genotyping using Kompetitive Allele Specific PCR (KASP): overview of the technology and its application in crop improvement. Mol. Breed. 33, 1–14. doi: 10.1007/s11032-013-9917-x
Strik B. C., Yarborough D. (2005). Blueberry production trends in North America 1992 to 2003, and Predictions for Growth. HortTechnology 15, 391–398. doi: 10.21273/HORTTECH.15.2.0391
Thérèse Navarro A., Tumino G., Voorrips R. E., Arens P., Smulders M. J. M., van de Weg E., et al. (2022). Multiallelic models for QTL mapping in diverse polyploid populations. BMC Bioinf. 23, 67. doi: 10.1186/s12859-022-04607-z
USDA NASS (2022). National Hop Report (USDA, Washington: USDA Annual Reports). Available at: https://www.nass.usda.gov/Publications/Todays_Reports/reports/ncit0522.pdf.
Van der Auwera G. A., Carneiro M. O., Hartl C., Poplin R., del Angel G., Levy-Moonshine A., et al. (2013). From FASTQ data to high-confidence variant calls: The Genome Analysis Toolkit Best Practices Pipeline. Curr. Protoc. Bioinf. 43 (1), 11.10.1–11.10.33. doi: 10.1002/0471250953.bi1110s43
Vasimuddin Md., Misra S., Li H., Aluru S. (2019). Efficient Architecture-Aware Acceleration of BWA-MEM for Multicore Systems, in 2019 IEEE International Parallel and Distributed Processing Symposium (IPDPS). (Rio de Janeiro, Brazil: IEEE), 314–324. doi: 10.1109/IPDPS.2019.00041
Wadl P. A., Olukolu B. A., Branham S. E., Jarret R. L., Yencho G. C., Jackson D. M. (2018). Genetic diversity and population structure of the USDA sweetpotato (Ipomoea batatas) germplasm collections using GBSpoly. Front. Plant Sci. 9. doi: 10.3389/fpls.2018.01166
Weeks N. (2014). Scripts, GitHub. Available at: https://github.com/nathanweeks/scripts/blob/master/intron-length.awk (Accessed 01 June 2020).
Wenzl P., Carling J., Kudrna D., Jaccoud D., Huttner E., Kleinhofs A., et al. (2004). Diversity Arrays Technology (DArT) for whole-genome profiling of barley. Proc. Natl. Acad. Sci. 101, 9915–9920. doi: 10.1073/pnas.0401076101
Wickham H. (2016). ggplot2: Elegant Graphics for Data Analysis (New York: Springer-Verlag New York).
Yocca A. E., Platts A., Alger E., Teresi S., Mengist M. F., Benevenuto J., et al. (2023). Blueberry and cranberry pangenomes as a resource for future genetic studies and breeding efforts. Horticulture Research 10, uhad202. doi: 10.1101/2023.07.31.551392
Yu G. (2020). Using ggtree to visualize data on tree-like structures. Curr. Protoc. Bioinf. 69, e96. doi: 10.1002/cpbi.96
Zheng C., Amadeu R. R., Munoz P. R., Endelman J. B. (2021). Haplotype reconstruction in connected tetraploid F1 populations. Genetics 219, iyab106. doi: 10.1093/genetics/iyab106
Keywords: Vaccinium, blueberry, genotyping, haplotyping, dosage calling, flex-seq, polyploids
Citation: Clare SJ, Driskill M, Millar TR, Chagné D, Montanari S, Thomson S, Espley RV, Muñoz P, Benevenuto J, Zhao D, Sheehan MJ, Mengist MF, Rowland LJ, Ashrafi H, Melmaiee K, Kulkarni KP, Babiker E, Main D, Olmstead JW, Gilbert JL, Havlak P, Hung H, Kniskern J, Percival D, Edger P, Iorizzo M and Bassil NV (2024) Development of a targeted genotyping platform for reproducible results within tetraploid and hexaploid blueberry. Front. Hortic. 2:1339310. doi: 10.3389/fhort.2023.1339310
Received: 15 November 2023; Accepted: 27 December 2023;
Published: 15 January 2024.
Edited by:
Ioannis Ganopoulos, Hellenic Agricultural Organization – ELGO, GreeceReviewed by:
Pablo Aleza, Valencian Institute for Agricultural Research (IVIA), SpainAnastasia Boutsika, Aristotle University of Thessaloniki, Greece
Copyright © 2024 Clare, Driskill, Millar, Chagné, Montanari, Thomson, Espley, Muñoz, Benevenuto, Zhao, Sheehan, Mengist, Rowland, Ashrafi, Melmaiee, Kulkarni, Babiker, Main, Olmstead, Gilbert, Havlak, Hung, Kniskern, Percival, Edger, Iorizzo and Bassil. This is an open-access article distributed under the terms of the Creative Commons Attribution License (CC BY). The use, distribution or reproduction in other forums is permitted, provided the original author(s) and the copyright owner(s) are credited and that the original publication in this journal is cited, in accordance with accepted academic practice. No use, distribution or reproduction is permitted which does not comply with these terms.
*Correspondence: Nahla V. Bassil, TmFobGEuQmFzc2lsQHVzZGEuZ292
†ORCID: Shaun J. Clare, orcid.org/0000-0003-2887-3404
Timothy R. Millar, orcid.org/0000-0002-5142-8811
David Chagné, orcid.org/0000-0003-4018-0694
Sara Montanari, orcid.org/0000-0001-9224-056X
Patricio Muñoz, orcid.org/0000-0001-8973-9351
Juliana Benevenuto, orcid.org/0000-0002-4698-2738
Dongyan Zhao, orcid.org/0000-0002-2080-8416
Moira J. Sheehan, orcid.org/0000-0002-3400-2165
Nahla V. Bassil, orcid.org/0000-0001-8625-2740