 Jane Lukhachi Ambuko
 Sharon Mayienga Masakhwe
 Emmanuel Amwoka
 Esther Mujuka
 Carola Fabi2
- 1Department of Plant Science and Crop Protection, University of Nairobi, Nairobi, Kenya
- 2Department of Economic and Social Development, Statistics Division, Food and Agriculture Organization of the United Nations, Rome, Italy
- 3Department of Agricultural Economics, University of Nairobi, Nairobi, Kenya
Low consumption of fruits and vegetables (FV) is in part attributed to unavailability and cost, especially among the low-income populations. High postharvest losses contribute to low availability and cost. According to the FAO report of 2011, 44% of all the FV produced are lost or wasted along the supply chain. Although there have been efforts to reduce food loss and waste (FLW) in FV, the interventions are often misguided due to lack of reliable data on critical loss points, the causes/driver of losses, extent of losses and context-appropriate interventions. This mini review sought to highlight the FLW data gaps with a focus on FV value chains. The review used the FLW database created by FAO as an online collection of literature on FLW from 1965 to 2022. Through a stepwise review of open access articles in the FAO database and other open access sources on the internet, the extent and trends of losses (median), the number of published articles, data collection methodology and the priority value chain on FLW research in different countries within the sub-Saharan Africa (SSA) region was explored. The mini review shows that there are about 632 openly accessible publications on FLW, including 259 on cereals and pulses,190 on fruits and vegetables, 118 on Roots, tubers and oil-bearing crops and 32 on meat and animal products. Out of the 190 articles on FV globally, 66 articles focused on SSA on mango, banana and tomato. Most of the studies have focused on Asia and Africa with very few studies on FLW status in North America and Europe. Within SSA, Ghana and Kenya alone contributed 47% of the published articles on FV. Most of the studies focused on the farm level and the distribution stages accounting for 44% and 25% respectively of the published articles. This review highlights FLW data gaps and skewedness in the available data. Policies and interventions to reduce FLW towards the set targets such as sustainable development goal, SDG 12.3 require the FLW data gaps to be addressed. Otherwise, blind interventions that are not guided by reliable evidence will continue missing the target.
1 Background
Horticultural food crops including fruit vegetables herbs spices are a critical essential component of healthy diets. They add color flavor variety to meals while providing essential nutrients including vitamins minerals fiber health promoting bioactive compounds. The importance of fruits vegetables in diets has seen production increase exponentially over the years.
According to FAOSTAT (2020), global production of fruit has increased from just 250 million MT in 1968 to over 850 million MT in 2018. Asia is the leading producer of fruits with the regional production estimated to be 500 MT in 2018, a more than five-fold increase from the 1968 production volumes. A similar trend is reported in vegetables with the global production increasing from 220 million MT in 1968 to over 1 trillion MT in 2018 where Asia leads with more than 80% of the total production. However, despite increased production, according to SOFI 2024 report, around 2.8 billion people were unable to access a healthy diet in 2022. In addition, an estimated 733 million people go hungry every day, while the food they need is lost or wasted (UNICEF, 2024).
Despite increased production of the years, this increase has not been able to match the global growth in population, supply to meet the recommended daily intake of FV (400 g) is low and hence consumption is below average for most regions. The reported global per capita availability of FV per day is 390 g. In Africa, the daily per capita availability is estimated to be 191 g, which is less than half of the daily recommended intake (FAO, 2020). Availability of FV requires not only adequate production but also measures that ensure efficient delivery of these commodities to the consumer. Inefficiencies in the food supply chain and consequent food loss and waste (FLW) in part contributes to low availability of FV in some regions such as Africa and other low-income countries.
The strategic reduction of FLW to achieve environmental, social and economic objectives require understanding the extent, the critical loss points, the causes and impact. A clear mapping of the of FLW points in terms of geographic location, commodity group/commodities and stages of the food supply chain is essential to formulate effective policies to achieve FLW reduction and a critical for the transition to sustainable agrifood systems. Accurate statistics on FLW in FV is scanty for all regions. According to the FAO (2011) report FLW in FV was estimated to be 44% of the total production. In later reports FLW has been separated into two components as food loss (occurring between harvest and retail stages of the supply chain) and food waste (occurring between retail and consumption stage). In the FAO report (2019) food loss in FV is estimated to be 22% of the total production. The global average for food waste at the retail is 15% but is higher in some regions such as Africa (35%). Available data from modeled estimates also show glaring discrepancies and variability, even in the same commodity group and at the same stage of the supply chain (Figure 1).
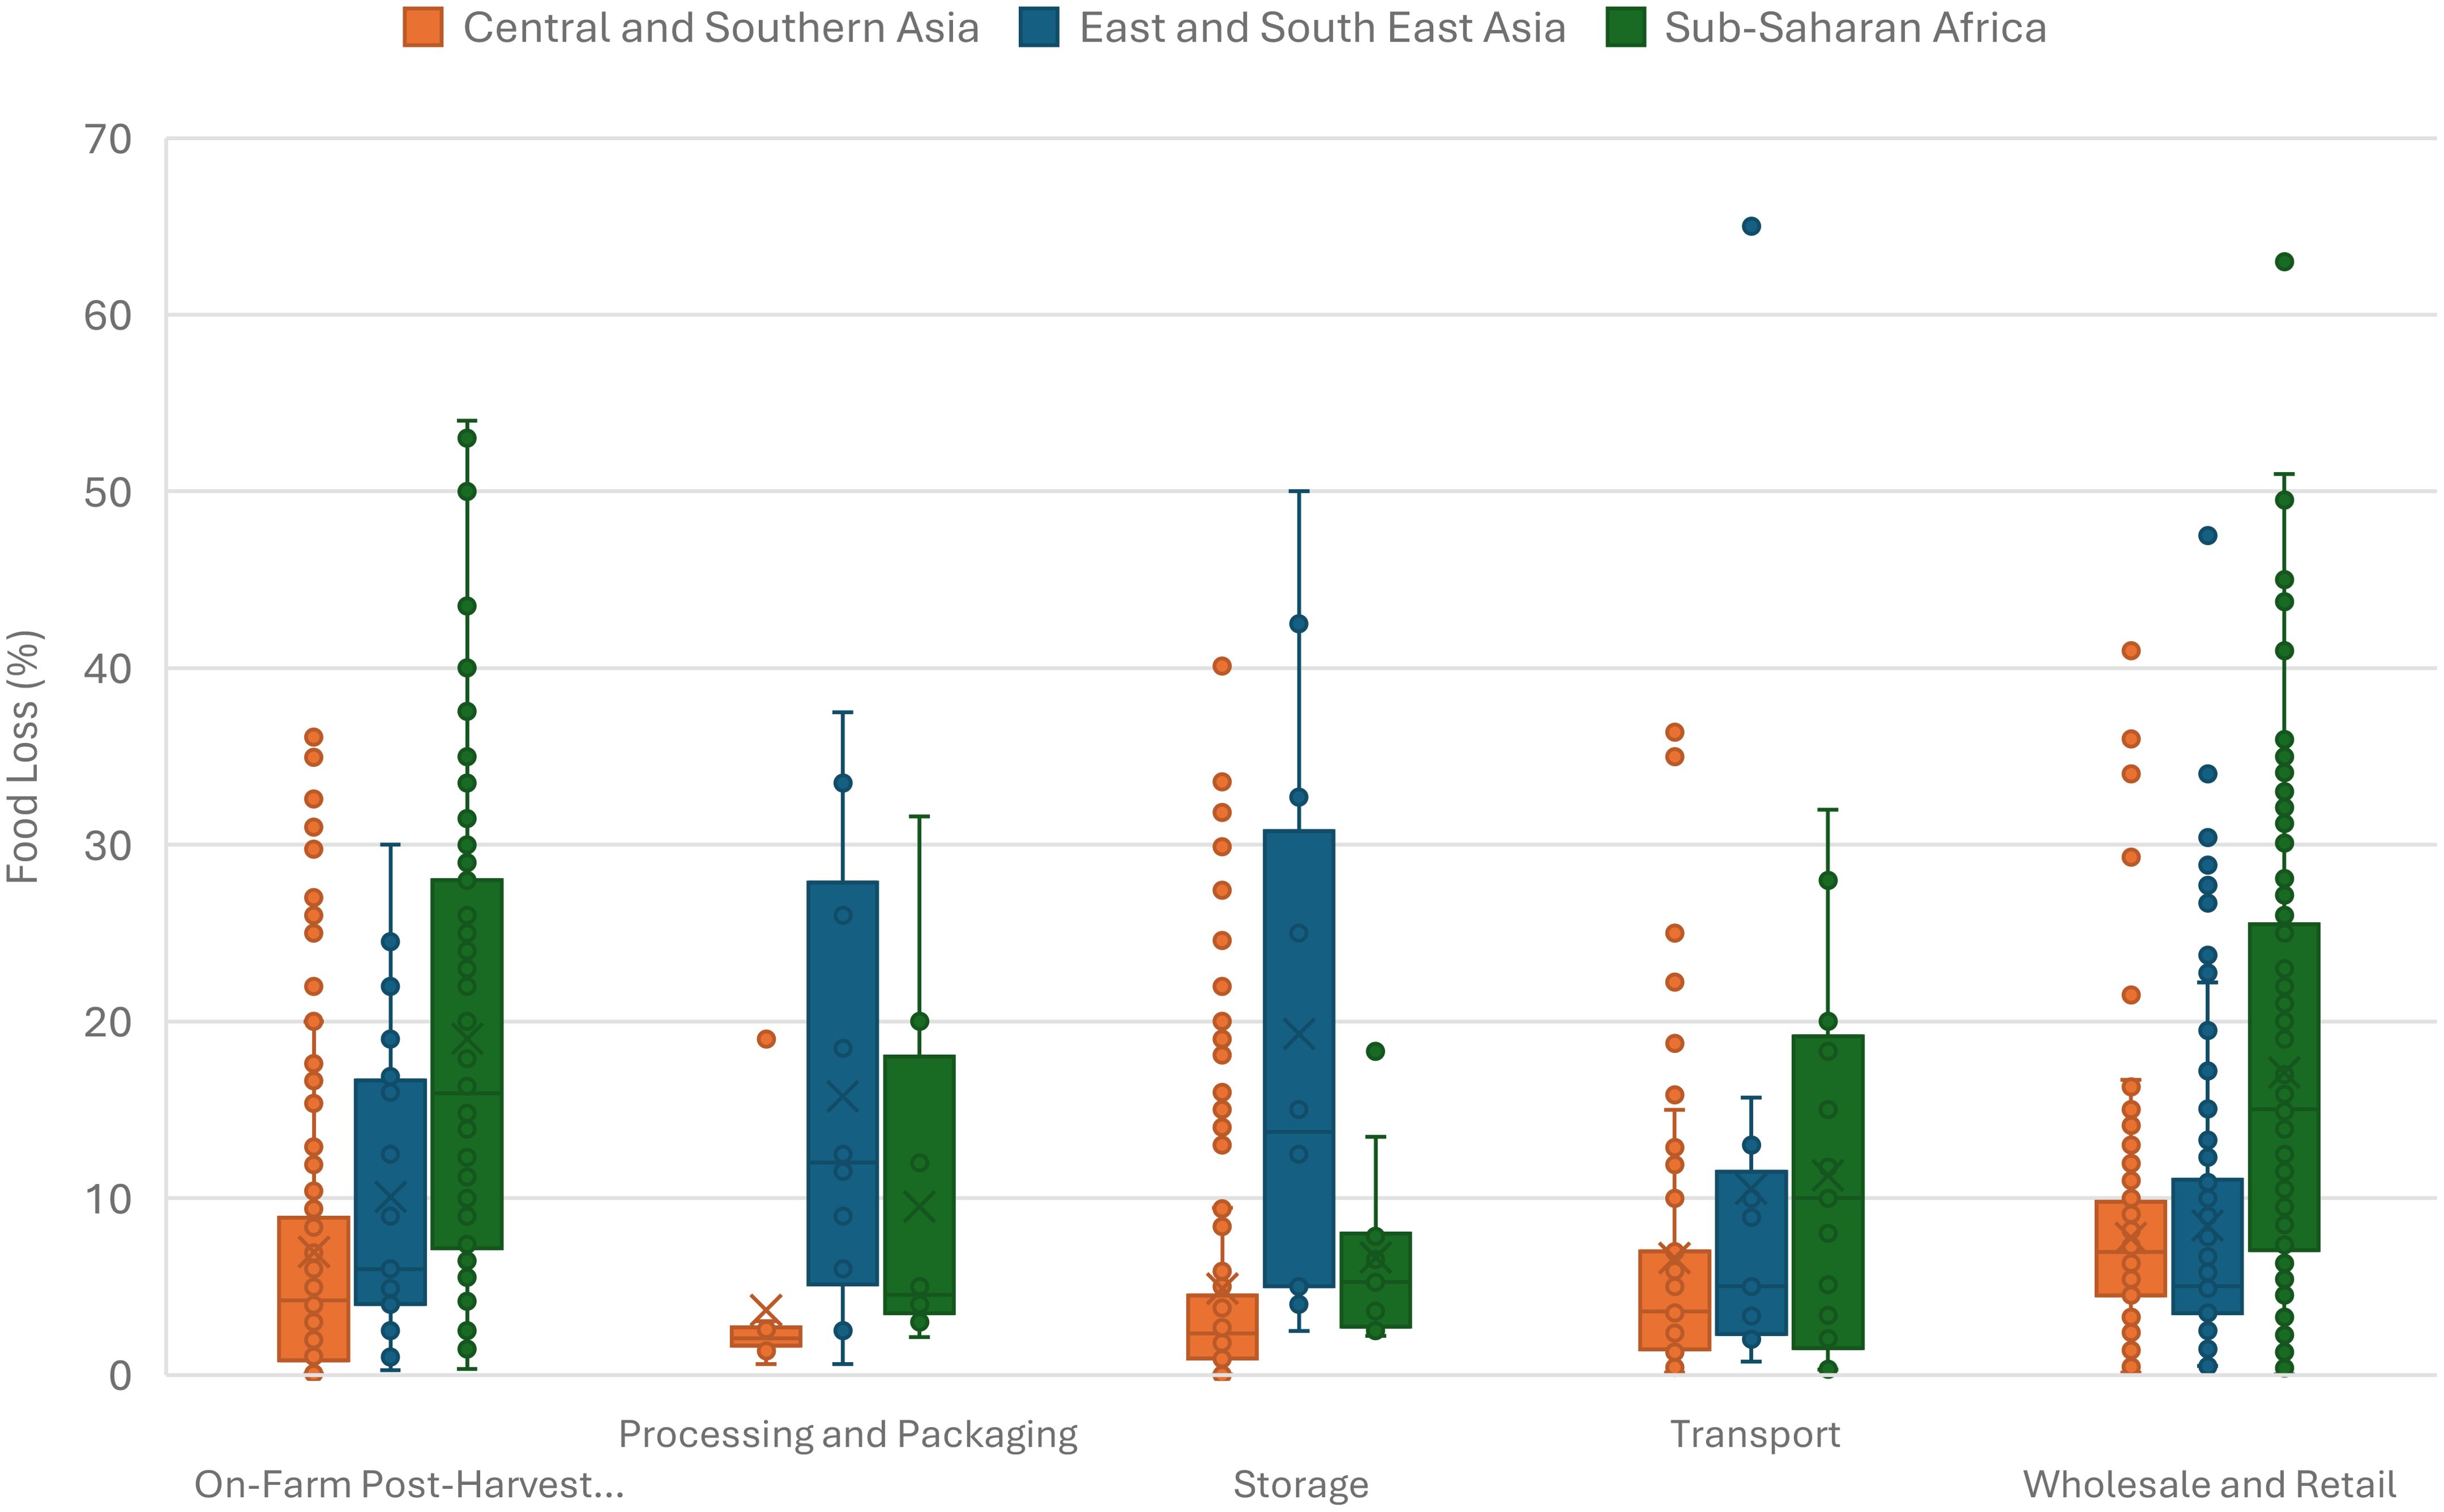
Figure 1. Range (median and extremes) of reported food loss and waste (%) in fruits and vegetables by supply chain stage, 1965–2022 Source: Authors’ own elaboration using data available on the FAO FLW Database.
Food loss and waste (FLW) has a significant negative impact on food and nutrition security, environmental sustainability and economic viability. Addressing FLW in FV value chains is important as a strategy not only to increase availability of these nutritious dietary components but also to ensure sustainability of our food systems. Efforts to address FLW have been hampered by inadequate and unreliable data on the extent of losses, the causes, the critical loss point, the impact and possible interventions to address the causes.
Knowledge of the extent of FLW and where it occurs is critical in the efforts to develop effective strategies and solutions to reduce the losses. In FV, losses are both quantitative and qualitative. Most of the available data has focused more on the extent of quantitative losses. Quantitative losses refer to a decrease in the mass of food destined for human consumption as it is removed from the food supply chain. Quantitative losses are easy to measure and report because they are physical and evident. On the other hand, qualitative losses refer to the decrease in attributes that reduces the value of food and the intended use including reduced nutritional, safety or economic value. Qualitative losses are not always obvious or evident and are hardly reported. Incidentally FV are highly prone to qualitative losses at all stages of the supply chain. Estimation and reporting of qualitative losses is important in efforts to ensure that the FV available to consumers are of desirable and optimum quality that meets the recommended intake for healthy diets. For the quantitative losses, the measurement is often skewed, focusing only on certain stages of the supply chain (FAO, 2019). The reported data is based on estimates and where data does not exist, modeled estimates are derived from similar or related contexts. Such extrapolation or modeled estimates often fail to consider contextual differences that affect the extent of losses.
Alongside the extent, the causes and drivers of losses must be identified and contextualized to ensure targeted and prioritized interventions for effective reduction of FLW. Causes vary with the produce, stage of the supply chain and the context (HLPE, 2014). There are direct causes which are associated with actions or lack of action of the actors at a particular stage of the supply chain. Indirect causes are systemic and refer to the economic, cultural and political environment of the food system under which actors operate. Indirect causes (also referred to as drivers of FLW) are beyond control of the individual actors but influence their actions that may contribute to FLW (FAO, 2019). An example of indirect factors that may contribute to FLW is poor road infrastructure that may hinder access to farms by traders hence high on-farm losses. Similarly lack of resources to invest in cold storage and refrigerated trucks for storage and transport of FV are also indirect causes of FLW in FV. Causes of FLW have also been categorized as micro, meso or macro causes. The micro causes occur at each stage of the supply chain where FLW occurs and is a result of the actions or lack of actions of individual actors at a stage. Meso causes are secondary factors associated with organization and coordination of the different actors or poor infrastructure. They contribute to micro-level causes or determine their extent. Meso causes can be found at the same or at another stage of the chain than where FLW happens. Macro-level causes refer to systemic issues which include a malfunctioning food system, the lack of institutional or policy conditions to facilitate the coordination of actors (HLPE, 2014). As causes of FLW are identified, it is important to identify the critical loss points (CLPS). These are points along the food supply chain where losses are most prominent and have the greatest impact. Identification of CLPs is essential for developing effective strategies and targeted interventions to reduce FLW.
Alongside measurement, it is important that the negative social, economic and environmental impact is quantified to inform policy-guided interventions. From a social perspective, it is estimated that the food that is lost annually can feed up to 2 billion people. In FV, a deeper understanding of the impact of FLW on access to nutritious food and healthy diets could influence policy interventions. The estimated value of food that is lost/wasted annually is USD 1 trillion. FLW negatively affects the incomes and livelihoods of millions of food supply chain practitioners, especially farmers. The negative impact of FLW on the environment refers to the contribution on Greenhouse Gases (GHG) which is estimated to be 12% of the total GHG that continue to contribute to climate change (Zhu et al., 2023). In addition, FLW had a negative water and land food print as these limited natural resources are used in vain to produce food that goes to waste.
The negative impact of FLW on food and nutrition security and the environment has led to a call to action by all actors in the agri-food sector. Therefore, targets have been set at global, regional and local levels to reduce FLW. At the global level, under the sustainable development goals (SGDs), a target (12.3) has been set under SDG 12 to halve per capita global food waste at the retail and consumer levels and reduce food losses along production and supply chains, including post-harvest losses by 2030 (FAO, 2019). This target has been cascaded and adopted by regions, countries and entities within countries. In Africa, the African Union heads of state set a target under the Malabo declaration of 2014 to halve postharvest losses by 2025 (African Union, 2014). Monitoring progress towards realization of these targets requires reliable data. Similarly, data is required to inform and guide targeted interventions and their impact on FLW reduction.
Although some efforts are ongoing to address the FLW data gaps, there are biases including commodity groups, stages of the supply chain, geographical regions among other biases that lead to glaring data gaps.
The objective of this mini review of literature was to identify and map gaps in the available openly accessed data on food loss and waste. Specifically, the mini review sought to identify gaps in published papers on FLW in fruits and vegetables with a focus on Africa.
2 Methodology
The literature search, screening and review followed four steps as described below:
Step 1: Identification of all published articles on postharvest losses (general).
This search focused on the available literature in the FAO Food Loss and Waste (FLW) Database. This is an online platform managed by FAO that has a collection of data on food loss and waste reported from various openly accessible sources. The database contains articles from scientific journals, academic publications and grey literature. To complement the FAO database, an open semantic search was done on the internet to identify articles on food loss and waste that were not captured in the FAO database. The search was done on various sites including google scholar and research gate. The key words used in the search were food loss(es), food waste and Post-harvest loss(es).
Step 2: Screening of accessed articles by region.
The second step was to review all the data obtained from the FAO FLW database and other internet sources and distribute it into regional groupings. This was aimed at highlighting the regional distribution of FLW articles in various commodity groups. More analysis was conducted on the data from SSA which is the focus of the mini review.
Step 3: Screening of accessed articles for the SSA region by commodity group.
The data for SSA was further sub-divided into commodity groups to determine data availability and distribution by country and commodity group.
Step 4: In-depth screening of articles on fruits and vegetables.
Further analysis of the data obtained for FV in SSA sought to explore the nature of data available in FV. The screening established the extent (range) of losses reported for different stages of the FV supply chains and the methods used to collect the data reported.
A schematic presentation of the steps followed in the methodology is presented in Figure 2.
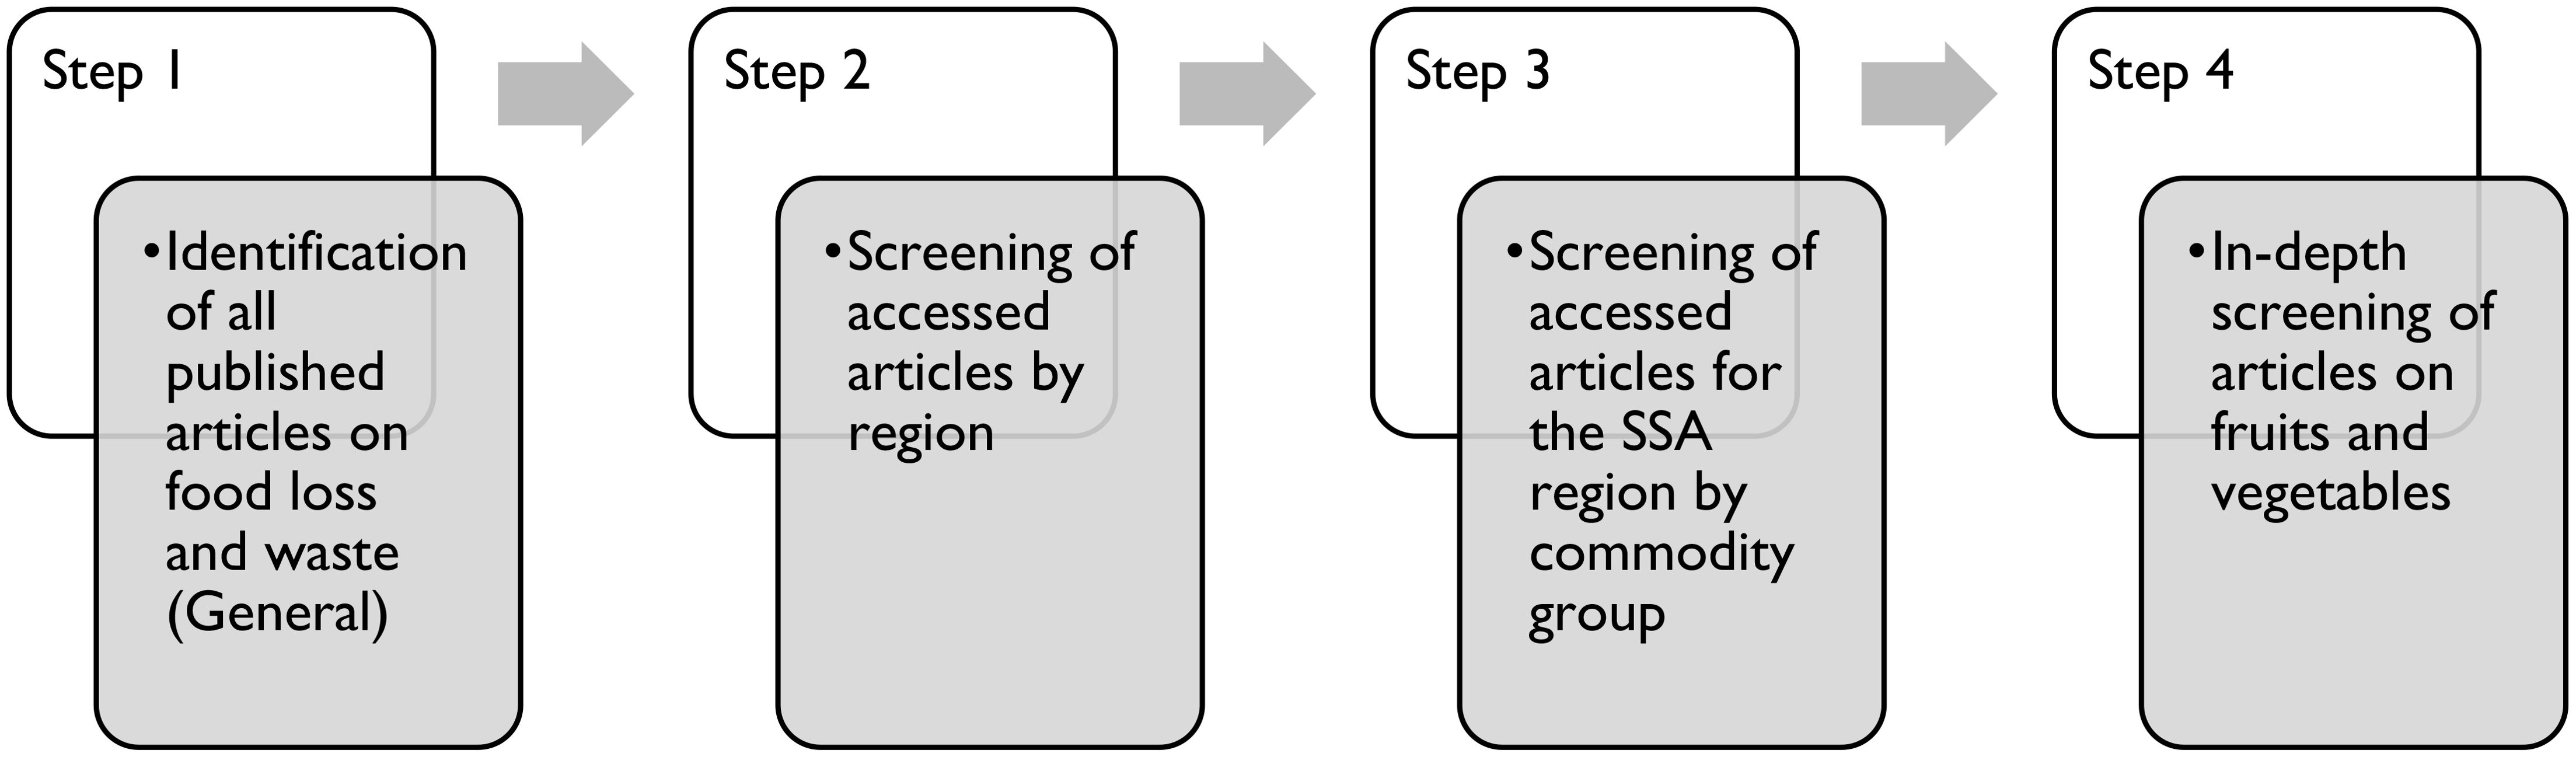
Figure 2. A schematic summary of the data screening process.
3 Results
3.1 Global overview of articles reporting on food loss and waste
A total of 632 openly accessed articles were identified from the various sources and reviewed. Out of the total number of articles, 259 (41%) of the articles were on cereals and pulses including barley, beans, chickpeas, cow peas, maize, millet, oats, peas, pigeon peas, rice, sorghum, and wheat (Figure 3).
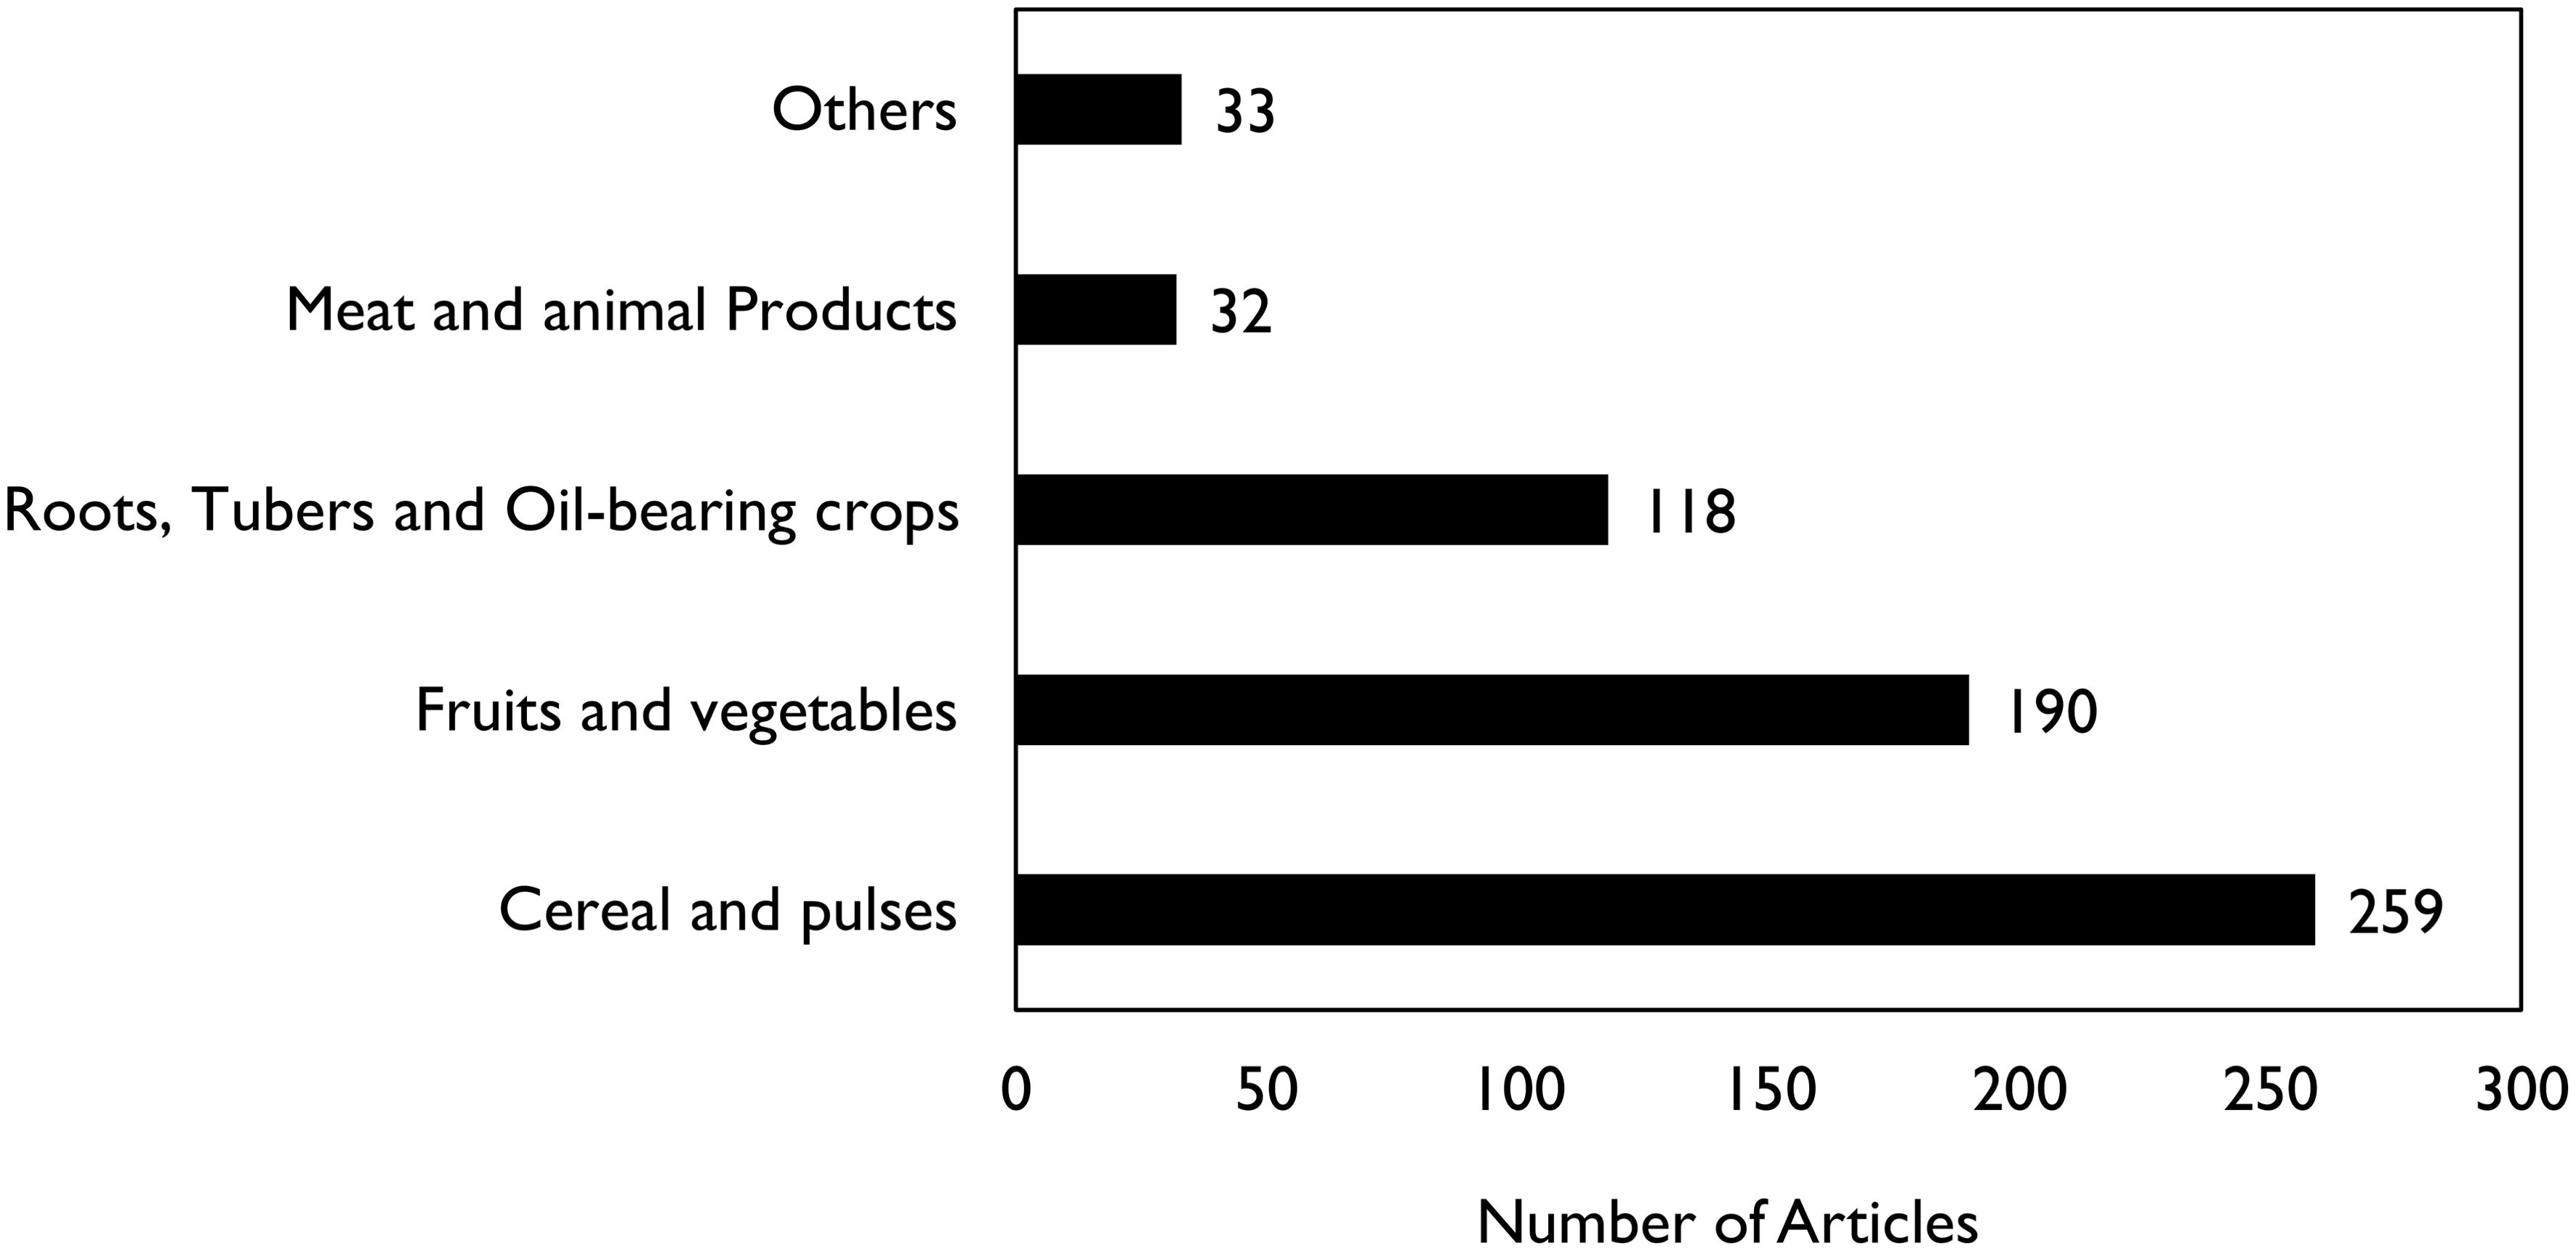
Figure 3. Distribution of openly accessed articles reporting food loss and waste in various commodity groups at the global level.
Articles on fruits and vegetables constituted 30% of the total, while those on roots, tubers & oil-bearing crops made up 19% of the total. Very little is reported on meat and animal products, with just 32 articles identified. Other commodities which appeared in articles reporting mixed commodities constituted 5% of the total. A detailed description of the specific commodities reported for each of the main commodity groups is provided in Table 1.
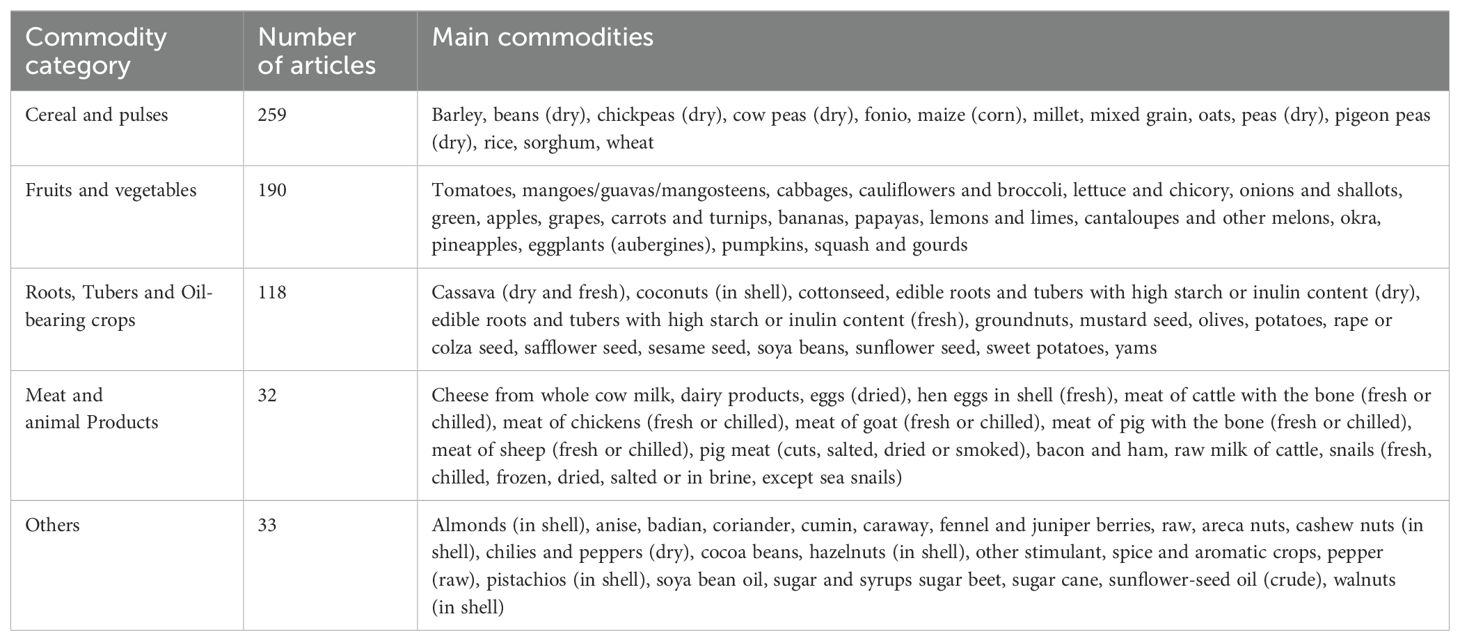
Table 1. A description of the number of articles reporting on FLW in various commodity groups and the specific commodities reported for each group.
Focusing on the articles that reported data on the whole supply chain, the extent of losses (median) in the various commodity groups were established as follows: cereals and pulses (7.1%); fruits and vegetables (16.2%); roots, tubers and oil-bearing crops (10%); meat and animal products (1.5%) and others (4.6%).
3.2 Distribution of published FLW articles in fruits and vegetables
A more in-depth review showed that out of the 190 published articles on fruits and vegetables, most studies covered Asia (78 articles) and Africa (66 articles) with 2 regions alone accounting for 76% of the accessed articles (Table 2). There are less than 10 openly accessible published studies from North America, Oceania and North Africa. Fruits and vegetables that dominate FLW studies in almost all the regions include banana, mango, avocado, papaya, guava and tomatoes.
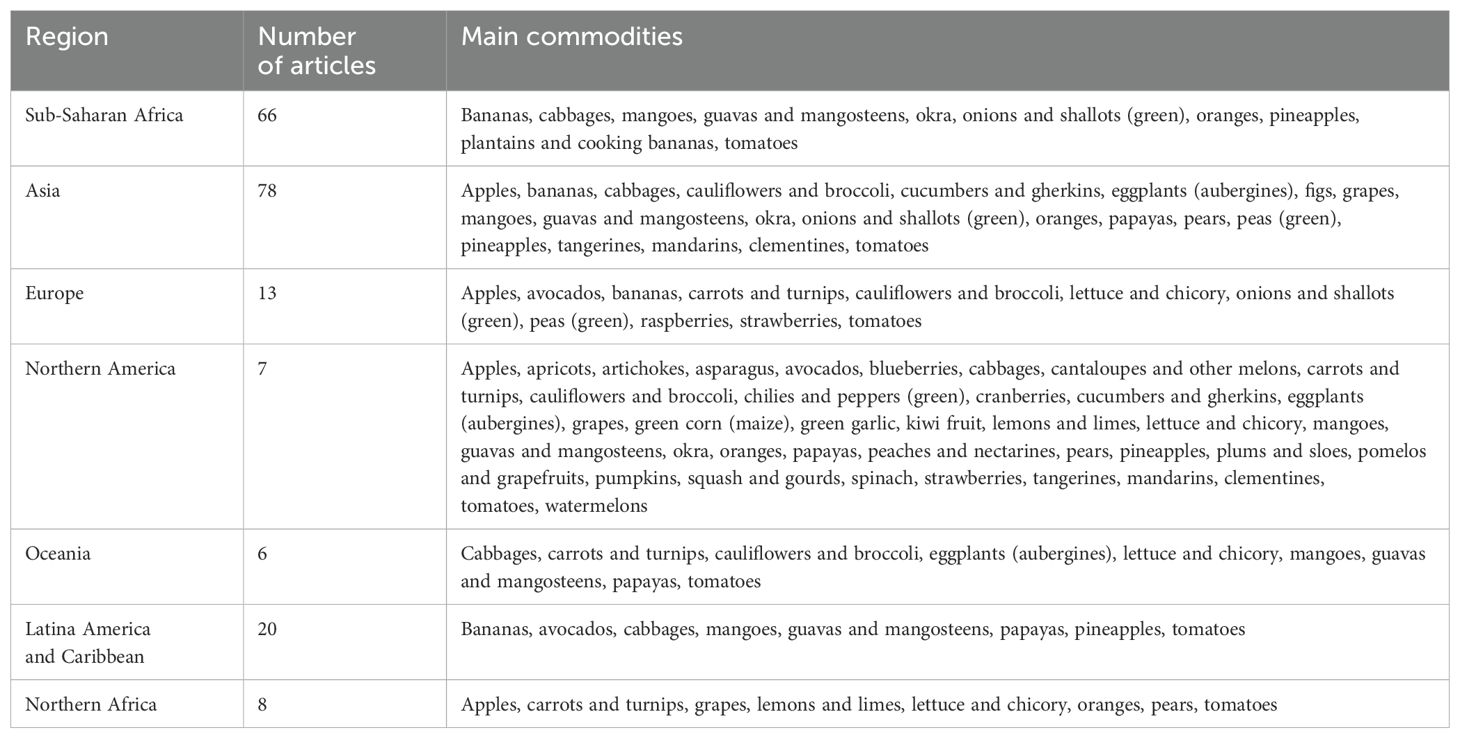
Table 2. A regional distribution of published articles on FLW in fruit and vegetables.
The extent of FLW (median) reported in fruits and vegetables for whole supply chain for the different regions is as follows: SSA (25%); Asia (12%); Europe (22%); North America (8%); Oceania (17%); Latin America and Caribbean (19%) and North Africa (34%).
3.3 Country level distribution of FLW articles in fruits and vegetables in SSA
A total of 66 openly accessible articles on FLW in fruits and vegetables were identified for SSA. The countries with the largest number of articles are Ghana (17 articles) and Kenya (14 articles), accounting for 47% of all the available FLW articles on fruits and vegetables in Africa (Figure 4). Other countries with a notable number of openly accessible articles include Ethiopia (8), Nigeria (8), Benin (7), Libya (7), Tanzania (7), Rwanda (4), Sudan (4) and South Africa (4), Cameroon, Niger, Uganda, C’ote d’Ivoire, Gabon, Guinea, Guinea-Bissau and Mozambique have between 1 and 3 articles each. The rest of the African countries have no openly accessible articles reporting FLW in fruits and vegetables.
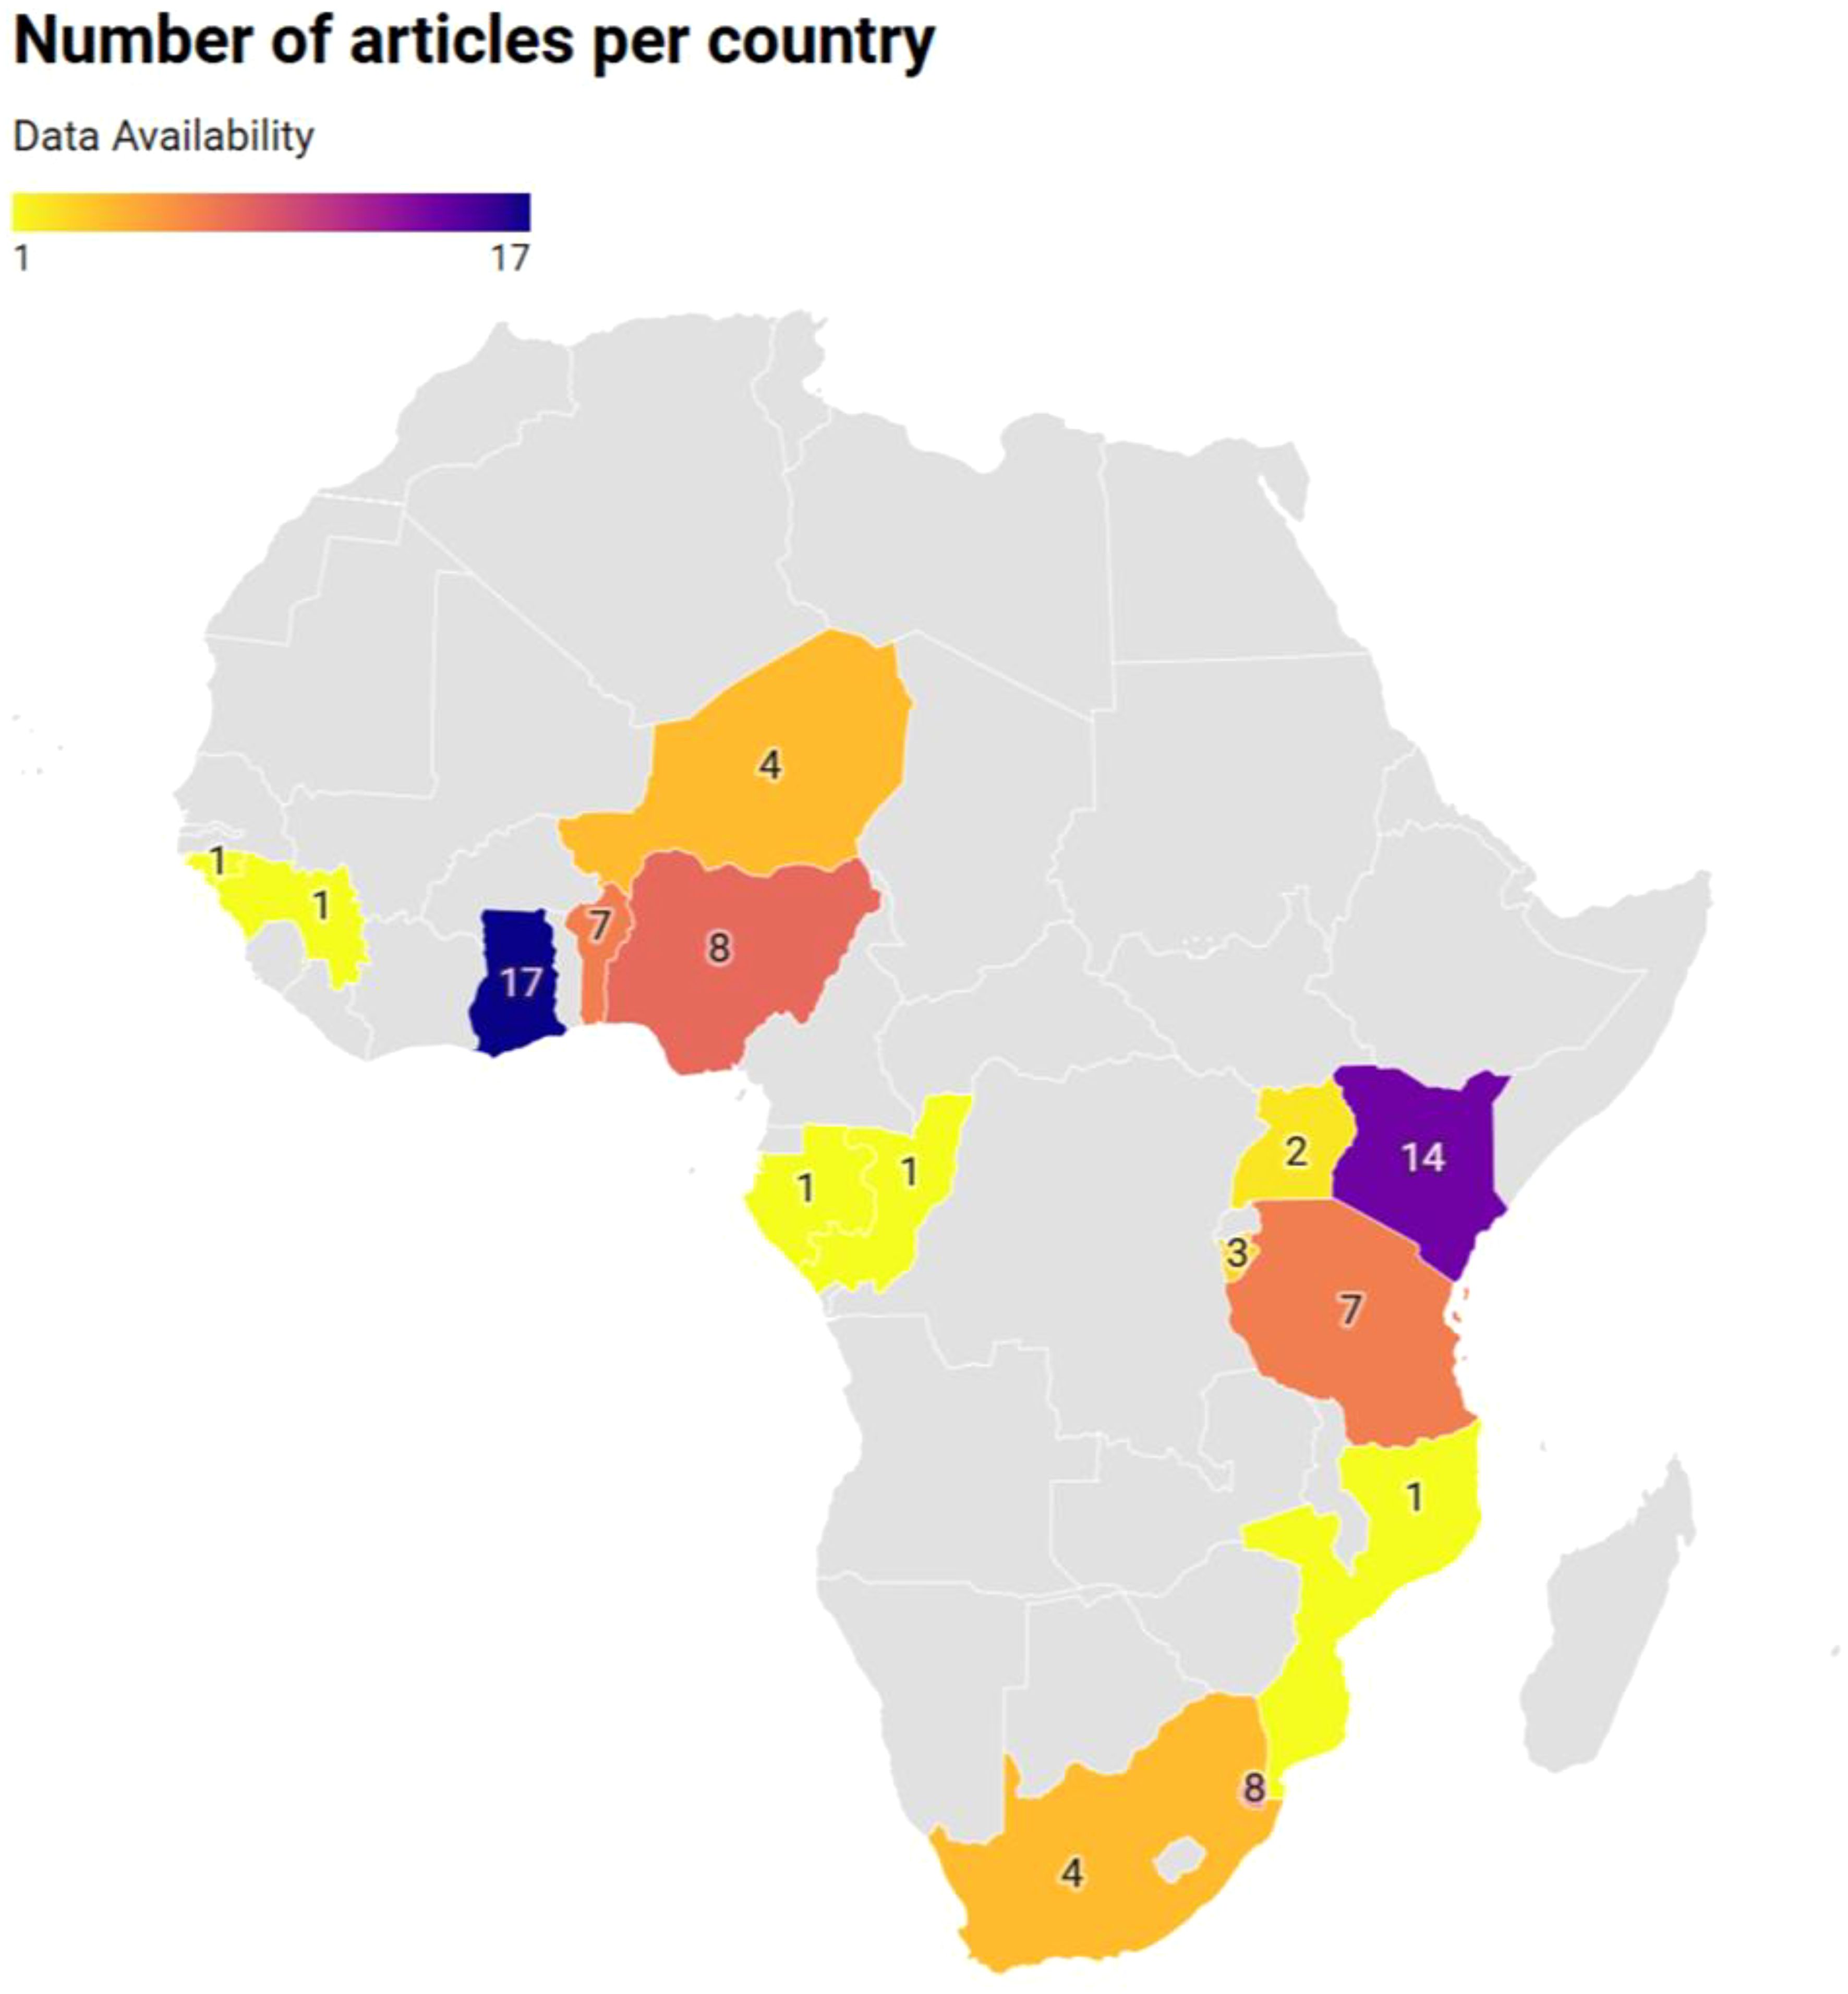
Figure 4. Distribution of articles available on the FLW Database by country Source: Authors’ own elaboration.
Table 3 shows the distribution of articles by country and commodity. The dominant commodities in the reported FLW studies are tomato (27 articles), mango (23 articles) and banana (23 articles). Note that some of the published articles covered more than one commodity and country, hence the discrepancy in the total number of articles versus the number of articles per by commodity and country.
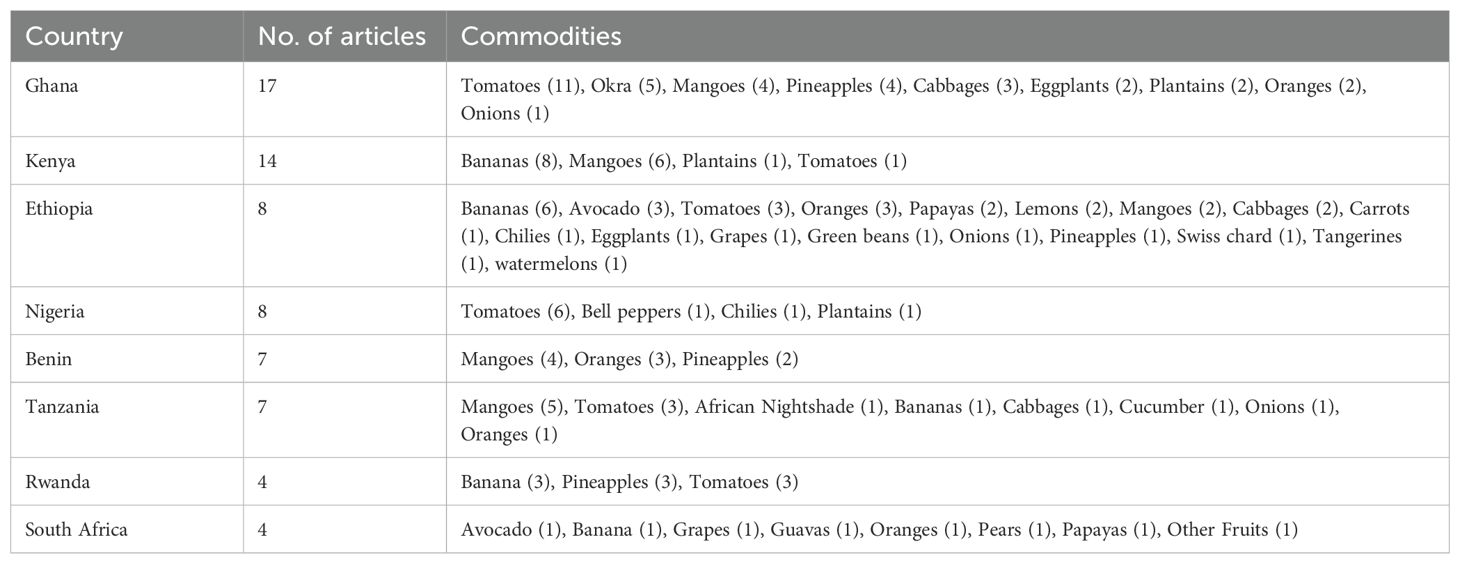
Table 3. Country-level distribution of FLW articles in fruit and vegetables in SSA.
3.4 Distribution of published articles per stage of the supply chains (fruit and vegetables)
Some of the articles reported quantitative losses at various stages of the fruit and vegetable supply chains. Most of the articles reported losses at the farm level stages including harvest (7 articles), on-farm postharvest handling (28 articles) and on-farm storage (8 articles). A total of 18 articles reported losses at the market stage and a similar number reported losses on the whole supply chain. 15 articles reported quantitative losses during transport & distribution while 7 articles reported losses during processing. The consumption stage had only 2 articles reporting quantitative losses (Table 4).
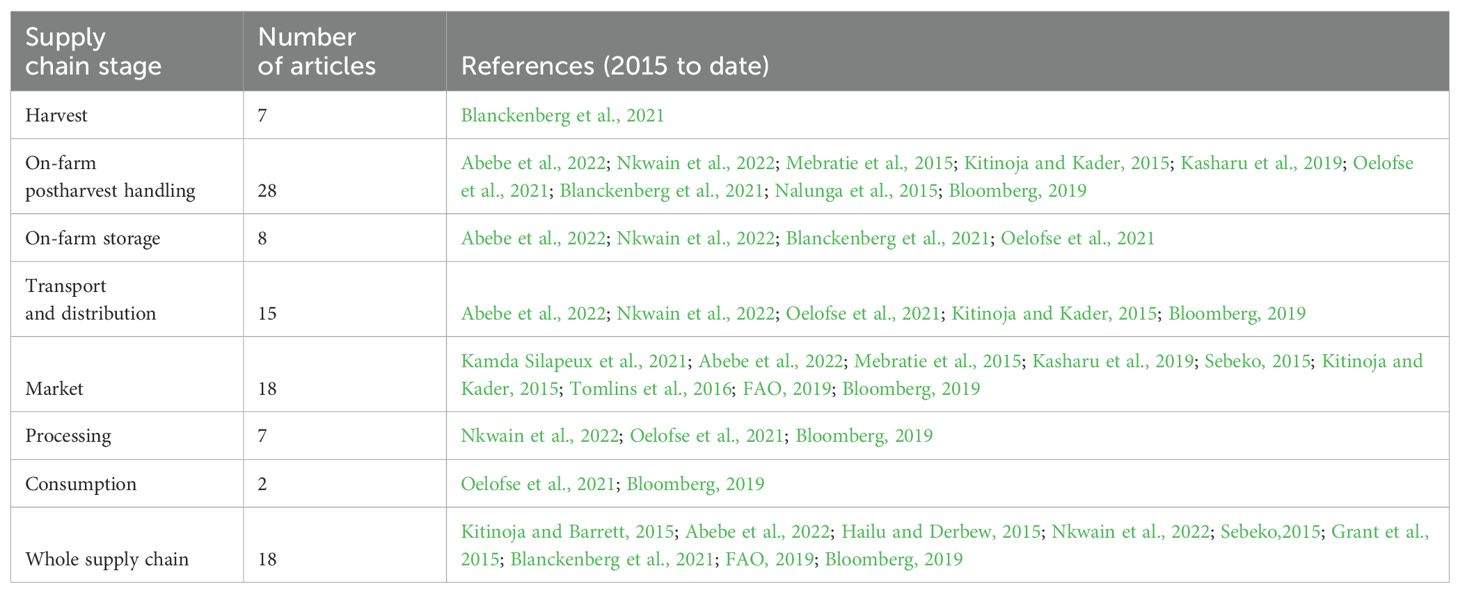
Table 4. Distribution of published articles per stage of the supply chains (fruit and vegetables).
3.5 Extent of losses per stage of the food supply chain (fruits and vegetables)
The extent of losses per stage of the supply chain based on published articles was determined based on the median which was generated using the Excel software at each stage of the supply chain. On-farm postharvest handling and market stages reported more losses (15% each) as median and 54% and 60% as highest losses, respectively. At the consumption stage median losses were reported as13% while the highest losses were 21%. At the harvest stage the median losses were 6% median while the highest losses was 23%. The highest losses for on-farm storage was 38%, 63% for transport & distribution and 32% for the processing stage, all with a median of 5% (Figure 5).
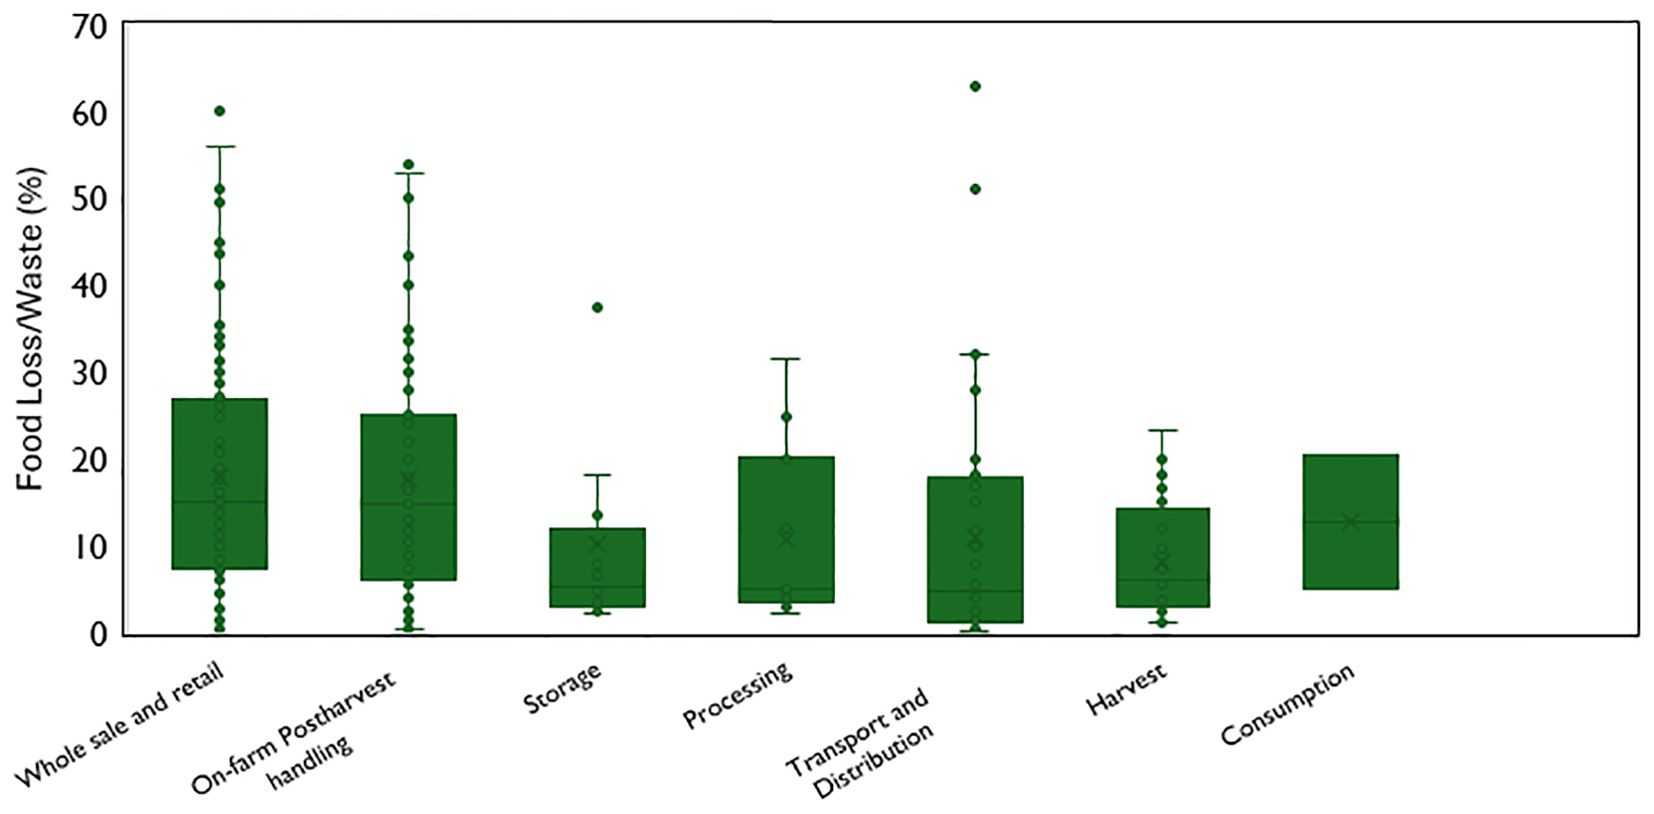
Figure 5. Extent of losses (range and media) per stage of the food supply chain.
4 Discussion
The fact that a significant amount of food is lost or wasted in a world where more than 800 million people are hungry and 3 billion cannot afford a nutritious diet is a sign of failure of our food systems. Food loss and waste (FLW) reduction is one of the sustainable development goals (SDG) with a target that could also contribute to other SDGs such as zero hunger and climate action. Under SDG 12.3 the target is to halve per capita food waste at the retail and consumer levels and reduce food losses long production and supply chain, including postharvest losses by 2030. It is noteworthy that despite the concerted efforts by various agri-food sector stakeholders to contribute to the realization of this target, there is no compelling evidence that progress has been made. The recent by FAO and UNEP show no significant reduction in FLW along the food supply chain. With global food loss (between harvest and retail) estimated to be 13.2 (FAO et al., 2022) and food waste (between retail and consumption) estimated to be 19% according to United Nations Environment Programme (UNEP) (2021), the summed-up figures remains within the 30% range of the most cited FLW report (FAO, 2011).
It is a paradox that despite concerted efforts by various stakeholders in the agri-food sector, there has been minimum progress towards realization of the set targets. This could be attributed to lack of reliable data/evidence on the status of FLW across regions, countries, commodity groups or individual commodities. The available data is often not sufficiently detailed to understand the problem and is not collected regularly or frequently (SDSN TRENDS, 2019). Limitation of primary data has led to dependence on modeled estimates whose reliability depends on the quality, quantity and contextualization. Modeled estimates such as those provided in FAO reports (FAO, 2011, 2019) provide general information from a global perspective. They guide in identification of regions and commodity groups where FLW is prominent. Many countries have adopted these modeled estimates as a guide in their efforts to reduce FLW towards set targets. However, more granular data at the regional, national, subnational, company, commodity is required to guide targeted action towards FLW reduction and to measure progress towards the set targets. Reliable and granular data that is based on contextualized quantification of FLW is necessary to decide if action is required and the critical loss points or hot spots to guide the required action. In addition, such evidence should guide the intervention or solution to FLW. Subsequent evidence should be used to evaluate the impact of the intervention on FLW reduction and progress thereof towards the set targets. The different purposes for FLW quantification require different levels of accuracy and granularity in the estimation (Spang et al., 2019).
In the current review, out of the 632 published and openly accessible articles, 41% (259 articles) were on cereals and pulses including barley, beans, chickpeas, cow peas, maize, millet, oats, peas, pigeon peas, rice, sorghum, and wheat. The quantification of FLW in articles in cereals and pulses was tied to interventions aimed at reducing FLW in the target commodity groups. These findings corroborate a previous review on FLW focusing on interventions for crop postharvest loss reduction in sub-Saharan Africa and South Asia (Stathers et al., 2020). In their review, Stathers et al. reported that out of the 332 articles reviewed, 24.9% were on maize, which is a dominant cereal in Africa and Asia. Even among these studies on maize, the focus for most of them (91%) was on interventions for producers (farm level). Studies on other nodes (actors) in the food supply chain including aggregators, traders, transporters or processors were limited. In the current review, 190 articles reported FLW in the vast commodity group of fruits and vegetables. Meat and animal products are the least reported with only 32 articles despite the steady increase in production and consumption of these commodities. The data from the accessed studies available fails to use a systematic approach that provides a disaggregated value based on the stage of the value chain (Karwowska et al., 2021. In the current review, the few studies reporting losses in meat are in Europe. Some regions have no reports on FLW in meat and animal products.
Among the reviewed articles that reported FLW for the whole supply chain, the extent of losses (median) was highest in fruits and vegetables (16.2%) and lowest in meat and meat products (1.5%). These figures (median) for all the commodity groups are way below the modeled global estimates from the FAO reports. For example, FLW along whole supply chain in fruits and vegetables was reported to be 44% (FAO, 2011). On the other hand, losses between the harvest and retail stages only were reported to be 22% (FAO, 2019). These glaring discrepancies could be attributed to assumptions made when modeling FLW estimates using limited data points.
Further analysis of published articles on fruits and vegetables revealed a regional and commodity skewedness. Out of the 190 published articles, 73% are from Asia (78 articles) and Africa (66 articles). Among the published articles on fruit and vegetables, banana, mango, avocado, papaya, guava and tomatoes dominate in most regions. Articles on temperate fruits and vegetables are more prevalent in the case of Europe, North America and Oceania. These findings confirm the reported distribution of articles on interventions to reduce FLW in crop commodities in Asia and Africa (Stathers et al., 2020). The review shows that mango, onion, tomato and banana have the highest number of articles on FLW reduction interventions. The skewedness to Asia and Africa could be attributed to the many development projects aimed enhancing food security for small-holder farmers and community empowerment through better postharvest management to reduce FLW. Fruit and vegetable production has a comparative advantage over cereals in sub-Saharan Africa and Asia where farmers have limited access to land with more than 80% of the farms being less than 2 hectares (FAO and CIRAD, 2021).
Within the SSA region, Ghana and Kenya accounted for 47% of the published articles on FLW in fruits and vegetables. In Ghana, 17 articles were reviewed including tomato (11), okra (5), mango (4) and pineapple (4). Tomato is the leading vegetable by production volume (370,000 MT) followed by onions and chilies at 144,000 MT and 120,000 MT respectively. Among the fruits, oranges take the lead at approximately 700,000 MT, followed by pineapples at approximately 670,000 MT. Mangoes and guava account for approximately 100,000 MT (Ghana’s Agriculture Sector Report, 2022). While the 11 articles on tomato account for 65% of all the FLW articles, there are only 2 articles on orange which is the leading fruit by volume and 1 article on onions, the second important vegetable by volume in the case of Ghana. In Kenya, banana is the leading fruit for the domestic market with respect to production volume, area and value. Coincidentally, in Kenya, the largest number of published articles are on banana accounting for 57% of all the articles on fruits and vegetables, followed by mango which is the second most important fruit for the domestic market. On the contrary, tomato, the leading vegetable by volume, area and value (29%) has only 1 published article on FLW. This is despite the significantly high losses generally reported and observed in the tomato value chain. Some reports estimate losses in the tomato value chain to be over 50% of the total production in Kenya. However, these estimates exist in unpublished reports that are based on random and poorly designed surveys that are not considered in modeled estimates. The tomato, mango and banana also dominate the openly accessible articles in the other African countries including 8 each in Nigeria and Ethiopia, 7 each in Benin and Tanzania, 4 each in Rwanda and South Africa. Incidentally, South Africa which is known for prolific research and publication has only 4 FLW articles which are openly accessible.
The limited number of openly accessible FLW articles on fruits and vegetables reveals glaring gaps considering the wide diversity of fruit and vegetables produced in Africa. The review also reveals that in many countries, there are no openly accessible published articles on FLW in fruit and vegetables. As a result, it is hard to assess the status of FLW including the extent, drivers, any ongoing interventions and progress towards the global and regional targets for FLW reduction.
The review revealed that most of the FLW studies focused on upstream stages of the supply chain (harvest, on-farm handling and storage). These stages alone account for 41% of the total (104) article accessed. The same trend was reported with respect to interventions aimed at reducing FLW in crop commodities (Stathers et al., 2020). This skewedness towards on-farm studies is attributed to investments and development projects that target smallholder farmers. It has been an assumption of many stakeholders that the farm and especially on-farm storage is a hot spot for FLW. As a result, significant efforts and resources have been channeled to address the causes of FLW at farm level including cold storage and complementary capacity strengthening for smallholder farmers (Ambuko and Owino, 2023). Recent reports on food waste (between retail and consumption), show that food waste in developing countries in SSA is on the rise (https://ourworldindata.org/grapher/foodwaste-per-capita). This is contrary to previous reports where food waste was considered a problem of the developed countries where consumers with high disposable income have the luxury of wasting food. This probably explains the low number of studies on FLW at the consumption stage of the supply chain in the SSA region.
A drill down to specific fruits and vegetables shows that only 47 articles reported the total FLW along the entire supply chain. As with the other screening criteria, mango, tomato and banana take the lead with 7, 7 and 4 articles respectively, accounting for 38% of the total number of articles. In all the commodities, there are remarkable differences among the reviewed articles with respect to the extent of FLW. For example, in mango the losses range between 13 to 49.2% with a median of 44%. In banana where the median whole chain FLW is 28%, the lowest reported whole chain FLW is 8.1% while the highest is 45%. The same disparity is observed in tomato where the median FLW is 31% while the lowest reported is 10.5% and the highest is 76%.
The significant disparities could be attributed to various factors. For example, differences in the methods and tools used to collect the data could lead to remarkable variability in the data reported. Most FLW studies opt for less costly surveys and key informant interviews which do not always yield accurate and consistent information on FLW (Kitinoja and Kader, 2015). Some of the differences in FLW estimates can also be attributed to contextual differences including country, region (within the country), season, variety. For example, mango is adapted to a wide range of agroecological conditions wherein drivers and causes of FLW vary significantly. Similarly, there are many commercial varieties of mango with different morphological and physiological characteristics which determine their perishability and susceptibility to mechanical injuries that contribute to spoilage and subsequent losses. Amwoka et al. (2021) showed that mango variety ‘Kent’ has a longer shelf life compared to ‘Tommy Atkins’, ‘Ngowe’ and ‘Apple’ varieties due to their morphological difference. Such granular differences would not be captured through modeled estimates.
4.1 Conclusion
There is need for reliable localized data as a guide in developing effective strategies for FLW reduction. Because there is limited primary data at all levels, modeled estimates have been adopted to guide interventions and inform policy. While such estimates are cost-effective in comparison to measurement, the reliability and quality depends on the quality, quantity and contextualization of the data used to generate them.
This review has shown that the available data is significantly skewed at all levels (global, regional and national). Similarly, some commodities and stages of the supply chain have more FLW information than others. These gaps call for concerted efforts to ensure more balanced and representative FLW data at all levels and in all commodities important to food and nutrition security. If these gaps are not addressed, efforts to reduce FLW towards the set target at the global level (SDG 12.3) and other targets will remain as a moving target with no verifiable progress.
5 Recommendations for future research to address food loss and waste data
Addressing FLW data gaps should be prioritized at the national level. Many governments, especially in SSA, have not fully acknowledged the importance of sound data in decision making. Investment in data collection remains a mirage as policies are guided by modeled estimates and expert opinions which are not contextualized.
Each country should identify priority commodities based on their importance to food and nutrition security. Prioritization could also be based on economic and environmental benefits of FLW reduction in the target commodities. Thereafter, a target for FLW reduction which could be aligned to the SDG 12.3 target should be set at the country or entity level. Alternatively, a realistic target could be set at the national level or sub-national level and entity level.
Once a target is set, there should be concerted efforts by all actors in the agri-food sector to measure FLW. Researchers from international organizations, research institutes and academia should take the lead in data collection through multi-disciplinary teams ensure complementarity of the skills set and given the complexity of FLW measurement.
Each country (or entity) should adopt a common understanding of what constitutes food loss and food waste because of the difference in metrics used to measure them. To ensure comparability and consistency of the FLW data, harmonized tools and protocols for FLW data collection should be adopted. Measurement of FLW should be preceded by awareness creation and sensitization of all the actors in the agri-food sector about FLW and the need for measurement. FLW measurement could include the extent, critical loss points along the supply chain, causes of FLW and possible context-appropriate interventions to address the causes.
Case studies and experiments can be used for baselines or benchmarks and to identify critical loss points. Well-planned surveys along the food supply chain are better suited for informing policy and strategic interventions.
Addressing FLW data gaps is a collective effort by the diverse actors in the agri-food sector – public and private. Therefore, partnerships are encouraged amongst the diverse actors in the agri-food sector including government agencies, researchers, producer organizations, consumer organizations, private sector, civil society, development partners.
Data collection is a costly undertaking that requires resources. Lack of prioritization of FLW measurement could be attributed to limited resources with competing interests at the national (and sub-national or entity level). Therefore, there is need for support to countries where there are no studies on FLW reported. The support could be through capacity strengthening on FLW data collection or financial support to collect FLW data in priority commodities.
Researchers are encouraged to publish their studies preferably in open access publication channels to enhance visibility of their work and also contribute to addressing the gaps in the data that is used for modeled estimates by organizations such as FAO.
Author contributions
JA: Conceptualization, Data curation, Formal analysis, Investigation, Methodology, Project administration, Software, Supervision, Validation, Visualization, Writing – original draft, Writing – review & editing. SM: Conceptualization, Data curation, Formal analysis, Investigation, Methodology, Software, Supervision, Validation, Visualization, Writing – original draft, Writing – review & editing. EA: Formal analysis, Methodology, Writing – original draft, Writing – review & editing. EM: Conceptualization, Data curation, Formal analysis, Methodology, Writing – original draft, Writing – review & editing. CF: Writing – original draft, Writing – review & editing.
Funding
The author(s) declare that no financial support was received for the research and/or publication of this article.
Conflict of interest
The authors declare that the research was conducted in the absence of any commercial or financial relationships that could be construed as a potential conflict of interest.
Generative AI statement
The author(s) declare that no Generative AI was used in the creation of this manuscript.
Publisher’s note
All claims expressed in this article are solely those of the authors and do not necessarily represent those of their affiliated organizations, or those of the publisher, the editors and the reviewers. Any product that may be evaluated in this article, or claim that may be made by its manufacturer, is not guaranteed or endorsed by the publisher.
Author disclaimer
The views expressed in this publication are those of the author(s) and do not necessarily reflect the views or policies of the Food and Agriculture Organization of the United Nations.
References
Abebe A., Kuma B., Zemedu L. (2022). Assessment of postharvest loss of Avocado at producers level (case of Wolaita and KembataTembaro zones). J. Agric. Crops 8, 364–374. doi: 10.32861/jac.14
African Union (2014). Malabo declaration on accelerated agricultural growth and transformation for shared prosperity. Available online at: http://archives.au.int/handle/123456789/277 (Accessed January 27, 2025).
Ambuko J., Owino W. (2023). “Toward sustainable transformation through postharvest management: Lessons from Kenya’s mango value chain,” in Food Systems Transformation in Kenya. eds. Breisinger C., Keenan M., Mbuthia J., Njuki J.. (Washington, DC, USA: International Food Policy Research Institute), 433–459.
Amwoka E. M., Ambuko J. L., Jesang’ H. M., Owino W. O. (2021). Effectiveness of selected cold chain management practices to extend shelf life of mango fruit. Adv. Agric. 2021, 8859144. doi: 10.1155/2021/8859144
Blanckenberg A., Opara U. L., Fawole O. A. (2021). Postharvest losses in quantity and quality of table grape (cv. Crimson seedless) along the supply chain and associated economic, environmental and resource impacts. Sustainability 13, 4450. doi: 10.3390/su13084450
Bloomberg (2019). The World Loses $400 Billion of Food Before It Reaches Stores. By Agnieszka de Sousa. Available online at: https://www.bloomberg.com/news/articles/2019-10-14/the-world-loses-400-billion-of-food-before-itreaches-stores (Accessed October 23, 2019).
FAO (2011). Global food losses and food waste—Extent, causes and prevention. Available online at: https://www.fao.org/sustainable-food-value-chains/library/details/en/c/266053/ (Accessed 28 October 2024).
FAO (2019). The State of Food and Agriculture 2019: Moving Forward on Food Loss and Waste Reduction (Rome: FAO). Available online at: https://www.fao.org/3/ca6030en/ca6030en.pdf (Accessed 28 October 2024).
FAO (2020). Tracking progress on food and agriculture-related SDG indicators 2020. (Rome, Italy: Food and Agriculture Organization of the United Nations).
FAO, CIRAD (2021). Fruit and vegetables – Opportunities and challenges for small-scale sustainable farming (Rome: Food and Agriculture Organization of the United Nations (FAO) and Agricultural Research Centre for International Development (CIRAD)). doi: 10.4060/cb4173en
FAO, IFAD, UNICEF, WFP, WHO (2022). The State of Food Security and Nutrition in the World 2022: Repurposing Food and Agricultural Policies to Make Healthy Diets More Affordable (Rome: FAO).
FAOSTAT (2020). (Rome: FAO). Available online at: http://www.fao.org/faostat/en/data/QC (Accessed 28 October 2024).
Ghana’s Agriculture Sector Report. (2022). Available online at: https://www.gipc.gov.gh/wp-content/uploads/2023/03/Ghanas-Agriculture-Sector-Report-1.pdf (Accessed April 11, 2025).
Grant W., Kadondi E., Mbaka M., Ochieng S. (2015). Opportunities for financing the mango value chain: A case study of lower eastern Kenya (Nairobi, Kenya: FSD Kenya).
Hailu G., Derbew B. (2015). Extent, causes and reduction strategies of postharvest losses of fresh fruits and vegetables–A review. J. Biology Agric. Healthcare 5, 49–64.
HLPE (2014). Food Losses and Waste in the Context of Sustainable Food Systems (Rome: High Level Panel of Experts on Food Security and Nutrition (HLPE) of the Committee on World Food Security).
Kamda Silapeux A. G., Ponka R., Frazzoli C., Fokou E. (2021). Waste of fresh fruits in Yaoundé, Cameroon: Challenges for retailers and impacts on consumer health. Agriculture 11, 89. doi: 10.3390/agriculture11020089
Karwowska M., Łaba S., Szczepański K. (2021). Food loss and waste in meat sector—why the consumption stage generates the most losses? Sustainability 13, 6227. doi: 10.3390/su13116227
Kasharu A. K., Kizito E. B., Masanza M., Namutebi J. J. (2019). Quantifying physical and economic losses of African indigenous vegetable Solanum aethiopicum along the commercial supply value chain. J. Econ Sustain Dev. 10, 67–77.
Kitinoja L., Barrett D. M. (2015). Extension of small-scale postharvest horticulture technologies—A model training and services center. Agriculture 5, 441–455. doi: 10.3390/agriculture5030441
Kitinoja L., Kader A. A. (2015). Measuring postharvest losses of fresh fruits and vegetables in developing countries. PEF white paper 15, 26.
Mebratie M. A., Haji J., Woldetsadik K., Ayalew A., Ambo E. (2015). Determinants of postharvest banana loss in the marketing chain of central Ethiopia. Food Sci. Qual. Manag 37, 52–63.
Nalunga A., Kikulwe E., Nowakunda K., Ajambo S., Naziri D. (2015). Technical report: structure of the cooking banana value chain in Uganda and opportunities for value addition and postharvest losses reduction. (CRP RTB), 37. Available online at: https://hdl.handle.net/10568/88063.
Nkwain K. T., Odiaka E. C., Ikwuba A. A. (2022). Assessment of pre-harvest losses of banana and the social wellbeing of farmers in Boyo Division, North West Region of Cameroon. Int. J. Res. Innovation Soc. Sci. 6, 372–377.
Oelofse S., Polasi T., Haywood L., Musvoto C. (2021). Increasing reliable, scientific data and information on food losses and waste in South Africa (Pretoria: CSIR).
SDSN TRENDS (2019). Counting on the World to Act: A roadmap for governments to achieve modern data systems for sustainable development. Available online at: https://countingontheworld.sdsntrends.org/static/files/19COTW.pd.
Sebeko T. (2015). Assessment of postharvest loss for perishable produces from wholesalers to consumers: a case study of Et-fruit distribution company in Addis Ababa, Ethiopia. (Uppsala: Swedish University of Agricultural Sciences, Department of Economics). Available online at: http://stud.epsilon.slu.se.
Spang E. S., Moreno L. C., Pace S. A., Achmon Y., Donis-Gonzalez I., Gosliner W. A., et al. (2019). Food loss and waste: measurement, drivers, and solutions. Annu. Rev. Environ. Resour. 44, 117–156. doi: 10.1146/annurev-environ-101718-033228
Stathers T., Holcroft D., Kitinoja L., Mvumi B. M., English A., Omotilewa O., et al. (2020). A scoping review of interventions for crop postharvest loss reduction in sub-Saharan Africa and South Asia. Nat. Sustainability 3, 821–835. doi: 10.1038/s41893-020-00622-1
Tomlins K., Bennett B., Stathers T., Linton J., Onumah G., Coote H., et al. (2016). Reducing postharvest losses in the OIC member countries (COMCEC Coordination Office Necatibey Caddesi No:110/A 06100 Yücetepe Ankara/TURKEY), 1–194.
UNICEF (2024). “The state of food security and nutrition in the world 2024,” in Financing to end hunger, food insecurity and malnutrition in all its forms.
United Nations Environment Programme (UNEP) (2021). Food Waste Index Report 2021 (Nairobi, Kenya: United Nations Environment Programme (UNEP).
Keywords: food loss, food waste, postharvest, losses, fruits, vegetables, data gaps
Citation: Ambuko JL, Masakhwe SM, Amwoka E, Mujuka E and Fabi C (2025) Food loss and waste data gaps in fruit and vegetable value chains: a review of the literature. Front. Hortic. 4:1529040. doi: 10.3389/fhort.2025.1529040
Received: 15 November 2024; Accepted: 25 March 2025;
Published: 22 April 2025.
Edited by:
Erzsébet Sándor, University of Debrecen, HungaryReviewed by:
Porfirio Gutierrez-Martinez, Instituto Tecnológico de Tepic, MexicoAyaz Mukarram Shaikh, University of Debrecen, Hungary
Kata Dr. Ludman-Mihály, University of Debrecen, Hungary
Copyright © 2025 Ambuko, Masakhwe, Amwoka, Mujuka and Fabi. This is an open-access article distributed under the terms of the Creative Commons Attribution License (CC BY). The use, distribution or reproduction in other forums is permitted, provided the original author(s) and the copyright owner(s) are credited and that the original publication in this journal is cited, in accordance with accepted academic practice. No use, distribution or reproduction is permitted which does not comply with these terms.
*Correspondence: Jane Lukhachi Ambuko, amFuZS5hbWJ1a29AdW9uYmkuYWMua2U=