 Sergio Ruiz-Halpern
 Raquel Vaquer-Sunyer
 Carlos M. Duarte
- 1Centre for Coastal Biogeochemistry, School of Environment, Science and Engineering, Southern Cross University, Lismore, NSW, Australia
- 2Department of Global Change, Institut Mediterrani d'Estudis Avançats, Consejo Superior de Investigaciones Científicas, Universitat de les Illes Balears, Esporles, Spain
- 3Interdisciplinary Ecology group, Biology Department, University of the Balearic Islands, Palma, Spain
- 4School of Plant Biology, The UWA Oceans Institute, The University of Western Australia, Crawley, WA, Australia
Coastal areas play an important role on carbon cycling. Elucidating the dynamics on the production, transport, and fate of organic carbon (OC) is relevant to gain a better understanding on the role coastal areas play in the global carbon budget. Here, we assess the metabolic status and associated OC fluxes of a semi-enclosed Mediterranean bay supporting a meadow of Caulerpa prolifera. We test whether the EDOC pool is a significant component of the OC pool and associated fluxes in this ecosystem. The Bay of Portocolom was in net metabolic balance on a yearly basis, but heterotrophic during the summer months. Community respiration (CR) was positively correlated to C. prolifera biomass, while net community production (NCP) had a negative correlation. The benthic compartment represented, on average, 72.6 ± 5.2% of CR and 86.8 ± 4.5% of gross primary production (GPP). Dissolved organic carbon (DOC) production peaked in summer and was always positive, with the incubations performed in the dark almost doubling the flux of those performed in the light. Exchangeable dissolved organic carbon (EDOC), however, oscillated between production and uptake, being completely recycled within the system and representing around 14% of the DOC flux. The pools of bottom and surface DOC were high for an oligotrophic environment, and were positively correlated to the pool of EDOC. Thus, despite being in metabolic balance, this ecosystem acted as a conduit for OC, as it is able to export OC to adjacent areas derived from allochtonous inputs during heterotrophic conditions. These inputs likely come from groundwater discharge, human activity in the watershed, delivered to the sediments through the high capacity of C. prolifera to remove particles from the water column, and from the air-water exchange of EDOC, demonstrating that these communities are a major contributor to the cycling of OC in coastal embayments.
Introduction
Coastal areas are hotspots for carbon cycling (Wollast, 1998). Shallow waters enable the colonization of the seafloor by primary producers on a narrow band where enough light reaches the bottom (Gattuso et al., 2006). The autotrophic nature of vegetated coastal ecosystems implies that they export substantial amounts of carbon for consumption by heterotrophic communities elsewhere (Duarte and Cebrián, 1996; Barron et al., 2014) and are sites of intense carbon burial, contributing about half of the total burial of organic carbon (OC) in marine sediments (Duarte et al., 2005, 2013). Delivery of macrophyte carbon occurs mainly through three pathways (cf. Duarte and Cebrián, 1996), direct herbivory by consumers, and subsequent incorporation to the food web (Hauxwell et al., 1998), shedding and fragmentation of detrital tissue (Kristensen et al., 1992), and direct release of dissolved organic carbon (DOC, Penhale and Smith, 1977; Barrón and Duarte, 2009; Barron et al., 2014), which can account for 1–10% of photosynthetic carbon fixation (Wetzel and Penhale, 1979; Velimirov, 1986; Ziegler and Benner, 1999).
DOC is the fundamental pool of reactive carbon, fueling the microbial loop in the oceans (Hansell and Carlson, 2002). Exchangeable dissolved organic carbon (EDOC), comprised of a wide variety of largely unresolved volatile and semi-volatile organic compounds (VOC and SOC) is, however, a largely ignored component of the DOC pool, which is operationally restricted to non-purgeable DOC in most applications (Spyres et al., 2000). Nonetheless, available reports (Dachs et al., 2005; Ruiz-Halpern et al., 2010, 2014) have confirmed that EDOC is a significant component of the marine OC pool, representing 30–67% of DOC. Furthermore, this carbon pool can be effectively exchanged with the air, affecting atmospheric chemistry (Arneth et al., 2010) and be transported and deposited elsewhere, resulting in the redistribution of carbon at regional and global scales (Dachs et al., 2005; Jurado et al., 2008). Macroalgae produce a variety of volatile and semi-volatile compounds (Bravo-Linares et al., 2010), only a few of which are generally measured. The single assessment available to date, reports Arctic macroalgae to be a source of EDOC to the ecosystem, releasing 0.44 μmol C g dry wt−1 d−1 (Ruiz-Halpern et al., 2010). This study also demonstrates the sediments of the Greenlandic fjord studied to be an important source of EDOC, releasing an equivalent of 12% of the sedimentary POC flux. Whether these results are unique to the fjord studied or EDOC is, in fact, an important component of the carbon pool and fluxes of coastal ecosystems remains unresolved.
In this study, we assessed the metabolic status and associated OC fluxes of a semi-enclosed Mediterranean bay supporting a meadow of Caulerpa prolifera. In particular, we test whether the standing stock of EDOC is a significant component of the OC pool and associated fluxes in this ecosystem.
Materials and Methods
The study took place in Portocolom, a semi-enclosed Mediterranean bay, in the Southeast of the island of Mallorca (39°25′04″N, 3°15′40″E, Figure 1). The bay has been subject to human influence and receives important loads of nutrients and organic matter through groundwater discharge (Basterretxea et al., 2010), as well as from deficient sewage systems. Fish farming activities, conducted in the interior of the Bay during 22 years until 2005, and the high nutrient and organic inputs from the surrounding town and boating activity have further increased the organic and nutrient pools in the sediments (Vaquer-Sunyer et al., 2012). The study site corresponded to muddy sediments covered by a thick canopy of the green algae Caulerpa prolifera. Located on the Western area of the bay, sheltered from storms by land. Caulerpa prolifera (Forsskal) (Lamouroux, 1809), is an opportunistic native species widely distributed throughout the Mediterranean Sea, except for the colder waters of the Gulf of Lion and the Adriatic Sea (Sanchez-Moyano et al., 2001). Sheltered and muddy sediments shallower than 20 m, an abundant habitat in the Bay (Holmer et al., 2004), are the preferred sites for growth of this macroalgae (Sanchez-Moyano et al., 2001; Mateu-Vicens et al., 2010).
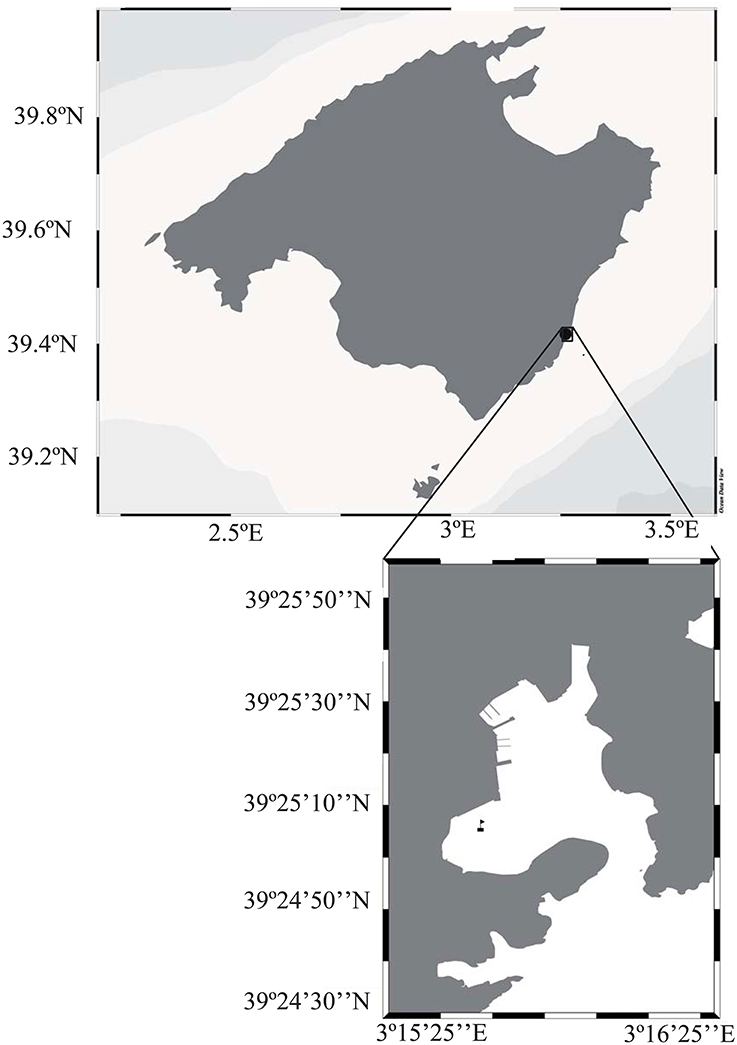
Figure 1. Map of the island of Majorca in the Mediterranean Sea, with the inset showing the Bay of Portocolom with the sampling site marked by a flag.
The bay was sampled monthly from February 2009 to January 2010. Polymethylmethacrilate (plexiglass) sediment cores (0.005 m2 i.d) were collected and incubated at in situ light and temperature conditions to assess benthic metabolic rates. Surface water samples were collected in the Bay using 20 L carboys, and benthic cores were extracted from 2.8 m depth by SCUBA diving, containing a random sample of the benthic community, dominated by Caulerpa prolifera, but also containing infaunal macroinvertebrates, as well as bacteria and phytoplankton associated with the sediments and living in the overlying water.
Metabolic rates of both the planktonic and benthic communities were derived through O2 evolution in triplicate light and dark cores incubated at in situ temperature and incident solar radiation. For planktonic metabolism, water samples were carefully siphoned into a variable number of 75-ml narrow-mouthed Winkler bottles. Between 22 and 26 bottles were filled for each experiment, resulting in 7–12 replicates per treatment, with most treatments having 7–8 replicates. The samples were incubated in “light” and “dark” conditions at in situ temperature for 24 h. “Light” incubations were covered with mesh to reduce light penetration and mimic the conditions found in the field. “Dark” incubations were completely covered, achieving 100% opaque conditions. The incubation time of the “dark” cores varied from 24 h to a minimum of 4 to avoid the development of anoxic conditions. For benthic metabolic rates, triplicate “light” and dark cores were incubated in the same conditions as for planktonic rates. Before the incubation, rubber stoppers used to extract the benthic cores were replaced by polymethylmethacrilate stoppers with an O-ring to avoid gas diffusion between water in the core and surrounding incubation water, and magnetic stirrers inserted to ensure mixing along the height of the core. These stoppers had three sampling ports to sample water at the termination of the incubations. To determine initial oxygen content in the benthic cores, after changing the stoppers, Winkler bottles were carefully filled by siphoning the overlying water from the benthic cores using a silicon tube fitted in one of the three sampling ports. The same procedure was used to determine final oxygen content in the benthic cores after incubation. Initial samples were fixed immediately. All other bottles and benthic cores were incubated in 50 L tanks with a re-circulating, temperature controlled water bath with a light dimming mesh to mimic the conditions found in the field.
Dissolved oxygen was fixed immediately after the end of the incubation period and analyzed by high-precision Winkler titration, using a precise automated titration system with potentiometric (redox electrode) end-point detection (Mettler Toledo, DL28 titrator), after Carpenter (1966) and Oudot et al. (1988). The precision of our estimates for free water and benthic cores combined was 1.99 ± 0.27% with a range of 0.05–16.94% and median of 0.79%. Metabolic rates were calculated from the change in oxygen concentration after incubations, relative to the initial concentration and expressed as mmol O2 m−2 d−1. The rate of change in oxygen concentration in light and dark incubations provided estimates of net community production (NCP) and community respiration (CR), respectively, and gross primary production (GPP) was calculated as the difference between the NCP and CR. The ratio between GPP and CR provides an additional indication of the metabolic state of the community, as GPP/R < 1 indicates net heterotrophic communities while GPP/R > 1 correspond to autotrophic communities. Ratios close to 1 indicate communities close to metabolic equilibrium.
A separate set of triplicate light and dark cores, identical to the ones used for metabolic rates and incubated in the same conditions, also allowed estimation of the net production of DOC (Barrón and Duarte, 2009) and EDOC by the community. The initial concentrations of DOC and EDOC were derived from samples taken from duplicate cores, collected in parallel to the onset of the incubation to minimize differences with the initial conditions for these incubations. At the time of core collection, samples for measurements of DOC concentration in surface and bottom waters were collected, and water temperature measured (Figure 1, Supplementary Material). DOC was collected in duplicate 10 mL pre-combusted (4.5 h, 500°C) glass ampoules sealed under flame and stored prior to analysis in the laboratory on a Shimadzu TOC-Vcsh with standard non-purgeable organic carbon (NPOC) techniques (Spyres et al., 2000). Standards provided by D. A. Hansell and W. Chen (University of Miami) of 2 and 44 μmol C L−1 were used to assess the accuracy of our DOC measurements, this resulted in an accuracy better than ±5%. The overlying water from the sediment cores was carefully siphoned from the cylinder with a silicon tube and transferred to an acid clean bottle to measure the EDOC concentration following the procedure by Dachs et al. (2005). Water samples were bubbled with high-grade (5.0) pure nitrogen. The evolved gas containing EDOC, was redissolved in 50 mL of ultrapure miliQ water, acidified to a pH < 2 with concentrated (85%) H3PO4 and then transferred to triplicate pre-combusted (as for DOC) glass ampoules, stored in the laboratory and analyzed as for DOC, without the sparging procedure. Field blanks were obtained by bubbling nitrogen onto the acidified water trap, without any sample water, but were only used to determine ambient EDOC in bottom waters. Production estimates did not require the assessment of blanks since they were calculated as the difference between initial and final conditions, eliminating their need since any error from contamination was removed by the calculation procedure. Monthly rates of OC production are reported as the mean ± standard error (S.E, n = 3) of the cores. The annual metabolic balance and fluxes of EDOC and DOC was calculated as the mean ± S.E of all monthly estimates (n = 12 for metabolic rates, and EDOC light and dark incubations, n = 10 for DOC light incubations and n = 11 for DOC dark incubations), expressed as the annual flux per year in mol m−2 a−1. The Combined OC pool was calculated as the addition of both EDOC and DOC production estimates. The standard error for this estimate is calculated as (1):
Where S.E is the standard error, S.DEDOC is the standard deviation for EDOC, S.DDOC is the standard deviation for DOC, and nEDOC and nDOC, the number of observations for EDOC (3) and DOC (3), respectively. The annual flux of combined OC was calculated as for EDOC and DOC (n = 10). After the incubations were performed, the biomass of Caulerpa prolifera from each core was estimated by gently separating the living tissue from the sediment and drying to constant weight at 60°C in a drying oven. The biomass of Caulerpa prolifera was then transformed to carbon by assuming carbon to represent 25% dry weight (Duarte, 1992). No significant differences were found between the biomass of dark and light cores (t-test, p > 0.05) where metabolic rates were assessed and the average of all cores were used to derive Caulerpa prolifera biomass in Table 2 and Figure 5. A 1 to 1 stoichiometric quotient was used to transform oxygen-based to carbon-based metabolic rates. The mass balance to calculate the allochthonous inputs of OC to the system was calculated, assuming steady state following the equation (2):
Where OC export is the flux of EDOC + DOC measured in the incubations, the change in C. prolifera biomass was assumed to be included in the GPP, if there is a net increase in biomass or in CR if there is a decrease in biomass, this assumption may result in a slight underestimation of OC inputs since not all the biomass of C. prolifera has to be respired within the system (i.e., herbivory by fish). Annual fluxes and S.E were calculated as for EDOC and DOC production estimates.
Results
The temperature in the Bay of Portocolom ranged from a minimum of 14°C in December to a maximum of 28°C in August and September. A positive relationship was found between temperature and surface and bottom DOC, but this relationship was not observed for EDOC (Figure 2). Ambient concentrations of EDOC in bottom waters showed a tendency toward higher values with higher values of DOC, but the relationship was not significant (R2 = 0.22, p > 0.05) driven by a point of low EDOC with high concentration of DOC (Figure 3). EDOC represented, on average, 22.4 ± 0.79% of DOC (calculated from Table 1). The net production of DOC and EDOC differed between light and dark conditions, with a higher production of both DOC and EDOC in cores incubated in the dark (Table 2, Figure 4). EDOC production represented, on average, 14% of DOC production (from Table 2). EDOC fluxes in the light showed both production and consumption (Figure 4), with a balanced annual flux (0 ± 0.4 mol C m−2 a−1, Table 2). In dark conditions, however, there was a slightly positive, but variable, net flux of EDOC of 1.2 ± 0.6 mol C m−2 a−1 (Table 2). Net DOC fluxes in the dark were almost twice as high as those in the light, except in March, where EDOC exceeded the DOC flux (Table 2), with an increase in net fluxes from winter to summer (Figure 4), yielding a positive net annual flux of 9.1 ± 2.0 mol C m−2 a−1 and 14.1 ± 3.7 mol C m−2 a−1, for light and dark conditions, respectively (Table 2, Figure 4). Biomass of Caulerpa prolifera increased over the spring and early summer but toward the fall and winter biomass did not return to values from the previous cold season, remaining relatively high (Table 3, Figure 5).
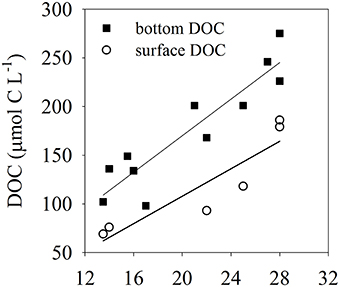
Figure 2. Relationships between temperature and DOC: closed squares represent DOC in bottom waters where the collection of cores took place (R2 = 0.84), open circles represent DOC collected just below the surface of the water (R2 = 0.82). Both relationships are significant (p < 0.05).
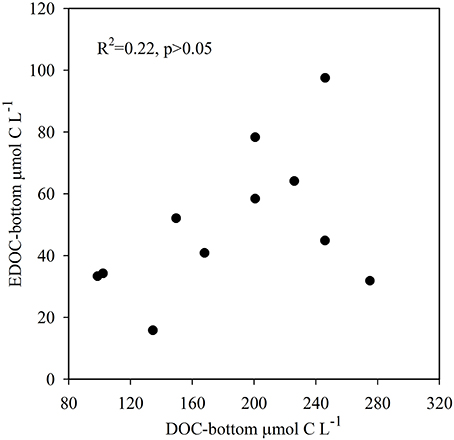
Figure 3. Relationship between ambient DOC and EDOC collected in bottom waters where core collection took place. Although there is a tendency toward higher values of EDOC with high DOC concentrations, the relationship is not significant (R2 = 0.22, p > 0.05).
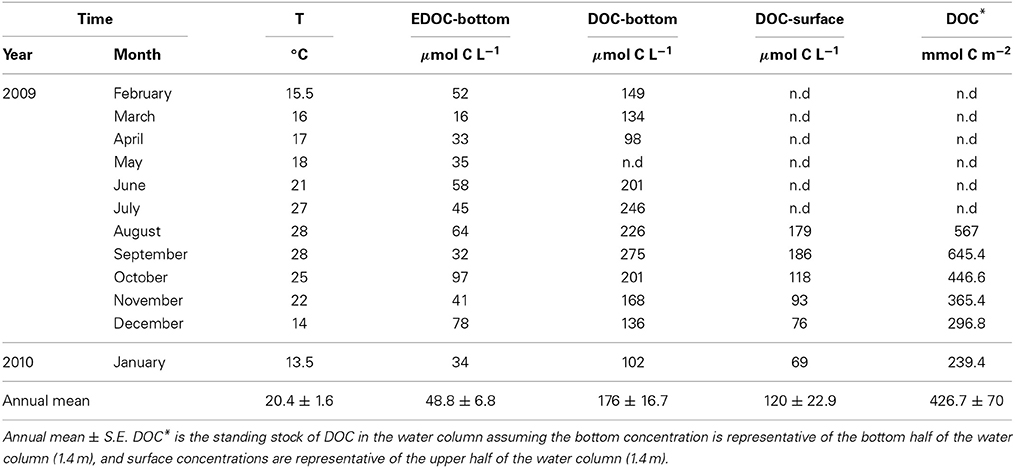
Table 1. Sea surface temperature, EDOC in bottom waters, and DOC in bottom and surface waters in the bay of Portocolom.
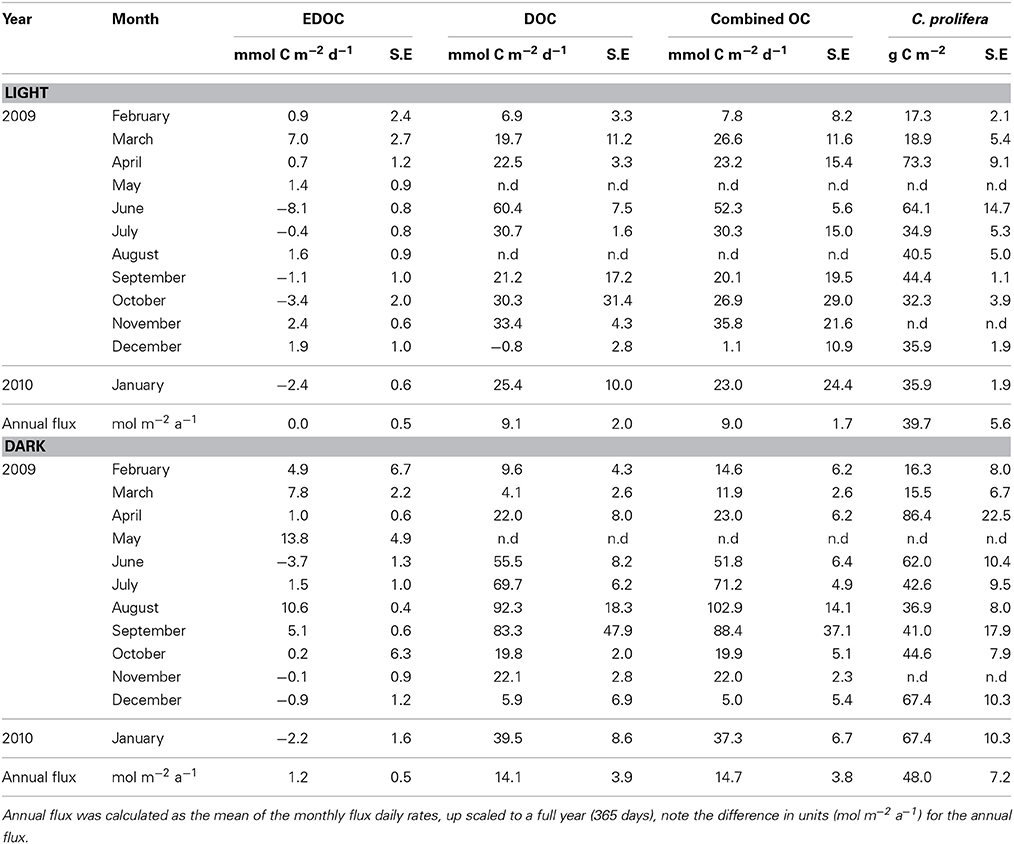
Table 2. Net EDOC and DOC fluxes in light and dark incubations and biomass of Caulerpa prolifera standing stocks in the core incubations from samples collected in the bay of Portocolom.
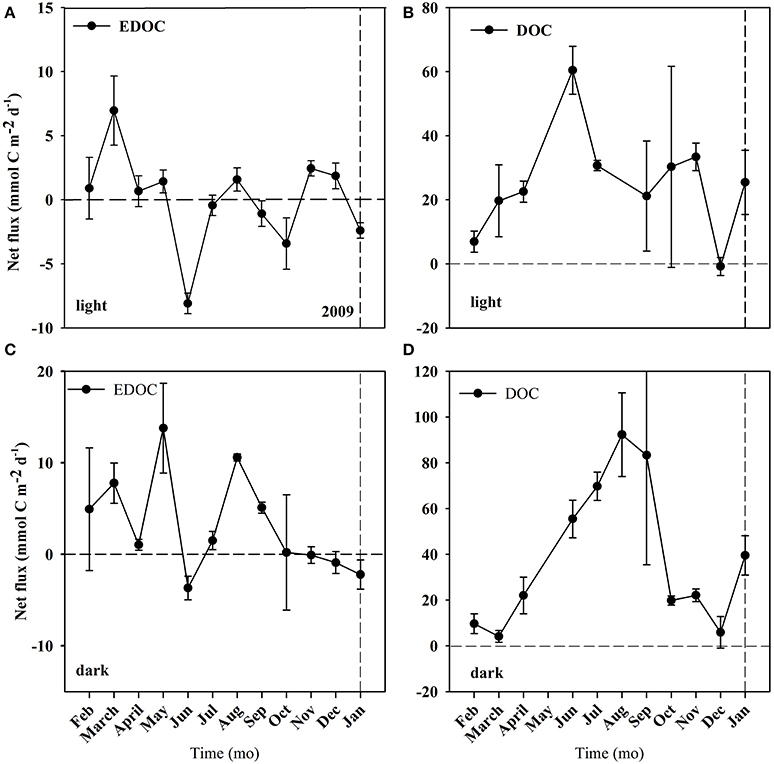
Figure 4. Net fluxes of EDOC and DOC from the C. prolifera community over time. Mean ± S.E. Panel (A) corresponds to EDOC incubations in the light. Panel (B) corresponds to DOC incubations in the light. Panel (C) corresponds to EDOC incubations in the dark. Panel (D) corresponds to DOC incubations in the dark. The horizontal dashed line represents the point where the flux = 0, marking the change from uptake to release of EDOC and DOC. The vertical line represents the change of year from 2009 to 2010.
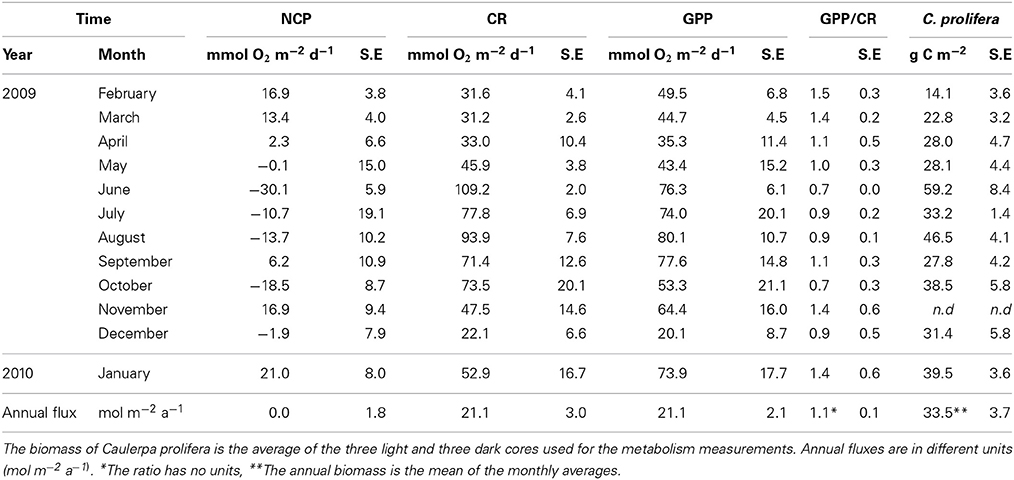
Table 3. Community metabolism (NCP, CR and GPP), GPP/CR ratio and the biomass of C. prolifera over time in the bay of Portocolm.
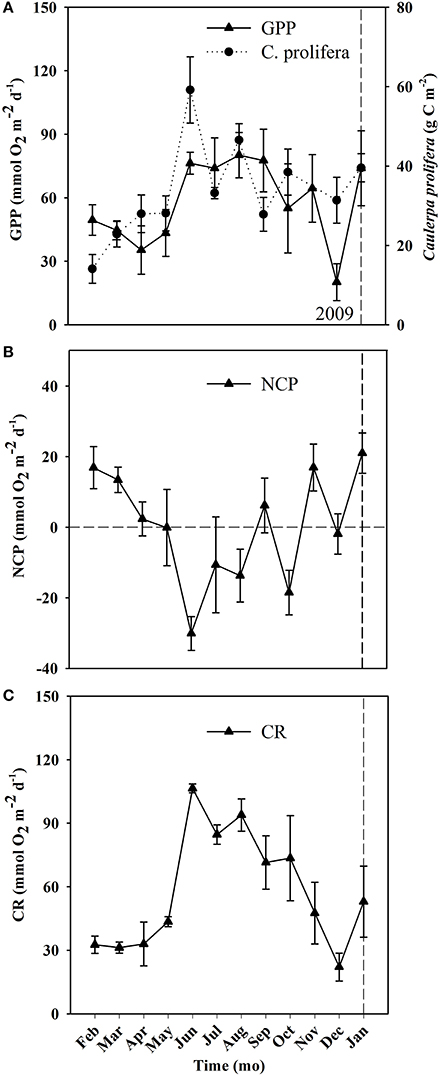
Figure 5. Temporal changes in community metabolism (GPP, CR, and NCP) and C. prolifera biomass derived from the cores used to calculate metabolic rates in the Bay of Portocolom over the course of the study. Mean ± S.E. Panel (A) represents GPP (gross primary production, closed triangles, full line) and Caulerpa prolifera biomass (closed circle, dashed line). Panel (B) represents NCP (net community production) and Panel (C) represents CR (community respiration). The horizontal dashed line marks NCP = 0 (i.e., metabolic balance). The vertical dashed line represents the change of year from 2009 to 2010.
Ecosystem (benthic + planktonic) metabolism was quite variable throughout the year, with the benthic compartment representing, on average, 72.6 ± 5.2% of CR and 86.8 ± 4.5% of GPP (Table 4, Supplementary Material), contributing more to carbon fixation than the planktonic compartment. In addition, both CR and GPP increased in summer (Table 3, Figure 5). Respiration increased more than GPP, resulting in net heterotrophic communities (NCP < 0) in the summer months. CR increased with increasing C. prolifera biomass (R2 = 0.61, p < 0.05, Figure 6), resulting in an inverse relationship between NCP and C. Prolifera biomass (R2 = 0.55, P < 0.05, Figure 6). However, GPP was not significantly correlated with C. prolifera biomass (R2 = 0.28, P > 0.05, Figure 6). The community, however, remained in metabolic balance on an annual cycle, with NCP = 0 ± 1.8 mol O2 m−2 a−1 and a GPP/CR ratio of 1.1 ± 0.1 (Table 3). There was no relationship between temperature and ecosystem metabolism and OC production.
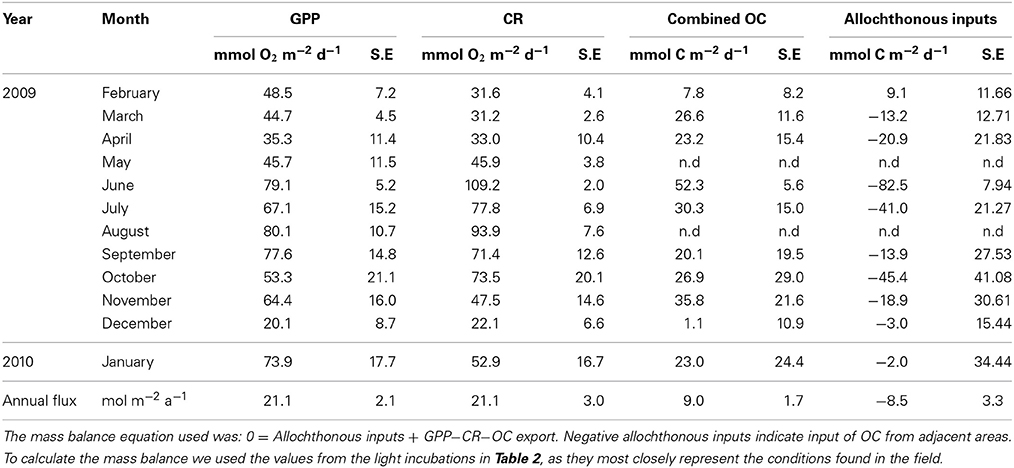
Table 4. Mass balance to calculate the monthly inputs of allochthonous OC necessary to preserve the mass balance.
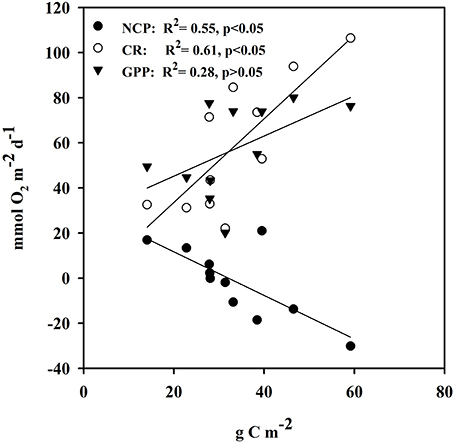
Figure 6. Linear relationship of metabolic rates vs. Caulerpa prolifera biomass from the cores used in the estimation of metabolic rates. Closed circles represent NCP vs. C. prolifera, open circles represent CR vs. C. prolifera and closed triangles represent GPP vs. C. prolifera.
The mass balance calculated using Equation (2) including the sources and sinks of OC measured, showed that the allocthonous carbon necessary to fuel respiration was, on average, in balance with the OC produced in the incubations, in agreement with the overall metabolic balance calculated year round (Table 4).
Discussion
The results presented demonstrate that the benthic community examined here contributes substantially to the OC pool in the water column, both in a dissolved and exchangeable dissolved form. EDOC represents about a quarter of OC, which is in agreement with two of the three available assessments (Dachs et al., 2005; Ruiz-Halpern et al., 2010, 2014) that report EDOC concentrations, and provides further evidence of EDOC as an important fraction of the OC pool in the ocean. DOC + EDOC production was highest during the summer months, the period with greater C. prolifera biomass, suggesting this macroalgae to be a major contributor to OC release. The net flux of DOC was always positive and exceeded GPP in the month of April. In contrast, EDOC fluxes oscillated from positive to negative across all months, suggesting that EDOC can be completely recycled within the system. The yearly cycle of net DOC and EDOC fluxes in light conditions reveal a stronger dependence of net DOC fluxes on C. prolifera biomass than EDOC. OC fluxes, however, were enhanced in dark conditions, where photosynthesis is precluded and cannot be explained by enhanced production. Mechanisms other than photosynthesis in the release or breakdown of DOC + EDOC, such as photodegradation of organic matter, decay of plant tissue or incomplete respiration of organic matter, need to be investigated further in order to explain the differences encountered.
The net release of OC from the community studied represents a source of export to adjacent ecosystems through advective and turbulent transport and, in the case of EDOC, through the volatilization of these compounds to the atmosphere. In addition, DOC accumulated in the ecosystem from spring to summer, with an increase in DOC in bottom waters of 1.4 ± 0.74 μmol C L−1 d−1 (from Table 1), is respired in the fall and winter. The net flux of DOC + EDOC was 9.0 ± 1.6 mol C m−2 a−1 (or 24.6 mmol C m−2 d−1). This value is comparable to the overall mean DOC flux of 23.2 mmol C m−2 d−1 reported by Barron et al. (2014) for macroalgal communities. This value roughly doubles the net amount of DOC produced by P. oceanica (Barrón and Duarte, 2009) and seagrasses overall (Barron et al., 2014), and represents one third of the GPP measured at the site, rendering the C. prolifera community a greater source of OC per unit surface area to Mediterranean ecosystems than P. oceanica.
The availability of OC for export, however, cannot be supported by community metabolism alone, since the community was in metabolic balance on an annual scale, with no excess OC produced. Hence, this ecosystem acts as a conduit for OC, whereby allochthonous OC inputs are received and, in the same amount, transferred to adjacent ecosystems. Provided the community was a net source of DOC, these inputs could be derived from sedimenting particles, as demonstrated for a Posidonia oceanica meadow by Gacia et al. (2002). Indeed, Hendriks et al. (2010) experimentally demonstrated that C. prolifera were extremely effective in filtering out particles suspended in the water column, also explaining the high sulfate reduction rates associated with sediments colonized by C. prolifera (Holmer et al., 2009). Ecosystem metabolism was driven mainly by C. prolifera (Table 4, Supplementary Material), but the metabolic deficit increased with increasing C. prolifera biomass, because respiratory processes are enhanced at a greater rate than photosynthetic ones with increasing C. prolifera biomass, especially in summer, when respiration and photosynthesis respond differentially to increasing temperature (Vaquer-Sunyer et al., 2012; Vaquer-Sunyer and Duarte, 2013). Indeed, biomass normalized fluxes indicate larger fluxes of combined OC in the summer months, the period where biomass normalized benthic NCP was generally lower (Table 5 in Supplementary Material), highlighting the necessity for allochthonous inputs to fuel respiratory processes. Two other vectors for allochthonous inputs could be: (1) Groundwater discharge, which is high in this ecosystem (Basterretxea et al., 2010) and wastewater delivered by increased human population during the summer months, when the OC deficit was largest, supporting high values of ambient DOC, both in surface and bottom waters, and (2) atmospheric deposition of EDOC via air-water exchange.
In summary the data presented here show the C. prolifera community studied to be in metabolic equilibrium while supporting a net release of DOC to the environment, where it can be transferred to adjacent waters. These observations require allochthonous carbon inputs likely derived from groundwater discharge and human activity in the watershed, delivered to the sediments through the high capacity of C. prolifera to remove particles from the water column, rendering the bay of Portocolom an effective conduit for OC. Furthermore, although EDOC represents roughly a quarter of combined OC in the system, EDOC production represents only 14% of the DOC flux and is completely recycled within the system, suggesting an allochtonous input of EDOC. Aside from the sources of allochthounous OC mentioned above, EDOC could also be derived from air-water exchange (Dachs et al., 2005; Ruiz-Halpern et al., 2010, 2014), a pathway that has been demonstrated to constitute a significant means of entry for OC to marine ecosystems.
Conflict of Interest Statement
The authors declare that the research was conducted in the absence of any commercial or financial relationships that could be construed as a potential conflict of interest.
Acknowledgments
We thank the invaluable help of several field assistants without which the work would not have been possible: Alexandra Steckbauer, Angela San Martín and Laura Royo. This research was funded by project MEDEICG, funded by the Spanish Ministry of Science and Innovation (CTM2009-07013) and an intramural project funded by CSIC (ref. 200430E661).
Supplementary Material
The Supplementary Material for this article can be found online at: http://www.frontiersin.org/journal/10.3389/fmars.2014.00067/abstract
References
Arneth, A., Sitch, S., Bondeau, A., Butterbach-Bahl, K., Foster, P., Gedney, N., et al. (2010). From biota to chemistry and climate: towards a comprehensive description of trace gas exchange between the biosphere and atmosphere. Biogeosciences 7, 121–149. doi: 10.5194/bg-7-121-2010
Barron, C., Apostolaki, E. T., and Duarte, C. M. (2014). Dissolved organic carbon fluxes by seagrass meadows and macroalgal beds. Front. Mar. Sci. 1, 42. doi: 10.3389/fmars.2014.00042
Barrón, C., and Duarte, C. M. (2009). Dissolved organic matter release in a Posidonia oceanica meadow. Mar. Ecol. Prog. Ser. 374, 75–84. doi: 10.3354/meps07715
Basterretxea, G., Tovar-Sanchez, A., Beck, A. J., Masqué, P., Bokuniewicz, H. J., Coffey, R., et al. (2010). Submarine groundwater discharge to the coastal environment of a Mediterranean island (Majorca, Spain): ecosystem and biogeochemical significance. Ecosystems 13, 629–643. doi: 10.1007/s10021-010-9334-5
Bravo-Linares, C., Mudge, S., and Loyola-Sepulveda, R. (2010). Production of volatile organic compounds (VOCS) by temperate macroalgae: the use of solid phase microextraction (SPME) coupled to GC-MS as method of analysis. J. Chilean Chem. Soc. 55, 227–232. doi: 10.4067/S0717-97072010000200018
Carpenter, J. H. (1966). New measurements of oxygen solubility in pure and natural water. Limnol. Oceanogr. 11, 264–277. doi: 10.4319/lo.1966.11.2.0264
Dachs, J., Calleja, M. L., Duarte, C. M., Del Vento, S., Turpin, B., Polidori, A., et al. (2005). High atmosphere-ocean exchange of organic carbon in the NE subtropical Atlantic. Geophys. Res. Lett. 32, L21807. doi: 10.1029/2005GL023799
Duarte, C. M. (1992). Nutrient concentration of aquatic plants: patterns across species. Limnol. Oceanogr. 37, 882–889. doi: 10.4319/lo.1992.37.4.0882
Duarte, C. M., and Cebrián, J. (1996). The fate of marine autotrophic production. Limnol. Oceanogr. 41, 1758–1766. doi: 10.4319/lo.1996.41.8.1758
Duarte, C. M., Losada, I. J., Hendriks, I. E., Mazarrasa, I., and Marbà, N. (2013). The role of coastal plant communities for climate change mitigation and adaptation. Nat. Clim. Change 3, 961–968. doi: 10.1038/nclimate1970
Pubmed Abstract | Pubmed Full Text | CrossRef Full Text | Google Scholar
Duarte, C. M., Middelburg, J., and Caraco, N. (2005). Major role of marine vegetation on the oceanic carbon cycle. Biogeosciences 2, 1–8. doi: 10.5194/bg-2-1-2005
Pubmed Abstract | Pubmed Full Text | CrossRef Full Text | Google Scholar
Gacia, E., Duarte, C. M., and Middelburg, J. J. (2002). Carbon and nutrient deposition in a Mediterranean seagrass (Posidonia oceanica) meadow. Limnol. Oceanogr. 47, 23–32. doi: 10.4319/lo.2002.47.1.0023
Gattuso, J.-P., Gentili, B., Duarte, C. M., Kleypas, J. A., Middelburg, J. J., and Antoine, D. (2006). Light availability in the coastal ocean: impact on the distribution of benthic photosynthetic organisms and their contribution to primary production. Biogeosciences 3, 489–513. doi: 10.5194/bg-3-489-2006
Hansell, D. A., and Carlson, C. A. (2002). Biogeochemistry of Marine Dissolved Organic Matter. San Diego, CA: Academic Press.
Hauxwell, J., McClelland, J., Behr, P. J., and Valiela, I. (1998). Relative importance of grazing and nutrient controls of macroalgal biomass in three temperate shallow estuaries. Estuaries 21, 347. doi: 10.2307/1352481
Hendriks, I. E., Bouma, T. J., Morris, E. P., and Duarte, C. M. (2010). Effects of seagrasses and algae of the Caulerpa family on hydrodynamics and particle trapping rates. Mar. Biol. 157, 473–481. doi: 10.1007/s00227-009-1333-8
Holmer, M., Duarte, C. M., Boschker, H. T. S., and Barrón, C. (2004). Carbon cycling and bacterial carbon sources in pristine and impacted Mediterranean seagrass sediments. Aquat. Microb. Ecol. 36, 227–237. doi: 10.3354/ame036227
Holmer, M., Marbà, N., Lamote, M., and Duarte, C. M. (2009). Deterioration of sediment quality in seagrass meadows (Posidonia oceanica) invaded by macroalgae (Caulerpa sp.). Est. Coast. 32, 456–466. doi: 10.1007/s12237-009-9133-4
Jurado, E., Dachs, J., Duarte, C. M., and Simó, R. (2008). Atmospheric deposition of organic and black carbon to the global ocean. Atmos. Environ. 42, 7931–7939. doi: 10.1016/j.atmosenv.2008.07.029
Pubmed Abstract | Pubmed Full Text | CrossRef Full Text | Google Scholar
Kristensen, E., Andersen, F. O., and Blackburn, T. H. (1992). Effects of benthic macrofauna and temperature on degradation of macroalgal detritus: the fate of organic carbon. Limnol. Oceanogr. 37, 1404–1419. doi: 10.4319/lo.1992.37.7.1404
Lamouroux, J. V. F. (1809). Observations sur la physiologie des algues marines, et description de cinq nouveaux genres de cette famille. Nouveau Bulletin des Sciences, par la Société Philomathique de Paris 1, 330–333.
Mateu-Vicens, G., Box, A., Deudero, S., and Rodriguez, B. (2010). Comparative analysis of epiphytic foraminifera in sediments colonized by the seagrass Posidoinia oceanica and invasive macrolagae Caulerpa Spp. J. Foraminiferal Res. 40, 134. doi: 10.2113/gsjfr.40.2.134
Oudot, C., Gerard, R., Morin, P., and Gningue, I. (1988). Precise shipboard determination of dissolved oxygen (Winkler procedure) for productivity studies with a commercial system. Limnol. Oceanogr. 33, 146–150. doi: 10.4319/lo.1988.33.1.0146
Penhale, P. A., and Smith, W. O. Jr. (1977). Excretion of dissolved organic carbon by eelgrass (Zostera marina) and its epiphytes. Limnol. Oceanogr. 22, 400–407. doi: 10.4319/lo.1977.22.3.0400
Ruiz-Halpern, S., Calleja, M. L., Dachs, J., Del Vento, S., Pastor, M., Palmer, M., et al. (2014). Ocean-atmosphere exchange of organic carbon and CO2 in the Antarctic Peninsula–physical and biological controls. Biogeosciences 11, 2755–2770. doi: 10.5194/bg-11-2755-2014
Ruiz-Halpern, S., Sejr, M. K., Duarte, C. M., Krause-Jensen, D., Dalsgaard, T., Dachs, J., et al. (2010). Air–water exchange and vertical profiles of organic carbon in a subarctic fjord. Limnol. Oceanogr. 55, 1733–1740. doi: 10.4319/lo.2010.55.4.1733
Sanchez-Moyano, J. E., Garcia-Adiego, E. M., Estacio, F. J., and Garcia-Gomez, J. C. (2001). Influence of the density of Caulerpa prolifera (Chlorophyta) on the composition of the macrofauna in a meadow in Algeciras Bay (southern Spain). Cienc. Mar. 27, 47–71.
Spyres, G., Nimmo, M., Worsfold, P. J., Achterberg, E. P., and Miller, A. E. J. (2000). Determination of dissolved organic carbon in seawater using high temperature catalytic oxidation techniques. Trends Anal. Chem. 19, 498–506. doi: 10.1016/S0165-9936(00)00022-4
Vaquer-Sunyer, R., and Duarte, C. M. (2013). Experimental evaluation of the response of coastal Mediterranean planktonic and benthic metabolism to warming. Est. Coast. 36, 697–707. doi: 10.1007/s12237-013-9595-2
Vaquer-Sunyer, R., Duarte, C. M., Jordà, G., and Ruiz-Halpern, S. (2012). Temperature dependence of oxygen dynamics and community metabolism in a shallow Mediterranean macroalgal meadow (Caulerpa prolifera). Est. Coast. 35, 1182–1192. doi: 10.1007/s12237-012-9514-y
Velimirov, B. (1986). DOC dynamics in a Mediterranean seagrass system. Mar. Ecol. Prog. Ser. 28, 21–41. doi: 10.3354/meps028021
Wetzel, R. G., and Penhale, P. A. (1979). Transport of carbon and excretion of dissolved organic carbon by leaves and roots/rhizomes in seagrasses and their epiphytes. Aquat. Bot. 6, 149–158. doi: 10.1016/0304-3770(79)90058-5
Wollast, R. (1998). Evaluation and comparison of the global carbon cycle in the coastal zone and in the open ocean. The sea 10, 213–252.
Keywords: dissolved organic carbon (DOC), exchangeable dissolved organic carbon (EDOC), volatile organic carbon (VOC), macroalgae, carbon cycling, metabolism, fluxes, production
Citation: Ruiz-Halpern S, Vaquer-Sunyer R and Duarte CM (2014) Annual benthic metabolism and organic carbon fluxes in a semi-enclosed Mediterranean bay dominated by the macroalgae Caulerpa prolifera. Front. Mar. Sci. 1:67. doi: 10.3389/fmars.2014.00067
Received: 17 October 2014; Accepted: 17 November 2014;
Published online: 08 December 2014.
Edited by:
Claire Mahaffey, University of Liverpool, UKReviewed by:
Karin M. Björkman, University of Hawaii, USAAlberto Vieira Borges, University of Liège, Belgium
Copyright © 2014 Ruiz-Halpern, Vaquer-Sunyer and Duarte. This is an open-access article distributed under the terms of the Creative Commons Attribution License (CC BY). The use, distribution or reproduction in other forums is permitted, provided the original author(s) or licensor are credited and that the original publication in this journal is cited, in accordance with accepted academic practice. No use, distribution or reproduction is permitted which does not comply with these terms.
*Correspondence: Sergio Ruiz-Halpern, Centre for Coastal Biogeochemistry, School of Environment, Science and Engineering, Southern Cross University, 1 Military road, Lismore, NSW 2480, Australia e-mail:c2VyZ2lvLnJ1aXpoYWxwZXJuQGdtYWlsLmNvbQ==