 Yaping Wu
 Jennifer Jeans1
 David J. Suggett
 Zoe V. Finkel
 Douglas A. Campbell
- 1Environmental Science and Biology, Mount Allison University, Sackville, NB, Canada
- 2State Key Laboratory of Marine Environmental Science, Xiamen University, Xiamen, China
- 3Climate Change Cluster, University of Technology Sydney, Sydney, NSW, Australia
Diatoms contribute ~40% of primary production in the modern ocean and encompass the largest cell size range of any phytoplankton group. Diatom cell size influences their nutrient uptake, photosynthetic light capture, carbon export efficiency, and growth responses to increasing pCO2. We therefore examined nitrogen resource allocations to the key protein complexes mediating photosynthesis across six marine centric diatoms, spanning 5 orders of magnitude in cell volume, under past, current and predicted future pCO2 levels, in balanced growth under nitrogen repletion. Membrane bound photosynthetic protein concentrations declined with cell volume in parallel with cellular concentrations of total protein, total nitrogen and chlorophyll. Larger diatom species, however, allocated a greater fraction (by 3.5-fold) of their total cellular nitrogen to the soluble Ribulose-1,5-bisphosphate Carboxylase Oxygenase (RUBISCO) carbon fixation complex than did smaller species. Carbon assimilation per unit of RUBISCO large subunit (C RbcL−1 s−1) decreased with cell volume, from ~8 to ~2 C RbcL−1 s−1 from the smallest to the largest cells. Whilst a higher allocation of cellular nitrogen to RUBISCO in larger cells increases the burden upon their nitrogen metabolism, the higher RUBISCO allocation buffers their lower achieved RUBISCO turnover rate to enable larger diatoms to maintain carbon assimilation rates per total protein comparable to small diatoms. Individual species responded to increased pCO2, but cell size effects outweigh pCO2 responses across the diatom species size range examined. In large diatoms a higher nitrogen cost for RUBISCO exacerbates the higher nitrogen requirements associated with light absorption, so the metabolic cost to maintain photosynthesis is a cell size-dependent trait.
Introduction
Nitrogen is essential to life as a major constituent of proteins, nucleic acids, and other macromolecules. In photosynthetic organisms, nitrogen is particularly required for building the abundant complexes mediating photosynthetic carbon assimilation (Dortch et al., 1984; Campbell et al., 2003; Falkowski et al., 2008; Shi and Falkowski, 2008). These nitrogen-rich protein complexes are required for harvesting light as well as driving photosynthetic electron flow that generates the energy and reducing power for inorganic nutrient assimilation, including CO2 fixation by Ribulose-1,5-bisphosphate Carboxylase Oxygenase (RUBISCO). Nitrogen availability in turn operates as the proximal limiting factor for phytoplankton carbon assimilation (Gruber and Galloway, 2008; Moore et al., 2013) in much of the modern ocean. Phytoplankton span a wide size range (Finkel et al., 2010). Under steady state growth, smaller cells have higher rates of nutrient diffusional delivery and lower cellular nutrient requirements for growth (Pasciak and Gavis, 1974; Gavis, 1976; Finkel et al., 2010; Marañón et al., 2013). Consequently, smaller cells dominate nitrogen-limited regions whereas larger cells are typically constrained to well mixed waters where nitrogen and other nutrients are replete (Irwin et al., 2006), although some large species exploit nitrogen limited waters through symbiotic N2 fixation (Foster et al., 2011). Larger phytoplankton cells also incur significant optical packaging effects (Falkowski, 1981; Morel and Bricaud, 1981; Kirk, 1994; Finkel, 2001), which lower the photons absorbed per unit of pigment-protein complex. These changes in optical performance decrease the return of captured photons per unit of metabolic nitrogen invested into pigment protein complexes (Raven, 1984). After the captured photons initiate charge separation in a photosystem, the electrons flow along an electron transport chain comprised of abundant protein complexes, to deliver reductant for the Calvin Cycle to generate the Ribulose-1,5-bisphosphate acceptor molecules for carbon fixation by RUBISCO (Ribulose-1,5-bisphosphate Carboxylase Oxygenase). Some fraction of the reductant is then ultimately retained in assimilated organic material (Kroon and Thoms, 2006; Kromkamp et al., 2008; Suggett et al., 2009; Halsey et al., 2010, 2013).
Seawater pCO2 concentrations are currently too low to saturate RUBISCO carboxylation activity via passive CO2 diffusion into the cell (Badger et al., 1998; Tortell et al., 2000) and phytoplankton thus employ carbon concentrating mechanisms (CCMs) to increase the CO2 concentration around their RUBISCO complexes (Raven et al., 2011, 2014). This need for CCMs is particularly pronounced in larger cells where CO2 diffusion is limited by a smaller surface area to volume ratio (Giordano et al., 2005; Wu et al., 2014). RUBISCO represents a moderate fraction (~2–5%) of total protein in marine phytoplankton (Brown et al., 2008; Losh et al., 2013; Li et al., 2014; Young et al., 2015) which, combined with C assimilation rates, mean that achieved Rubisco catalytic carboxylation turnover rates (C RbcL−1 s−1) in phytoplankton are generally faster than achieved rates in terrestrial plants. Such high achieved rates of carboxylation, at least in the smallest (nano–pico) phytoplankton, are in part attributable to taxonomic differences in RUBISCO catalytic properties (Badger et al., 1998; Young et al., 2012) as well as the structure and operation of CCMs (Losh et al., 2013; Raven, 2013) that likely impose substantial energy and macromolecular costs for phytoplankton to meet their CO2 requirements in the current ocean. As such, increased pCO2 availability via ocean acidification could potentially afford cells a means to lower these costs (Rost et al., 2008; Hopkinson et al., 2011; Wu et al., 2014). However, experiments simulating elevated pCO2 predicted for future oceans demonstrate variable growth responses across phytoplankton (Tortell and Morel, 2002; Schippers et al., 2004; Boelen et al., 2011; Gao et al., 2012; McCarthy et al., 2012; Li and Campbell, 2013) since interacting factors including light (Gao et al., 2012), nutrient limitation (Beardall et al., 2009), taxa (Langer et al., 2006), and cell size (Wu et al., 2014) can strongly influence the net growth outcomes under ocean acidification.
Diatoms contribute ~40% of productivity in the modern ocean, and span the widest size range of any phytoplankton group, from several μm to several 100 μm in cell diameter (Finkel et al., 2010). Within the diatoms, fewer than 50 species contribute >90% of all diatom biomass globally, with centric species dominating (LeBlanc et al., 2012). With increasing cell volume across species, diatoms exhibit a decrease in many key traits, notably growth rate, light capture per chlorophyll, photosynthesis rates per unit chlorophyll-a and susceptibility to photoinactivation of Photosystem II (Mullin et al., 1966; Burkhardt et al., 1999; Finkel, 2001; Marañón et al., 2007, 2013; Key et al., 2010). It is, however, unknown how these size-scaling patterns interact with (re) distributions of nitrogen amongst the catalytic complexes governing CO2 assimilation and growth, and whether size-scaling in resource allocations alter in response to elevated pCO2. We recently found (Wu et al., 2014) that increased pCO2 differentially stimulates the growth of larger vs. smaller centric diatoms, apparently through a release of diffusional limitations upon CO2 delivery to the surfaces of larger cells. We therefore grew 6 strains of marine centric diatoms, spanning five orders of magnitude in cell volume, under 3 pCO2 levels, with growth-saturating light and nutrient repletion, to investigate interactive effects of cell size and pCO2 on photosynthetic performance and resource allocations of cellular nitrogen quotas. We determined nitrogen investment into core photosynthetic constituents across the species and pCO2 range, and analyzed in parallel how changing macromolecular investments offset changes in the achieved photosynthetic turnover rates of the abundant catalytic complexes mediating photosynthesis.
Materials and Methods
Species, Culture Conditions, Sampling and Growth Rates
Six marine centric diatom strains, Thalassiosira pseudonana (CCMP 1335); Thalassiosira oceanica (CCMP 1003); Thalassiosira guillardii (CCMP 988); Thalassiosira weissflogii (CCMP 1336); Thalassiosira punctigera (CCAP 1085/19) and Coscinodiscus wailesii (CCMP 2513) were maintained in mid-exponential growth through semi-continuous culturing at 20°C (as per Wu et al., 2014) in 1 L flasks. Cultures were illuminated with cool fluorescent tubes at a photon flux density of 350 μmol m−2 s−1, measured with Li-Cor spherical PAR sensor in the center of the incubation bottle (8 × 8 × 16 cm), under a 12:12 light:dark cycle, and always sampled 6 h after lights on. After the initial measurement of light levels in the center of the flask, we did not perform further light measures as the cultures grew, but the cultures were optically thin and the light level was saturating for growth of these species under these conditions (data not shown). The analyses in this paper draw upon the same culture experiments and some of the underlying data sets supporting (Wu et al., 2014), but include data from an additional species Thalassiosira oceanica (CCMP 1003).
Nutrient replete f/2 media was made using artificial seawater prepared with a total alkalinity (TA) of ~2300 μmol kg−1, at three different pH (8.42, 8.16, and 7.90) corresponding to pCO2 levels of ca. 190, 380, and 750 ppmv (Riebesell et al., 2010; Wu et al., 2014) and filtered to remove debris. The dissolved inorganic carbon (DIC) concentration in the media was measured with an infrared gas analyzer (QuBit, Canada) (McCarthy et al., 2012) and absolute pCO2 subsequently computed using CO2SYS software (Pierrot et al., 2006) from the known values of DIC, pH, salinity, and alkalinity of the media. Culture vessels were sealed to avoid gas exchange with the atmosphere, and maintained at low biomass with chlorophyll a < 10 μg L−1 by regular dilution with pre-equilibrated medium. Using this approach, culture pH variability remained within 0.05 pH units of the target levels throughout the growth experiments. Flasks were manually agitated 4–5 times daily and distributed arbitrarily within the growth chamber.
Daily samples from the different pCO2 cultures were fixed with Lugol's acid solution for determination of growth rate and cell size, with analyses within a week of fixation. Species with diameters <40 μm were counted with a Coulter Counter (Multisizer 3, Beckman) using the filtered media as a blank. Larger species were counted under the microscope using a Sedgwick Rafter chamber. The cell specific growth rate (μ, d−1) for each of the strains was determined by ordinary least squares linear regression of ln cell density, corrected for culture dilutions with media, over time. Cell volume for all species was estimated from linear dimensions from images taken with a camera attached to a light microscope calibrated with a micrometer, using Image-J software and assuming the cells were cylinders. For all samples a minimum of 100 cells were measured.
After at least eight rounds of cell division with steady growth rate (Wu et al., 2014) to ensure acclimation to the pCO2 regime, cell samples for further analyses were harvested by mild vacuum filtration onto glass fiber filters (0.22 μm pore size, Whatman; vacuum pump at 0.05–0.06 MPa). Filters were pulled dry of bulk media but were not further rinsed for most analyses. During harvest about half of the culture volume was taken, across multiple sub-samples for different analyses. Cells on filters were flash frozen in liquid nitrogen and stored at −80°C until later analyses of protein composition (25 mm filters) or CN elemental analyses (13 mm pre-combusted filters). Each combination of taxa and pCO2 was cultured independently in at least 3 separate flasks. All subsequent analyses and data transformations were conducted independently using matched samples and measures taken at the same sampling time from each flask separately. Final plotted points present the average of the determinations from each flask. In this way we avoided propagation of errors in the multi-step data transformations.
Protein Quantitation and Nitrogen Resource Allocation Estimates
Total protein was extracted from the cells on the frozen glass fiber filters using an FastPrep-24 with the 24 × 2 rotor (MPBio). Each frozen filter was transferred to a 2 mL tube containing bead lysing matrix D (MPBio) and 700 μL of extraction buffer (140 mM TRIS base, 100 mM TrisHCL, 75 mM LDS, 0.5 mM EDTA, 0.4 mM protease inhibitor (AEBSF, BioShop), 10% w/v glycerol). The FastPrep was set to run at 6.5 m/s for three 1-min cycles. Samples were held on ice for 1 min between each cycle. Following cell lysis, each sample was centrifuged for 3 min at 10,000 × g and the supernatant assayed for total protein concentration using the BioRad DC protein assay kit with the mixed protein preparation Bovine Gamma Globulin (Pierce) standards of known concentration.
RUBISCO, Photosystem II (PSII), Cytb6f, and Photosystem I (PSI) protein complex contents were estimated using quantitative immunoblotting of representative subunits RbcL, PsbA, PetC, and PsaC respectively (Brown et al., 2008), by comparison to four point calibrated protein quantitation standard curves for each specific antibody (AgriSera, AS03-037, and AS01-017S; AS05-084 and AS01-016S; AS08 330 and AS08 330S, AS10 939 and AS04 042S). The secondary antibody goat anti-rabbit IgG was used for all blots in a dilution of 1: 50,000 (ImmunoReagents Inc, lot 14-122-042810).
Cells were harvested onto 13 mm GF/F filter for measurement of total particulate organic nitrogen, which was assumed to be equivalent to cellular nitrogen, measured using an elemental analyzer (VarioIIIEL, Elementar), and normalized to cell counts (Wu et al., 2014). The fraction of total N allocated to RUBISCO, to Photosystem II and to the summed protein complexes of the photosynthetic system was estimated using molar quantitations of Chl a and Chl c by absorbance spectrophotometry (Jeffrey and Humphrey, 1975), and the representative protein subunits PsbA, PsbD, PetC, PsaC, and RbcL by quantitative immunoblotting. We multiplied the molar content of each indicator molecule by its molecular nitrogen content. We estimated nitrogen contents for each protein complex as the sum of all amino acid nitrogen atoms in the protein subunit amino acid sequences predicted from the genome of Thalassiosira pseudonana (Armbrust et al., 2004), multiplied by the stoichiometry for conserved subunits within the complex as determined from crystal structures of PSII (Umena et al., 2011) (for PsbD or PsbA), the Cytochrome b6f complex (Baniulis et al., 2008) (for PetC), the PSI complex (Amunts et al., 2010) (for PsaC) or the RUBISCO complex (Mizohata et al., 2002) (for RbcL). To estimate the nitrogen allocation to the fucoxanthin-chlorophyll protein antenna complex (FCP) we used a content of two Chl c per FCP monomer (Premvardhan et al., 2010) to estimate the molar content of FCP monomers, and multiplied by the nitrogen content of a representative FCP protein monomer (Nagao et al., 2013) based upon the protein sequence (FCP8 Thalassiosira pseudonana NCBI XP_002290137.1). It should be noted that this approach of summed nitrogen allocation to the photosynthetic system is conservative since we did not include the ATP synthase complex, nor protein complexes mediating carbon concentration nor the Calvin Cycle aside from RUBISCO.
To compare our elemental analyses of cellular C and N to photosynthetic parameters, the electron equivalent content of the accumulated C and N per biovolume was estimated as:
C/cell and N/cell were estimated from elemental analyses of particulate organic carbon or particulate organic N and cell counts. To the extent that our cultures contained non-living particulate debris (Agusti and Sanchez, 2002) our estimates of C & N assimilation rates will be exaggerated. The source for assimilated C in our cultures is dissolved CO2 which requires a minimum of 4 e−/C for reductive assimilation into biomass, although this value is likely an underestimate since diatoms accumulate C in the form of lipids (Halsey et al., 2010, 2013). The source for assimilated N was dissolved NO−3 which requires a minimum of 10 e−/N for reductive assimilation into biomass.
Photosynthetic Parameters
The PSII electron transport rate (e− ● PSII−1 ● s−1) during the 12 h illuminated growth period was estimated (Suggett et al., 2004, 2009) based on photosynthetic parameters measured via FIRe fluorometry (Satlantic) as:
Where PPFD is the growth photon flux (350 μmol photon m−2 s−1) measured with a Walz microspherical quantum sensor (Walz, Germany). σ′PSII (m2 quanta−1) is the PSII effective absorption cross section (Kolber et al., 1998) measured with a background actinic light approximately equivalent to the growth light level. σ′PSII is estimated by fast repetition rate fluorometry induction (Laney, 2003) with a blue light emitting diode source from the FIRe fluorometer and thus was corrected to the white growth light using a spectral correction factor for diatom absorbance of blue vs. white light (Suggett et al., 2009). ΦPSII′ is the PSII photochemical efficiency under growth light, while ΦPSII is the maximum PSII efficiency in a dark-acclimated state. The factor A converts 1.0 mol photon absorbed by PSII to 1.0 mol electron generated by PSII (Suggett et al., 2009).
Apparent carbon assimilation per RUBISCO (C RbcL−1 s−1) was estimated as:
C cell−1 was estimated from elemental analyses of particulate organic carbon normalized to cell counts, μ was the cell specific exponential growth rate (s−1), and RbcL was from immunoquantitation data normalized to cell counts. This estimator is based upon net assimilated carbon per cell, and upon cellular growth rate integrated over a full 12:12 diel illumination cycle. Carbon assimilation is actually restricted to the illuminated fraction of the day, and thus we also include the factor of 2 to account for carbon assimilation s−1 RbcL−1 during the illuminated fraction of the 12:12 diel cycle. This likely underestimates actual carbon fixation per RUBISCO during the illuminated period, since we neglect C lost from the cell through respiration or release of extracellular products (López-Sandoval et al., 2013), but as noted above, any contribution of non-living particulate organic carbon will exaggerate the apparent C living cell−1. The protein-specific electron generation rate (e− μg protein−1 s−1) and the protein specific carbon assimilation rate (C μg protein−1 s−1) were then derived from the PSII electron transport rate and the apparent carbon assimilation per RUBISCO, both normalized to cellular protein content.
Results
Total protein concentration per unit biovolume decreased with increasing cell volume, from ~0.37 × 10⁻⁶ μg protein μm−3 for the smallest species, T. pseudonana, to ~8 × 10⁻⁹ μg protein μm−3 for the largest species, C. wailesii, (Figure 1A). The extracted protein quantified through the dye binding assay represented 88 ± 7% (n = 89, ± 95% confidence interval) of the particulate organic nitrogen from the same cultures, determined using elemental analyses. The ratio of extracted protein to particulate nitrogen varied somewhat among the species. In particular, in the largest species Coscinodiscus wailesii detected protein represented 50 ± 9% (n = 9, ± 95% confidence interval) of total (particulate) nitrogen. We are currently pursuing this issue to determine whether the variation is biological, technical, or both. For subsequent analyses, levels of protein complexes are expressed as number of complexes per cell, or as the fraction of cellular (particulate) nitrogen allocated to the complex, and issues of protein quantitation cancel out in the data transformations.
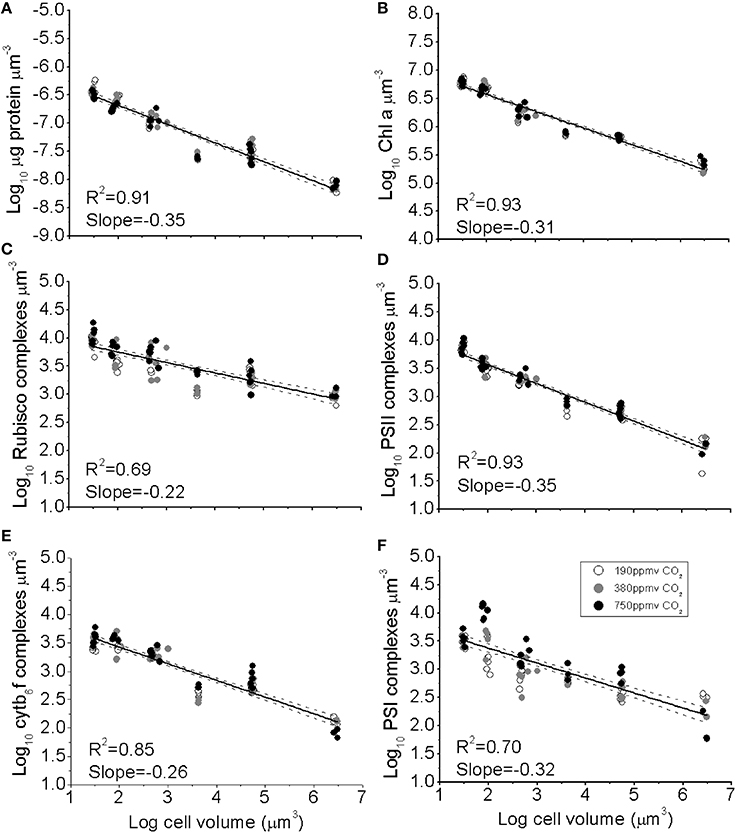
Figure 1. (A) The log10 of cellular concentration of total protein, (B) Chl a, (C) RUBISCO complexes, (D) Photosystem II complexes, (E) Cytb6f complexes, and (F) Photosystem I complexes plotted as functions of log10 cell volume. Cultures were grown under pCO2 190 ppmv (open symbols); 380 ppmv (shaded symbols) or 750 ppmv (black symbols). Solid lines indicate pooled regressions through data from all pCO2 levels. Dotted lines indicate the 95% confidence band on the regressions, n = 3–6 for each point.
The concentrations of photosynthetic complexes per unit biovolume also declined with increasing cell volume (Figures 1B–E), from ~7500 PSII μm−3, ~3500 PSI μm−3, ~3500 Cytb6f μm−3, and ~9500 RUBISCO (L8S8 complex) μm−3 for the smallest species, down to ~130 PSII μm−3, ~170 PSI μm−3, 110 Cytb6f μm−3, and ~960 RUBISCO μm−3 for the largest species. We did not find significant effects of pCO2 on the model 2 regression slopes (Figure 1), which parameterise the size-scaling for each complex; (log10 (Y) = b * log10 (cell volume) + Y intercept). Thus, a single size-scaling model was used to describe the cell size dependency for each protein pool across all pCO2 treatments pooled; specifically b = −0.349 ± 0.010 (±95% confidence intervals) for total protein (Figure 1A); −0.306 ± 0.007 for Chl a (Figure 1B); −0.347 ± 0.013 for PSII (Figure 1D), −0.256 ± 0.009 for Cytb6f (Figure 1E) and −0.317 ± 0.021 for PSI (Figure 1F). RUBISCO, in contrast, showed a significantly smaller size scaling exponent (b = −0.223 ± 0.012, Figure 1C), showing that relatively more of the total protein pool was allocated to RUBISCO as cell size increases.
The fraction of total cellular nitrogen allocated to the summed photosynthetic complexes increased with cell volume, from the smaller species to larger species (Figure 2A; Table 1). In spite of this increased relative allocation to photosynthesis, the cell specific growth rates across the range of species decreased significantly with cell size (Wu et al., 2014) with scaling exponents of -0.071 for cells growing under 190 ppmv pCO2, −0.064 under 380 ppmv pCO2 and −0.052 under 750 pCO2. We detected pCO2 effects upon protein allocations in individual species; notably, the photosynthetic N-fraction in T. oceanica and T. pseudonana increased with elevated pCO2 treatments (Figure 2A) but showed no consistent trend for larger species (Figure 2A). The total nitrogen-fraction allocated to PSII ranged from 0.003 to 0.016 and increased significantly under elevated pCO2 conditions in the smallest species, T. oceanica and T. pseudonana (p < 0.05) (Figure 2B). The RUBISCO N-fraction ranged widely from 0.01 to 0.08, and increased with cell volume (Table 1) consistent with the size scaling of cellular RUBISCO content per μm−3 relative to total protein concentration (above, Figures 1A,C). Interestingly, under our nitrogen replete growth conditions, there was no correlation between growth rate and the fraction of cellular nitrogen allocated to photosynthesis nor to RUBISCO (data not shown). We are currently conducting analogous experiments under nitrogen limitation to pursue this issue.
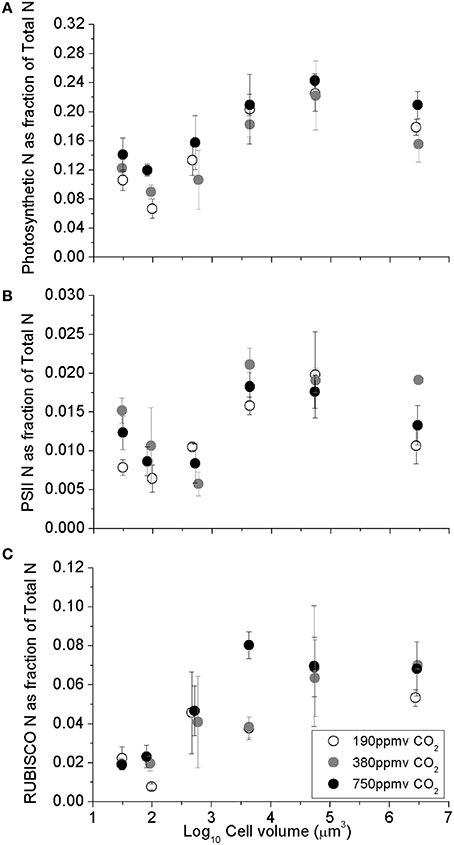
Figure 2. (A) Sum of major photosynthetic complexes (FCP, PSII, Cytb6f, PSI, RUBISCO), (B) Photosystem II, and (C) The fraction of total cellular N allocated to RUBISCO, as a function of log10 cell volume. Cultures were grown under pCO2 190 ppmv (open symbols); 380 ppmv (shaded symbols) or 750 ppmv (black symbols). Vertical error bars indicate standard deviation, n = 3 − 6.

Table 1. Results of Two-Way ANOVA, testing if pCO2 or cell size had individual or interactive effects on key parameters.
PSII electron transfer rates estimated from chlorophyll fluorescence parameters in the light Equation (2), ranged from ~330 e− PSII−1 s−1 in the smallest species, T. pseudonana, down to ~150 e− PSII−1 s−1 in the largest species examined, C. wailesii (Figure 3A), as a consequence of packaging effects on excitation delivery to PSII (Figure 4). The apparent C assimilated per RUBISCO Equation (3) decreased from ~8 C RbcL−1 s−1 in the smallest species down to ~2 C RbcL−1 s−1 in the largest species (Figure 3B). Thus, the decrease in achieved turnover with increasing cell size was greater for RUBISCO than for PSII. The apparent RUBISCO turnover rate was significantly lower under elevated pCO2 for T. oceanica and T. weissflogii (p < 0.05) (Figure 3B, Table 1). PSII electron generation normalized to total protein did not exhibit any general trend with cell volume but did exhibit pCO2 effects for individual species (Figure 3C, Table 1). Across the size spectrum, carbon assimilation rates normalized to total cellular protein did not show a trend from small to large diatoms (Figure 3D, Table 1), since large species generally allocated more of their cellular nitrogen into RUBISCO, which countered the lower apparent turnover rate of their RUBISCO complexes (Figure 3B).
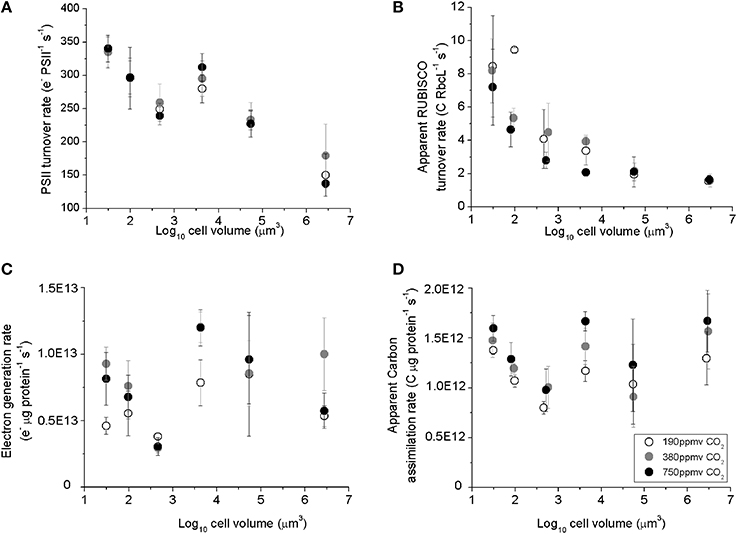
Figure 3. (A) The Photosystem II electron turnover rate, (B) apparent carbon assimilation rate per RUBISCO catalytic site, (C) electron generation rate per total protein, and (D) apparent carbon assimilation rate per total protein, plotted vs. log10 cell volume. Cultures were grown under pCO2 190 ppmv (open symbols); 380 ppmv (shaded symbols) or 750 ppmv (black symbols). Vertical error bars indicate standard deviation, n = 3–6.
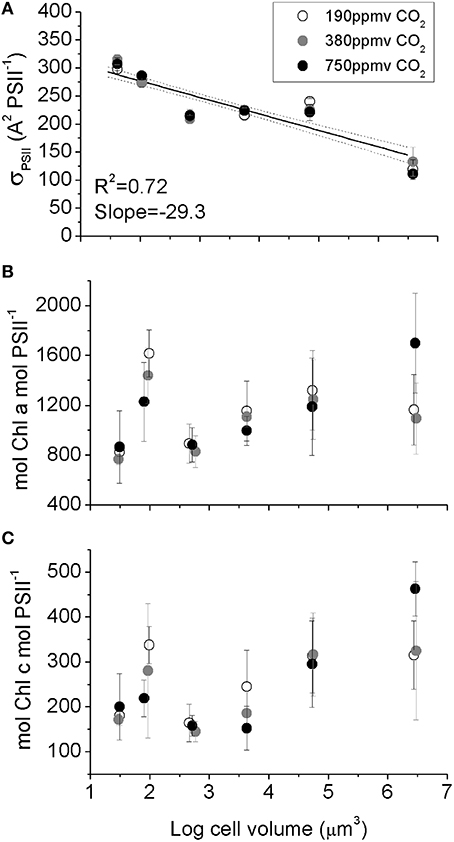
Figure 4. (A) Effective blue light absorbance cross section for Photosystem II, (B) Chl a PSII−1, (C) Chl c PSII−1 plotted vs. log10 cell volume. The significant decrease in σPSII with increasing cell size (A) reflects optical packaging effects because Chl per PSII (B,C) does not decline with cell size. Solid line indicates pooled linear regression for samples from the three pCO2 levels. Dotted lines indicate the 95% confidence band on the regression. Cultures were grown under pCO2 190 ppmv (open symbols); 380 ppmv (shaded symbols) or 750 ppmv (black symbols). n = 3–6.
A measure of PSII light capture capacity, the effective absorption cross section serving PSII (σPSII,), decreased from 320 A2 PSII−1 in the smallest species down to 130 A2 PSII−1 in the largest species (Figure 4A). In contrast, the molar ratio of Chl a (Figure 4B) and Chl c (Figure 4C) to PSII reaction center content varied amongst species, with an average of ~1000 mol Chla: mol PSII, and ~220 mol Chlc: mol PSII (Figure 4C), but with no significant trend with cell size. We found no consistent pCO2 effects for these light capture capacity parameters.
Carbon accumulated per generated electron (carbon e-−1), varied from 0.11 to 0.28 across species (Figure 5A), with no consistent trends observed with cell size or with pCO2 (Table 1). A regression of accumulated electron equivalents invested to assimilated N and C per cell volume Equation (1) vs. electrons generated by PSII per cell volume (e− μm−3 s−1) shows a ratio of assimilated organic matter conserving ~95% of the predicted electrons generated, across the range of diatom sizes (Figure 5B).
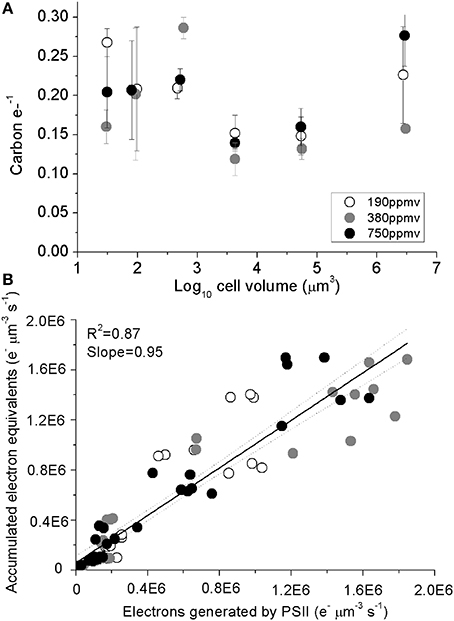
Figure 5. (A) Assimilated C per electron generated by PSII plotted plotted vs. log10 cell volume; vertical error bars indicate standard deviation. (B) Accumulated electron equivalents vs. electrons generated by PSII. Solid line indicates pooled linear regression for samples from the three pCO2 levels. Dotted lines indicate the 95% confidence band on the regression. Cultures were grown under pCO2 190 ppmv (open symbols); 380 ppmv (shaded symbols) or 750 ppmv (black symbols). n = 3–6.
Discussion
We grew a size spectrum of marine centric diatoms under nutrient replete and light-saturated growth at three levels of pCO2. As expected (Mullin et al., 1966; Finkel, 2001; Marañón et al., 2007, 2013) the cellular concentrations of total protein, chlorophyll and the membrane bound photosynthetic complexes Photosystem II, Photosystem I and Cytochrome b6f all declined with increasing cell volume, with similar negative scaling exponents. RUBISCO, however, showed a less negative size scaling, so that larger diatoms allocated a larger fraction of their total protein toward RUBISCO, which in turn drove up the fraction of their total nitrogen allocated to their summed photosynthetic system. As with previous studies (Losh et al., 2013; Li et al., 2014; Young et al., 2015), RUBISCO represented only ~2% of total cellular nitrogen in the smaller diatoms but increased to ~8% in the larger diatoms (Figure 2C; Table 1). Thus, bigger diatoms make a greater investment of cellular nitrogen into carbon-assimilation capacity relative to photosynthetic electron generation, compared to smaller diatoms.
Increased pCO2 differentially stimulated growth rates by up to 15% in the largest of these centric diatoms (Wu et al., 2014). In our relatively short-term acclimatory pCO2 manipulation experiment we observed significant nitrogen allocation responses to pCO2 in some species. For example the fraction of total N allocated to the photosynthetic complexes increased with increased pCO2 in the small species T. oceanica and T. weissflogii (Figure 2A), although at our level of replication these changes did not generate significant correlations with growth rate. Such species-specific responses are consistent with the growing evidence of variable responses to pCO2 availability across taxa, even within closely related phytoplankton taxonomic groups (Trimborn et al., 2009, 2013; Brading et al., 2013; Gao and Campbell, 2014). Nevertheless, increased CO2 did not significantly change the size scaling of nitrogen allocations to the photosynthetic system complexes across our size range of centric diatoms. This generalized size scaling pattern across pCO2 levels suggest that the size-dependent increase in nitrogen costs to maintain C-assimilation outweighs any changes in costs associated with changing pCO2 (Raven et al., 2014).
To assess comparative physiological returns upon nitrogen investments across the diatom size spectrum and pCO2, we estimated PSII electron transport per PSII complex, following Suggett et al. (2009), but using PsbA protein content as a proxy for the content of functional PSII. As expected given the optical packaging effects that decrease effective absorption cross sections with increasing diatom cell size (Figure 4) (Kirk, 1994; Finkel, 2001; Key et al., 2010; Wu et al., 2014), achieved electron transport per PSII decreased significantly with increasing cell size. In parallel, we used the cellular growth rate, carbon per cell, and cellular RbcL protein content to estimate the achieved carbon assimilation per RUBISCO active site. As with (Losh et al., 2013; Young et al., 2015), the smaller diatoms showed apparent carbon assimilation rates per RUBISCO close to the catalytic turnover maxima expected for RUBISCO (Badger et al., 1998; Badger and Bek, 2007) but these apparent rates declined with increasing cell size.
We propose initial, non-exclusive hypotheses to explain the cell size-dependent decline in apparent C assimilation per RUBISCO.
(i) We observed a significant pCO2 enhancement of growth rate of ~15% under 750 ppmv pCO2 in the largest centric diatoms (Wu et al., 2014), which was explicable via relief from passive CO2 diffusion limitation to the cell surface of larger diatoms. An increase in RUBISCO protein allocation in larger cells could be driven to compensate for a size-dependent limitation on CO2 diffusion. As the immediate sink for CO2, higher cellular RUBISCO content could drive faster CO2 uptake per cell. Although we have not yet tested pennate diatoms, their higher surface to volume ratios could alter these responses to pCO2.
(ii) The decline in achieved RUBISCO performance could reflect negative scaling of metabolic rates with cell size (Burkhardt et al., 1999; Finkel, 2001; Marañón et al., 2013), which could limit the rate of metabolic regeneration of the Ribulose-1,5-bisphosphate acceptor molecule for RUBISCO carbon fixation (Mott et al., 1984; Gotoh et al., 2010).
(iii) Since our C-assimilation estimates are based upon retained particulate organic carbon, an increase in extracellular carbon release from larger diatoms, or a size-dependent increase in respiratory losses to support metabolic needs, could lower the apparent C assimilation per RUBISCO, although our consistent ratio of accumulated electrons to generated electrons across the cell size spectrum argues against this scenario. If larger diatoms experienced a disproportionate increase in respiratory losses, we would expect a decrease in the ratio of accumulated to generated electrons, but we did not see such a decrease, consistent with previous discussions (Marañón et al., 2013).
(iv) Our cultures were growing under nutrient repletion, the C:N was around 6.7:1 with no consistent pCO2 effects (Wu et al., 2014), so the increased allocation to RUBISCO in larger cells could reflect a size-dependent relative increase in luxury accumulation of RUBISCO protein, that in turn lowers achieved performance per unit RUBISCO. Such luxury protein accumulation could relate to increased vacuolization in larger species (Stolte and Riegman, 1995). A comparable experiment with small and large centric diatoms under nitrogen-limited chemostats to limit luxury accumulation is now underway to test this hypothesis.
(v) Micro-evolutionary changes in RUBISCO structure/function (Young et al., 2012) could separate small from large diatoms. We compared the RbcL (large subunit of RUBISCO) sequences across our panel of diatoms (NCBI gi118411104, gi315320529, gi98990579, gi98990561, gi98990581, gi98990595, gi329343318) as well as RbcS (small subunit of RUBISCO) sequences available for the studied species or con-generics (NCBI gi327258980, gi327258982, gi315320528, gi283569001, gi468111925). As expected, the sequences are highly conserved across the species with no amino acid differences apparent within the active site nor within the RbcL:RbcL homodimer interface surfaces. There are, however, suggestive amino acid point changes within regions annotated as the heterodimer RbcL:RbcS dimer interfaces, including a change in RbcS at amino acid 46 from NYWEL (amino acid sequence) conserved across the smaller Thalassiosira lineages (NCBI gi327258980, gi327258982, gi315320528, gi283569001) compared to SYWEL in an RbcS sequence from a larger Coscinodiscus (NCBI gi468111925).
Further analyses of a broader range of diatom RbcS sequences for which we had cell size estimates (n = 24) (Finkel, 2007) demonstrated that the 18 taxa with the NYWEL sequence at amino acid 46 had a median cell biovolume of ~88 μm3 compared to the 6 taxa with SYWEL with a median cell biovolume of ~3043 μm3 (p = 0.08). In parallel RbcL position 171, also annotated as falling at the RbcL:RbcS heterodimer interface, shifts from NKYGTP conserved across the smaller Thalassiosira lineages (NCBI gi118411104, gi315320529, gi98990579, gi98990561, gi98990595) to NKYGIP in Thalassiosira weissflogii (NCBI gi98990581) and to NKYGAP in the large Coscinodiscus wailesii (NCBI gi329343318). Similarly, an even wider alignment of diatom RbcL sequences for which we had cell size estimates (N = 390) (Finkel, 2007) showed that the 152 taxa with NKYGTP had a median cell biovolume of ~132 μm3, compared to a median cell biovolume of ~452 μm3 for the 238 taxa with a hydrophobic amino acid such as I at position 171.
Even though we cannot yet discern the cause(s) for the decreasing C-assimilation per RUBISCO with increasing cell size, larger centric diatoms allocate an increased fraction of their total cellular nitrogen to RUBISCO, and this increase largely offsets the slower achieved C-assimilation rates per unit RUBISCO enzyme.
The reductant equivalents accumulated in the form of cellular C and N represented about 95% of the estimated electrons generated by PSII, across our diatom size spectrum. This ratio is high compared to other studies based upon 14C uptake or oxygen evolution (Suggett et al., 2009; Halsey et al., 2010, 2013; Lawrenz et al., 2013). Our estimate of cellular C and N was based upon total Particulate Organic Carbon and Particulate Organic Nitrogen, and so likely exaggerates the actual content of C and N from those living cells that contribute to the estimate of photosynthetic electron transport, since our cultures contained some dead cells (Agusti and Sanchez, 2002) and other debris. Even so, the ratio of accumulated to generated reductant did not vary with cell size nor with pCO2 treatment, indicating a conserved allocation of photosynthetically derived reductant to total C on a per cell volume basis, at least for diatoms under nutrient and light repletion. Furthermore, Antarctic diatoms (Young et al., 2015) during a bloom approached our estimates for the ratio of accumulated reductant per generated electrons, estimated over a diel cycle (Lawrenz et al., 2013) supporting the validity of our approach.
Nitrogen allocation to the macromolecular complexes of the photosynthetic apparatus now represents a predictably size dependent biosynthetic cost for diatoms. We show that large diatoms incur a higher demand upon their nitrogen metabolism capacity to accumulate larger pools of RUBISCO, apparently to counter their slower achieved carbon uptake per RUBISCO. Thus, in addition to the cost of decreased light harvesting per unit chlorophyll imposed by optical packaging, slower C-uptake per RUBISCO places a further size-dependent burden upon phytoplankton nitrogen metabolism, thereby reinforcing the competitive disadvantage upon larger cells relative to smaller cells in acquiring the key resources required for photosynthesis. Our experimentally derived outcome for centric diatoms is consistent with observations of their distribution in the open ocean; specifically, larger centric diatom species appear restricted to deeper depths closer to the nutricline whereas smaller species are more abundant in the high light-low nutrient waters (Venrick, 2002). The size-dependent increase in the burden upon nitrogen metabolism could also explain why some larger diatoms form associations with N2-fixing bacteria in open ocean surface waters (Zehr et al., 2000; Foster et al., 2011). We therefore suggest that the combined burdens of not only light harvesting but also CO2 acquisition upon nitrogen metabolism may place an effective upper limit on the cell size that can sustain growth of diatoms.
Conflict of Interest Statement
Dr. Douglas A. Campbell is a minority shareholder in the company Environmental Proteomics NB that provided some of the antibodies and protein quantitation standards used in this work. The authors declare that the research was conducted in the absence of any commercial or financial relationships that could be construed as a potential conflict of interest.
Acknowledgments
This work was funded by NSERC Canada Discovery and Canada Research Chair funding to Zoe V. Finkel and Douglas A. Campbell. Yaping Wu was supported by the National Natural Science Foundation of China (No. 41206091, 41476093). Jennifer Jeans was supported by a Mount Allison University Rice Graduate Scholarship and by an NSERC Canada Post Graduate Scholarship. The authors thank the two reviewers for generously extensive comments that helped us improve the manuscript.
References
Agusti, S., and Sanchez, M. C. (2002). Cell viability in natural phytoplankton communities quantified by a membrane permeability probe. Limnol. Oceanogr. 47, 818–828. doi: 10.4319/lo.2002.47.3.0818
Amunts, A., Toporik, H., Borovikova, A., and Nelson, N. (2010). Structure determination and improved model of plant photosystem I. J. Biol. Chem. 285, 3478–3486. doi: 10.1074/jbc.M109.072645
Pubmed Abstract | Pubmed Full Text | CrossRef Full Text | Google Scholar
Armbrust, E. V., Berges, J. A., Bowler, C., Green, B. R., Martinez, D., Putnam, N. H., et al. (2004). The genome of the diatom Thalassiosira Pseudonana: ecology, evolution, and metabolism. Science 306, 79–86. doi: 10.1126/science.1101156
Pubmed Abstract | Pubmed Full Text | CrossRef Full Text | Google Scholar
Badger, M. R., Andrews, T. J., Whitney, S. M., Ludwig, M., Yellowlees, D. C., Leggat, W., et al. (1998). The diversity and coevolution of Rubisco, plastids, pyrenoids, and chloroplast-based CO2-concentrating mechanisms in algae. Can. J. Bot. 76, 1052–1071. doi: 10.1139/b98-074
Badger, M. R., and Bek, E. J. (2007). Multiple Rubisco forms in proteobacteria: their functional significance in relation to CO2 acquisition by the CBB cycle. J. Exp. Bot. 59, 1525–1541. doi: 10.1093/jxb/erm297
Pubmed Abstract | Pubmed Full Text | CrossRef Full Text | Google Scholar
Baniulis, D., Yamashita, E., Zhang, H., Hasan, S. S., and Cramer, W. A. (2008). Structure-function of the cytochrome b6f complex. Photochem. Photobiol. 84, 1349–1358. doi: 10.1111/j.1751-1097.2008.00444.x
Pubmed Abstract | Pubmed Full Text | CrossRef Full Text | Google Scholar
Beardall, J., Sobrino, C., and Stojkovic, S. (2009). Interactions between the impacts of ultraviolet radiation, elevated CO2, and nutrient limitation on marine primary producers. Photochem. Photobiol. Sci. 8, 1257. doi: 10.1039/b9pp00034h
Pubmed Abstract | Pubmed Full Text | CrossRef Full Text | Google Scholar
Boelen, P., van de Poll, W. H., van der Strate, H. J., Neven, I. A., Beardall, J., and Buma, A. G. J. (2011). Neither elevated nor reduced CO2 affects the photophysiological performance of the marine Antarctic diatom Chaetoceros brevis. J. Exp. Mar. Biol. Ecol. 406, 38–45. doi: 10.1016/j.jembe.2011.06.012
Brading, P., Warner, M. E., Smith, D. J., and Suggett, D. J. (2013). Contrasting modes of inorganic carbon acquisition amongst Symbiodinium (Dinophyceae) phylotypes. New Phytol. 107, 432–442. doi: 10.1111/nph.12379
Pubmed Abstract | Pubmed Full Text | CrossRef Full Text | Google Scholar
Brown, C., MacKinnon, J., Cockshutt, A., Villareal, T., and Campbell, D. (2008). Flux capacities and acclimation costs in Trichodesmium from the Gulf of Mexico. Mar. Biol. 154, 413–422. doi: 10.1007/s00227-008-0933-z
Burkhardt, S., Riebesell, U., and Zondervan, I. (1999). Effects of growth rate, CO2 concentration, and cell size on the stable carbon isotope fractionation in marine phytoplankton. Geochim. Cosmochim. Acta 63, 3729–3741. doi: 10.1016/S0016-7037(99)00217-3
Campbell, D. A., Cockshutt, A. M., and Porankiewicz-Asplund, J. (2003). Analysing photosynthetic complexes in uncharacterized species or mixed microalgal communities using global antibodies. Physiol. Plant. 119, 322–327. doi: 10.1034/j.1399-3054.2003.00175.x
Dortch, Q., Claytonm, J. R. Jr., Thoresen, S. S., and Ahmed, S. I. (1984). Species differences in accumulation of nitrogen pools in phytoplankton. Mar. Biol. 81, 237–250. doi: 10.1007/BF00393218
Falkowski, P., Fenchel, T., and Delong, E. (2008). The microbial engines that drive earth's biogeochemical cycles. Science 320, 1034–1039. doi: 10.1126/science.1153213
Pubmed Abstract | Pubmed Full Text | CrossRef Full Text | Google Scholar
Falkowski, P. G. (1981). Light-shade adaptation and assimilation numbers. J. Plankton Res. 3, 203–216. doi: 10.1093/plankt/3.2.203
Finkel, Z. (2001). Light absorption and size scaling of light limited metabolism in marine diatoms. Limnol. Oceanogr. 46, 86–94. doi: 10.4319/lo.2001.46.1.0086
Finkel, Z. V. (2007). “Does phytoplankton size matter? The evolution of modern marine food webs,” in Evolution of Primary Producers in the Sea, eds P. G. Falkowski and A. H. Knoll (Amsterdam; Boston: Elsevier Academic Press), 334–345.
Finkel, Z. V., Beardall, J., Flynn, K. J., Quigg, A., Rees, T. A. V., and Raven, J. A. (2010). Phytoplankton in a changing world: cell size and elemental stoichiometry. J. Plankton Res. 32, 119–137. doi: 10.1093/plankt/fbp098
Foster, R. A., Kuypers, M. M. M., Vagner, T., Paerl, R. W., Musat, N., and Zehr, J. P. (2011). Nitrogen fixation and transfer in open ocean diatom–cyanobacterial symbioses. ISME J. 5, 1484–1493. doi: 10.1038/ismej.2011.26
Pubmed Abstract | Pubmed Full Text | CrossRef Full Text | Google Scholar
Gao, K., and Campbell, D. A. (2014). Photophysiological responses of marine diatoms to elevated CO2 and decreased pH: a review. Funct. Plant Biol. 41, 449. doi: 10.1071/FP13247
Gao, K., Xu, J., Gao, G., Li, Y., Hutchins, D. A., Huang, B., et al. (2012). Rising CO2 and increased light exposure synergistically reduce marine primary productivity. Nat. Clim. Change 2, 519–523. doi: 10.1038/nclimate1507
Gavis, J. (1976). Munk and Riley revisited: nutrient diffusion transport and rates of phytoplankton growth. J. Mar. Res. 34, 161–179.
Giordano, M., Beardall, J., and Raven, J. A. (2005). CO2 CONCENTRATING MECHANISMS IN ALGAE: mechanisms, environmental modulation, and evolution. Annu. Rev. Plant Biol. 56, 99–131. doi: 10.1146/annurev.arplant.56.032604.144052
Pubmed Abstract | Pubmed Full Text | CrossRef Full Text | Google Scholar
Gotoh, E., Kobayashi, Y., and Tsuyama, M. (2010). The post-illumination chlorophyll fluorescence transient indicates the RuBP regeneration limitation of photosynthesis in low light in Arabidopsis. FEBS Lett. 584, 3061–3064. doi: 10.1016/j.febslet.2010.05.039
Pubmed Abstract | Pubmed Full Text | CrossRef Full Text | Google Scholar
Gruber, N., and Galloway, J. N. (2008). An Earth-system perspective of the global nitrogen cycle. Nature 451, 293–296. doi: 10.1038/nature06592
Pubmed Abstract | Pubmed Full Text | CrossRef Full Text | Google Scholar
Halsey, K. H., Milligan, A. J., and Behrenfeld, M. J. (2010). Physiological optimization underlies growth rate-independent chlorophyll-specific gross and net primary production. Photosynth. Res. 103, 125–137. doi: 10.1007/s11120-009-9526-z
Pubmed Abstract | Pubmed Full Text | CrossRef Full Text | Google Scholar
Halsey, K. H., O'Malley, R. T., Graff, J. R., Milligan, A. J., and Behrenfeld, M. J. (2013). A common partitioning strategy for photosynthetic products in evolutionarily distinct phytoplankton species. New Phytol. 198, 1030–1038. doi: 10.1111/nph.12209
Pubmed Abstract | Pubmed Full Text | CrossRef Full Text | Google Scholar
Hopkinson, B. M., Dupont, C. L., Allen, A. E., and Morel, F. M. M. (2011). Efficiency of the CO2-concentrating mechanism of diatoms. Proc. Natl. Acad. Sci. U.S.A. 108, 3830–3837. doi: 10.1073/pnas.1018062108
Pubmed Abstract | Pubmed Full Text | CrossRef Full Text | Google Scholar
Irwin, A. J., Finkel, Z. V., Schofield, O. M. E., and Falkowski, P. G. (2006). Scaling-up from nutrient physiology to the size-structure of phytoplankton communities. J. Plankton Res. 28, 459–471. doi: 10.1093/plankt/fbi148
Jeffrey, S., and Humphrey, G. (1975). New spectrophotometric equations for determining chlorophylls a1, b1, c1 and c2 in higher plants, algae and natural phytoplankton. Biochem. Physiol. Pflanz. 167, 191–194.
Key, T., McCarthy, A., Campbell, D. A., Six, C., Roy, S., and Finkel, Z. V. (2010). Cell size trade-offs govern light exploitation strategies in marine phytoplankton. Environ. Microbiol. 12, 95–104. doi: 10.1111/j.1462-2920.2009.02046.x
Pubmed Abstract | Pubmed Full Text | CrossRef Full Text | Google Scholar
Kirk, J. T. O. (1994). Light and Photosynthesis in Aquatic Ecosystems, 2nd Edn. Cambridge; New York, NY: Cambridge University Press.
Kolber, Z. S., Prášil, O., and Falkowski, P. G. (1998). Measurements of variable chlorophyll fluorescence using fast repetition rate techniques: defining methodology and experimental protocols. Biochim. Biophys. Acta 1367, 88–106. doi: 10.1016/S0005-2728(98)00135-2
Pubmed Abstract | Pubmed Full Text | CrossRef Full Text | Google Scholar
Kromkamp, J. C., Dijkman, N. A., Peene, J., Simis, S. G. H., and Gons, H. J. (2008). Estimating phytoplankton primary production in Lake IJsselmeer (The Netherlands) using variable fluorescence (PAM-FRRF) and C-uptake techniques. Eur. J. Phycol. 43, 327–344. doi: 10.1080/09670260802080895
Kroon, B. M. A., and Thoms, S. (2006). From electron to biomass: a mechanistic model to describe phytoplankton photosynthesis and steady-state growth rates. J. Phycol. 42, 593–609. doi: 10.1111/j.1529-8817.2006.00221.x
Laney, S. R. (2003). Assessing the error in photosynthetic properties determined with fast repetition rate fluorometry. Limnol. Oceanogr. 48, 2234–2242. doi: 10.4319/lo.2003.48.6.2234
Langer, G., Geisen, M., Baumann, K., Kläs, J., Riebesell, U., Thoms, S., et al. (2006). Species-specific responses of calcifying algae to changing seawater carbonate chemistry. Geochem. Geophys. Geosystems 7, 1–12. doi: 10.1029/2005GC001227
Lawrenz, E., Silsbe, G., Capuzzo, E., Ylöstalo, P., Forster, R. M., Simis, S. G. H., et al. (2013). Predicting the electron requirement for carbon fixation in seas and oceans. PLoS ONE 8:e58137. doi: 10.1371/journal.pone.0058137
Pubmed Abstract | Pubmed Full Text | CrossRef Full Text | Google Scholar
LeBlanc, K., Arstequ, J., Armand, L., Assmy, P., Beker, B., Bode, A., et al. (2012). A global diatom database—abundance, biovolume and biomass in the world ocean. Earth Syst. Sci. Data 4, 149–165. doi: 10.5194/essd-4-149-2012
Li, G., Brown, C. M., Jeans, J., Donaher, N., McCarthy, A., and Campbell, D. A. (2014). The Nitrogen costs of photosynthesis in a diatom under current and future pCO2. New Phytol. doi: 10.1111/nph.13037. [Epub ahead of print].
Pubmed Abstract | Pubmed Full Text | CrossRef Full Text | Google Scholar
Li, G., and Campbell, D. (2013). Rising CO2 Interacts with growth light and growth rate to alter Photosystem II photoinactivation of the coastal diatom Thalassiosira pseudonana. PLoS ONE 8:e55562. doi: 10.1371/journal.pone.0055562
Pubmed Abstract | Pubmed Full Text | CrossRef Full Text | Google Scholar
López-Sandoval, D., Rodríguez-Ramos, T., Cermeño, P., and Marañón, E. (2013). Exudation of organic carbon by marine phytoplankton: dependence on taxon and cell size. Mar. Ecol. Prog. Ser. 477, 53–60. doi: 10.3354/meps10174
Losh, J. L., Young, J. N., and Morel, F. M. M. (2013). Rubisco is a small fraction of total protein in marine phytoplankton. New Phytol. 198, 52–58. doi: 10.1111/nph.12143
Pubmed Abstract | Pubmed Full Text | CrossRef Full Text | Google Scholar
Marañón, E., Cermeño, P., López-Sandoval, D. C., Rodríguez-Ramos, T., Sobrino, C., Huete-Ortega, M., et al. (2013). Unimodal size scaling of phytoplankton growth and the size dependence of nutrient uptake and use. Ecol. Lett. 16, 371–379. doi: 10.1111/ele.12052
Pubmed Abstract | Pubmed Full Text | CrossRef Full Text | Google Scholar
Marañón, E., Cermeno, P., Rodriquez, J., Zubkov, M. V., and Harris, R. P. (2007). Scaling of phytoplankton photosynthesis and cell size in the ocean. Limnol. Oceanogr. 52, 2190–2198. doi: 10.4319/lo.2007.52.5.2190
McCarthy, A., Rogers, S. P., Duffy, S. J., and Campbell, D. A. (2012). Elevated carbon dioxide differentially alters the photophysiology of Thalassiosira pseudonana (Bacillariophyceae) and Emiliana huxleyi (Haptophyta). J. Phycol. 48, 635–646. doi: 10.1111/j.1529-8817.2012.01171.x
Mizohata, E., Matsumura, H., Okano, Y., Kumei, M., Takuma, H., Onodera, J., et al. (2002). Crystal structure of activated ribulose-1,5-bisphosphate carboxylase/oxygenase from green alga Chlamydomonas reinhardtii complexed with 2-carboxyarabinitol-1,5-bisphosphate. J. Mol. Biol. 316, 679–691. doi: 10.1006/jmbi.2001.5381
Pubmed Abstract | Pubmed Full Text | CrossRef Full Text | Google Scholar
Moore, C. M., Mills, M. M., Arrigo, K. R., Berman-Frank, I., Bopp, L., Boyd, P. W., et al. (2013). Processes and patterns of oceanic nutrient limitation. Nat. Geosci. 6, 701–710. doi: 10.1038/ngeo1765
Pubmed Abstract | Pubmed Full Text | CrossRef Full Text | Google Scholar
Morel, A., and Bricaud, A. (1981). Theoretical results concerning light absorption in a discrete medium, and application to specific absorption of phytoplankton. Deep Sea Res. Part Oceanogr. Res. Pap. 28, 1375–1393. doi: 10.1016/0198-0149(81)90039-X
Mott, K. A., Jensen, R. G., O'Leary, J. W., and Berry, J. A. (1984). Photosynthesis and Ribulose 1,5-bisphosphate concentrations in intact leaves of xanthium strumarium L. Plant Physiol. 76, 968–971.
Mullin, M. M., Sloan, P. R., and Eppley, R. W. (1966). Relationship between carbon content, cell volume and area in phytoplankton. Limnol. Oceanogr. 11, 307–310.
Nagao, R., Takahashi, S., Suzuki, T., Dohmae, N., Nakazato, K., and Tomo, T. (2013). Comparison of oligomeric states and polypeptide compositions of fucoxanthin chlorophyll a/c-binding protein complexes among various diatom species. Photosynth. Res. 117, 281–288. doi: 10.1007/s11120-013-9903-5
Pubmed Abstract | Pubmed Full Text | CrossRef Full Text | Google Scholar
Pasciak, W. J., and Gavis, J. (1974). Transport limitation of nutrient uptake in phytoplankton. Limnol. Ocean. 19, 881–888.
Pierrot, D., Lewis, E., and Wallace, D. W. R. (2006). MS Excel Program Developed for CO2 System Calculations. Oak Ridge, TN: ORNL/CDIAC-105a. Carbon Dioxide Information Analysis Center, Oak Ridge National Laboratory, U.S. Department of Energy. doi: 10.3334/CDIAC/otg.CO2SYS_XLS_CDIAC105a
Premvardhan, L., Robert, B., Beer, A., and Büchel, C. (2010). Pigment organization in fucoxanthin chlorophyll a/c2 proteins (FCP) based on resonance Raman spectroscopy and sequence analysis. Biochim. Biophys. Acta 1797, 1647–1656. doi: 10.1016/j.bbabio.2010.05.002
Pubmed Abstract | Pubmed Full Text | CrossRef Full Text | Google Scholar
Raven, J. A. (1984). A cost-benefit analysis of photon absorption by photosynthetic unicells. New Phytol. 98, 593–625.
Raven, J. A. (2013). Rubisco: still the most abundant protein of Earth? New Phytol. 198, 1–3. doi: 10.1111/nph.12197
Pubmed Abstract | Pubmed Full Text | CrossRef Full Text | Google Scholar
Raven, J. A., Beardall, J., and Giordano, M. (2014). Energy costs of carbon dioxide concentrating mechanisms in aquatic organisms. Photosynth. Res. 121, 111–124. doi: 10.1007/s11120-013-9962-7
Pubmed Abstract | Pubmed Full Text | CrossRef Full Text | Google Scholar
Raven, J. A., Giordano, M., Beardall, J., and Maberly, S. C. (2011). Algal and aquatic plant carbon concentrating mechanisms in relation to environmental change. Photosynth. Res. 109, 281–296. doi: 10.1007/s11120-011-9632-6
Pubmed Abstract | Pubmed Full Text | CrossRef Full Text | Google Scholar
Riebesell, U., Fabry, V. J., Hansson, L., and Gattuso, J.-P. (2010). Guide to Best Practices for Ocean Acidification Research and Data Reporting, eds U. Riebesell, V. J. Fabry, L. Hansson, and J.-P. Gattuso (Luxembourg: Publications Office of the European Union). Available online at: http://www.epoca-project.eu/index.php/guide-to-best-practices-for-ocean-acidification-research-and-data-reporting.html (Accessed October 24, 2014).
Rost, B., Zondervan, I., and Wolf-Gladrow, D. (2008). Sensitivity of phytoplankton to future changes in ocean carbonate chemistry: current knowledge, contradictions and research directions. Mar. Ecol. Prog. Ser. 373, 227–237. doi: 10.3354/meps07776
Schippers, P., Lürling, M., and Scheffer, M. (2004). Increase of atmospheric CO2 promotes phytoplankton productivity. Ecol. Lett. 7, 446–451. doi: 10.1111/j.1461-0248.2004.00597.x
Shi, T., and Falkowski, P. G. (2008). Genome evolution in cyanobacteria: the stable core and the variable shell. Proc. Natl. Acad. Sci. U.S.A. 105, 2510–2515. doi: 10.1073/pnas.0711165105
Pubmed Abstract | Pubmed Full Text | CrossRef Full Text | Google Scholar
Stolte, W., and Riegman, R. (1995). Effect of phytoplankton cell size on transient-state nitrate and ammonium uptake kinetics. Microbiology 141, 1221–1229. doi: 10.1099/13500872-141-5-1221
Suggett, D., MacIntyre, H., and Geider, R. (2004). Evaluation of biophysical and optical determinations of light absorption by photosystem II in phytoplankton. Limnol. Oceanogr. Methods 2, 316–332. doi: 10.4319/lom.2004.2.316
Suggett, D., MacIntyre, H., Kana, T., and Geider, R. (2009). Comparing electron transport with gas exchange: parameterising exchange rates between alternative photosynthetic currencies for eukaryotic phytoplankton. Aquat. Microb. Ecol. 56, 147–162. doi: 10.3354/ame01303
Tortell, P. D., and Morel, F. M. M. (2002). Sources of inorganic carbon for phytoplankton in the eastern subtropical and equatorial pacific ocean. Limnol. Oceanogr. 47, 1012–1022. doi: 10.4319/lo.2002.47.4.1012
Tortell, P. D., Rau, G. H., and Morel, F. M. M. (2000). Inorganic carbon acquisition in coastal Pacific phytoplankton communities. Limnol. Oceanogr. 45, 1485–1500. doi: 10.4319/lo.2000.45.7.1485
Trimborn, S., Brenneis, T., Sweet, E., and Rost, B. (2013). Sensitivity of Antarctic phytoplankton species to ocean acidification: growth, carbon acquisition, and species interaction. Limnol. Oceanogr. 58, 997–1007. doi: 10.4319/lo.2013.58.3.0997
Trimborn, S., Wolf-Gladrow, D., Richter, K.-U., and Rost, B. (2009). The effect of p CO2 on carbon acquisition and intracellular assimilation in four marine diatoms. J. Exp. Mar. Biol. Ecol. 376, 26–36. doi: 10.1016/j.jembe.2009.05.017
Umena, Y., Kawakami, K., Shen, J.-R., and Kamiya, N. (2011). Crystal structure of oxygen-evolving photosystem II at a resolution of 1.9?A. Nature 473, 55–60. doi: 10.1038/nature09913
Pubmed Abstract | Pubmed Full Text | CrossRef Full Text | Google Scholar
Venrick, E. L. (2002). Floral patterns in the California current system off southern California: 1990-1996. J. Mar. Res. 60, 171–189. doi: 10.1357/002224002762341294
Wu, Y., Campbell, D. A., Irwin, A. J., Suggett, D. J., and Finkel, Z. V. (2014). Ocean acidification enhances the growth rate of larger diatoms. Limnol. Oceanogr. 59, 1027–1034. doi: 10.4319/lo.4014.59.3.1027
Young, J. N., Goldman, J. A. L., Kranz, S. A., Tortell, P. D., and Morel, F. M. M. (2015). Slow carboxylation of Rubisco constrains the maximum rate of carbon fixation during Antarctic phytoplankton blooms. New Phytol. 205, 172–181. doi: 10.1111/nph.13021
Pubmed Abstract | Pubmed Full Text | CrossRef Full Text | Google Scholar
Young, J. N., Rickaby, R. E. M., Kapralov, M. V., and Filatov, D. A. (2012). Adaptive signals in algal Rubisco reveal a history of ancient atmospheric carbon dioxide. Philos. Trans. R. Soc. B Biol. Sci. 367, 483–492. doi: 10.1098/rstb.2011.0145
Pubmed Abstract | Pubmed Full Text | CrossRef Full Text | Google Scholar
Zehr, J. P., Carpenter, E. J., and Villareal, T. A. (2000). New perspectives on nitrogen-fixing microorganisms in tropical and subtropical oceans. Trends Microbiol. 8, 68–73. doi: 10.1016/S0966-842X(99)01670-4
Pubmed Abstract | Pubmed Full Text | CrossRef Full Text | Google Scholar
Keywords: Coscinodiscus, diatom, ocean acidification, photosynthesis, resource allocation, RUBISCO, size scaling, Thalassiosira
Citation: Wu Y, Jeans J, Suggett DJ, Finkel ZV and Campbell DA (2014) Large centric diatoms allocate more cellular nitrogen to photosynthesis to counter slower RUBISCO turnover rates. Front. Mar. Sci. 1:68. doi: 10.3389/fmars.2014.00068
Received: 17 September 2014; Accepted: 17 November 2014;
Published online: 09 December 2014.
Edited by:
Jacob Carstensen, Aarhus University, DenmarkReviewed by:
Kevin John Flynn, Swansea University, UKJeffrey William Krause, Dauphin Island Sea Lab, USA
Copyright © 2014 Wu, Jeans, Suggett, Finkel and Campbell. This is an open-access article distributed under the terms of the Creative Commons Attribution License (CC BY). The use, distribution or reproduction in other forums is permitted, provided the original author(s) or licensor are credited and that the original publication in this journal is cited, in accordance with accepted academic practice. No use, distribution or reproduction is permitted which does not comply with these terms.
*Correspondence: Douglas A. Campbell, Department of Biology, Mount Allison University, 63B York St., Sackville, NB E4L1G7, Canada e-mail:ZGNhbXBiZWxsQG10YS5jYQ==