 Lucy C. Woodall
 Laura F. Robinson2
 Alex D. Rogers
 Bhavani E. Narayanaswamy
 Gordon L. J. Paterson
- 1Department of Life Sciences, The Natural History Museum, London, UK
- 2School of Earth Sciences, University of Bristol, Bristol, UK
- 3Department of Zoology, University of Oxford, Oxford, UK
- 4The Scottish Association for Marine Science, Ecology Department, Scottish Marine Institute, Oban, UK
Marine litter is a global challenge that has recently received policymakers' attention, with new environmental targets in addition to changes to old legislation. There are no global estimates of benthic litter because of the scarcity of data and only patchy survey coverage. However, estimates of baseline abundance and composition of litter are vital in order to implement litter reduction policies and adequate monitoring schemes. Two large-scale surveys of submarine geomorphological features in the Indian and Atlantic Oceans reveal that litter was found at all locations, despite their remoteness. Litter abundance was patchy, but both surveyed oceans had sites of high litter density. There was a significant difference in the type of litter found in the two oceans, with the Indian Ocean sites being dominated by fishing gear, whereas the Atlantic Ocean sites displayed a greater mix of general refuse. This study suggests that seabed litter is ubiquitous on raised benthic features, such as seamounts. It also concludes that the pattern of accumulation and composition of the litter is determined by a complex range of factors both environmental and anthropogenic. We suggest that the tracing of fishing effort and gear type would be an important step to elucidate hotspots of litter abundance on seamounts, ridges and banks.
Introduction
Marine litter has been identified as a significant and growing global problem (UNEP, 2009; UNGA, 2012; GOC, 2014). Estimates suggest 6.4 million tons of litter enter the marine ecosystem annually (UNEP, 2009). Litter items, defined as; persistent, manufactured or processed solids that have been disposed of or abandoned, deliberately or unintentionally (UNEP, 2005), are present in all marine environments, including remote locations such as Antarctica (Barnes et al., 2009; Ivar Do Sol et al., 2011) and in the deep sea (Galgani et al., 2000; Ramirez-Llodra et al., 2011; Pham et al., 2014). However, the source and fate of marine litter is little understood (Derraik, 2002). Observations of litter have revealed direct impacts on megafauna through entanglement and ingestion, and on habitats through smothering, transporting alien species, and altering benthic community structure (Gregory, 2009). In addition, plastics can fragment to microplastics which also have potential impacts on the environment and biota, both physical and biochemical (Teuten et al., 2009; Andrady, 2011; Wright et al., 2013; Bakir et al., 2014).
A plethora of studies have reported on abundance and composition of debris in surface water and on beaches (e.g., Ryan et al., 2009). The deep sea, however, is logistically challenging and expensive to survey, therefore few studies have been conducted. Most of these have concentrated on small areas of the seabed, mostly on the continental shelf (Ramirez-Llodra et al., 2013), but there are a few studies that have reported deep-sea litter in more extreme locations e.g., the Ryukyu Trench; [7216 m depth (Miyake et al., 2011)], Molloy Hole; [up to 5500 m; (Galgani and Lecornu, 2004)], and Kuril-Kamchatka Trench (Fischer et al., 2015) and have assessed trends in litter composition and abundance (Bergmann and Klages, 2012; Schlining et al., 2013). To date, records have shown that deep-sea litter is not evenly distributed, with environmental and anthropogenic factors both influencing litter abundance (Schlining et al., 2013; Pham et al., 2014). More specifically, near-shore canyons may accumulate more litter than expected (Pham et al., 2014), and some regions of these canyons can have greater litter abundance than others e.g., more rugose parts of the Monterey Canyon had greater litter densities (Schlining et al., 2013), and thus marine litter assessments may have underestimated the true figure.
The main constituent of beach, seabed and surface water litter is plastic (Derraik, 2002). This is because it has a low degeneration and degradation rate, and production has increased annually since the 1950's (Thompson et al., 2009). Studies suggest litter items arrive in the deep sea from the shore, offshore installations, shipping and fisheries activities (Pham et al., 2014). The proportional contribution of different litter sources is likely to result from the complex interactions of oceanographic processes, geography and local anthropogenic activity (Ramirez-Llodra et al., 2013). Some submarine features are disproportionately affected by some types of litter. For example, in Europe, fishing gear contributes over 70% of the litter found on seamounts, banks and mounds and is also the greatest constituent of litter found in one ocean ridge study (Pham et al., 2014). This large contribution of fishing gear is not unexpected as, seamounts and other geomorphological features are often a focus for fisheries (Clark and Koslow, 2007).
To date, there have been no studies, using a consistent methodology, that survey multiple seamounts or other submarine features within the same ocean basin. The objective of this study was 3-fold; (1) to determine the amount and composition of litter on remote Atlantic Ocean and south-west Indian Ocean submarine features (seamounts, banks and a ridge), and to compare litter within and between the regions; (2) to infer the relative importance of geographical, geomorphological, biological and anthropogenic factors on the patterns of litter abundance and composition (e.g., distance from land, benthic rugosity, and shipping activity) and (3) to discuss results in the context of current legislation.
Materials and Methods
Study Areas
Data were collected during two research cruises aboard R.R.S. James Cook during 2011 and 2013. During each cruise, 16 remotely operated vehicle (ROV) dives were conducted. Submarine features (seamounts and banks) along the south-west Indian Ocean ridge were observed during JC66 using the ROV Kiel 6000. Later, an east-west transect of the equatorial Atlantic Ocean was conducted as part of JC94, observing seamounts and a fracture zone area using the ROV ISIS. Ten submarine features were surveyed in total, five on each cruise (Table 1 and Figure 1).
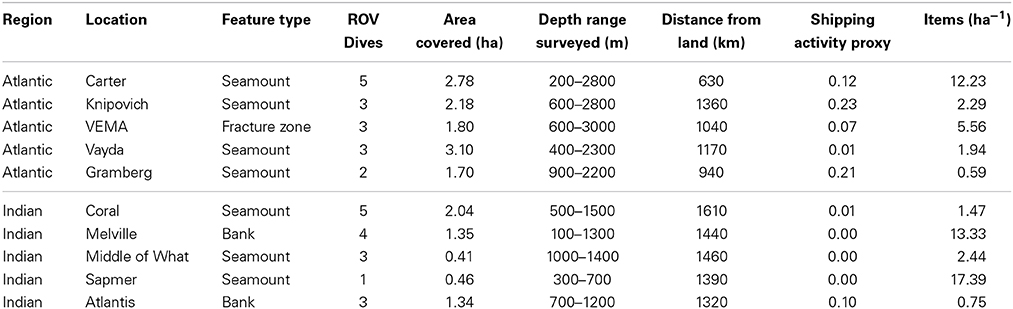
Table 1. Sampling data including geomorphological feature surveyed, number of remotely operated vehicle (ROV) dives, area of ROV survey, depth range surveyed, distance from land, shipping activity proxy and litter abundance.
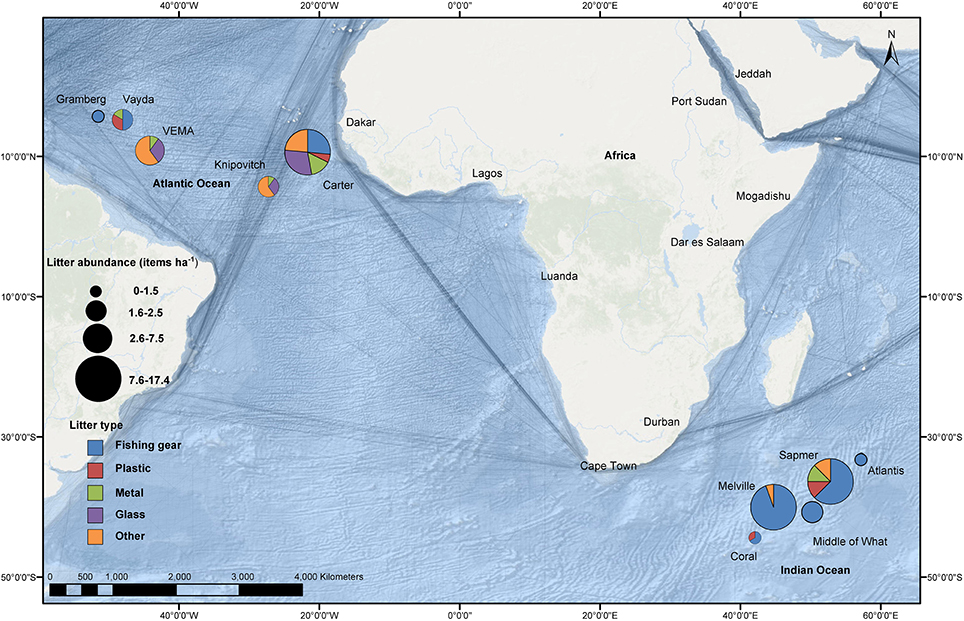
Figure 1. Survey locations benthic litter densities (items ha−1) and composition for individual submarine features observed by remotely operated vehicle video systems. Commercial shipping activity is overlaid with the darkest lines representing areas with greatest shipping activity (Halpern et al., 2008).
All submarine topographic features had different morphologies (Rogers and Taylor, 2012; Hoy et al., 2014), with different slope pitch and summit area. The ROV dives surveyed features of 200–3000 m and 100–1500 m depth for the Atlantic Ocean and Indian Ocean, respectively. The benthic profile was detected using the ship-mounted multibeam echo sounder (EM-120, Kongsberg-Simrad), was processed in CARIS, HIPS, and SIPS (http://www.caris.com/products/hips-sips), and 200 m depth contours added in ArcMap. All the features surveyed were over 600 km from land and most were more than 1000 km away (Table 1).
Data Recording
The primary purposes of the ROV dive transects were to video benthic habitat and sample specific megafauna. Dives always started at depth and progressed to shallower water. Typically three dives were performed on each submarine feature, but this varied from five to one (Table 1). ROV geographic position and depth were recorded using Ocean Floor Observation Protocol (OFOP) software (Huetten and Grienert, 2008). Both ROVs were fitted with parallel scaling lasers to calibrate target size; and an average field of view was worked out for each dive (2 m).
Video Analysis
Video transects from the main color HD camera were played in real-time through Video Annotation and Reference System software (VARS; Schlining and Jacobsen Stout, 2006), which recorded time, geographic location and depth when the observer noted a litter item. All videos were watched twice by the same observer to ensure no objects were missed. The other HD video recordings (downward looking and pan and tilt) were used when possible to confirm the identity of litter items. In addition, the OFOP observer text, made onboard ship during the ROV dives, was queried for annotations that may relate to marine litter such as “trash,” “anthropogenic,” “fishing,” and “plastic” and the video footage was checked. Litter items (Figure 2) were placed into five broad categories which included: “fishing gear,” “plastic,” “metal,” “glass” or “other.” Unidentified objects, as well as those made from material that were not plastic, metal or glass, were classified as “other” (Table S1). The fishing gear was mainly made from plastic, but the separate designation of “fishing gear” was retained to ensure that the source of these items was recorded in order to determine if there was any correlation between litter type and habitat, this also follows other studies (Miyake et al., 2011; Schlining et al., 2013; Pham et al., 2014). Any debris items that were attached to each other were classed as one item for analysis, as they would have resulted from one littering episode.
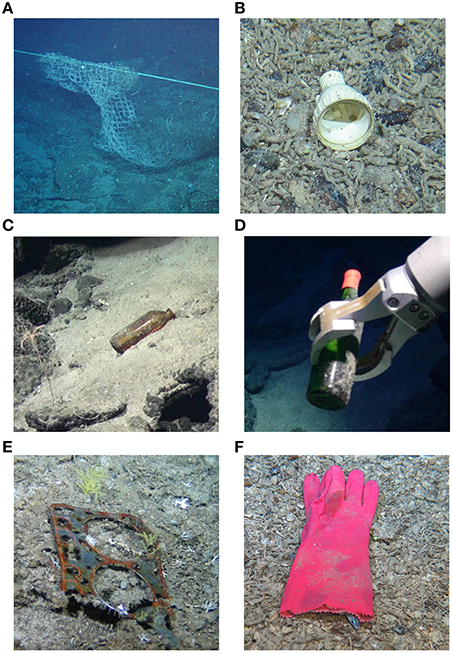
Figure 2. Six examples of benthic litter items observed during surveys in the Atlantic Ocean and Indian Ocean: (A) fishing gear from the Indian Ocean; (B) plastic object, possible plumbing item from the Indian Ocean; (C) glass bottle from the Atlantic Ocean; (D) glass bottle from the Atlantic Ocean; (E) engine head gasket, categorized as “other” from the Indian Ocean (F) work glove, categorized as “other” from the Atlantic Ocean.
In the absence of a standardized reporting system, the coverage extent of the litter item on the benthos was recorded using two parameters, shape and size. For the first of these, shape, items were classified as either elongate or oblate; for example rope was classified as elongate and bottles as oblate. Objects were grouped by size into four categories that increase by an order of magnitude <20 cm, 20 cm–2 m, 2 m–20 m, and >20 m for the elongate objects, and <10 cm2, 10 cm2–1 m2, 1 m2–10 m2 and >10 m2 for oblate objects. These size categories were chosen to make the measurement simple, using the width between the two lasers (10 cm) and average field of view during the dives (2 m). The impact of the item was then represented by size category with litter type subdivided into either elongate or oblate. When both elongate and oblate items were present e.g., fishing nets (net and the top and bottom ropes), both types of impact were reported separately. Finally any interactions of litter with benthic fauna were recorded, be they through entanglement or use of the litter as substratum.
Spatial Analysis
Litter location was plotted using ArcGIS v10.2 (ERSI, 2014) together with bathymetry and ROV bottom tracks. ROV bottom tracks were smoothed in OFOP and obvious erroneous points corrected by eye. The area surveyed was calculated using ROV bottom track and the average field of view. The depth at which the litter items were found was converted to either “summit” or “flank.” Summit was used when the depth was within the shallowest 15% of the submarine feature; otherwise it was categorized as flank. This broad categorization was chosen over absolute depth as the summits of the submarine features varied, with those in the Atlantic Ocean being deeper than those in the Indian Ocean. The areas surveyed were then recalculated to include percentage of the survey areas in summit and flank regions, respectively.
To calculate rugosity, bathymetry raster files for the 10 surveyed features were combined in ArcGIS, using the “mosaic to raster” function. Rugosity was then determined using the terrain ruggedness feature in the Benthic Terrain Modeler (BTM) extension set at five (Wright et al., 2012). This measure of rugosity relies on the resolution of the bathymetry survey and thus the rugosity had 50 and 100 m resolution of both the Indian and Atlantic Oceans, respectively. This rugosity was then assigned to six categories (0–0.9, 1–1.9, 2–2.9, 3–3.9, 4–4.9, 5+). The habitat where the litter was found was used as a proxy for rugosity at finer resolution. The habitat was assigned to one of five categories that increased in rugosity from sand/silt flat areas, to deep rock crags (Figure S1).
Commercial shipping activity was calculated using a proxy derived from the World Meteorological Organization Voluntary Observing Ships Scheme data Oct 2004–Oct 2005 with 1 km resolution (Halpern et al., 2008). At each submarine feature, the mean shipping activity proxy was calculated from the values of the closest 4 km2. The index runs from 0 to 0.68, zero was recorded when no ships passed through the selected 4 km2 region during the reporting year, and 0.68 indicates a busy shipping lane such as the Gibraltar or Dover straits.
Data Analysis
Abundance of litter was calculated for each seamount per hectare surveyed (items ha−1). Non-parametric tests were applied as data were not normally distributed (Ryan-Joiner, p < 0.05), but variances were not significantly different (Levene's test p > 0.05). Litter patchiness was computed using Lloyd's index implemented in Passage v2, where n > 1 means aggregation (Lloyd, 1967). Data were analyzed in Minitab v17 using the Mann-Whitney tests when comparing differences in litter abundance between two categories (i.e., oceans), Kruskal-Wallis tests when comparing litter abundance between more than two categories (i.e., seamounts) and Spearman's Rank order was used to assess correlation. Multivariate analysis (Analysis of similarity, ANOSIM) was conducted in PRIMER v6.0 (Clark and Gorley, 2006), using Bray Curtis similarity of litter composition following a log(x − 1) transformation of the data to elucidate the relationships between litter type abundance and the other parameters such as shipping activity and distance from land.
Results
Litter Abundance and Ubiquity
Litter was found on every one of the 10 submarine features surveyed in the Indian and Atlantic Oceans. A total of 56 items were found in the Atlantic Ocean over a survey area of 11.6 ha, and 31 items in the Indian Ocean over 5.6 ha (Figure 1). Litter was present in depths ranging from 209 to 2318 m in the Atlantic Ocean, and 112–1278 m in the Indian Ocean. The differences in the depth at which litter was observed reflected the bathymetry of the features surveyed (Table 1). In the Indian Ocean litter items, of all size categories, were seen for both shape categories (elongate and oblate), whereas the litter from the Atlantic Ocean was just from the smallest three size categories for both shape types. The greatest amount of litter was found on Sapmer Seamount in the Indian Ocean (17.39 items ha−1), and the least (0.59 items ha−1) on Gramberg Seamount in the Atlantic Ocean. It was not possible to compare litter between different types of topographic features, i.e., bank, ridge, seamount, as the sample size was too small.
There was great variation in the abundance of items between submarine features within the same ocean, with one seamount, Carter, in the Atlantic Ocean and two features (Melville and Sapmer) in the Indian Ocean having a high density of litter (12.23–17.39 items ha−1), while the rest of the sites had much lower densities (0.59–5.56 items ha−1). The mean litter abundance was greatest in the Indian Ocean, but the oceans had similar variance (Atlantic: 4.52 items ha−1 SE ± 2.09; Indian: 7.07 items ha−1 SE ± 3.45) (Table 1). However, the litter had a patchy distribution across all locations (P = 3.4) according to Lloyd's index.
There was no significant difference between the number of items ha−1 found in each ocean (Mann-Whitney: W = 25.0, η1 = −15.1 η2 = 9.8, p = 0.8). There was also no significant difference between the amount of litter observed on flanks compared with summits of the topographic features (W = 6, η1 = −8.0 η2 = −29.0 p = 0.7). But because of sample size it was not possible to compare litter abundance between types of submarine features.
Rugosity, as calculated by BTM and habitat both negatively correlate with litter abundance [BTM: ρ = −0.9, p < 0.01; habitat: ρ = −1.0, p < 0.01]. Most litter items were found in areas with the flattest rugosity ratings (77% Atlantic Ocean, 69% Indian Ocean). In addition we explored the data to determine if there was correlation of litter abundance with distance from land and shipping activity, however, probably because of the low level of replication these test results were not significant and are not presented.
Litter Type
The relative litter composition of the two oceans was significantly different [1-way ANOSIM R = 0.242, p < 0.05]; litter in the Indian Ocean was dominated by fishing gear (84%) whereas in the Atlantic Ocean, the litter was a mix of fishing gear, glass and other debris, each comprising about 25% of the total litter, with metal and plastic objects making up the final quarter (Figure 3). Objects classed as “other items” in the Atlantic Ocean were as diverse as a pottery urn and machinery gaskets. In the Indian Ocean, this category also included gaskets as well as a work glove. Fishing gear was seen at the most number of different sites, with all locations in the Indian Ocean and three of the five sites in the Atlantic Ocean having at least one occurrence. Plastic items were only seen in two sites in each ocean (Carter and Vayda - Atlantic Ocean; Coral and Sapmer - Indian Ocean) and were of low abundance. The pattern of plastic litter distribution differed from that of glass debris which was seen at three Atlantic sites and was highly abundant at one site (Carter), but less so at the other two (Knipovitch, VEMA) (Figure 1).
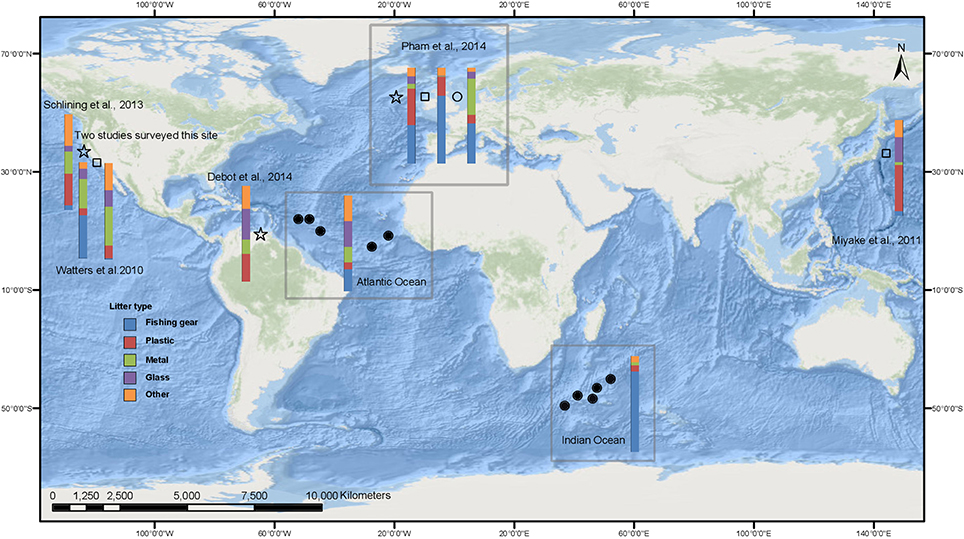
Figure 3. Composition of benthic litter estimated from seabed observations. Circles represent studies on raised features such as seamounts, stars represent canyon studies and other topography is represented by a square. Filled symbols are the summary data from the current study and labeled Indian and Atlantic Ocean. Open symbols are data from previous studies and references are given. Watters et al. (2010) data is given for two areas along the California coast. European data, reviewed by Pham et al. (2014) is summarized for the three physiographic types.
Multivariate analyses were not successful in elucidating patterns of correlation as a result of the small sample sizes at some sites. The litter was reanalyzed by re-categorizing it as fishing gear or non-fishing litter. Subsequent analyses were conducted to determine correlation between distance from shore, shipping activity, depth category and rugosity; the only significant relationship was a negative one between fishing gear items and shipping activity [Spearman's rank order ρ −0.72, p < 0.05].
Litter Coverage Extent
There was a significant difference in the coverage extent of the litter items between oceans and between areas according to their shipping activity [1-way ANOSIM Ocean R = 0.27, P < 0.01; Shipping activity R = 0.95 p < 0.01], but not between seamounts or distance from shore. SIMPER analysis showed that the difference between the oceans was mainly driven by the dissimilarity between the coverage extent of fishing gear (elongate 33.7% and oblate 20.2%).
When this litter coverage extent was re-categorized as either fishing gear or non-fishing litter, there was no significant correlation between litter coverage extent and rugosity calculated by habitat, however, there is a significant negative correlation between coverage extent of litter and habitat calculated by BTM [Spearman's rank-order ρ = −0.94, p < 0.01].
Associated Organisms
Very few faunal associations were seen, with most being associated with items from the Indian Ocean. Encrusting organisms were observed on 18% of litter items, all of which were fishing gear, these items were often entirely covered and heavily encrusted (Figure 2A). The identification of associated taxa was difficult as most litter items were not brought up to the surface, and often the ROV was unable to get close to fishing gear for operational and safety reasons. However, where identification was possible, coral and hydroids were seen encrusting the gear, whilst fish, crinoids, anemones, sea urchins, and brittle stars were seen using the items as habitat. Entanglement was obvious in four fishing gear items; two of these were also encrusted. These entangled organisms comprised the broadest range of taxa, including coral, sponge, fish and crustacea. Finally, a further three items were used as substrata for organisms to hide under (Figure 2F), to lay eggs on, or to use as a holdfast.
Discussion
Distribution and Abundance
The most notable finding of this study is that litter was found at all deep-sea sites surveyed. The ubiquity of the litter on seamounts, banks and ridges has previously not been as explicit because the features were focused on individually. Litter abundance on these submarine features was patchy, with high and low densities of litter reported within each ocean. However, all litter abundances were within those previously reported in the North Atlantic Ocean for seamounts, banks, mounds and ridges (Pham et al., 2014) and for coastal waters (Galgani et al., 2000; Mifsud et al., 2013), but greater than that previously observed in more remote locations (Antarctic Peninsula and Scotia Arc; Barnes et al., 2009). Different methodologies, including sampling techniques, may account for some of the differences observed, as Barnes et al. (2009) collected data by trawl rather than video systems such as employed in this current study, but could also reflect the more remote areas surveyed by Barnes et al. (2009). This current study highlights the extent of the unseen and thus unreported litter in the oceans.
The surveyed area on each geomorphic feature was limited. This is common in the deep-sea, even when a region is well-studied e.g., Monterey Bay (Schlining et al., 2013). Even though this current study sampled multiple sites, the survey area for each separate feature was within the range that others had reported (0.9–5.6 ha) (Pham et al., 2014); with the exception of two seamounts in the Indian Ocean (Middle of What; Sapmer) which were slightly less, as a result of operational limitations. Deep-sea benthic studies are more time consuming, logistically challenging and expensive than surface water or beach surveys and therefore suffer with a paucity of data (Barnes et al., 2009; Ramirez-Llodra et al., 2011). This current study will have under-reported the litter density, as very small items were not visible with our video system and we chose to class items attached to each other as one item. Sampling for smaller items would have required additional sampling methodologies, e.g., coring or trawling. Indeed much smaller plastic “microplastics (<0.5 cm)” are known to exist in deep-sea sediments, including from some of the same sites as the present study, in greater densities to those found in beach and coastal sediments (Woodall et al., 2014) and therefore this small-size fraction may be an important constituent of marine litter.
To extrapolate our data to provide global estimates of litter on seamounts is challenging, as we only surveyed <1% of each submarine feature, the depth ranges we surveyed are not typical of seamounts generally, and we focused on remote locations. However, we have extrapolated from existing data (Yesson et al., 2011) on non-overlapping seamounts that are within 500 km of our study locations and that have similar depths (summits > 3000 m). We estimate that over 32 million and 38 million litter items are present on the seamounts of the Atlantic and south-west Indian Oceans, respectively. These figures are derived from the mean abundance (2.15 items ha−1) when the three outlier sites with greatest abundance are removed, and using the seamount data of Yesson et al. (2011). The areas on which this extrapolation is based are about 10% of the seamount area calculated for the FAO regions that contain the areas of interest in our study (Yesson et al., 2011). These extrapolations take account of all data currently available, however, this dataset comes from a very small area compared with the size of the ocean and so our estimates should be used as a guide. Specifically we show that the accumulation of litter on the seabed is patchy, therefore further surveys are required to confirm the average litter abundance on the ocean floor. In addition we have not taken into account the impact of tides, currents and the morphology of the topographic features. Future studies to model the desposition and accumulation of litter would be an important contribution to this field of study, but paucity of data currently prevents this analysis.
Previous studies reveal that certain geomorphological features accumulate more litter than others, with canyons having the highest litter loads (Galgani et al., 2000; Wei et al., 2012; Ramirez-Llodra et al., 2013; Pham et al., 2014, Figure 3). These studies suggest hydrodynamic effects act to cause the canyons to function as conduits for the litter. No data on hydrodynamics at depth is available for the areas surveyed in this latest study, and neither the environmental (distance from shore) nor the anthropogenic (shipping index) parameters were good predictors of the density of litter observed or the depth region where litter occurred. However, a decreased rugosity did result in greater litter abundance. This was in contrast to other studies which suggested that distance from land (Barnes et al., 2009; Pham et al., 2014) correlated with a decreasing abundance of litter, and increased rugosity correlated with more litter (Schlining et al., 2013). The correlation with distance seen in other studies could result from the fact that the majority of these studies were carried out close to land, so the decrease in debris could result from the decreasing component of the land as a litter source. In contrast, there was no evidence that land-based litter contributed to the abundances seen in the current study. The difference in the apparent influence of rugosity could be an artifact of low sample size or indeed sampling, because over flatter terrain it is easier to pilot the ROV, giving better quality video footage and so making any litter easier to see. Also in rugged terrain, turbulence may increase and change local hydrodynamics which could, in turn, lead to the patchy accumulation of litter not seen so much in flatter areas.
The survey sites in this study were outside the subtropical gyres which accumulate surface litter (Moore et al., 2001). A previous study reported floating small sized plastic concentrations were low close to some of our survey sites, compared with other ocean locations (Cozar et al., 2014). However, it is not possible to directly compare the abundance as there were very few sightings (6/442) within 500 km of our survey sites and they were reported by weight rather than by number which is our chosen method of reporting. In addition, models predict little floating litter at all sites (Lebreton et al., 2012; Fischer et al., 2015), although the patchiness of surface plastics has been shown (Goldstein et al., 2013). Current evidence suggests that the sites surveyed in this study were not in areas that have high litter accumulation, and thus we could conclude that the abundance seen here are unlikely to be the greatest present on deep-sea seamounts, especially considering the distance from shore. However, without further observations of the seabed, it is hard to predict if benthic litter reflects the patterns of abundance of surface litter. The processes involved in the transportation of litter items from the source to the seabed are poorly known, but must rely on factors including sinking velocity and litter degradation rate. Litter deposition is also likely to be affected by the direction and speed of the circulation of water masses that differ depending on depth and geographic location (Emery and Meincke, 1986). Surface litter accumulations are driven by oceanographic processes and winds (Moore, 2008; Eriksen et al., 2014) and at a regional level highest abundances correspond with high population density (Cozar et al., 2014). Once at depth, benthic litter density is affected by geomorphology (Pham et al., 2014), distance to the coast (Mordecai et al., 2011), hydrology (Galgani et al., 1996), and anthropogenic activities (Bergmann and Klages, 2012; Ramirez-Llodra et al., 2013). It is therefore unlikely that surface litter accumulation is a good predictor of benthic litter deposition. It would be valuable to constrain relationships between the two as benthic litter is more logistically challenging to record than surface litter. Outside the NE Atlantic very few litter estimates from video capture are available (Figure 3) and remote sensing technologies that can be used for surface litter (Mace, 2012) are not applicable to sea bed studies. Observations of benthic litter therefore remain an expensive and time-consuming proposition for just one research proposal. However, a coordinated international program that could utilize all global video footage, and analysis by citizen scientists through crowd-sourcing, could be ideal mechanisms to address this important question.
Type and Impact of Litter
A clear difference in the composition of the litter items was found between the two oceans surveyed (Figure 3). Fishing gear, the predominant litter type on Indian Ocean submarine features, is also the most abundant litter type on seamounts and other deep-sea features in European waters (Pham et al., 2014), in canyon shelf locations in central Califonia (Watters et al., 2010) and similarly from seabed trawl data in the East China Sea and southern Yellow Sea (Lee et al., 2006). The Atlantic Ocean, on the other hand, displayed a predominance of general litter items specifically associated with food packaging. General litter (i.e., plastic and glass) was also the most common in other deep-sea litter studies focusing on the abyssal plain and canyons, although many of these sites were only surveyed with trawls (Galgani et al., 1996; Koutsodendris et al., 2008; Barnes et al., 2009; Keller et al., 2010; Miyake et al., 2011; Mordecai et al., 2011; Ramirez-Llodra et al., 2011; Bergmann and Klages, 2012; Schlining et al., 2013; Debrot et al., 2014). The difference in litter composition between the two oceans reflects local anthropogenic activity. Seamounts are targeted by fisheries as they are highly productive areas (Clark and Koslow, 2007). The Indian Ocean features were in waters rarely used by shipping, but have been exploited by fisheries since the 1970's (Clark, 2009), however, the Atlantic Ocean survey sites were mainly situated in waters that experience heavier shipping traffic (Halpern et al., 2008). Indeed the difference in litter impact between the two oceans is driven by the large areas covered by fishing gear in the Indian Ocean as opposed to the elongate aspect of the fishing gear seen in the Atlantic Ocean. This highlights the importance of recording not just presence of litter items, but size and shape as well. Just shipping activity had a significant relationship to litter type and litter coverage extent: fishing gear showed negative correlation with the shipping activity index. It is not currently possible to determine fishing effort for the survey areas, but in the future, data may become available through the use of satellite tracking of vessels through Vessel Monitoring Systems (VMS), Automated Identification Systems (AIS) combined with data from other sensors such as Synthetic Aperture Radar (SAR). The record of fishing effort, including the different gear and technology used, is important to fully understand the patterns of litter composition driven by these industries. The difference in litter abundance within the Indian Ocean may be explained by the Indian Ocean Voluntary Benthic Protected Areas (VBPA) which were established in 2006 (Shotton, 2006) and include the survey sites on Coral Seamount and Atlantis Bank. These were the two sites with the lowest litter abundance in that ocean but this may be coincidental. This illustrates that litter monitoring may provide an opportunity to identify historical fishing activities. The negative correlation of broad habitat rugosity and greatest fishing gear impact found in this study may indicate that vessels are actively avoiding the more rugged areas that are most likely to catch gear. If active avoidance of these areas is practiced, then the technology and gear available on vessels is important to estimate hotspots of litter impact.
In this study few associations between litter and organisms were recorded as (1) most litter was not sampled by the ROV and therefore small encrusting organisms were not seen, and (2) because of the challenges of navigating the ROV close to litter in the most rugged terrain, especially when loose fishing gear was present. However, the variety of taxa, either encrusting or entangled in fishing gear, was diverse and congruent with previous studies (Laist, 1997). Entanglement was present in three forms, simple, benthic scraping and ghost fishing. The simple entanglement of linear fishing gear around coral colonies was evident in both this study and in Pham et al. (2013). Benthic scraping is the abrasion of the seabed by fishing gear, resulting in the accumulation of reef-building coral and other taxa in the gear (Anderson and Clark, 2003; Chiappone et al., 2005). Ghost fishing, is when gear continues to catch organisms despite it no longer being monitored by fishers. This includes self-baiting, which is where caught organisms then become bait for subsequent scavengers which then also become entangled. The self-baiting phenomenon was evident and was at least partly responsible for the change in composition over time of organisms entrapped in ghost fishing gear in previous temporal studies (Kaiser et al., 1996; Arthur et al., 2014). The ultimate impact of such gear is hard to determine, but is fast becoming a research priority (Gilman et al., 2013).
Conclusion
There are few legal instruments that regulate waste being dumped at sea. Commercial shipping dumping is regulated by the London Protocol and the recently revised International Convention for the Prevention of Pollution from Ships (MARPOL 73/78), Annex V, and particular regions are covered by specific agreements (NE Atlantic; OSPAR Convention) and reviewed by UNEP (2005). However, legislation is not a panacea for positive change as fishing gear debris rates did not fall when MARPOL was initially implemented in 1989 (Henderson, 2001). This is most likely since some fishing vessels, because of their relatively small size (<400 gross tons), are not covered by MARPOL regulations and policing legislation in the high seas is extremely challenging. The accumulation of fishing gear debris can be attributed to accidental loss as well as deliberate dumping of old and damaged nets. Accidental loss is likely to depend on fishing effort and rugosity of the region, therefore VPBAs, such as those in the southern Indian Ocean, may help. In addition, local schemes such as the “Fishing for litter” initiative (OSPAR, 2007), and port reception facilities for spent fishing gear, may help to reduce gear on the seabed and provide data on location and type. Global and regional programs of marine debris monitoring and litter reduction policies are being implemented (UNEP global initiative on marine litter; UNEP, 2009; Marine Strategy Framework Directive; Galgani et al., 2013). However, with most seamounts, mounds, banks and ridges being by nature out of these jurisdictions, and with litter on these features coming from marine sources, such programs and schemes are unlikely to provide a comprehensive solution to the deep-sea litter challenge. The International Seabed Authority set up to implement UNCLOS beyond the EEZ is focused on regulation of natural resources and currently does not have a policy on marine litter. Thus, novel initiatives will need to be implemented to cut further deposition of debris.
Strandline litter and accumulation of debris in surface water are well-reported in the media, and citizens actively monitor and lobby about these issues. The issue of the un-seen benthic litter has recently attracted more attention (Galgani et al., 2000; Barnes et al., 2009; Mifsud et al., 2013; Schlining et al., 2013; Pham et al., 2014; Woodall et al., 2014). This current study is the first of its kind to assess litter on numerous deep-sea raised topological features, using the same techniques including the same observer, in two oceans with different local anthropogenic activities. The results from this study agree with previous reports that show benthic litter is ubiquitous in the ocean. The abundance and composition of the litter seen in this study appears to be strongly influenced by local marine-based anthropogenic activity. The intensity of these activities may be useful as predictors of benthic litter density and composition in high-seas regions where ground-truthed data is sparse (or vice versa), but this should be tested when such data from the shipping and fishing industries becomes available.
Conflict of Interest Statement
The authors declare that the research was conducted in the absence of any commercial or financial relationships that could be construed as a potential conflict of interest.
Acknowledgments
This work was funded by NERC grant NE/F005504/1, ERC grant 278705 and the Philip Leverhulme Trust. We would like to thank participants of JC66 and JC94, especially E. Muller, S. Hoy, and V. Huvenne for bathymetry data, L. Marsh, M. Taylor, N. Serpetti, and M. Packer for their support at sea and the ROV teams and captain and crew of the R.R.S. James Cook for their assistance.
Supplementary Material
The Supplementary Material for this article can be found online at: http://www.frontiersin.org/journal/10.3389/fmars.2015.00003/abstract
Figure S1. Photographs of habitat categories increasing from smooth (A) to most rugose (E).
References
Anderson, O. F., and Clark, M. R. (2003). Analysis of bycatch in the fishery for orange roughy, Hoplostethus atlanticus, on the South Tasman Rise. Mar. Freshwater Res. 54, 643–652. doi: 10.1071/MF02163
Andrady, A. L. (2011). Microplastics in the marine environment. Mar. Pollut. Bull. 62, 1596–1605. doi: 10.1016/j.marpolbul.2011.05.030
Pubmed Abstract | Pubmed Full Text | CrossRef Full Text | Google Scholar
Arthur, C., Sutton-Grier, A. E., Murphy, P., and Bamford, H. (2014). Out of sight but not out of mind: harmful effects of derelict traps in selected U.S. coastal waters. Mar. Pollut. Bull. 86, 19–28. doi: 10.1016/j.marpolbul.2014.06.050
Pubmed Abstract | Pubmed Full Text | CrossRef Full Text | Google Scholar
Bakir, A., Rowland, S. J., and Thompson, R. C. (2014). Enhanced desorption of persistent organic pollutants from microplastics under simulated physiological conditions. Environ. Pollut. 185, 16–23. doi: 10.1016/j.envpol.2013.10.007
Pubmed Abstract | Pubmed Full Text | CrossRef Full Text | Google Scholar
Barnes, D. K., Galgani, F., Thompson, R. C., and Barlaz, M. (2009). Accumulation and fragmentation of plastic debris in global environments. Philos. Trans. R. Soc. Lond. B. Biol. Sci. 364, 1985–1998. doi: 10.1098/rstb.2008.0205
Pubmed Abstract | Pubmed Full Text | CrossRef Full Text | Google Scholar
Bergmann, M., and Klages, M. (2012). Increase of litter at the Arctic deep-sea observatory HAUSGARTEN. Mar. Pollut. Bull. 64, 2734–2741. doi: 10.1016/j.marpolbul.2012.09.018
Pubmed Abstract | Pubmed Full Text | CrossRef Full Text | Google Scholar
Chiappone, M., Dienes, H., Swanson, D. W., and Miller, S. L. (2005). Impacts of lost fishing gear on coral reef sessile invertebrates in the Florida Keys National Marine Sanctuary. Biol. Conserv. 121, 221–230. doi: 10.1016/j.biocon.2004.04.023
Clark, K. R., and Gorley, R. N. (2006). Plymouth Routines in Mulitvariate Ecological Research – PRIMER v6. (Plymouth: PRIMER–E).
Clark, M. R. (2009). Deep-sea seamount fisheries: a review of global status and future prospects. Lat. Am. J. Aquat. Res. 37, 501–512. doi: 10.3856/vol37-issue3-fulltext-x
Clark, M. R., and Koslow, J. A. (2007). “Impacts of fisheries on seamounts,” in Seamounts: Ecology, Fisheries & Conservation, eds T. J. Pitcher, T. Morato, P. J. B. Hart, M. R. Clark, N. Haggan, and R. S. Santos (Oxford: Blackwell Publising), 413–441. doi: 10.1002/9780470691953.ch19
Cozar, A., Echevarria, F., Gonzalez-Gordillo, J. I., Irigoien, X., Ubeda, B., Hernandez-Leon, S.,et al. (2014). Plastic debris in the open ocean. Proc. Natl. Acad. Sci. U.S.A. 111, 10239–10244. doi: 10.1073/pnas.1314705111
Pubmed Abstract | Pubmed Full Text | CrossRef Full Text | Google Scholar
Debrot, A. L., Vinke, E., van der Wende, G., Hylkema, A., and Reed, J. K. (2014). Deepwater marine litter densities and composition from submersible video-transects around ABC-islands, Dutch Caribbean. Mar. Pollut. Bull. 88, 361–365. doi: 10.1016/j.marpolbul.2014.08.016
Pubmed Abstract | Pubmed Full Text | CrossRef Full Text | Google Scholar
Derraik, J. G. B. (2002). The pollution of the marine environment by plastic debris: a review. Mar. Pollut. Bull. 44, 842–852. doi: 10.1016/S0025-326X(02)00220-5
Pubmed Abstract | Pubmed Full Text | CrossRef Full Text | Google Scholar
Emery, W. J., and Meincke, J. (1986). Global water masses: summary and review. Oceanol. Acta 9, 383–391.
Eriksen, M., Lebreton, L. C. M., Carson, H. S., Thiel, M., Moore, C. J., Borerro, J. C.,et al. (2014). Plastic pollution in the world's oceans: more than 5 trillion plastic pieces weighing over 250,000 tons afloat in at sea. PLoS ONE 9:e111913. doi: 10.1371/journal.pone.0111913
Pubmed Abstract | Pubmed Full Text | CrossRef Full Text | Google Scholar
Fischer, V., Elsner, N. O., Brencke, N., Schwabe, E., and Brandt, A. (2015). Plastic pollution of the Kuril–Kamchatka Trench area (NW Pacific). Deep-sea Res. II Top. Stud. Oceanogr. 111, 399–405. doi: 10.1016/j.dsr2.2014.08.012
Galgani, F., and Lecornu, F. (2004). Debris on the seafloor at “Hausgarten”: in the expedition ARKTIS XIX/3 of the research vessel POLARSTERN in 2003. Rep. Polar Mar. Res. 488, 260–262.
Galgani, F., Hanke, G., Werner, S., and De Vrees, L. (2013). Marine litter within the European Marine strategy framework directive. ICES J. Mar. Sci. 70, 1055–1064. doi: 10.1093/icesjms/fst122
Galgani, F., Leaute, J. P., Moguedet, P., Souplet, A., Verin, Y., Carpentier, A.,et al. (2000). Litter on the sea floor along European coasts. Mar. Pollut. Bull. 40, 516–527. doi: 10.1016/S0025-326X(99)00234-9
Galgani, F., Souplet, A., and Cadiou, Y. (1996). Accumulation of debris on the deep seafloor off the French Mediterranean coast. Mar. Ecol. Prog. Ser. 142, 225–234. doi: 10.3354/meps142225
Gilman, E., Suuronen, P., Hall, M., and Kennelly, S. (2013). Causes and methods to estimate cryptic sources of fishing mortality. J. Fish Biol. 83, 766–803. doi: 10.1111/jfb.12148
Pubmed Abstract | Pubmed Full Text | CrossRef Full Text | Google Scholar
GOC (2014). From Decline to Recovery: A Rescue Package for the Global Ocean. Oxford: Global Ocean Commission.
Goldstein, M. C., Titmus, A. J., and Ford, M. (2013). Scales of spatial heterogeneity of plastic marine debris in the northeast pacific ocean. PLoS ONE 8:e80020. doi: 10.1371/journal.pone.0080020
Pubmed Abstract | Pubmed Full Text | CrossRef Full Text | Google Scholar
Gregory, M. R. (2009). Environmental implications of plastic debris in marine settings: entanglement, ingestion, smothering, hangers-on, hitch-hiking and alien invasions. Philos. Trans. R. Soc. Lond. B. Biol. Sci. 364, 2013–2025. doi: 10.1098/rstb.2008.0265
Pubmed Abstract | Pubmed Full Text | CrossRef Full Text | Google Scholar
Halpern, B. S., Walbridge, S., Selkoe, K. A., Kappel, C. V., Micheli, F., D'agrosa, C.,et al. (2008). A global map of human impact on marine ecosystems. Science 319, 948–952. doi: 10.1126/science.1149345
Pubmed Abstract | Pubmed Full Text | CrossRef Full Text | Google Scholar
Henderson, J. R. (2001). A pre- and post-MARPOL Annex V summary of Hawaiian Monk Seal entanglements and marine debris accumulation in the northwestern Hawaiian Islands, 1982–1998. Mar. Pollut. Bull. 42, 584–589. doi: 10.1016/S0025-326X(00)00204-6
Pubmed Abstract | Pubmed Full Text | CrossRef Full Text | Google Scholar
Hoy, S. K., Huvenne, V. A., and Robinson, L. F. (2014). EM-120 Multibeam Swath Bathymetry Collected During James Cook Cruise JC094. University of Brisiol, School of Earth Sciences. doi: 10.1594/PANGAEA.832836
Huetten, E., and Grienert, J. (2008). Software controlled guidance, recording and post-processing of seafloor observations by ROV and other towed devices: the software package OFOP. Geophys. Res. Abstr. 10.
Ivar Do Sol, J. A., Barnes, D. K. A., Costa, M. F., Convey, P., Costa, E. S., and Campos, L. (2011). Plastics in the Antarctic environment: are we looking only at the tip of the iceberg? Oecologia Austalis 15, 150–170. doi: 10.4257/oeco.2011.1501.11
Kaiser, M. J., Bullimore, B., Newman, P., Lock, K., and Gilbert, S. (1996). Catches in ‘ghost fishing’ set nets. Mar. Ecol. Prog. Ser. 145, 11–16. doi: 10.3354/meps145011
Keller, A. A., Fruh, E. L., Johnson, M. M., Simon, V., and McGourty, C. (2010). Distribution and abundance of anthropogenic marine debris along the shelf and slope of the US West Coast. Mar. Pollut. Bull. 60, 692–700. doi: 10.1016/j.marpolbul.2009.12.006
Pubmed Abstract | Pubmed Full Text | CrossRef Full Text | Google Scholar
Koutsodendris, A., Papatheodorou, G., Kougiourouki, O., and Georgiadis, M. (2008). Benthic marine litter in four Gulfs in Greece, Eastern Mediterranean; abundance, composition and source identification. Estuar. Coast. Shelf Sci. 77, 501–512. doi: 10.1016/j.ecss.2007.10.011
Laist, D. W. (1997). “Impacts of marine debris: entanglement of marine life in marine debris including a comprehensive list of species with entanglement and ingestion records,” in Marine Debris- Sources, Impacts and Solutions, eds J. M. Coe and D. B. Rogers (New York, NY: Springer), 99–139. doi: 10.1007/978-1-4613-8486-1_10
Lebreton, L. C., Greer, S. D., and Borrero, J. C. (2012). Numerical modelling of floating debris in the world's oceans. Mar. Pollut. Bull. 64, 653–661. doi: 10.1016/j.marpolbul.2011.10.027
Pubmed Abstract | Pubmed Full Text | CrossRef Full Text | Google Scholar
Lee, D.-I., Cho, H.-S., and Jeong, S.-B. (2006). Distribution characteristics of marine litter on the sea bed of the East China Sea and the South Sea of Korea. Estuar. Coast. Shelf Sci. 70, 187–194. doi: 10.1016/j.ecss.2006.06.003
Mace, T. H. (2012). At-sea detection of marine debris: overview of technologies, processes, issues, and options. Mar. Pollut. Bull. 65, 23–27. doi: 10.1016/j.marpolbul.2011.08.042
Pubmed Abstract | Pubmed Full Text | CrossRef Full Text | Google Scholar
Mifsud, R., Dimech, M., and Schembri, P. J. (2013). Marine litter from circalittoral and deeper bottoms off the Maltese islands (Central Mediterranean). Mediterr. Mar. Sci. 14, 298–308. doi: 10.12681/mms.413
Miyake, H., Shibata, H., and Furushima, Y. (2011). “Deep-sea litter study using deep-sea observation tools,” in Interdisciplinary Studies on Environmental Chemistry—Marine Environmental Modeling & Analysis, eds K. Omori, X. Guo, N. Yoshie, N. Fujii, I. C. Handoh, A. Isobe, and S. Tanabe (Tokyo: Terrapub), 261–269.
Moore, C. J. (2008). Synthetic polymers in the marine environment: a rapidly increasing, long-term threat. Environ. Res. 108, 131–139. doi: 10.1016/j.envres.2008.07.025
Pubmed Abstract | Pubmed Full Text | CrossRef Full Text | Google Scholar
Moore, C. J., Moore, S. L., Leecaster, M. K., and Weisberg, S. B. (2001). A comparison of plastic and plankton in the North Pacific central gyre. Mar. Pollut. Bull. 42, 1297–1300. doi: 10.1016/S0025-326X(01)00114-X
Pubmed Abstract | Pubmed Full Text | CrossRef Full Text | Google Scholar
Mordecai, G., Tyler, P. A., Masson, D. G., and Huvenne, V. I. (2011). Litter in submarine canyons off the west coast of Portugal. Deep-sea Res. II Top. Stud. Oceanogr. 58, 2489–2496. doi: 10.1016/j.dsr2.2011.08.009
OSPAR (2007). Background Report on Fishing-For-Litter Activities in the OSPAR Region. London: OSPAR Comission.
Pham, C. K., Gomes-Pereira, J. N., Isidro, E. J., Santos, R. S., and Morato, T. (2013). Abundance of litter on Condor seamount (Azores, Portugal, Northeast Atlantic). Deep-sea Res. II Top. Stud. Oceanogr. 98, 204–208. doi: 10.1016/j.dsr2.2013.01.011
Pham, C. K., Ramirez-Llodra, E., Alt, C. H., Amaro, T., Bergmann, M., Canals, M.,et al. (2014). Marine litter distribution and density in European seas, from the shelves to deep basins. PLoS ONE 9:e95839. doi: 10.1371/journal.pone.0095839
Pubmed Abstract | Pubmed Full Text | CrossRef Full Text | Google Scholar
Ramirez-Llodra, E., De Mol, B., Company, J. B., Coll, M., and Sardà, F. (2013). Effects of natural and anthropogenic processes in the distribution of marine litter in the deep Mediterranean Sea. Prog. Oceanogr. 118, 273–287. doi: 10.1016/j.pocean.2013.07.027
Ramirez-Llodra, E., Tyler, P. A., Baker, M. C., Bergstad, O. A., Clark, M. R., Escobar, E.,et al. (2011). Man and the last great wilderness: human impact on the deep sea. PLoS ONE 6:e22588. doi: 10.1371/journal.pone.0022588
Pubmed Abstract | Pubmed Full Text | CrossRef Full Text | Google Scholar
Rogers, A. D., and Taylor, M. L. (eds.). (2012). Benthic Biodiversity of Seamounts in the Southwest Indian Ocean: Cruise Report – R/V James Cook 066 - November 7th - December 21st 2011.
Ryan, P. G., Moore, C. J., Van Franeker, J. A., and Moloney, C. L. (2009). Monitoring the abundance of plastic debris in the marine environment. Philos. Trans. R. Soc. Lond. B. Biol. Sci. 364, 1999–2012. doi: 10.1098/rstb.2008.0207
Pubmed Abstract | Pubmed Full Text | CrossRef Full Text | Google Scholar
Schlining, B. M., and Jacobsen Stout, N. (2006). “MBARI's video annotation and reference system,” in Proceedings of the Marine Technology Society/Institute of Electrical and Electronics Engineers Ocean Conference (Boston, MA). doi: 10.1109/OCEANS.2006.306879
Schlining, K., Von Thun, S., Kuhnz, L., Schlining, B., Lundsten, L., Jacobsen Stout, N.,et al. (2013). Debris in the deep: using a 22-year video annotation database to survey marine litter in Monterey Canyon, Central California, USA. Deep-sea Res. I Top. Stud. Oceanogr. 79, 96–105. doi: 10.1016/j.dsr.2013.05.006
Shotton, R. (2006). “Management of demersal fisheries resources of the southern Indian Ocean,” in FAO Fisheries Circular 1020, (Rome: FAO), 90.
Teuten, E. L., Saquing, J. M., Knappe, D. R., Barlaz, M. A., Jonsson, S., Bjorn, A.,et al. (2009). Transport and release of chemicals from plastics to the environment and to wildlife. Philos. Trans. R. Soc. Lond. B. Biol. Sci. 364, 2027–2045. doi: 10.1098/rstb.2008.0284
Pubmed Abstract | Pubmed Full Text | CrossRef Full Text | Google Scholar
Thompson, R. C., Moore, C. J., Von Saal, F. S., and Swan, S. H. (2009). Plastics, the environment and human health: current consensus and future trends. Philos. Trans. R. Soc. Lond. B. Biol. Sci. 364, 2153–2166. doi: 10.1098/rstb.2009.0053
Pubmed Abstract | Pubmed Full Text | CrossRef Full Text | Google Scholar
UNEP (2005). Marine Litter: An Analytical Overview. Nariobi: UNEP. Available online at: http://www.unep.org/regionalseas/marinelitter/publications/docs/anl_oview.pdf
UNGA (United Nations General Assembly) (2012). “The Future We Want”- Resolution Adopted by the General Assembly A/RES/66/288.
Watters, D. L., Yoklavich, M. M., Love, M. S., and Schroeder, D. M. (2010). Assessing marine debris in deep seafloor habitats off Califonia. Mar. Pollut. Bull. 60, 131–138. doi: 10.1016/j.marpolbul.2009.08.019
Pubmed Abstract | Pubmed Full Text | CrossRef Full Text | Google Scholar
Wei, C. L., Rowe, G. T., Nunnally, C. C., and Wicksten, M. K. (2012). Anthropogenic “Litter” and macrophyte detritus in the deep Northern Gulf of Mexico. Mar. Pollut. Bull. 64, 966–973. doi: 10.1016/j.marpolbul.2012.02.015
Pubmed Abstract | Pubmed Full Text | CrossRef Full Text | Google Scholar
Woodall, L., Sanchez-Vidal, A., Canals, M., Paterson, G., Coppock, R., Sleight, V.,et al. (2014). The deep sea is a major sink for microplastic debris. R. Soc. Open Sci. 1:140317. doi: 10.1098/rsos.140317
Wright, D. P., Pendleton, M., Boulware, J., Walbridge, S., Gerlt, B., Eslinger, D.,et al. (2012). “ArcGIS Benthic Terrain Modeler (BTM).” v3.0: Environmental Systems Research Institute, NOAA Coastal Services Center, Massachusetts Office of Coastal Zone Management.
Wright, S. L., Thompson, R., and Galloway, T. (2013). The physical impacts of microplastics on marine organisms: a review. Environ. Pollut. 178, 483–492. doi: 10.1016/j.envpol.2013.02.031
Pubmed Abstract | Pubmed Full Text | CrossRef Full Text | Google Scholar
Keywords: litter, debris, seamount, benthic, fishing gear
Citation: Woodall LC, Robinson LF, Rogers AD, Narayanaswamy BE and Paterson GLJ (2015) Deep-sea litter: a comparison of seamounts, banks and a ridge in the Atlantic and Indian Oceans reveals both environmental and anthropogenic factors impact accumulation and composition. Front. Mar. Sci. 2:3. doi: 10.3389/fmars.2015.00003
Received: 27 November 2014; Accepted: 16 January 2015;
Published online: 02 February 2015.
Edited by:
Alex Ford, University of Portsmouth, UKReviewed by:
Adolphe Debrot, Institute for Marine Research and Ecosystem Studies Wageningen University and Research Center, NetherlandsFrancois Galgani, Institut Français de Recherche pour l'Exploitation de la Mer, France
Christopher Kim Pham, IMAR-Institute of Marine Research, Portugal
Copyright © 2015 Woodall, Robinson, Rogers, Narayanaswamy and Paterson. This is an open-access article distributed under the terms of the Creative Commons Attribution License (CC BY). The use, distribution or reproduction in other forums is permitted, provided the original author(s) or licensor are credited and that the original publication in this journal is cited, in accordance with accepted academic practice. No use, distribution or reproduction is permitted which does not comply with these terms.
*Correspondence: Lucy C. Woodall, Department of Life Sciences, The Natural History Museum, Cromwell Road, London SW7 5BD, UK e-mail:bC53b29kYWxsQG5obS5hYy51aw==