 Adam P. Hejnowicz
 Hilary Kennedy
 Murray A. Rudd
 Mark R. Huxham
- 1Environment Department, University of York, York, UK
- 2School of Ocean Sciences, Bangor University, Anglesey, UK
- 3School of Life, Sport and Social Sciences, Edinburgh Napier University, Edinburgh, UK
Seagrass ecosystems provide numerous ecosystem services that support coastal communities around the world. They sustain abundant marine life as well as commercial and artisanal fisheries, and help protect shorelines from coastal erosion. Additionally, seagrass meadows are a globally significant sink for carbon and represent a key ecosystem for combating climate change. However, seagrass habitats are suffering rapid global decline. Despite recognition of the importance of “Blue Carbon,” no functioning seagrass restoration or conservation projects supported by carbon finance currently operate, and the policies and frameworks to achieve this have not been developed. Yet, seagrass ecosystems could play a central role in addressing important international research questions regarding the natural mechanisms through which the ocean and the seabed can mitigate climate change, and how ecosystem structure links to service provision. The relative inattention that seagrass ecosystems have received represents both a serious oversight and a major missed opportunity. In this paper we review the prospects of further inclusion of seagrass ecosystems in climate policy frameworks, with a particular focus on carbon storage and sequestration, as well as the potential for developing payment for ecosystem service (PES) schemes that are complementary to carbon management. Prospects for the inclusion of seagrass Blue Carbon in regulatory compliance markets are currently limited; yet despite the risks the voluntary carbon sector offers the most immediately attractive avenue for the development of carbon credits. Given the array of ecosystem services seagrass ecosystems provide the most viable route to combat climate change, ensure seagrass conservation and improve livelihoods may be to complement any carbon payments with seagrass PES schemes based on the provision of additional ecosystem services.
Introduction
Seagrasses represent a diverse and globally distributed group of aquatic flowering plants (angiosperms) with up to 76 species occurring in boreal, temperate, and tropical waters (Green and Short, 2003). Seagrass meadows are commonly dominated by a single species, although in tropical regions meadows comprising 12 distinct species have been recorded. They are often significant or dominant primary producers, supporting local food-webs and driving local nutrient cycles (Howard et al., 1989; Hemming and Duarte, 2000; Gullström et al., 2008). Seagrass meadows have evolved important physiological, morphological and ecological adaptations to cope with the range of coastal marine environments they inhabit, with the spatial distribution of seagrass meadows heavily influenced by environmental factors such as light, temperature, salinity, nutrient availability, and wave action (Hemming and Duarte, 2000; Orth et al., 2006). However, the shallow coastal habitat colonized by most seagrass meadows means they are especially prone to significant human-related disturbance (Waycott et al., 2009).
Human actions provide a triumvirate of environmental, biological and climatological stressors that act across spatial and temporal scales delivering locally-specific impacts (Orth et al., 2006). Drivers of seagrass ecosystem decline include: eutrophication and solid waste disposal (nutrient pollution); aquaculture; thermal pollution; physical alteration or habitat damage (via dredging, coastal infrastructural developments, land reclamation, and mechanical destruction); disease spread and invasive species introductions; climate change; over-fishing; overexploitation; and land-runoff from deforestation, mining and agriculture (Duarte, 2002; Erftemeijer and Lewis, 2006; Orth et al., 2006; Waycott et al., 2009; Short et al., 2011; Zuidema et al., 2011; Hicks and McClanahan, 2012; Cullen-Unsworth and Unsworth, 2013; Cullen-Unsworth et al., 2014; Baker et al., 2015).
Over several decades the global integrity of seagrass ecosystems has been seriously undermined by business-as-usual approaches to coastal development (Duarte, 2002). Occurrences fuelled by increasing population densities in coastal regions, which are about three times higher than the global average and increasing (Small and Nicholls, 2003). In some cases rapid population growth and urban expansion has shifted farming practices toward increased agricultural output leading to the persistent eutrophication of coastal lagoons and reduced seagrass biomass (Rivera-Guzmán et al., 2014). Similarly, nutrient loading and sedimentation have markedly reduced the extent of several seagrass meadow sites in the Western Pacific (Short et al., 2014).
Globally, 24% of seagrass species are now classified as threatened or near threatened on the IUCN's Red List (Short et al., 2011). Estimates of the rate of seagrass decline have increased over the last 70 years, from 0.9% yr−1 prior to 1940 rising to 7% yr−1 since 1980 (Waycott et al., 2009; Fourqurean et al., 2012; Duarte et al., 2013a). The global decline of seagrass ecosystems threatens to exacerbate climate change (Duarte et al., 2010; Kennedy et al., 2010; Fourqurean et al., 2012; Lavery et al., 2013), undermine the supply of a range of other ecosystem services (Bujang et al., 2006; Orth et al., 2006; Waycott et al., 2009; Short et al., 2011; Cullen-Unsworth and Unsworth, 2013) and consequently detrimentally affect subsistence livelihoods (Unsworth and Cullen, 2010; Nordlund et al., 2011).
This reality reflects the complexity of seagrass ecosystems, particularly the connections seagrass meadows have with marine and terrestrial systems, and therefore the difficulties and challenges associated with their management, which are embedded within broader coastal and ocean management issues (Rudd and Lawton, 2013). For example, in a recent global ocean research priorities exercise (Rudd, 2014) several top-ranked priorities had implications for seagrass ecosystems, including: “greenhouse gas flux” (7th); “climate change mitigation and manipulation” (8th); “ecosystem structure to service linkages” (16th); “upland hydrology effects on oceans” (24th); “coastal hazard management” (35th); “ecosystem management alternatives” (40th); and “integrated upland coastal management” (43rd). Our view is that research is needed on multiple fronts to create enabling conditions and the evidence base needed to craft innovative new policy tools for conservation and mitigating the potential adverse effects of climate change.
Our purpose here is to summarize the prospects for using new approaches to aid seagrass conservation. This will help address key coastal and ocean research questions, and provide substantive direction on future seagrass research needs. We address these issues in the context of incorporating seagrass habitats into climate change mitigation strategies jointly focused on ecosystem service provision, carbon management and livelihood support. In particular, we analyse prospective financing options in relation to carbon management, alongside other investment opportunities for including seagrass meadows into incentive-based mechanisms (e.g., PES) through a co-benefit and bundled ecosystem service approach. In so doing we consider science, policy, and governance perspectives acknowledging the important barriers and challenges existing across those domains.
We examine five key issues. In Section Seagrass Ecosystems and Ecosystem Services, we summarize ecosystem services (ES) provided by seagrass ecosystems and the salient information needed concerning these ES to develop incentive schemes. In Section The Value of Ecosystem Services provided by Seagrass Ecosystems, we ask how ecosystem service valuation information could be applied to design and implement new policy innovations. In Section Policy Frameworks for Blue Carbon management, we examine the prospects for seagrass carbon finance based on current climate policy frameworks. In Section Seagrass Habitats: Prospects for PES, we broaden the scope to financing instruments that could be developed based on the multiple ES that seagrass ecosystems provide. Lastly, in Section Possibilities for Implementing Seagrass Conservation Mechanisms, we summarize the key design, implementation, and governance issues that must be addressed to bring functioning seagrass PES schemes to fruition. In addition, we highlight the relevant ocean priority research questions that relate to each stage (Rudd, 2014), setting our seagrass-oriented research in the broader context of ocean research prioritization.
Seagrass Ecosystems and Ecosystem Services
Seagrass ecosystems provide supporting, regulating, provisioning, and cultural ecosystem services (Barbier et al., 2011; Raheem et al., 2012; Cullen-Unsworth and Unsworth, 2013). It is important to emphasize that the different lineages and species of seagrass will differ to some extent in the number and magnitude of ES they provide, for example, the level of organic carbon present in living biomass and seagrass meadow sediments is affected by species differences (Fourqurean et al., 2012) as are the fish community assemblages seagrass meadows support (Rotherham and West, 2002). However, our purpose in this section is to provide a brief outline of the main ES that are generally attributed to seagrasses in the literature, and to highlight the information that is necessarily required about each of these ES for them to be included in an incentive-based payment mechanism (Table 1). We do not provide a species by species breakdown of seagrass ecosystem services provision, partly because much of this information remains to be obtained (this is what Table 1 to some extent addresses) but it would also be beyond the scope of the present review.
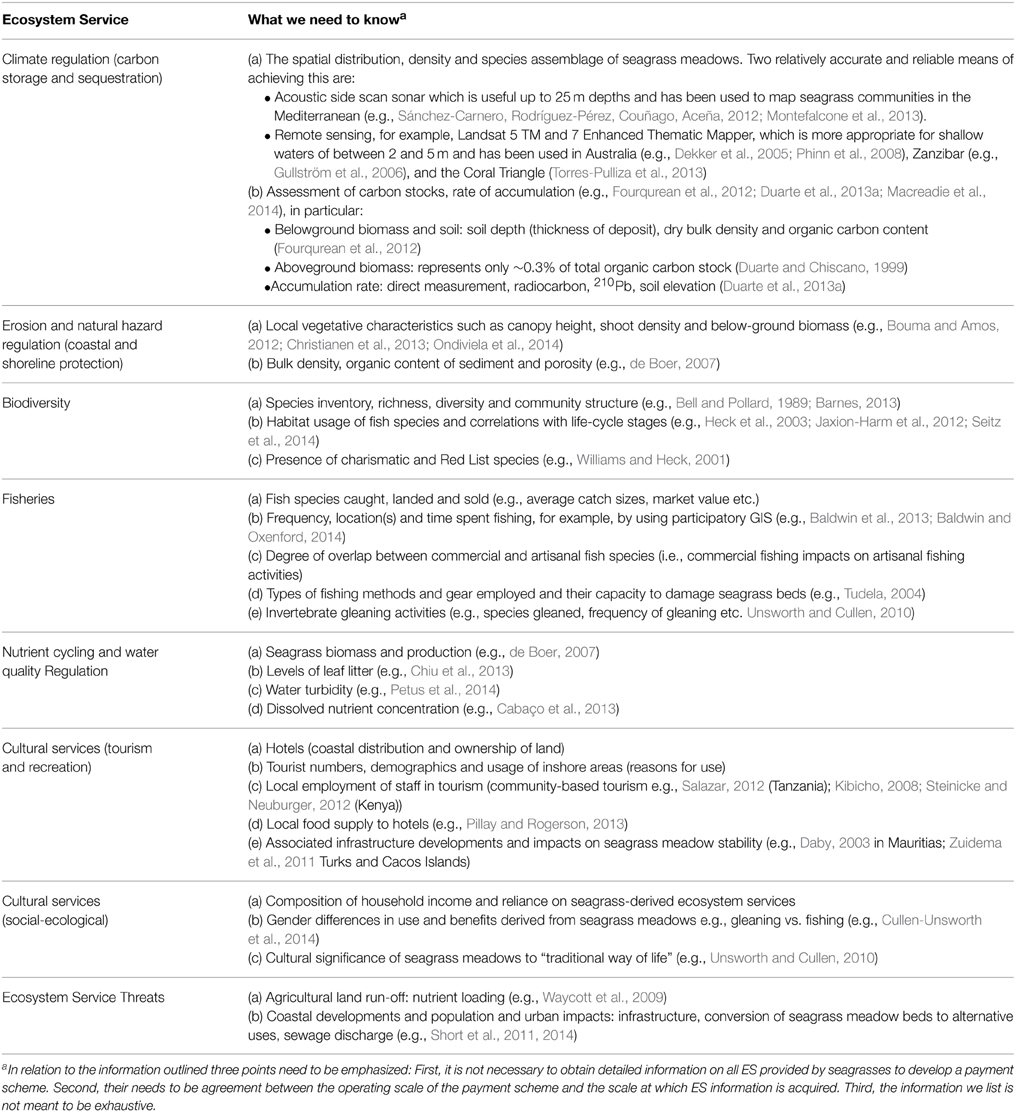
Table 1. Seagrass ecosystem services and the corresponding information needed to contribute toward incentive scheme development.
Regulating Services: Climate Regulation
Historically, seagrass meadows had been virtually ignored in global carbon budgets (Duarte et al., 2005). More recently their role in combating climate change through carbon storage and sequestration has become more clearly recognized, while simultaneously the spatial extent of seagrass meadows has continued to decline (Duarte et al., 2010, 2013a; Kennedy et al., 2010; Fourqurean et al., 2012; Lavery et al., 2013). Although a small fraction (18 to 60 × 106 ha) of the world's ocean area, seagrass meadows are “responsible for 3 to 20% of the global carbon sequestration in marine sediments” (Duarte et al., 2013a, p. 32) and store 10% of annual buried organic carbon (Corg) (Fourqurean et al., 2012; Pendleton et al., 2012). Consequently, seagrass ecosystems play potentially central roles in how oceanic ecosystems can mitigate climate change, a question ranked 8th in global importance by marine scientists (Rudd, 2014).
Seagrass meadows are highly productive systems, especially in Indo-Pacific regions, and provide habitat for diverse communities (Short et al., 2011). However, worldwide, seagrass standing biomass is small (76–151 Tg C) relative to the biomass of the vegetation in other coastal ecosystems (Fourqurean et al., 2012). Nonetheless, the high productivity of seagrass meadows, with potential net community production (NCP) of 6.7 t C ha−1 yr−1 (several times higher than NCP rates associated with Amazonian forests and North American wetlands), contributes significantly to their carbon sink capacity (Duarte et al., 2010). Approximately 20–60% of this aboveground productivity derives from the autotrophic epiphytes that seagrass meadows support (Duarte et al., 2013a). Moreover, seagrass meadows trap allochthonous material, including large amounts of particulate carbon, which combined with their ability to bury carbon enables seagrass meadows to store large amounts of carbon (Duarte et al., 2013a).
Carbon stored belowground, as dead roots and rhizomes and as Corg, may be stable for millennia (Duarte et al., 2010, 2013a). However, the amount of Corg locked beneath seagrass beds varies considerably according to the interplay of different abiotic and biotic drivers, with the result that in some cases deposits of organic-rich sediments beneath seagrass meadows can be up to 11 m thick (Duarte et al., 2013a). In addition, most seagrass production (approximately 80%) is not consumed by herbivores and may therefore be buried, where a combination of low nutrient content and anoxic sediment conditions contributes to low rates of remineralization aiding long-term storage (Duarte et al., 2013a). Burial rates are therefore somewhat difficult to estimate; however, the most robust data suggests mean local Corg burial rates of 1.2–1.38 t C ha−1 yr−1: equivalent to 30–50% of NCP (Kennedy et al., 2010; Duarte et al., 2013b). Nevertheless, others (Siikamäki et al., 2013) have suggested a much lower burial rate, equivalent to 0.54 t C ha−1 yr−1.
Globally, the organic carbon that accumulates in the sediments below seagrass meadows is much greater (4.2–8.4 Pg C) than the biomass (Fourqurean et al., 2012). However, the areal extent of seagrass meadows is poorly mapped, meaning these estimates remain highly uncertain (Duarte et al., 2013b; Lavery et al., 2013). Further uncertainties arise from the fact that some 50% of below-ground carbon derives from autochthonous production while almost 50% is contributed from phytoplankton and terrestrial sources (Kennedy et al., 2010; Duarte et al., 2013a). Indeed, significant quantities of carbon are also exported away from seagrass meadows to adjacent areas, although the fate of this carbon is poorly understood (Duarte et al., 2010, 2013a).
Despite the uncertainties, alongside the lack of attention given to the potential implications of extensive conversion of standing carbon pools beneath vegetative coastal ecosystems more generally, it is clear that seagrass meadows constitute an important global carbon sink whose continued loss threatens to exacerbate climate change (Duarte et al., 2010; Pendleton et al., 2012). Indeed, global carbon emissions maybe enhanced by an additional 3–19% from the destruction of vegetative coastal ecosystems (Pendleton et al., 2012). Based on current assessments seagrass biomass loss may release between 11 and 23 Tg C yr−1 into the ocean-atmosphere system, and a further 63–297 Tg C yr−1 into the ocean-atmosphere CO2 reservoir through the oxidization of the underlying sediment (Fourqurean et al., 2012). Additionally, seagrass loss reduces the overall carbon accumulation rate (equivalent to between 6 and 24 Tg C yr−1). Collectively, this represents considerable CO2 emission potential (131–522 Mg CO2 ha−1), a figure comparable to roughly 10% of that emitted annually from land-use change, with associated economic costs approaching US$1.9 to 13.7 billion yr−1 (Fourqurean et al., 2012; Pendleton et al., 2012).
Regulating Services: Erosion and Natural Hazard Regulation
Coastal vegetated wetlands such as seagrass meadows can provide effective natural protection from the destructive powers of storms and wave action (Barbier et al., 2008; Bouma and Amos, 2012; Duarte et al., 2013b). They are therefore important ecosystems to study in order to understand the spatial extent, frequency, and risk of marine hazards affecting coastal waters and how their effects can be minimized (ranked 35th in Rudd, 2014). Direct coastal protection is achieved through energy dissipation resulting from wave breaking, friction and energy reflection (Ondiviela et al., 2014), processes significantly influenced by seagrass shoot density and canopy structure (Hansen and Reidenbach, 2013). Even low biomass and heavily grazed seagrass meadows can significantly reduce wave action by decreasing the hydrodynamic energy associated with current flow (Christianen et al., 2013). For example, in temperate regions current velocities have been reduced by up to 60% in summer (high biomass) compared to 40% in winter (low biomass) in relation to adjacent non-vegetated sites (Hansen and Reidenbach, 2013). By reducing wave action and current velocities seagrass habitats also protect the seafloor against hydrodynamic “shear stresses” (de Boer, 2007).
Seagrass canopies act as efficient filters, stripping particles from the water column and adding to sediment accumulation (Hendriks et al., 2008). Soil accretion (~1.5 mm yr−1) is important in helping coastal wetlands, and seagrass meadows in particular, adapt to sea level rise (Kirwan and Megonigal, 2013; Lavery et al., 2013), thus contributing to Rudd (2014) 26th ranked question on sea level rise and vulnerable coasts. Below-ground seagrass biomass is particularly important for sediment accretion as well as stabilization against storm erosion (Bos et al., 2007; Christianen et al., 2013). By helping to immobilize sediment, seagrass meadows also reduce re-suspension and increase water transparency (Duarte, 2002; Ondiviela et al., 2014). In the Arabian Gulf, for example, sediment stabilization and shoreline protection represent important ecosystem service functions of seagrass meadows (Erftemeijer and Shuail, 2012). Overall, the effectiveness and efficiency of the coastal protection services provided by seagrass ecosystems varies across spatial and temporal scales due to differences in species type (i.e., vegetative characteristics), coastal distribution, flow-vegetation interactions and water dynamic properties (Ondiviela et al., 2014). In monetary terms, the erosion control services provided by seagrass beds (inclusive of algal beds) have been estimated at US$25,000 ha−1yr−1 (Costanza et al., 2014).
Provisioning Services: Biodiversity and Fish Nurseries
The physical and biological structure of seagrass meadows is central to their significance as a marine biotope (Gullström et al., 2008; Pogoreutz et al., 2012; Saenger et al., 2013). The high primary productivity of seagrass, their epiphytes and associated benthic algae provide an important energy source to support local, transient and distant food webs (Heck et al., 2008). In addition, the structural complexity of seagrass meadows offers sites for attachment and a place to avoid predation (Farina et al., 2009). These attributes mean seagrass meadows function as foraging areas, refuges and nursery habitats for diverse communities of marine life, many of which are commercially important or endangered (Bujang et al., 2006; Orth et al., 2006; Unsworth and Cullen, 2010; Erftemeijer and Shuail, 2012; Jaxion-Harm et al., 2012; Browne et al., 2013; Cullen-Unsworth and Unsworth, 2013). Organic matter produced in seagrass meadows is also exported to adjacent ecosystems and supports a large range of marine and terrestrial consumers (Heck et al., 2008). Connectivity between mangrove and seagrass ecosystems has also been shown to be important for supporting inshore fisheries, the abundance and assemblage of fish and crustacean communities and fish life-cycle stages (Bosire et al., 2012; Honda et al., 2013; Saenger et al., 2013). Seagrass ecosystems are thus important for ocean priority research questions on biodiversity contributions to ecosystem function (ranked 6th) and biological connectivity (ranked 28th) (Rudd, 2014).
Supporting Services: Nutrient Cycling
Seagrass meadows are directly involved in nutrient cycling through their uptake of water column nutrients, storage in biomass, detritus and sediment, and indirectly through the effect of seagrass metabolism on water column and sediment nutrient re-cycling (Saenger et al., 2013). The nutrient cycling capacity of seagrass meadows has been estimated to contribute about US$26,000 ha−1yr−1, or US$1.9 trillion in aggregate, to the global economy (Waycott et al., 2009; Costanza et al., 2014).
Cultural Services: Social Relations
Wetland ecosystems play vital cultural, economic and ecological roles, supporting livelihoods and reducing poverty (Kumar et al., 2011; Senaratna Sellamuttu et al., 2011; Verma and Negandhi, 2011). Frequently, the fish and marine invertebrate populations supported by intact seagrass ecosystems maintain stocks of commercial and artisanal importance, and their exploitation makes significant economic and food security contributions to many coastal communities (Jackson et al., 2001). In some cases seagrass supported fisheries may provide a harvest value of up to US$3500 ha−1 yr−1 (Waycott et al., 2009). In Tarut Bay, (Arabian Gulf), seagrass ecosystems support a US$22 million yr−1 fishery (Erftemeijer and Shuail, 2012). Prawns are also the basis for extensive fisheries, particularly along warm-temperate and tropical coastlines, and previous estimates of the potential total annual yield from seagrass ecosystems in Northern Queensland, Australia, equated to a landed value of US$0.41–1.35 million yr−1 (Watson et al., 1993). In the Caribbean and Indo-Pacific region valuable species found on seagrass meadows such as queen conch (Euatrombus gigas), spiny lobster (Palinuridae), and smudgespot spinefoot (Siganus canaliculatus) also support local fisheries (Cullen-Unsworth and Unsworth, 2013; Baker et al., 2015).
Shellfish gleaning frequently supports artisanal fishers' subsistence and generates income for rural households (Unsworth and Cullen, 2010). Invertebrate harvesters in Zanzibar, East Africa, can earn between US$8.51 and US$17.01 per catch from gleaning activities, emphasizing the social-ecological connections between coastal community livelihoods and seagrass ecosystem functioning (Nordlund et al., 2011). In some locations, the scale of inshore fisheries supported by seagrass ecosystems have been shown to be more significant (in economic terms) than those supported by mangroves or coral reefs. Recent evidence from Chwaka Bay (Zanzibar) indicated that fishers spend 70% of their time fishing seagrass meadows and preferred fishing there compared to mangrove and coral reef habitats (De la Torre-Castro et al., 2014). As a consequence, over 50% of the fish sold in the central market derived from seagrass meadows. In Wakatobi National Park (Indonesia), 60% of invertebrate collectors and 40% of fishers and gleaners preferred harvesting from seagrass meadows compared to 20% of collectors, fishers and gleaners who preferred to harvest exclusively from coral reefs (Unsworth et al., 2010).
The Value of Ecosystem Services Provided by Seagrass Ecosystems
Ecosystem Service Valuation
Valuing ecosystem services has become an increasingly important tool for demonstrating the significance of biodiversity and ES to society and informing policy decisions (Brondizio et al., 2010; Gómez-Baggethun et al., 2010; Dendoncker et al., 2014; Liekens and De Nocker, 2014). ES valuations have been criticized for focusing disproportionately on utilitarian values, overly commodifying nature and ignoring ecological complexity, potentially leading to erroneous policy decisions (Kosoy and Corbera, 2010; Norgaard, 2010; Gowdy and Baveye, 2014). In light of these criticisms efforts to value ES have increasingly sought to focus on integrating the ecological, social and economic dimensions of ES into a unified whole (Figure S1 Supplementary Material) (TEEB, 2010; UK NEA, 2011; Dendoncker et al., 2014). A plethora of monetary and non-monetary techniques have recently been developed to try and capture the broadest range of “values” across the breadth of ecosystem services (Table S1 Supplementary Material). Seagrass ecosystems provide a potentially tractable environment within which to conduct multi-faceted valuation research and address an important ocean research question (ranked 53rd, Rudd, 2014) on ecosystem service valuation implications.
Seagrass and Wetland Valuation Studies
Economic valuations of seagrass ecosystems remain few in number, with most focusing on the market value of commercial fisheries as the primary ecosystem service of importance (Table 2).
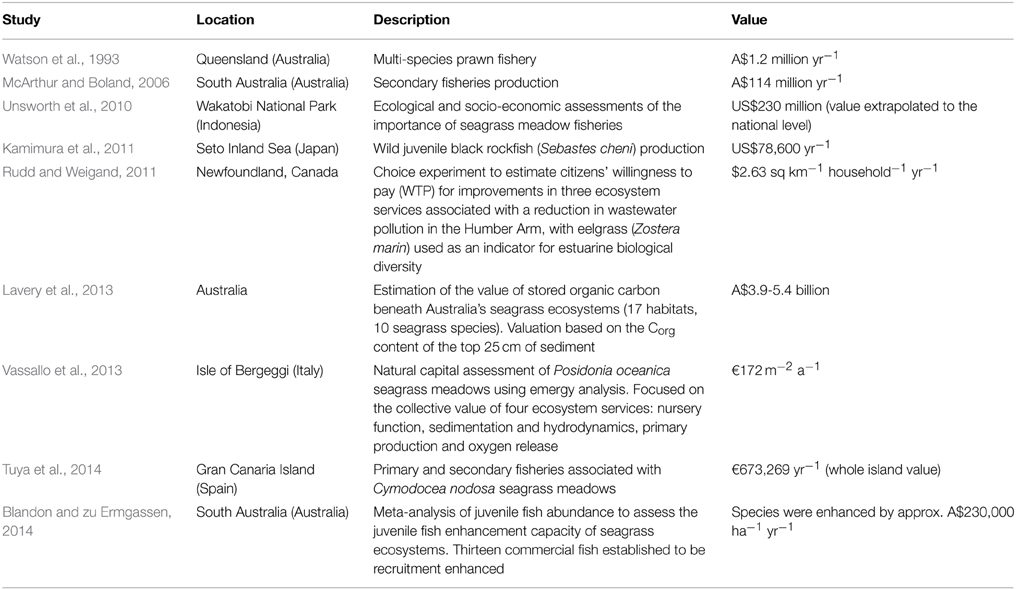
Table 2. Valuation studies of seagrass meadows.
In several respects seagrass ecosystems have been marginalized in favor of other coastal and estuarine ecosystems, meaning valuation studies conducted for other wetland biotopes (i.e., mangroves, coral reefs, and saltmarshes) are the only suitable avenue to identify comparative estimates for commonly shared ecosystem services that may offer insights into the expected range of values for seagrass meadows (Table 3).
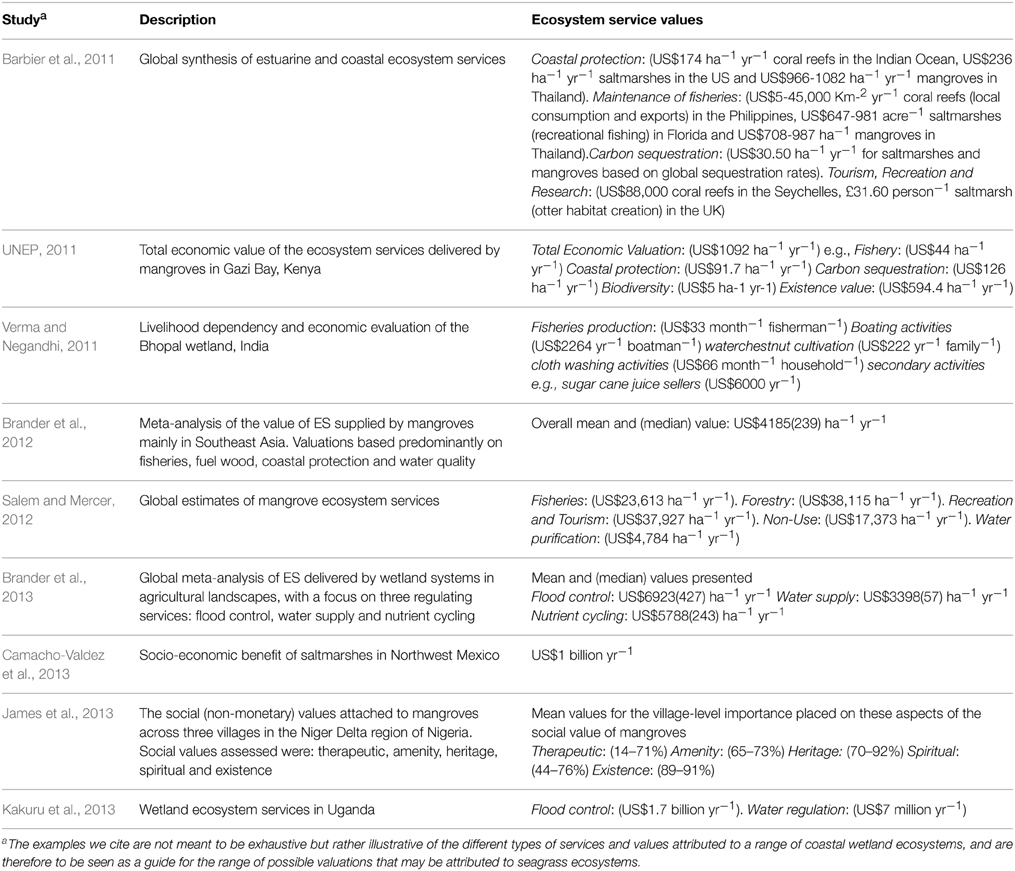
Table 3. Valuation studies of coastal and wetland ecosystem services.
Overall, the lack of in-depth local studies spanning different continents and regions valuing the breadth of ecosystem services provided by seagrass ecosystems needs to be remedied, with particular focus on qualitative value attributions associated with the social-ecological dynamics of seagrass systems (Cullen-Unsworth and Unsworth, 2013). This view supported the wider sentiment articulated by Raheem et al. (2012, p. 1169), that “there is a dearth of spatially explicit non-market values for services provided by coastal and other ecosystems,” and by the Abu Dhabi Global Environmental Data Initiative (AGEDI, 2014, p. 10), that the “option of combining Blue Carbon with other ecosystem services valuation should be kept open to provide multiple potential values that can support conservation activities.” Strengthening the evidence base regarding the global economic value of oceans (ranked 48th, Rudd, 2014) requires site-specific seagrass ecosystem valuation efforts that can be used to derive transfer values from meta-analyses (e.g., Johnston et al., 2005; Brander et al., 2012).
Policy Frameworks for Blue Carbon Management
Recent thinking about Blue Carbon acknowledges the special importance of the carbon storage and sequestration capability of coastal and marine wetlands and organisms in global climate change scenarios and policies (Sifleet et al., 2011; Vaidyanathan, 2011). Blue Carbon sinks capture and store amounts of carbon equivalent to up to half of global transport emissions (~ 400 Tg C yr−1) yet their inclusion in current mitigation and adaptation programs has been very limited (Locatelli et al., 2014). Developments could occur in the regulated (compliance) or the unregulated (voluntary) carbon sectors. We take each in turn.
The Regulated Sector
Policies and Processes
Collectively, the United Nations Framework Convention on Climate Change (UNFCCC), Manado Ocean Declaration (2009), Cancún Agreement (2010) and Rio Ocean Declaration (2012) provide opportunities for development of Blue Carbon initiatives. In practice, however, current policy processes inadequately account for the restoration and protection of Blue Carbon systems (Grimsditch, 2011; Murray et al., 2011). This is due, in part, to the initial bias toward terrestrial climate change mitigation and adaptation activities within the UNFCCC, alongside the acknowledgment that practical expansion to coastal and marine systems (from principled intentions) would require further international agreement (Murray et al., 2012). However, as a recent report indicates (UNEP and CIFOR, 2014: x) “climate change mitigation frameworks developed for terrestrial ecosystems can be extended to include coastal wetlands.”
There are clear points of entry for Blue Carbon funded activities under the parallel pathways of the UNFCCC, specifically: the Land Use and Land-Use Change and Forestry (LULUCF) and the clean development mechanism (CDM) of the Kyoto Protocol; and the Reduced Emissions from Deforestation and forest Degradation + (REDD+) and Nationally Appropriate Mitigation Actions (NAMAs) of the Durban Platform. In many cases these entry points require altering or reinterpreting definitions (Gordon et al., 2011; Grimsditch, 2011; Murray et al., 2011, 2012). Nevertheless, some argue that by the Paris COP 21 meeting in 2015 negotiations are likely to have reached a consensus for including an approach for Blue Carbon accounting under the UNFCCC (UNEP and CIFOR, 2014).
Kyoto Protocol Opportunities
Limited possibilities exist within the Kyoto Protocol (Murray et al., 2012). However, some progress has been made through the recently updated Intergovernmental Panel for Climate Change (IPCC) guidelines. The so-called “Wetlands Supplement” includes guidance for national governments to report carbon emissions and removals for specific management activities in coastal wetlands (e.g., mangroves, tidal marshes and seagrass meadows) (IPCC, 2014). The activities that national governments will be able include in their national inventories for greenhouse gases covers forest management in mangroves, certain aspects of aquaculture, drainage and restoration or creation of coastal wetlands. However, this supplementary regulation is “encouraged but not mandatory in context of any other activities under Article 3, paragraphs 3 and 4, of the Kyoto Protocol” (UNFCC, 2014).
Moreover, extension of current LULUCF definitions to cover wetland ecosystems is lacking (Murray et al., 2012). However, with the publication of the IPCC Wetland Supplement the case for not including a broader set of definitions that specifically mention wetlands is harder to justify. Furthermore, activities under LULUCF could include avoided wetland degradation via alternative use or prohibiting disturbance (Herr et al., 2012). With regards to baseline credit mechanisms such as the CDM, in 2011 a mangrove project was approved as an afforestation and reforestation activity. However, the methodology applied is specifically for mangroves and not (so far at least) transferable to tidal marshes or seagrass meadows (Lovelock and McAllister, 2013). Moreover, the much more substantial avoided emissions resulting from protecting Blue Carbon pools remain outside this mechanism (Murray et al., 2011, 2012).
Durban Platform Opportunities
The Durban Platform provides more scope for Blue Carbon activities. Mangroves are now covered by REDD+ (Grimsditch, 2011). However, seagrass inclusion remains some way off: this would require a broader definition of “forests” as well as an extension of emission and reduction activities across all land-uses (i.e., Agriculture, Forestry and Other Land Uses, AFOLU) (Murray et al., 2011, 2012; Siikamäki et al., 2013). Nevertheless, AFOLU projects do include a variety of carbon accounting protocols relating to biomass, Corg and greenhouse gas emissions (UNEP and CIFOR, 2014). There have been calls to decouple carbon sequestration and emissions arising from habitat degradation (Grimsditch, 2011). This is particularly important for seagrass meadows where the “real” carbon of interest is buried in the sediment. Under REDD+, deciding what aspects of the Blue Carbon pool (i.e., sediment/soil-carbon or above-ground biomass) count would be especially important (Murray et al., 2011). Extension of REDD+ to seagrass meadows could easily see them contributing to reduced emissions via the degradation pathway, through a focus on management strategies linked to tackling the negative impacts of nutrient loading for example (Seifert-Granzin, 2010). Developments to include tidal wetland restoration and conservation under REDD+ are currently on-going (UNEP and CIFOR, 2014).
NAMAs offer the most direct route for funding Blue Carbon enterprises because countries have autonomy over the activities that form part of their national strategies, and could reasonably protect and restore wetland and coastal ecosystems (Grimsditch, 2011; Herr et al., 2012; Murray et al., 2012). Furthermore, the green climate fund provides finances for programs in accordance with NAMAs that could be directed toward Blue Carbon activities (Herr et al., 2012). However, the challenge remains that inclusion of these activities under a national framework would still require measurement, reporting and verification approval (Murray et al., 2012).
The Voluntary Sector
The Global Voluntary Carbon Market
The voluntary carbon market (VCM) accounts for 0.1–0.02% of the value and volume of the regulated global carbon market respectively (Benessaiah, 2012). Yet rapid sector expansion has led to increasing interest from governments, particularly in relation to carbon standards and registries (Peters-Stanley and Yin, 2013). The principal attraction of the VCM is its deregulated nature, which helps to reduce transaction costs and stimulate innovation. However, the trade-off to this regulatory flexibility is market uncertainty and depression of the carbon price, which can have serious implications for expected project returns (Benessaiah, 2012; Thompson et al., 2014). Project size is also a determinant of offset price, with smaller projects garnering higher carbon prices for carbon dioxide equivalent (CO2e). The average carbon price for micro projects (i.e., those generating less than 5 Kt CO2e yr−1) was recently US$10/tCO2e, whereas the mean carbon price for mega projects (i.e., those generating more than 1 Mt CO2e yr−1) was US$5.8/tCO2e (Peters-Stanley and Yin, 2013).
Worldwide carbon standards have expanded from concentrating purely on carbon accounting to emphasizing co-benefits (Peters-Stanley et al., 2012). This has been driven, particularly in the private sector, by an increasing interest in measuring and verifying non-carbon project outcomes (Peters-Stanley and Yin, 2013). Programs are progressively focusing on climate change adaptation, public health, gender issues and biodiversity as additional attributes to non-carbon benefits (Peters-Stanley and Yin, 2013) (Table 4). For example, the verified carbon standard (VCS), which accounts for 55% of market share, considers climate, community and biodiversity (16%) and Social Carbon (2%) co-benefits (Peters-Stanley and Yin, 2013). This is important for ecosystems such as seagrass meadows that provide multiple benefits in addition to carbon storage as those benefits might be captured via broader standard attributes.
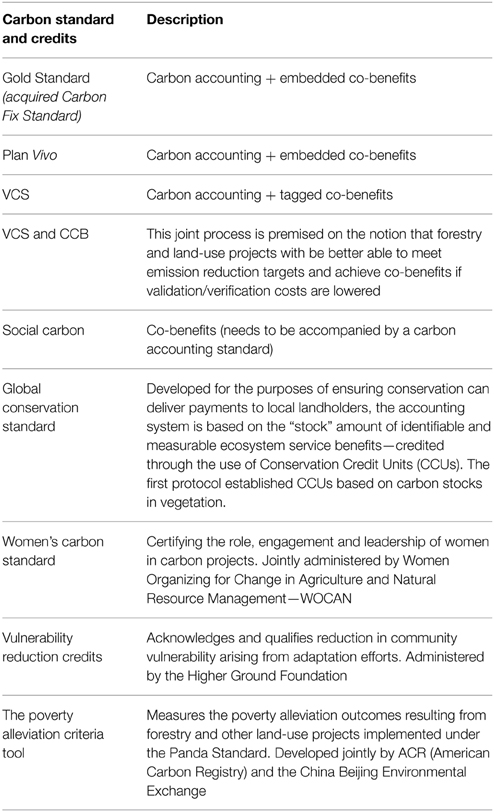
Table 4. Carbon standards appropriate for joint environmental and development projects.
Another important development for coastal wetland systems such as seagrass meadows is that the VCM has highlighted the special connections between carbon and water. Both VCS and the American Carbon Registry (ACR) have coastal wetland accredited carbon accounting methodologies (Peters-Stanley et al., 2012; Thomas, 2014). For example, in the Mississippi Delta the ACR has developed a wetland restoration protocol (UNEP and CIFOR, 2014). Furthermore, VCS has also developed a soil carbon sampling methodology that could be transferred to wetland and peatland ecosystems (Peters-Stanley and Yin, 2013). Indeed, VCS methodologies cover the full array of Blue Carbon activities, from restoration and re-vegetation to conservation and management, and in late 2013, the “Greenhouse Gas Accounting Methods for Tidal Wetlands and Seagrass Restoration” methodology was submitted to VCS and is currently awaiting approval (UNEP and CIFOR, 2014).
Although the increasing alignment between livelihood development and carbon management is welcomed, several challenges exist. Specifically, a lack of appropriate markets, negotiating trade-offs between maximizing economic efficiency and ensuring equity in benefit flows, and adequately socially embedding payment schemes. These challenges relate to broader issues of the transaction costs of ocean management (ranked 57th, Rudd, 2014). Developing inclusive sustainable livelihood VCM projects depends on the provision of secure property rights and tenure arrangements regarding the ownership and use of resources. However, providing secure property rights alongside certification can be prohibitively expensive (e.g., CCB certification is estimated at US$4000–US$8000) even though adequately accounting for costs and securing financial streams is essential (Benessaiah, 2012). Negotiating investment risk and return uncertainty are significant challenges in community-based carbon projects where non-compliance and complex program arrangements are pressing issues. Likewise, the provision of “enabling institutions” for effective administrative, operational and implementation performance remains crucial. Nevertheless, the advantages of the VCM outweigh the downsides and present a more immediately attractive option even if in some quarters the regulated carbon market is the preferred long-term option (Benessaiah, 2012; Ullman et al., 2013).
Multilateral Environmental Agreements
The sustainability of estuarine, coastal and marine habitats, with regards to their use, conservation, restoration and in climate change mitigation and adaptation have been alluded to under several regional and international multilateral agreements for example: the Convention on Biological Diversity (CBD); Ramsar Convention on Wetlands (Ramsar); UNEP Global Programme of Action for the Protection of the Marine Environment from Landbased Activities (GPA-Marine); Convention for the Protection of the Marine Environment and Coastal Areas of the South-East Pacific (Lima Convention) and the South Pacific Regional Environment Programme (SPREP). Although predominantly management and advocacy-related, some of these programs offer financial support for Blue Carbon activities (Laffoley, 2013).
National Level Policies
Research evaluating the ways in which vegetative coastal ecosystem services and carbon in particular can be included in national level statues and policies is lacking, partly as a result of the highly individual nature of national legislation. However, Pendleton et al. (2013) have identified how such “coastal carbon” could be incorporated under a subset of existing U.S. federal statutes and policies including the National Environmental Policy Act, the Comprehensive Environment Response, Compensation and Liability Act, the Oil Pollution Act, the Clean Water Act and the Coastal Zone Management Act amongst several others. The analysis indicates that although coastal carbon services are not currently accounted for under existing federal-level legislation, to do so would be relatively straightforward and consistent with the implementation of these regulations (Pendleton et al., 2013). Nevertheless, despite this relative ease, incorporating coastal carbon into existing federal legislation would require further improvements in the availability of expertise, guidance and procedures for assessing the value of coastal carbon, quantifying the impacts of projects on carbon storage and sequestration and mapping the spatial dynamics of coastal ecosystems. The lack of precedent (i.e., the formal assessment and analysis of the benefit-costs of coastal carbon economics values in these regulations) was also recognized as an important limitation that would need to be overcome for wider “coastal carbon functions” to be frequently included in regulatory assessments (Pendleton et al., 2013). Importantly, these considerations are equally applicable to State-level legislation as they are to other national legislative policies and statutes in other countries.
Blue Carbon Demonstration Sites and the Future
Recent research, policy and financing advancements in Blue Carbon relevant to seagrass meadows include global programs. The Blue Carbon Initiative (www.thebluecarboninitiative.org) focused on integrating Blue Carbon activities into the UNFCCC and other carbon financing mechanisms (Herr et al., 2012; Thomas, 2014). Charities such as The Ocean Foundation and partners (www.seagrassgrow.org) have developed a Blue Carbon calculator that determines CO2 emission reduction offsets in terms of the protection and restoration of seagrass meadows (a method pending formal approval by the VCS). Collectively, developments such as the Blue Carbon portal (www.bluecarbonportal.org) and work by Bredbenner (2013) and Thomas (2014) have demonstrated the current global extent of Blue Carbon activities. In particular, significant work remains to establish a functioning global network of fully implemented Blue Carbon programmes involving the active transfer of carbon credits (Locatelli et al., 2014). In this regard, securing private financing of Blue Carbon activities will become increasingly important (Thomas, 2014). Presently, Blue Carbon programs are predominantly research-oriented, in the early stages of development and mangrove-focused, with few directed efforts toward seagrass ecosystems (Table 5) (Bredbenner, 2013).
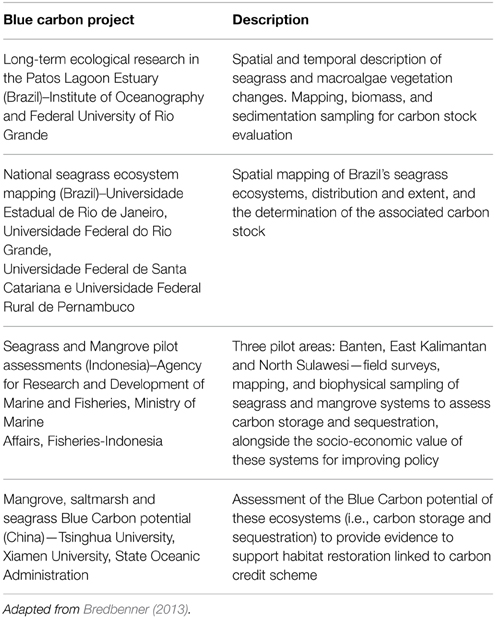
Table 5. Seagrass-related blue carbon initiatives.
Seagrass Habitats: Prospects for PES
Here we explore opportunities for developing seagrass PES programmes. The options we describe should be seen as working in tandem with carbon-credit schemes not as mutually exclusive alternatives.
A Brief Explanation of PES
PES programs are marketed as win-win opportunities, supporting conservation and the sustainable use of natural resources while improving rural livelihoods (van Noordwijk et al., 2007; Muradian and Rival, 2012; Pokorny et al., 2012). Yet, what constitutes PES, both in theory and practice, and PES success is open to debate (e.g., Wunder, 2005; Farley and Costanza, 2010; Muradian et al., 2010; Hejnowicz et al., 2014). This is largely due to the plurality of financial arrangements underpinning PES schemes, which include government-financed, user-financed or hybrid co-financed arrangements, often involving external donors, such that the ways in which they function do not conform to a single operational standard (Schomers and Matzdorf, 2013). Financially speaking, however, they can (generally) be thought of as a form of direct payment based on the beneficiary pays principle (Parker and Cranford, 2010). Within typical PES programs (Lin and Nakamura, 2012; Tacconi, 2012; Derissen and Latacz-Lohmann, 2013; Martin-Ortega et al., 2013), ES providers (e.g., landholders, farmers or communities) voluntarily participate in a program whereby they receive payments from ES buyers (e.g., a government, a utility or private organization). Transactions are facilitated by a single or multiple set of intermediary actors (e.g., a semi-autonomous body or non-governmental organization). In return for payments, providers adopt alternative land-use practices and management strategies that can secure and deliver a set of important ES to a wider beneficiary population.
Institutionally, PES programs are generally framed as decentralized instruments favoring bottom-up solutions to land management issues (Landell-Mills and Porras, 2002; Bond and Mayers, 2010). Despite the diversity of contexts in which PES schemes operate, they tend to adopt common modes of activity such as restricting agricultural development, proposing alternative cropping arrangements, reducing deforestation, and expanding forests (e.g., reforestation and afforestation), or protecting watershed and hydrological services (e.g., Asquith et al., 2008; Bennett, 2008; Muňoz-Piňa et al., 2008; Wunder and Albán, 2008; Porras, 2010; World Bank, 2010; Kolinjivadi and Sunderland, 2012). Consequently, PES involves multiple partners across sectors as well as spanning spatial and temporal scales (Schomers and Matzdorf, 2013). To function properly, schemes need to be acceptable to stakeholders, take the form of contractual obligations to which all participating parties agree, have specified objectives, be operationally transparent, and provide payments (in monetary or in-kind terms) to ES providers that account for (ideally) the full range of their opportunity costs (Wunder et al., 2008; Bosselmann and Lund, 2013; Hejnowicz et al., 2014).
PES Case Studies and Some Considerations
Examples relevant to guiding the development of seagrass payment schemes need to involve community approaches to natural resource management, as well as the provision of multiple ES with a focus on carbon management (e.g., Fisher et al., 2010; Table S2 Supplementary Material). Schemes seeking to deliver multiple ES via incentive mechanisms must also tackle the issue of stacking and bundling (Box 1). That is to say, determining what ES are to be provided, whether they will be paid for individually (i.e., stacked) or collectively (i.e., bundled), and what form payments will take (Bianco, 2009; Ingram, 2012). Additionally, PES programs need to ensure that as part of their design and implementation they maximize biodiversity and social co-benefits by adopting a decoupled approach to benefit maximization (recognizing individual ES properties and spatial attributes), ensuring management decisions account for internal and external costs, and increasing social co-benefit provision by concentrating on economic and cultural context (Phelps et al., 2012; Greiner and Stanley, 2013; Potts et al., 2013).
Box 1. Stacking and bundling ecosystem services.
Stacking refers to the receipt of multiple payments for different ES provided from a single plot or parcel (Bianco, 2009; Cooley and Olander, 2012). Cooley and Olander (2012) recognize three forms of stacking, namely: horizontal (whereby individual management practices performed on spatially distinct areas each receive a payment); vertical (where a single management practice employed on spatially overlapping areas receives multiple payments) and temporal (essentially a vertical form of stacking where payments are disbursed over time according to the production of different ES).
Advantages of stacking: (i) delivers management that provides multiple services from programs concerned with specific services; (ii) potentially increases programme uptake rates and therefore ES provision, (iii) encourages large-scale projects that could not operate through single payments e.g., wetland restoration, (iv) may increase buyer diversification, and (v) incrementally stacking payments in an optimum way for a particular project can help raise necessary funds (Bianco, 2009; Cooley and Olander, 2012; Robert and Stenger, 2013).
Disadvantages of stacking: (i) stacking can make it difficult to demonstrate how ES delivered by mitigation projects have abated environmental impacts allowed through offset sales; (ii) stacking may undermine project “additionality” e.g., if payments are more than that required to initiate a project, or are for an activity that would have occurred in the absence of the project, and (iii) stacking indirectly encourages “double counting”—paying twice for (in essence) the same service where similar services overlap e.g., water quality credits and wetland mitigation credits (Bianco, 2009; Cooley and Olander, 2012).
In the case of bundling, single payments are received for the provision of multiple ES from an individual parcel—importantly payment amounts are not (generally speaking) based on the summation of the individual values of each ES (Cooley and Olander, 2012).
Advantages of bundling: (i) recognizes the interconnectedness of ES processes and production; (ii) is beneficial for biodiversity and conservation (where broad conservation outcomes are sought); (iii) may increase the overall provision of individual ES from a parcel; (iv) can reduce administrative and transaction costs and raise price premiums, and (v) may reduce the degree of infrastructure needed to support a functioning market (Greenhalgh, 2008; Wendland et al., 2010; Deal et al., 2012; Robert and Stenger, 2013).
Disadvantages of bundling: (i) optimizing multiple ES is difficult and given the uncertainty regarding quantification may lead to unintended trade-offs; (ii) limited knowledge concerning ES provision means accurately modeling ES spatial delivery and distribution is highly complex; (iii) regulatory requirements may mean that it is necessary to “unbundle” specific services from the broader set; (iv) it can be difficult to demonstrate additionality and mitigate against double counting, and (v) performance related payments can be difficult to manage as ES bundle provision varies with time (Greenhalgh, 2008; Wendland et al., 2010; Deal et al., 2012; Robert and Stenger, 2013).
Projects that employ either stacking or bundling need to ensure they have resolved the issues of additionality and double counting before proceeding (Bianco, 2009).
Seagrass PES Scheme Options
Regulating Fisheries and Developing Protected Areas
Many possible institutions are available to control and direct fishing activities along coasts and marine ecosystems (Rudd, 2004). They may involve fishing gear and net restrictions, limiting fishing permits to local residents and restricting the exploitation of connected habitats while providing alternative income generating projects and “legal” fishing equipment (e.g., Mnazi Bay Ruvuma Estuary Marine Park, Tanzania—Albers et al., 2012; Mohammed, 2012). Enforcing closed fishing seasons while providing wage supplements to fishers to offset opportunity costs resulting from deferred fishing activities is another approach (e.g., the defeso system in Brazil—Begossi et al., 2011, 2012). Seagrass PES schemes may often involve creating marine protected areas (MPAs), safeguarding the underlying resource base supporting coastal communities and compensating local fishers for lost income resulting from harvesting restrictions (Table 6). Designating “no-take-zones” to increase habitat cover and fish stocks, and compensating fishers for lost income is a strategy that some external non-governmental organization (NGO) donors have used (e.g., Kuruwitu Conservation and Welfare Association in Kenya—Mohammed, 2012). Setting up seagrass PES schemes requires research in a number of areas identified as priorities (Rudd, 2014), including the role of MPAs on ecological resilience (ranked 30th) and their effect on human well-being (ranked 45th). Questions regarding compliance with rules (ranked 58th) and the capacity of communities to manage their coasts (ranked 56th) also demonstrate the potential value of seagrass PES development beyond the sector, as programs provide valuable opportunities to learn broad lessons about the interactions between social and ecological systems.
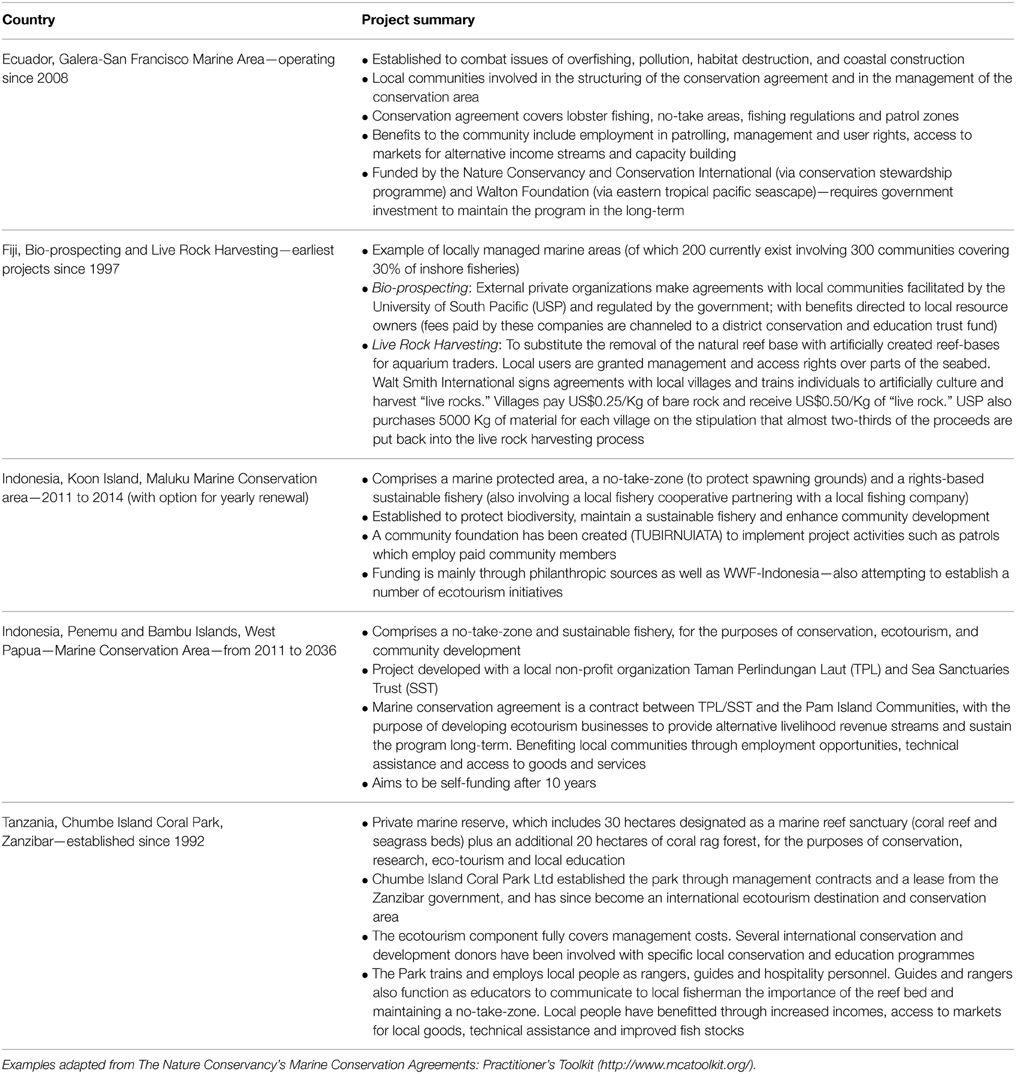
Table 6. Examples of marine conservation agreements securing coastal conservation and livelihood development opportunities.
Ecotourism
MPA managers and coastal businesses may establish “green” levies or taxes for resort tourists and charge user-fees for diving access and licenses. Revenues generated by these charges can be re-invested to support continued management activities to enforce the operating rules and ensure compliance, conserve and restore seagrass beds, and create employment opportunities for local community members (Lutz, 2011). In this respect, participation of the private sector can be transformative for scheme development by acting as a powerful ally in conservation outreach, providing new sources of financial support and creating employment and income opportunities alongside appropriate public sector institutions (e.g., the Indonesian Yayasan Karang Lestari coral restoration project and Marin tourism park on the island of Gili Trawangan—Bottema and Bush, 2012).
Linking Farming, Industry and Watershed and Coastal Management
Eutrophication and hypoxia resulting from nutrient loading and upland pollution are significant threats to the health of seagrass ecosystems (Waycott et al., 2009; Short et al., 2011, 2014). Because upstream land-use activities can negatively affect seagrass ecosystems (Freeman et al., 2008; Rivera-Guzmán et al., 2014) the conditions necessary for formulating watershed payment schemes are rife (Porras et al., 2013). This may involve cross-sector collaborative partnerships between local and international NGOs, who are often project initiators and intermediary facilitators, working together with public utilities, private firms and government organizations acting as ES buyers (Porras et al., 2008; Schomers and Matzdorf, 2013). Benefits to water quality and reduced water treatment costs save public utilities and private firms significant financial outlays, which may then be channeled into project start-up costs and payments for participants. Examples include the equitable PES schemes for watershed services in Tanzania and Honduras (Kosoy et al., 2007; CARE, 2009; Branca et al., 2011). Collectively, these examples highlight the integrated nature of coastal and terrestrial systems and demonstrate that PES schemes which acknowledge these interactions begin to address Rudd's (2004) questions on “upland hydrology effects on oceans” and “integrated upland coastal management” ranked (24th) and (43rd) overall.
Biodiversity Conservation
Many turtle populations nest in coastal regions supported by seagrass ecosystems (Cullen-Unsworth and Unsworth, 2013). These iconic and charismatic species are increasingly threatened by poaching and so ensuring healthy nesting populations is vital (Koch et al., 2006). Protecting seagrass ecosystems may be a cost-effective and financially viable option for sea turtle conservation. Paying locals to monitor nesting sites and fisherman for releasing live turtles caught in fishing gear provides a direct and additional income stream for local communities (Ferraro, 2009; Mohammed, 2012). In nesting projects locals usually receive two payments: a flat fee for identifying nest locations; and a variable payment based on hatching success. Successful examples include Natamu Turtle Watch and Knunga Marine National Reserve Conservation and Development Project in Kenya and Sea Sense on Mafia Island in Tanzania (Ferraro, 2009).
Due to positive willingness to pay (WTP) for sea turtle conservation among citizens of developed countries (e.g., Rudd, 2009), there are also opportunities for developing international PES schemes that transfer funds from developed countries, where WTP for iconic species conservation is high, to developing countries where turtle nesting grounds and critical life stages occur. For other seagrass-dependent iconic species that enjoy an international profile, there may be similar opportunities as for sea turtles. Seagrass ecosystem conservation and management may thus provide lessons in how triage decisions for species at risk (ranked 32nd, Rudd, 2014) are conceptualized and implemented (Hughes et al., 2009).
Importantly the relationship between iconic species and seagrass meadows is highly dynamic. For example, in Australia it has been shown that dugong grazing intensity can impact the composition of seagrass meadow beds and their capacity to recover (Preen, 1995). It is therefore imperative for conservation measures to adequately account for these potential negative impacts on the long-term condition of seagrass meadows, which may arise from population increases in iconic grazing species as a result of triage programmes.
Restoration
Seagrass ecosystems are declining yearly (Unsworth et al., 2014). To reverse this global trend seagrass restoration (in suitable areas) offers an effective means to rehabilitate carbon stores and sinks (Duarte et al., 2013c) whilst enhancing other equally important ecosystem services (Greiner et al., 2013). A recent seagrass restoration CO2 accumulation model, examining long-term trends in carbon sequestration for several commonly planted seagrass species, demonstrated that at an optimal density carbon accumulation of 177–1337 t CO2 ha−1 after 50 years could be achieved (Duarte et al., 2013c). However, although seagrass restoration has a relatively long history, particularly in the USA, it still remains limited in scope and success (Fonseca, 2011). Nevertheless, the importance of restoration activities for coastal management has been highlighted by Rudd (2014), with the ocean priority research question addressing “restoration effectiveness” ranking (29th). Restoration programs also provide opportunities to generate significant socio-economic benefits.
However, seagrass restoration costs can be expensive. In the USA, projected costs were estimated at between US$593,000 and US$970,000 (1996 US$) per hectare (author's conversion) once mapping and ground-truthing, planting, monitoring, contracting, and government oversight were included (Fonseca, 2006). In addition, restoration programs suffer from a number of challenges associated with validation (i.e., monitoring), site selection, artificial colonization methods, management processes and lack of adequate scientific knowledge regarding seagrass ecology (Fonseca, 2011). Nonetheless, with respect to restoration program outlays, recent estimates in Australia have suggested somewhat more feasible restoration costs of between AUS$10,000 and AUS$629,000 per hectare, with investments in restoration at the lower end implying pay-back times of 5 years or less (Blandon and zu Ermgassen, 2014). This is further supported by the work of Duarte et al. (2013c), which suggests that due to the value associated with the sequestered carbon restoration programs may be able to recover between US$12,000 and US$43,000 ha−1 (constant dollars), enabling the recovery of full program costs where a carbon tax is in place. Furthermore, most restoration programs are likely to be undertaken in developing countries where capital and labor costs are much less prohibitive (Duarte et al., 2013c).
The Swahili Seas Mikoko Pamoja project (2010–2013) provides a successful example of a wetland restoration carbon finance program operating in a developing country context. Active in Gazi Bay, Kenya, the Mikoko Pamoja project has established a mangrove conservation and restoration program focused on the carbon storage value of mangroves to benefit poor coastal communities. The program operates an accredited Plan Vivo carbon credit scheme providing US$13,000 annually, which is disbursed to conservation activities and community development projects. Moreover, since 2012 one of the project partner's, Earthwatch Institute, has employed local residents and volunteers to participate in mangrove management and restoration activities covering over 600 hectares. Finally, the project has also engaged in a number of capacity building initiatives through the provision of additional training and networking facilities (UNEP and CIFOR, 2014).
Possibilities for Implementing Seagrass Conservation Mechanisms
Deciding on the basic operational parameters for a PES program is only half the challenge; the other is to consider how broader institutional and governance elements weave together to influence scheme developments and outcomes: issues that need to be tackled at the design and implementation stage to ensure lasting results (Lin and Nakamura, 2012; Lin and Ueta, 2012). Collectively, these issues are intimately linked to three of the priority research questions identified by Rudd (2014), namely: “management capacity of human communities” (ranked 56th), “transaction costs of ocean management” (ranked 57th) and “property rights and conservation” (ranked 66th). Below we identify some of the most salient issues, incorporating insights from REDD+ and coastal resource management. As AGEDI (2014 : 10) note, “Blue Carbon and PES project developers have the opportunity to learn from the challenges and successful outcomes from REDD+ projects that feature similar project elements.”
Institutions
Effective institutions are crucial to the successful implementation of incentive schemes and the resolution of coastal management problems (Rudd et al., 2003; Imperial, 2005; Schomers and Matzdorf, 2013; Somorin et al., 2014). In the process of establishing effective institutions the development of institutional flexibility is particularly important, as this enables programs to respond adaptively over time to changing circumstances and thus maintain their efficacy (Larson and Soto, 2008; Murdiyarso et al., 2012). Securing institutional flexibility requires program arrangements that foster active connections and relations between actors, strong leadership and feedbacks in learning systems (Cox et al., 2010; Garbach et al., 2012; Legrand et al., 2013; Giest and Howlett, 2014).
In order to deliver these, programs need to be based on a platform of transparency, accountability and inclusivity (Lockwood et al., 2010; Larsen et al., 2011; Ingram et al., 2014). These aspects function as enabling properties, and the evidence clearly indicates that a lack of transparency and accountability can seriously impair institutional capacity and effectiveness (Somorin et al., 2014), whilst also undermining social capital (Rudd et al., 2003; Shiferaw et al., 2008). In addition, programs that fail to consider the issue of inclusivity can ultimately disempower participant groups, and as a consequence, embed benefit sharing inequalities between households and communities (Krause et al., 2013).
Stakeholders and Participation
Devolving decision-making to stakeholder groups can be enormously beneficial (Larson and Soto, 2008), at once enhancing and strengthening intra-community ties as well as a sense of common identity (Rudd et al., 2003). Conversely, centralized administration can often stifle local-scale innovations and the development of shared visions (Pokorny et al., 2013). Programs need to engage and connect with local stakeholders in order to maximize participation, which is central to providing effective management (Agrawal and Chhatre, 2006; Benjamin, 2008). Doing so legitimizes decision-making and empowers individual and collective agency enabling the design process to align with, and support, local norms, values and beliefs (Kanowski et al., 2011; Brooks et al., 2012; Corbera, 2012; Bremer and Glavovic, 2013). This is essential for participant commitment (Murdiyarso et al., 2012; Davenport and Seekamp, 2013) and acknowledges the relevance for effective governance of local users' knowledge (Andersson et al., 2014).
These processes can be supported by clarifying stakeholder roles and responsibilities and promoting leadership (Chhatre et al., 2012; Dent, 2012). Leadership, and especially local leadership, has been shown to be fundamental to delivering successful coastal management (Sutton and Rudd, 2014). Finally, it is important to acknowledge how participation is framed in the context of power relations, as these can represent potent forces capable of distorting the meaningful involvement, agency and legitimacy of grassroots actors (Dewulf et al., 2011; Cook et al., 2013).
Tenure and Property Rights
Ownership in developing countries is often complicated by overlapping formal and informal (customary) tenure and rights-based arrangements (Awono et al., 2014; Resosudarmo et al., 2014; Rights and Resources Initiative, 2014; Sunderlin et al., 2014). Clearly defining, legitimizing and enabling functioning property rights systems is essential for operationalizing incentive programs (Lockie, 2013). Such clarifications are critical for conditional payments where knowing who to pay (i.e., the right holder) and who is accountable for delivering project-level outcomes is necessary (Visseren-Hamakers et al., 2012; Duchelle et al., 2014; Sunderlin et al., 2014). Functioning tenure and rights-based systems also provide the framework to enforce property rights, securing contracts (Naughton-Treves and Wendland, 2014) and combating weak governance (Resosudarmo et al., 2014).
This is particularly pertinent to coastal marine environments where complications concerning tenure, rights designations and authority are a direct challenge to introducing and enforcing incentive schemes (Mohammed, 2012), a state of affairs clearly linked to the ambiguities regarding property rights in coastal areas and the variety of users and user interests (Cicin-Sain, 1993). As part of the design process it is crucial to mitigate potential mismatches arising between the provision, delivery and bundle of property rights to reduce the likelihood of marine resource conflicts developing (Yandle, 2007), as well as to ensure that poorer sectors are not marginalized or power asymmetries and social inequalities reinforced (WRI 2005; Fisher et al., 2008).
Benefit Sharing
Distributing benefits and costs in a fair and equitable way is a fundamental aspect of delivering socially acceptable incentive schemes (McDermott et al., 2012; Rodríguez de Francisco et al., 2013). Traditionally, equity concerns have been side-lined in favor of a greater emphasis and focus on efficiency maximization (Pascual et al., 2010; Narloch et al., 2011, 2013). However, this trade-off can produce socially undesirable outcomes (Asquith et al., 2008). Incorporating social parameters in the targeting of schemes in order to widen access and participation whilst reducing the marginalization of poorer communities represents an important first step in reversing these potential trade-offs (Mahanty et al., 2013). These processes need to proceed in tandem with beneficiary identification and the evaluation of the potential socio-economic ramifications of ES provision and distribution (Willemen et al., 2013). Additional considerations for effective benefit sharing include legitimizing decision-making processes via legal and procedural avenues (Murdiyarso et al., 2012); adjusting compensation levels according to the capacity needs of individuals, households and communities (Mohammed, 2012); and addressing the potential socio-economic impacts of programs on non-participants (Huang et al., 2009).
Delivering Ecosystem Services, Monitoring, and Compliance
The central tenant of incentive schemes relates the provision of specified outputs to agreement obligations and payments (Ferraro, 2008; Wunder et al., 2008). Consequently, monitoring and compliance represent key contractual conditions for programs to deliver their principal objectives (Danielsen et al., 2013; Hejnowicz et al., 2014). These can be distilled into four broad areas:
First, measuring ES provision (Porras et al., 2013). This reduces the likelihood of producing a false picture of service provision, and provides a scientifically robust case for PES program design (Hejnowicz et al., 2014). It has been suggested that even though coastal systems may be data poor, there is sufficient knowledge of the management activities that improve resource protection and ES provision (Lau, 2013). Second, evaluating scheme additionality and demonstrating “added value” by addressing the links between management interventions and program delivery (Ghazoul et al., 2010). Validating additionality requires baseline data, suitable metrics and performance indicators plus the targeting of PES to locations likely to maximize program benefits (Wünscher et al., 2008; Sommerville et al., 2011; Wünscher and Engel, 2012; Lau, 2013).
Third, assessing potential of spill-over effects (i.e., leakage) resulting from program implementation that may offset additionality gains (Engel et al., 2008; Porras et al., 2013). Fourth, monitoring contract conditionality and ensuring compliance (Ferraro, 2008). This requires establishing who is monitoring (i.e., users, communities or officials) and how frequently (Sommerville et al., 2011), providing sufficient payments to programme participants (Porras et al., 2013), and ensuring agreements are long-term arrangements with enforceable penalties for breaches of contract (Ferraro, 2008; Wunder et al., 2008). All have substantive effects on transaction costs of governance (ranked 57th, Rudd, 2014) and will influence the long-term viability of PES structures.
Costs and Funding
The viability of PES programs relies upon consistent and sufficient financial flows, both in the short-term (i.e., covering costs needed to initiate and implement a project) and the long-term (i.e., securing the funds necessary to sustain an active project), without which lasting transformative change cannot be achieved (Hejnowicz et al., 2014; Kauffman, 2014). Programs need to be designed so that they sustain themselves through self-generated revenues (Pirard et al., 2010). An added complication for seagrass PES schemes is that monitoring and enforcement in marine and coastal environments may require extra technical and specialist equipment not needed in the terrestrial sphere, adding significantly to program outlays (Lau, 2013). Securing long-term funding that reduces fiscal constraints but is not overly reliant on external donor funding is particularly important (Fauzi and Anna, 2013; Hein et al., 2013). Achieving both these objectives requires adequately accounting for the full range of transaction costs, which in some cases may be prohibitive for PES development (McCann et al., 2005; Marshall, 2013; McCann, 2013).
Conclusions
Seagrass ecosystems provide an array of globally and locally significant ecosystem services. From the perspective of climate change, it is their carbon sequestration and storage potential that is most attractive. Seagrass ecosystems are also home to diverse marine life that can directly or indirectly support the artisanal and commercial fisheries that help maintain resilience in human communities. In addition, they also play an important role in the conservation and maintenance of marine biological diversity and influence national or international non-market benefits deriving from endangered species such as sea turtles (Rudd, 2009). We have examined the prospects for financing seagrass conservation under a purely carbon approach and in conjunction with PES schemes that could help capture the benefits derived from multiple ecosystem services beyond carbon sequestration.
The prospects for developing a pure carbon credit scheme remain slim, especially if targeted at the regulatory carbon market. Opportunities exist, however, for VCM schemes and these are far more promising. However, the instability of the VCM and the impact this has on carbon prices makes a purely carbon-based approach questionable; fluctuating carbon prices mean projects cannot guarantee financial returns on investment or adequate payments to meet participants' needs. Nonetheless, voluntary carbon standards are channeling more effort into delivering co-benefits and, from this perspective, seagrass PES schemes may be highly complementary. Adopting a combined strategy would maximize conservation and livelihood outcomes so long as the design, implementation and institutional issues previously highlighted were adequately dealt with.
Providing the scientific evidence base for complex incentive schemes is challenging. This is particularly so with Blue Carbon systems where there remain many ecological, social, and economic knowledge gaps that need to be negotiated in order to develop functional payment programs. However, we have mapped out what those potential knowledge gaps are in relation to seagrass ecosystems, in terms of basic ecosystem function-service information, ecosystem service valuation and research concerning the governance structures and apparatus through which incentive schemes would need to operate. In so doing we have highlighted the importance and complexity of seagrass ecosystems and the value of conserving them. At the same time we have clearly identified how by conserving these systems, particularly through the use of innovative financial incentive mechanisms, we are also contributing to a broader set of significant global ocean priority research challenges.
Overall, a wide range of opportunities exist for including seagrass meadows in local PES schemes to combat climate change, secure seagrass conservation and enhance coastal community development. However, realizing the “true” potential of seagrass meadows requires international cooperation on two fronts: combating the threats that currently imperil the integrity of functioning seagrass ecosystems and including them in formal climate change policies such as REDD+. In this respect challenges and barriers remain but promising progress is being made; efforts to protect and rehabilitate seagrass ecosystems are crucial because of their widespread distribution, their central role in supporting functional coastal environments and the human communities that rely on those systems.
Conflict of Interest Statement
The authors declare that the research was conducted in the absence of any commercial or financial relationships that could be construed as a potential conflict of interest.
Acknowledgments
This article is based on research undertaken for “CESEA–Coastal Ecosystem Services in East Africa NE/L001535/1research project” and was funded with support from the Ecosystem Services for Poverty Alleviation (ESPA) programme. The ESPA programme is funded by the Department for International Development (DFID), the Economic and Social Research Council (ESRC), and the Natural Environment Research Council (NERC). The first author (AH) also wishes to acknowledge the financial support of the ESRC and NERC (Ref: ES/I003851/1) for jointly funding his PhD, which also helped to make this work possible.
Supplementary Material
The Supplementary Material for this article can be found online at: http://journal.frontiersin.org/article/10.3389/fmars.2015.00032/abstract
Figure S1. Ecosystem service valuation framework. Adapted from Vo et al. (2012) and TEEB (2010).
Table S1. Ecosystem Service Valuation Methods.
Table S2. PES schemes with a carbon management aspect.
References
Agrawal, A., and Chhatre, A. (2006). Explaining success on the commons: community forest governance in the Indian Himalaya. World Dev. 34, 149–166. doi: 10.1016/j.worlddev.2005.07.013
Albers, H. J., Robinson, E. J. Z., and January, S. K. (2012). Managing Marine Protected Areas Through Incentives to Local People: The Case of Mnazi Bay Ruvuma Estuary Marine Park. Gothenburg: Environment for Development Initiative, University of Gothenburg.
Andersson, K., Benavides, J. P., and León, R. (2014). Institutional diversity and local forest governance. Environ. Sci. Policy 36, 61–72. doi: 10.1016/j.envsci.2013.07.009
Asquith, N. M., Vargas, M. V., and Wunder, S. (2008). Selling two environmental services: in-kind payments for bird habitat and watershed protection in Los Negros, Bolivia. Ecol. Econ. 65, 675–684. doi: 10.1016/j.ecolecon.2007.12.014
Awono, A., Somorin, O. A., Eba'a Atyi, R., and Levang, P. (2014). Tenure and participation in local REDD+ projects: insights from Southern Cameroon. Environ. Sci. Policy 35, 76–86. doi: 10.1016/j.envsci.2013.01.017
Baker, S., Paddock, J., Smith, A. M., Unsworth, R. K. F., Cullen-Unsworth, L. C., and Hertler, H. (2015). An ecosystems perspective for food security in the Caribbean: seagrass meadows in the Turks and Caicos Islands. Ecosyst. Serv. 11, 12–21. doi: 10.1016/j.ecoser.2014.07.011
Baldwin, K., and Oxenford, H. A. (2014). A participatory approach to marine habitat mapping in the Grenadine Islands. Coast. Manag. 42, 36–58. doi: 10.1080/08920753.2013.863725
Baldwin, K., Mahon, R., and McConney, P. (2013). Participatory GIS for strengthening transboundary marine governance in SIDS. Nat. Resour. Forum 37, 257–268. doi: 10.1111/1477-8947.12029
Barbier, E. B., Hacker, S. D., Kennedy, C., Koch, E. W., Stier, A. C., and Silliman, B. R. (2011). The value of estuarine and coastal ecosystem services. Ecol. Monogr. 81, 169–193. doi: 10.1890/10-1510.1
Barbier, E. B., Koch, E. W., Silliman, B. R., Hacker, S. D., Wolanski, E., Primavera, J. H., et al. (2008). Vegetation's role in coastal protection. Science 320, 176–177. doi: 10.1126/science.320.5873.176b
Barnes, R. (2013). Spatial stability of macrobenthic seagrass biodiversity. Mar. Ecol. Prog. Ser. 493, 127–139. doi: 10.3354/meps10546
Begossi, A., May, P. H., Lopes, P. F., Oliveira, L. E. C., da Vinha, V., and Silvano, R. A. M. (2011). Compensation for environmental services from artisanal fisheries in SE Brazil: policy and technical strategies. Ecol. Econ. 71, 25–32. doi: 10.1016/j.ecolecon.2011.09.008
Begossi, A., Salyvonchyk, S., Nora, V., Lopes, P. F., and Silvano, R. A. M. (2012). The Paraty artisanal fishery (Southeastern Brazilian coast): ethnoecology and management of a social-ecological system (SES). J. Ethnobiol. Ethnomed. 8, 22. doi: 10.1186/1746-4269-8-22
Bell, J. D., and Pollard, D. A. (1989). “Ecology of fish assemblages and fisheries associated with seagrasses,” in Biology of Seagrasses a Treatise on the Biology of Seagrasses with Special Reference to the Australian Region, eds A. W. D. Larkum, A. J. McComb, S. A. Shepherd (Amsterdam: Elsevier), 565–609.
Benessaiah, K. (2012). Carbon and livelihoods in post-Kyoto: assessing voluntary carbon markets. Ecol. Econ. 77, 1–6. doi: 10.1016/j.ecolecon.2012.02.022
Benjamin, C. E. (2008). Legal pluralism and decentralization: natural resource management in Mali. World Dev. 36, 2255–2276. doi: 10.1016/j.worlddev.2008.03.005
Bennett, M. T. (2008). China's sloping land conversion program: institutional innovations or business as usual? Ecol. Econ. 65, 699–711. doi: 10.1016/j.ecolecon.2007.09.017
Bianco, N. (2009). World Resources Institute Fact Sheet: Stacking Payments for Ecosystem Services. Washington, DC: World Resources Institute.
Blandon, A., and zu Ermgassen, P. S. E. (2014). Quantitative estimate of commercial fish enhancement by seagrass habitat in southern Australia. Estuarine Coast. Shelf Sci. 141, 1–8. doi: 10.1016/j.ecss.2014.01.009
Bond, I., and Mayers, J. (2010). Fair Deals for Watershed Services. London: International Institute for Environment and Development.
Bos, A. R., Bouma, T. J., de Kort, G. L. J., and van Katwijk, M. M. (2007). Ecosystem engineering by annual intertidal seagrass beds: sediment accretion and modification. Estuarine Coast. Shelf Sci. 74, 344–348. doi: 10.1016/j.ecss.2007.04.006
Bosire, J. O., Okemwa, G., and Ochiewo, J. (2012). Mangrove linkages to coral reef and seagrass ecosystem services in Mombasa and Takaungu, Kenya. London: Ecosystem Services Poverty Alleviation Programme.
Bosselmann, A. S., and Lund, J. F. (2013). Do intermediary institutions promote inclusiveness in PES programs? The case of Costa Rica. Geoforum 49, 50–60. doi: 10.1016/j.geoforum.2013.05.009
Bottema, M. J. M., and Bush, S. R. (2012). The durability of private sector marine conservation: a case study of two entrepreneurial marine protected areas in Indonesia. Ocean Coast. Manag. 61, 38–48. doi: 10.1016/j.ocecoaman.2012.01.004
Bouma, P. M., and Amos, C. L. (2012). Wave attenuation by submerged vegetation: combining the effect of organism traits and tidal current. Mar. Ecol. Prog. Ser. 444, 31–41. doi: 10.3354/meps09489
Branca, G., Lipper, L., Neves, B., Lopa, D., and Mwanyoka, I. (2011). Payments for watershed services supporting sustainable agricultural development in Tanzania. J. Environ. Dev. 20, 278–302. doi: 10.1177/1070496511415645
Brander, L. J., Wagtendonk, A. S., Hussain, S., McVittie, A., Verburg, P. H., de Groot, R. S., et al. (2012). Ecosystem service values for mangroves in Southeast Asia: a meta-analysis and value transfer application. Ecosyst. Serv. 1, 62–69. doi: 10.1016/j.ecoser.2012.06.003
Brander, L., Brouwer, R., and Wagtendonk, A. (2013). Economic valuation of regulating services provided by wetlands in agricultural landscapes: a meta-analysis. Ecol. Eng. 56, 89–96. doi: 10.1016/j.ecoleng.2012.12.104
Bredbenner, A. (2013). Profiles in Blue Carbon Field Work. A Report Commissioned by Conservation International.
Bremer, S., and Glavovic, B. (2013). Mobilizing knowledge for coastal governance: re-framing the science–policy interface for integrated coastal management. Coast. Manag. 41, 39–56. doi: 10.1080/08920753.2012.749751
Brondizio, E. S., Gatzweiler, F., Zagrafos, C., and Kumar, M. (2010). “Socio-cultural context of ecosystem and biodiversity valuation (Chapter 4)” in The Economics of Ecosystems and Biodiversity (TEEB). United Nations Environmental Programme and the European Commission, ed P. Kumar (London: Earthscan Press), 150–181.
Brooks, J. S., Waylen, K., and Borgerhoff Mulder, M. (2012). How national context, project design, and local community characteristics influence success in community-based conservation projects. Proc. Natl. Acad. Sci. U.S.A. 109, 21265–21270. doi: 10.1073/pnas.1207141110
Browne, C., Milne, R., Griffiths, C., Bolton, J., and Anderson, R. (2013). Epiphytic seaweeds and invertebrates associated with South African populations of the rocky shore seagrass Thalassodendron leptocaule—a hidden wealth of biodiversity. Afr. J. Mar. Sci. 35, 523–531. doi: 10.2989/1814232X.2013.864332
Bujang, J. S., Zakaria, M. H., and Arshad, A. (2006). Distribution and significance of seagrass ecosystems in Malaysia. Aquat. Ecosyst. Health Manag. 9, 203–214. doi: 10.1080/14634980600705576
Cabaço, S., Apostolaki, E. T., García-Marín, P., Gruber, R., Hernández, I., Martínez-Crego, B., et al. (2013). Effects of nutrient enrichment on seagrass population dynamics: evidence and synthesis from the biomass-density relationships. J. Ecol. 101, 1552–1562. doi: 10.1111/1365-2745.12134
Camacho-Valdez, V., Ruiz-Luna, A., Ghermandi, A., and Nunes, P. A. L. D. (2013). Valuation of ecosystem services provided by coastal wetlands in northwest Mexico. Ocean Coast. Manag. 78, 1–11. doi: 10.1016/j.ocecoaman.2013.02.017
CARE. (2009). CEPF Final Project Completion Report: Improving Rewards for Environmental Stewards in Equitable Payments for Watershed Service Scheme. CARE International, WWF.
Chhatre, A., Lakhanpal, S., Larson, A. M., Nelson, F., Ojha, H., and Rao, J. (2012). Social safeguards and co-benefits in REDD+: a review of the adjacent possible. Curr. Opin. Environ. Sustainability 4, 654–660. doi: 10.1016/j.cosust.2012.08.006
Chiu, S.-H., Huang, Y.-H., and Lin, H.-J. (2013). Carbon budget of leaves of the tropical intertidal seagrass Thalassia hemprichii. Estuarine Coast. Shelf Sci. 125, 27–35. doi: 10.1016/j.ecss.2013.03.026
Christianen, M. J. A., van Belzen, J., Herman, P. M. J., van Katwijk, M. M., Lamers, L. P. M., van Leent, P. J. M., et al. (2013). Low-canopy seagrass beds still provide important coastal protection services. PLoS ONE 8:e62413. doi: 10.1371/journal.pone.0062413
Cicin-Sain, B. (1993). Sustainable development and integrated coastal management. Ocean Coast. Manag. 21, 11–43. doi: 10.1016/0964-5691(93)90019-U
Cook, B. R., Kesby, M., Fazey, I., and Spray, C. (2013). The persistence of “normal” catchment management despite the participatory turn: exploring the power effects of competing frames of reference. Soc. Stud. Sci. 43, 754–779. doi: 10.1177/0306312713478670
Cooley, D., and Olander, L. (2012). Stacking ecosystem services payments: risks and solutions. Environ. Law Rep. 42, 10150–10165.
Corbera, E. (2012). Problematizing REDD+ as an experiment in payments for ecosystem services. Curr. Opin. Environ. Sustainability 4, 612–619. doi: 10.1016/j.cosust.2012.09.010
Costanza, R., de Groot, R., Sutton, P., van der Ploeg, S., Anderson, S. I., Kubiszewski, I., et al. (2014). Changes in the global value of ecosystem services. Global Environ. Change 26, 162–168. doi: 10.1016/j.gloenvcha.2014.04.002
Cox, M., Arnold, G., and Tomás, S. V. (2010). A review of design principles for community-based natural resource management. Ecol. Soc. 15:38. Available online at: http://www.ecologyandsociety.org/vol15/iss4/art38/
Cullen-Unsworth, L. C., Nordlund, L. M., Paddock, J., Baker, S., McKenzie, L. J., and Unsworth, R. K. F. (2014). Seagrass meadows globally as a coupled social-ecological system: implications for human wellbeing. Mar. Pollut. Bull. 83, 387–397. doi: 10.1016/j.marpolbul.2013.06.001
Cullen-Unsworth, L., and Unsworth, R. (2013). Seagrass meadows, ecosystem services, and sustainability. Environ. Sci. Policy Sustainable Dev. 55, 14–28. doi: 10.1080/00139157.2013.785864
Daby, D. (2003). Effects of seagrass bed removal for tourism purposes in a Mauritian bay. Environ. Pollut. 125, 313–324. doi: 10.1016/S0269-7491(03)00125-8
Danielsen, F., Adrian, T., and Brofeldt, S. (2013). Community monitoring for REDD+: international promises and field realities. Ecol. Soc. 18, 41. doi: 10.5751/ES-05464-180341
Davenport, M. A., and Seekamp, E. (2013). A multilevel community capacity model for sustainable watershed management. Soc. Nat. Resour. 26, 1101–1111. doi: 10.1080/08941920.2012.729650
de Boer, W. F. (2007). Seagrass–sediment interactions, positive feedbacks and critical thresholds for occurrence: a review. Hydrobiologia 591, 5–24. doi: 10.1007/s10750-007-0780-9
De la Torre-Castro, M., Di Carlo, G., and Jiddawi, N. S. (2014). Seagrass importance for a small-scale fishery in the tropics: the need for seascape management. Mar. Pollut. Bull. 83, 398–407. doi: 10.1016/j.marpolbul.2014.03.034
Deal, R. L., Cochran, B., and LaRocco, G. (2012). Bundling of ecosystem services to increase forestland value and enhance sustainable forest management. For. Policy Econ. 17, 69–76. doi: 10.1016/j.forpol.2011.12.007
Dekker, A. G., Brando, V. E., and Anstee, J. M. (2005). Retrospective seagrass change detection in a shallow coastal tidal Australian lake. Remote Sens. Environ. 97, 415–433. doi: 10.1016/j.rse.2005.02.017
Dendoncker, N., Keune, H., Jacobs, S., and Gómez-Baggethun, F. (2014). “Inclusive ecosystem service valuation,” in Ecosystem Services: Global Issues, Local Practices, eds S. Jacobs, N. Dendoncker, and H. Keune (San Diego, CA: Elsevier Inc), 3–12.
Dent, M. (2012). Catchment management agencies as crucibles in which to develop responsible leaders in South Africa. Water SA 38, 313–326. doi: 10.4314/wsa.v38i2.17
Derissen, S., and Latacz-Lohmann, U. (2013). What are PES? A review of definitions and an extension. Ecosyst. Serv. 6, 12–15. doi: 10.1016/j.ecoser.2013.02.002
Dewulf, A., Mancero, M., Cardenas, G., and Sucozhanay, D. (2011). Fragmentation and connection of frames in collaborative water governance: a case study of river catchment management in Southern Ecuador. Int. Rev. Adm. Sci. 77, 50–75. doi: 10.1177/0020852310390108
Duarte, C. M. (2002). The future of seagrass meadows. Environ. Conserv. 29, 192–206. doi: 10.1017/S0376892902000127
Duarte, C. M., and Chiscano, C. L. (1999). Seagrass biomass and production: a reassessment. Aquat. Bot. 65, 159–174. doi: 10.1016/S0304-3770(99)00038-8
Duarte, C. M., Kennedy, H., Marbà, N., and Hendriks, I. (2013a). Assessing the capacity of seagrass meadows for carbon burial: current limitations and future strategies. Ocean Coast. Manag. 83, 32–38. doi: 10.1016/j.ocecoaman.2011.09.001
Duarte, C. M., Losada, I. J., Hendriks, I. E., Mazarrasa, I., and Marbà, N. (2013b). The role of coastal plant communities for climate change mitigation and adaptation. Nat. Clim. Change 3, 961–968. doi: 10.1038/nclimate1970
Duarte, C. M., Marbà, N., Gacia, E., Fourqurean, J. W., Beggins, J., Barrón, C., et al. (2010). Seagrass community metabolism: assessing the carbon sink capacity of seagrass meadows. Glob. Biogeochem. Cycles 24:GB4032. doi: 10.1029/2010GB003793
Duarte, C. M., Middleburg, J. J., and Caraco, N. (2005). Major role of marine vegetation on the ocean carbon cycle. Biogeosciences 2, 1–8. doi: 10.5194/bg-2-1-2005
Duarte, C. M., Sintes, T., and Marbá, N. (2013c). Assessing the CO2 capture potential of seagrass restoration projects. J. Appl. Ecol. 50, 1341–1349. doi: 10.1111/1365-2664.12155
Duchelle, A. E., Cromberg, M., Gebara, M. F., Guerra, R., Melo, T., Larson, A., et al. (2014). Linking forest tenure reform, environmental compliance, and incentives: lessons from REDD+ initiatives in the Brazilian Amazon. World Dev. 55, 53–67. doi: 10.1016/j.worlddev.2013.01.014
Engel, S., Pagiola, S., and Wunder, S. (2008). Designing payments for environmental services in theory and practice: an overview of the issues. Ecol. Econ. 65, 663–674. doi: 10.1016/j.ecolecon.2008.03.011
Erftemeijer, P. L., and Lewis, R. R. R. (2006). Environmental impacts of dredging on seagrasses: a review. Mar. Pollut. Bull. 52, 1553–1572. doi: 10.1016/j.marpolbul.2006.09.006
Erftemeijer, P., and Shuail, D. (2012). Seagrass habitats in the Arabian Gulf: distribution, tolerance thresholds and threats. Aquat. Ecosyst. Health Manag. 15(Suppl. 1), 37–41. doi: 10.1080/14634988.2012.668479
Farina, S., Tomas, F., Prado, P., Romero, J., and Alcoverro, T. (2009). Seagrass meadow structure alters interactions between the sea urchin Paracentrotus lividus and its predators. Mar. Ecol. Prog. Ser. 377, 131–137. doi: 10.3354/meps07692
Farley, J., and Costanza, R. (2010). Payments for ecosystem services: from local to global. Ecol. Econ. 69, 2060–2068. doi: 10.1016/j.ecolecon.2010.06.010
Fauzi, A., and Anna, Z. (2013). The complexity of the institution of payment for environmental services: a case study of two Indonesian PES schemes. Ecosyst. Serv. 6, 54–63. doi: 10.1016/j.ecoser.2013.07.003
Ferraro, P. J. (2008). Asymmetric information and contract design for payments for environmental services. Ecol. Econ. 65, 810–821. doi: 10.1016/j.ecolecon.2007.07.029
Ferraro, P. J. (2009). A Global Survey of Sea Turtle Payment Incentive Programs. La Jolla, CA: National Oceanic and Atmospheric Administration.
Fisher, B., Kulindwa, K., Mwanyoka, I., Turner, R. K., and Burgess, N. D. (2010). Common pool resource management and PES: lessons and constraints for water PES in Tanzania. Ecol. Econ. 69, 1253–1261. doi: 10.1016/j.ecolecon.2009.11.008
Fisher, R., Maginnis, S., Jackson, W., Barrow, E., and Jeanrenaud, S. (2008). Linking Conservation and Poverty Reduction: Landscapes, People and Power. London: Earthscan.
Fonseca, M. S. (2006). “Wrap-up of seagrass restoration: success, failure and lessons about the costs of both,” in Seagrass Restoration: Success, Failure and the Costs of Both, eds S. F. Treat and R. R. III Lewis (Valrico, FL: Lewis Environmental Services, Inc.), 169–175.
Fonseca, M. S. (2011). Addy revisited: what has changed with seagrass restoration in 64 years? Ecol. Restor. 29, 73–81. doi: 10.1353/ecr.2011.0020
Fourqurean, J. W., Duarte, C. M., Kennedy, H., Marbà, N., Holmer, M., Mateo, M. A., et al. (2012). Seagrass ecosystems as a globally significant carbon stock. Nat. Geosci. 5, 505–509. doi: 10.1038/ngeo1477
Freeman, A. S., Short, F. T., Isnain, I., Razak, F. A., and Coles, R. G. (2008). Seagrass on the edge: land-use practices threaten coastal seagrass communities in Sabah, Malaysia. Biol. Conserv. 141, 2993–3005. doi: 10.1016/j.biocon.2008.09.018
Garbach, K., Lubell, M., and DeClerck, F. A. J. (2012). Payment for Ecosystem Services: the roles of positive incentives and information sharing in stimulating adoption of silvopastoral conservation practices. Agric. Ecosyst. Environ. 156, 27–36. doi: 10.1016/j.agee.2012.04.017
Ghazoul, J., Butler, R. A., Mateo-Vega, J., and Koh, L. P. (2010). REDD: a reckoning of environment and development implications. Trends Ecol. Evol. 25, 396–402. doi: 10.1016/j.tree.2010.03.005
Giest, S., and Howlett, M. (2014). Understanding the pre-conditions of commons governance: the role of network management. Environ. Sci. Policy 36, 37–47. doi: 10.1016/j.envsci.2013.07.010
Gómez-Baggethun, E., de Groot, R., Lomas, P. L., and Montes, C. (2010). The history of ecosystem services in economic theory and practice: from early notions to markets and payment schemes. Ecol. Econ. 69, 1209–1218. doi: 10.1016/j.ecolecon.2009.11.007
Gordon, D., Murray, B. C., Pendleton, L., and Victor, B. (2011). Financing Options for Blue Carbon: Opportunities and Lessons from REDD+ Experience. Report NI R II-II, Nicholas Institute for Environmental Policy Solutions, Duke University, Durham. Available online at: http://nicholasinstitute.duke.edu/sites/default/files/publications/financing-options-for-blue-carbon-paper.pdf (Accessed May 4, 2014).
Gowdy, J., and Baveye, P. C. (2014). “Monetary valuation of ecosystem services: unresolvable problems with the standard economic model,” in Ecosystem Services: Global Issues, Local Practices, eds S. Jacobs, N. Dendoncker, and H. Keune (San Diego, CA: Elsevier Inc.), 73–77.
Green, E. P., and Short, F. T. (2003). World Atlas of Seagrasses. Berkeley, CA: University of California Press.
Greenhalgh, S. (2008). “Bundled ecosystem markets - are they the future?” in American Agricultural Economics Association Annual Meeting (Orlando, FL). Available online at: http://ageconsearch.umn.edu/handle/6166
Greiner, J. T., McGlathery, K. J., Gunnell, J., and McKee, B. A. (2013). Seagrass restoration enhances “blue carbon” sequestration in coastal waters. PLoS ONE 8:e72469. doi: 10.1371/journal.pone.0072469
Greiner, R., and Stanley, O. (2013). More than money for conservation: exploring social co-benefits from PES schemes. Land Use Policy 31, 4–10. doi: 10.1016/j.landusepol.2011.11.012
Grimsditch, G. (2011). Options for blue carbon within the international climate change framework. Sustainable Dev. Law Policy 11, 22–24.
Gullström, M., Bodin, M., Nilsson, P. G., and Öhman, M. C. (2008). Seagrass structural complexity and landscape configuration as determinants of tropical fish assemblage composition. Mar. Ecol. Prog. Ser. 363, 241–255. doi: 10.3354/meps07427
Gullström, M., Lundén, B., Bodin, M., Kangwe, J., Öhman, M. C., Mtolera, M. S. P., et al. (2006). Assessment of changes in the seagrass-dominated submerged vegetation of tropical Chwaka Bay (Zanzibar) using satellite remote sensing. Estuarine Coast. Shelf Sci. 67, 399–408. doi: 10.1016/j.ecss.2005.11.020
Hansen, J. C. R., and Reidenbach, M. A. (2013). Seasonal growth and senescence of a Zostera marina seagrass meadow alters wave-dominated flow and sediment suspension within a coastal bay. Estuaries Coasts 36, 1099–1114. doi: 10.1007/s12237-013-9620-5
Heck, K. L. Jr., Carruthers, T. J. B., Duarte, C. M., Hughes, A. R., Kendrick, G., and Orth, R. J. (2008). Trophic transfers from seagrass meadows subsidize diverse marine and terrestrial consumers. Ecosystems 11, 1198–1210. doi: 10.1007/s10021-008-9155-y
Heck, K. L. Jr., Hays, G., and Orth, R. J. (2003). Critical evaluation of the nursery role hypothesis for seagrass meadows. Mar. Ecol. Prog. Ser. 253, 123–136. doi: 10.3354/meps253123
Hein, L., Miller, D. C., and de Groot, R. (2013). Payments for ecosystem services and the financing of global biodiversity conservation. Curr. Opin. Environ. Sustainability 5, 87–93. doi: 10.1016/j.cosust.2012.12.004
Hejnowicz, A. P., Raffaelli, D. G., Rudd, M. A., and White, P. C. L. (2014). Evaluating the outcomes of payments for ecosystem service programmes using a capital asset framework. Ecosyst. Serv. 9, 83–97. doi: 10.1016/j.ecoser.2014.05.001
Hendriks, I., Sintes, T., Bouma, T., and Duarte, C. (2008). Experimental assessment and modeling evaluation of the effects of the seagrass Posidonia oceanica on flow and particle trapping. Mar. Ecol. Prog. Ser. 356, 163–173. doi: 10.3354/meps07316
Herr, D., Pidgeon, E., and Laffoley, D. (2012). Blue Carbon Policy Framework 2.0: Based on the Discussion of the International Blue Carbon Policy Working Group. Gland; Arlington: IUCN; CI.
Hicks, C. C., and McClanahan, T. R. (2012). Assessing gear modifications needed to optimize yields in a heavily exploited, multi-species, seagrass and coral reef fishery. PLoS ONE 7:e36022. doi: 10.1371/journal.pone.0036022
Honda, K., Nakamura, Y., Nakaoka, M., Uy, W. H., and Fortes, M. D. (2013). Habitat use by fishes in coral reefs, seagrass beds and mangrove habitats in the Philippines. PLoS ONE 8:e65735. doi: 10.1371/journal.pone.0065735
Howard, R. K., Edgar, G. J., and Hutchings, P. A. (1989). “Faunal assemblages of seagrass beds,” in Biology of Seagrasses—a Treatise on the Biology of Seagrasses with Special Reference to the Australian Region, eds A. W. D. Larkum, A. J. McComb, and S. A. Sheperd (Amsterdam: Elsevier), 536–564
Huang, M., Upadhyaya, S. K., Jindal, R., and Kerr, J. (2009). Payments for watershed services in Asia: a review of current initiatives. J. Sustainable Forestry 28, 551–575. doi: 10.1080/10549810902794287
Hughes, A. R., Williams, S. L., Duarte, C. M., Heck, K. L. Jr., and Waycott, M. (2009). Associations of concern: declining seagrasses and threatened dependent species. Front. Ecol. Environ. 7, 242–246. doi: 10.1890/080041
Imperial, M. T. (2005). Using collaboration as a governance strategy: lessons from six watershed management programs. Adm. Soc. 37, 281–320. doi: 10.1177/0095399705276111
Ingram, J. C. (2012). Bundling and Stacking for Maximizing Social, Ecological and Economic Benefits: A Framing Paper for Discussion at the “Bundling and Stacking Workshop.” Available online at: http://rmportal.net/libr/content/translinks/translinks-2012/Wildlife%20Conservation%20Society/2012%20PES%20Bundling%20and%20Stacking%20Workshop%20(Washington,%20DC,%20USA)/Paper_PESBundlingandStacking.pdf/at_download/file (Accessed August 15, 2014).
Ingram, J. C., Wilkie, D., Clements, T., McNab, R. B., Nelson, F., and Baur, E. H. (2014). Evidence of payments for ecosystem services as a mechanism for supporting biodiversity conservation and rural livelihoods. Ecosyst. Serv. 7, 10–21. doi: 10.1016/j.ecoser.2013.12.003
IPCC. (2014). “Coastal wetlands,” in 2013 Supplement to the 2006 IPCC Guidelines for Natural Greenhouse Gas Inventories: Wetlands, eds T. Hiraishi, T. Krug, K. Tanabe, N. Srivastava, J. Baasansuren, M. Fukuda, et al. (Switzerland: IPCC), 354.
Jackson, E. L., Rowden, A. A., Attrill, M. J., et al. (2001). The importance of seagrass beds as a habitat for fishery species. Oceanogr. Mar. Biol. 39, 269–303.
James, G. K., Adegoke, J. O., Osagie, S., Ekechukwu, S., Nwilo, P., and Akinyede, J. (2013). Social valuation of mangroves in the Niger Delta region of Nigeria. Int. J. Biodivers. Sci. Ecosyst. Serv. Manage. 9, 311–323. doi: 10.1080/21513732.2013.842611
Jaxion-Harm, J., Saunders, J., and Speight, M. R. (2012). Distribution of fish in seagrass, mangroves and coral reefs: life-stage dependent habitat use in Honduras. Rev. Biol. Trop. 60, 683–698. doi: 10.15517/rbt.v60i2.3984
Johnston, R. J., Besedin, E. Y., Iovanna, R., Miller, C. J., Wardwell, R. F., and Ranson, M. H. (2005). Systematic variation in willingness to pay for aquatic resource improvements and implications for benefit transfer: a meta-analysis. Can. J. Agric. Econ. 53, 221–248. doi: 10.1111/j.1744-7976.2005.04018.x
Kakuru, W., Turyahabwe, N., and Mugisha, J. (2013). Total economic value of wetlands products and services in Uganda. Sci. World J. 2013:192656. doi: 10.1155/2013/192656
Kamimura, Y., Kasai, A., and Shoji, J. (2011). Production and prey source of juvenile black rockfish Sebastes cheni in a seagrass and macroalgal bed in the Seto Inland Sea, Japan: estimation of the economic value of a nursery. Aquat. Ecol. 45, 367–376. doi: 10.1007/s10452-011-9360-1
Kanowski, P. J., McDermott, C., and Cashore, B. W. (2011). Implementing REDD+: lessons from analysis of forest governance. Environ. Sci. Policy 14, 111–117. doi: 10.1016/j.envsci.2010.11.007
Kauffman, C. M. (2014). Financing watershed conservation: lessons from Ecuador's evolving water trust funds. Agric. Water Manage. 145, 39–49. doi: 10.1016/j.agwat.2013.09.013
Kennedy, H., Beggins, J., Duarte, C. M., Fourqurean, J. W., Holmer, M., and Marbà, N. (2010). Seagrass sediments as a global carbon sink: isotopic constraints. Global Biogeochem. Cycles 24:GB4026. doi: 10.1029/2010GB003848
Kibicho, W. (2008). Community-based tourism: a factor-cluster segmentation approach. J. Sustainable Tourism 16, 211–231. doi: 10.2167/jost623.0
Kirwan, M. L., and Megonigal, J. P. (2013). Tidal wetland stability in the face of human impacts and sea-level rise. Nature 504, 53–60. doi: 10.1038/nature12856
Koch, V., Nichols, W. J., Peckham, H., and de la Toba, V. (2006). Estimates of sea turtle mortality from poaching and bycatch in Bahía Magdalena, Baja California Sur, Mexico. Biol. Conserv. 128, 327–334. doi: 10.1016/j.biocon.2005.09.038
Kolinjivadi, V., and Sunderland, T. (2012). A review of two payment schemes for watershed services from China and Vietnam: the interface of government control and PES theory. Ecol. Soc. 17:10. doi: 10.5751/ES-05057-170410
Kosoy, N., and Corbera, E. (2010). Payment for ecosystem services as commodity fetishism. Ecol. Econ. 69, 1228–1236 doi: 10.1016/j.ecolecon.2009.11.002
Kosoy, N., Martinez-Tuna, M., Muradian, R., and Martínez-Alier, J. (2007). Payments for environmental services in watershed: insights from a comparative study of three cases in Central America. Ecol. Econ. 61, 446–455. doi: 10.1016/j.ecolecon.2006.03.016
Krause, T., Collen, W., and Nicholas, K. A. (2013). Evaluating safeguards in a conservation incentive program: participation, consent, and benefit sharing in indigenous communities of the Ecuadorian Amazon. Ecol. Soc. 18, 1–16. doi: 10.5751/ES-05733-180401
Kumar, R., Horwitz, P., Milton, G. R., Sellamuttu, S. S., Buckton, S. T., and Davidson, N. C. (2011). Assessing wetland ecosystem services and poverty interlinkages: a general framework and case study. Hydrol. Sci. J. 56, 1602–1621. doi: 10.1080/02626667.2011.631496
Laffoley, D. d'a. (2013). The Management of Coastal Carbon Sinks in Vanuatu: Realising the Potential. Commonwealth Secretariat, London, UK.
Landell-Mills, N., and Porras, I. T. (2002). Silver Bullet or Fools' Gold? A Global Review of Markets for Environmental Services and their Impact on the Poor. London: International Institute for Environment and Development.
Larsen, R. K., Acebes, J. M., and Belen, A. (2011). Examining the assumptions of integrated coastal management: stakeholder agendas and elite co-option in Babuyan Islands, Philippines. Ocean Coast. Manag. 54, 10–18. doi: 10.1016/j.ocecoaman.2010.10.007
Larson, A. M., and Soto, F. (2008). Decentralization of natural resource governance regimes. Annu. Rev. Environ. Resour. 33, 213–239. doi: 10.1146/annurev.environ.33.020607.095522
Lau, W. W. Y. (2013). Beyond carbon: conceptualising payments for ecosystem services in blue forests on carbon and other marine and coastal ecosystem services. Ocean Coast. Manag. 83, 5–14. doi: 10.1016/j.ocecoaman.2012.03.011
Lavery, P. S., Mateo, M. -Á., Serrano, O., and Rozaimi, M. (2013). Variability in the carbon storage of seagrass habitats and its implications for global estimates of blue carbon ecosystem service. PLoS ONE 8:e73748. doi: 10.1371/journal.pone.0073748
Legrand, T., Froger, G., and Le Coq, J.-F. (2013). Institutional performance of payments for environmental services: an analysis of the Costa Rican program. For. Policy Econ. 37, 115–123. doi: 10.1016/j.forpol.2013.06.016
Liekens, I., and De Nocker, L. (2014). “Valuation of ES: challenges and policy use,” in Ecosystem Services: Global Issues, Local Practices. 2014, eds S. Jacobs, N. Dendoncker, and H. Keune (San Diego, CA: Elsevier Inc.), 107–119.
Lin, H., and Nakamura, M. (2012). Payments for watershed services: directing incentives for improving lake basin governance. Lakes Reservoirs Res. Manage. 17, 191–206. doi: 10.1111/lre.12004
Lin, H., and Ueta, K. (2012). Lake watershed management: services, monitoring, funding and governance. Lakes Reservoirs Res. Manage. 17, 207–223. doi: 10.1111/lre.12003
Locatelli, T., Binet, T., Kairo, J. G., King, L., Madden, S., Patenaude, G., et al. (2014). Turning the tide: how blue carbon and payments for ecosystem services (PES) might help save mangrove forests. Ambio 43, 981–995. doi: 10.1007/s13280-014-0530-y
Lockie, S. (2013). Market instruments, ecosystem services, and property rights: assumptions and conditions for sustained social and ecological benefits. Land Use Policy 31, 90–98. doi: 10.1016/j.landusepol.2011.08.010
Lockwood, M., Davidson, J., Curtis, A., Stratford, E., and Griffith, R. (2010). Governance principles for natural resource management. Soc. Nat. Resour. 23, 986–1001. doi: 10.1080/08941920802178214
Lovelock, C. E., and McAllister, R. R. J. (2013). ‘Blue Carbon’ projects for the collective good. Carbon Manage. 4, 477–479. doi: 10.4155/cmt.13.50
Lutz, S. J. (2011). Blue Carbon—First Level Exploration of National Coastal Carbon in the Arabian Peninsula with Special Focus on UAE and Abu Dhabi. A Rapid Feasibility Study. Oslo: AGEDI/EAD, UNEP/GRID-Arendal.
Macreadie, P. I., Baird, M. E., Trevathan-Tackett, S. M., Larkum, A. W. D., and Ralph, P. J. (2014). Quantifying and modelling the carbon sequestration capacity of seagrass meadows: a critical assessment. Mar. Pollut. Bull. 83, 430–439. doi: 10.1016/j.marpolbul.2013.07.038
Mahanty, S., Suich, H., and Tacconi, L. (2013). Access and benefits in payments for environmental services and implications for REDD+: lessons from seven PES schemes. Land Use Policy 31, 38–47. doi: 10.1016/j.landusepol.2011.10.009
Marshall, G. R. (2013). Transaction costs, collective action and adaptation in managing complex social–ecological systems. Ecol. Econ. 88, 185–194. doi: 10.1016/j.ecolecon.2012.12.030
Martin-Ortega, J., Ojea, E., and Roux, C. (2013). Payments for water ecosystem services in Latin America: a literature review and conceptual model. Ecosyst. Serv. 6, 122–132. doi: 10.1016/j.ecoser.2013.09.008
McArthur, L. C., and Boland, J. W. (2006). The economic contribution of seagrass to secondary production in South Australia. Ecol. Modell. 196, 163–172. doi: 10.1016/j.ecolmodel.2006.02.030
McCann, L. (2013). Transaction costs and environmental policy design. Ecol. Econ. 88, 253–262. doi: 10.1016/j.ecolecon.2012.12.012
McCann, L., Colby, B., Easter, K. W., Kasterine, A., and Kuperan, K. V. (2005). Transaction cost measurement for evaluating environmental policies. Ecol. Econ. 52, 527–542. doi: 10.1016/j.ecolecon.2004.08.002
McDermott, M., Mahanty, S., and Schreckenberg, K. (2012). Examining equity: a multidimensional framework for assessing equity in payments for ecosystem services. Environ. Sci. Policy 133, 416–427. doi: 10.1016/j.envsci.2012.10.006
Mohammed, E. Y. (2012). Payments for Coastal and Marine Ecosystem Services: Prospects and Principles. London: International Institute for Environment and Development.
Montefalcone, M., Rovere, A., Parravicini, V., Albertelli, G., Morri, C., and Bianchi, C. N. (2013). Evaluating change in seagrass meadows: a time-framed comparison of side scan sonar maps. Aquat. Bot. 104, 204–212. doi: 10.1016/j.aquabot.2011.05.009
Muňoz-Piňa, C., Guevara, A., Torres, J. M., and Braňa, J. (2008). Paying for the hydrological services of Mexico's forests: analysis, negotiations and results. Ecol. Econ. 65, 725–736. doi: 10.1016/j.ecolecon.2007.07.031
Muradian, R., and Rival, L. (2012). Between markets and hierarchies: the challenge of governing ecosystem services. Ecosyst. Serv. 1, 93–100. doi: 10.1016/j.ecoser.2012.07.009
Muradian, R., Corbera, E., Pascual, U., Kosoy, N., and May, P. H. (2010). Reconciling theory and practice: an alternative conceptual framework for understanding payments for environmental services. Ecol. Econ. 69, 1202–1208. doi: 10.1016/j.ecolecon.2009.11.006
Murdiyarso, D., Brockhaus, M., Sunderlin, W. D., and Verchot, L. (2012). Some lessons learned from the first generation of REDD+ activities. Curr. Opin. Environ. Sustainability 4, 678–685. doi: 10.1016/j.cosust.2012.10.014
Murray, B. C., Watt, C. E., Cooley, D. M., and Pendleton, L. H. (2012). Coastal Blue Carbon and the United Nations Framework Convention on Climate Change: Current Status and Future Directions. Nicholas Institute Policy Brief 12–01. Nicholas Institute for Environmental Policy Solutions, Duke University, Indiana.
Murray, B., Pendleton, L., Jenkins, W., and Sifleet, S. (2011). Green Payments for Blue Carbon: Economic Incentives for Protecting Threatened Coastal Habitats. Nicholas Institute for Environmental Policy Solutions, Duke University.
Narloch, U., Pascual, U., and Drucker, A. G. (2011). Cost-effectiveness targeting under multiple conservation goals and equity considerations in the Andes. Environ. Conserv. 38, 417–425. doi: 10.1017/S0376892911000397
Narloch, U., Pascual, U., and Drucker, A. G. (2013). How to achieve fairness in payments for ecosystem services? Insights from agrobiodiversity conservation auctions. Land Use Policy 35, 107–118. doi: 10.1016/j.landusepol.2013.05.002
Naughton-Treves, L., and Wendland, K. (2014). Land tenure and tropical forest carbon management. World Dev. 55, 1–6. doi: 10.1016/j.worlddev.2013.01.010
Nordlund, L., Erlandsson, J., de la Torre-Castro, M., and Jiddawi, N. (2011). Changes in an East African social-ecological seagrass system: invertebrate harvesting affecting species composition and local livelihood. Aquat. Living Resour. 23, 399–416. doi: 10.1051/alr/2011006
Norgaard, R. B. (2010). Ecosystem services: from eye-opening metaphor to complexity blinder. Ecol. Econ. 69, 1219–1227. doi: 10.1016/j.ecolecon.2009.11.009
Ondiviela, B., Losada, I. J., Lara, J. L., Maza, M., Galván, C., and Bouma, T. J. (2014). The role of seagrasses in coastal protection in a changing climate. Coast. Eng. 87, 158–168. doi: 10.1016/j.coastaleng.2013.11.005
Orth, R., Carruthers, T., Dennison, W., Duarte, C., Fourqueram, J., Heck, K., et al. (2006). A global crisis for seagrass ecosystems. Bioscience 56, 987–996. doi: 10.1641/0006-3568(2006)56
Parker, C., and Cranford., M. (2010). The Little Biodiversity Finance Book: A Guide to Proactive Investment in Natural Capital (PINC). Oxford: Global Canopy Foundation.
Pascual, U., Muradian, R., Rodríguez, L. C., and Duraiappah, A. (2010). Exploring the links between equity and efficiency in payments for environmental services: a conceptual approach. Ecol. Econ. 69, 1237–1244. doi: 10.1016/j.ecolecon.2009.11.004
Pendleton, L. H., Donato, D. C., Murray, B. C., Crooks, S., Jenkins, A. W., Sifleet, S., et al. (2012). Estimating global ‘blue carbon’ emissions from conversion and degradation of vegetated coastal ecosystems. PLoS ONE 7:e43542. doi: 10.1371/journal.pone.0043542
Pendleton, L. H., Sutton-Grier, A. E., Gordon, D. R., Murray, B. C., Victor, B. E., Griffis, R. B., et al. (2013). Considering ‘coastal carbon’ in existing U.S. federal statutes and policies. Coast. Manage. 41, 439–456. doi: 10.1080/0820753.2013.822294
Peters-Stanley, M., and Yin, D. (2013). Manoeuvring the Mosaic. State of the Voluntary Carbon Markets 2013. A Report by Forest Trends' Ecosystem Marketplace, Washington, DC.
Peters-Stanley, M., Hamilton, K., and Yin, D. (2012). Leveraging the Landscape: State of the Forest Carbon Markets 2012. A Report by Forest Trends' Ecosystem Marketplace, Washington, DC.
Petus, C., Collier, C., Devlin, M., Rasheed, M., and McKenna, S. (2014). Using MODIS data for understanding changes in seagrass meadow health: a case study in the Great Barrier Reef (Australia). Mar. Environ. Res. 98, 68–85. doi: 10.1016/j.marenvres.2014.03.006
Phelps, J., Webb, E. L., and Adams, W. M. (2012). Biodiversity co-benefits of policies to reduce forest-carbon emissions. Nat. Clim. Change 2, 1–7. doi: 10.1038/nclimate1462
Phinn, S., Roelfsema, C., Dekker, A., Brando, V., and Anstee, J. (2008). Mapping seagrass species, cover and biomass in shallow waters: an assessment of satellite multi-spectral and airborne hyper-spectral imaging systems in Moreton Bay (Australia). Remote Sens. Environ. 112, 3413–3425. doi: 10.1016/j.rse.2007.09.017
Pillay, M., and Rogerson, C. M. (2013). Agriculture-tourism linkages and pro-poor impacts: the accommodation sector of urban coastal KwaZulu-Natal, South Africa. Appl. Geogr. 36, 49–58. doi: 10.1016/j.apgeog.2012.06.005
Pirard, R., Billé, R., and Sembrés, T. (2010). Questioning the Theory of Payments for Ecosystem Services (PES) in Light of Emerging Experience and Plausible Developments. Paris: Institut du Développement Durable et des Relations Internationales.
Pogoreutz, C., Kneer, D., Litaay, M., Asmus, H., and Ahnelt, H. (2012). The influence of canopy structure and tidal level on fish assemblages in tropical Southeast Asian seagrass meadows. Estuarine Coast. Shelf Sci. 107, 58–68. doi: 10.1016/j.ecss.2012.04.022
Pokorny, B., Johnson, J., Medina, G., and Hoch, L. (2012). Market-based conservation of the Amazonian forests: revisiting win–win expectations. Geoforum 43, 387–401. doi: 10.1016/j.geoforum.2010.08.002
Pokorny, B., Scholz, I., and De Jong, W. (2013). REDD+ for the poor or the poor for REDD+? About the limitations of environmental policies in the Amazon and the potential of achieving environmental goals through pro-poor policies. Ecol. Soc. 18:3. doi: 10.5751/ES-05458-180203
Porras, I. (2010). Fair and Green? Social Impacts of Payments for Environmental Services in Costa Rica. London: International Institute for Environment and Development.
Porras, I., Aylward, B., and Dengel, J. (2013). Sustainable Markets Monitoring Payments for Watershed Services Schemes in Developing Countries. London: International Institute for Environment and Development.
Porras, I., Grieg-Gran, M., and Neves, N. (2008). All that Glitters: A Review of Payments for Watershed Services in Developing Countries. London: International Institute for Environment and Development.
Potts, M. D., Kelley, L. C., and Doll, H. M. (2013). Maximizing biodiversity co-benefits under REDD+: a decoupled approach. Environ. Res. Lett. 8:024019. doi: 10.1088/1748-9326/8/2/024019
Preen, A. (1995). Impacts of dugong foraging on seagrass habitats: observation and experimental evidence for cultivation grazing. Mar. Ecol. Prog. Ser. 124, 201–213 doi: 10.3354/meps124201
Raheem, N., Colt, S., Fleishman, E., Talberth, J., Swedeen, P., Boyle, K. J., et al. (2012). Application of non-market valuation to California's coastal policy decisions. Mar. Policy 36, 1166–1171. doi: 10.1016/j.marpol.2012.01.005
Resosudarmo, I. A. P., Atmadja, S., Ekaputri, A. D., Intarini, D. Y., Indriatmoko, Y., and Astri, P. (2014). Does tenure security lead to REDD+ project effectiveness? Reflections from five emerging sites in Indonesia. World Dev. 55, 68–83. doi: 10.1016/j.worlddev.2013.01.015
Rights and Resources Initiative. (2014). Lots of Words, Little Action: Will the Private Sector Tip the Scales for Community Land Rights? Washington, DC: Rights and Resources Initiative.
Rivera-Guzmán, N. E., Moreno-Casasola, P., Ibarra-Obando, S. E., Sosa, V. J., and Herrera-Silveira, J. (2014). Long term state of coastal lagoons in Veracruz, Mexico: effects of land use changes in watersheds on seagrasses habitats. Ocean Coast. Manag. 87, 30–39. doi: 10.1016/j.ocecoaman.2013.10.007
Robert, N., and Stenger, A. (2013). Can payments solve the problem of undersupply of ecosystem services? For. Policy Econ. 35, 83–91. doi: 10.1016/j.forpol.2013.06.012
Rodríguez de Francisco, J. C., Budds, J., and Boelens, R. (2013). Payment for environmental services and unequal resource control in Pimampiro, Ecuador. Soc. Nat. Resour. 26, 1217–1233. doi: 10.1080/08941920.2013.825037
Rotherham, D., and West, R. J. (2002). Do different seagrass species support distinct fish communities in south-eastern Australia? Fish. Manag. Ecol. 9, 235–248. doi: 10.1046/j.1365-2400.2002.00301
Rudd, M. A. (2004). An institutional framework for designing and monitoring ecosystem-based fisheries management policy experiments. Ecol. Econ. 48, 109–124. doi: 10.1016/j.ecolecon.2003.10.002
Rudd, M. A. (2009). National values for regional aquatic species at risk in Canada. Endanger. Species Res. 6, 239–249. doi: 10.3354/esr00160
Rudd, M. A. (2014). Scientists' perspectives on global ocean researchÖ priorities. Front. Mar. Sci. 1:36. doi: 10.3389/fmars.2014.00036
Rudd, M. A., and Lawton, R. N. (2013). Scientists' prioritization of global coastal research questions. Mar. Policy 39, 101–111. doi: 10.1016/j.marpol.2012.09.004
Rudd, M. A., and Weigand, J. (2011). “Citizens' willingness to pay for improved ecosystem services arising from wastewater clean-up in Newfoundland, Canada,” in International LOICZ Open Science Conference 2011, Yantai China, 14th September 2011. Available online at: https://www.academia.edu/1699571/Citizens_willingness_to_pay_for_improved_ecosystem_services_arising_from_wastewater_cleanup_in_Newfoundland_Canada (Accessed October10, 2014).
Rudd, M. A., Tupper, M. H., Folmer, H., and Van Kooten, G. C. (2003). Policy analysis for tropical marine reserves: challenges and directions. Fish Fish. 4, 65–85. doi: 10.1046/j.1467-2979.2003.00110.x
Saenger, P., Gartside, D., and Funge-Smith, S. (2013). A Review of Mangrove and Seagrass Ecosystems and their Linkage to Fisheries and Fisheries Management. Bangkok: RAP Publication, FAO.
Salazar, N. B. (2012). Community-based cultural tourism: issues, threats and opportunities. J. Sustainable Tourism 20, 9–22. doi: 10.1080/09669582.2011.596279
Salem, M. E., and Mercer, D. E. (2012). The economic value of mangroves: a meta-analysis. Sustainability 4, 359–383. doi: 10.3390/su4030359
Sánchez-Carnero, N., Rodríguez-Pérez, D., Couñago, E., Aceña, S., and Freire, J. (2012). Using vertical sidescan sonar as a tool for seagrass cartography. Estuarine Coast. Shelf Sci. 115, 334–344. doi: 10.1016/j.ecss.2012.09.015
Schomers, S., and Matzdorf, B. (2013). Payments for ecosystem services: a review and comparison of developing and industrialized countries. Ecosyst. Serv. 6, 16–30. doi: 10.1016/j.ecoser.2013.01.002
Seifert-Granzin, J. (2010). “Integrating green and blue carbon management: how to make it work,” in Katoomba Group Meeting XVI, Palto Alto, February 9th–10th 2010. Available online at: http://rmportal.net/library/content/translinks/translinks-2010/forest-trends/2010-Katoomba-Meeting-XVI-Marine/Presentation_IntegratingGreenandBlueCarbonManagement.pdf/view (Accessed July 12, 2014).
Seitz, R. D., Wennhage, H., Bergström, U., Lipcius, R. N., and Ysebaert, T. (2014). Ecological value of coastal habitats for ecommercially and ecologically important species. ICES J. Mar. Sci. 71, 648–665. doi: 10.1093/icesjms/fst152
Senaratna Sellamuttu, S., de Silva, S., and Nguyen-Khoa, S. (2011). Exploring relationships between conservation and poverty reduction in wetland ecosystems: lessons from 10 integrated wetland conservation and poverty reduction initiatives. Int. J. Sustainable Dev. World Ecol. 18, 328–340. doi: 10.1080/13504509.2011.560034
Shiferaw, B., Obare, G., and Muricho (2008). Rural market imperfections and the role of institutions in collective action to improve markets for the poor. Nat. Resour. Forum 32, 25–38. doi: 10.1111/j.1477-8947.2008.00167.x
Short, F. T., Coles, R., Fortes, M. D., Victor, S., Salik, M., and Isnain, I. (2014). Monitoring in the Western Pacific region shows evidence of seagrass decline in line with global trends. Mar. Pollut. Bull. 83, 408–416. doi: 10.1016/j.marpolbul.2014.03.036
Short, F. T., Polidoro, B., Livingstone, S. R., Carpenter, K. E., Bandeira, S., Bujang, J. S., et al. (2011). Extinction risk assessment of the world's seagrass species. Biol. Conserv. 144, 1961–1971. doi: 10.1016/j.biocon.2011.04.010
Sifleet, S., Pendleton, L., and Murray, B. C. (2011). State of the Science on Coastal Blue Carbon: A Summary for Policy Makers. Nicholas Institute for Environmental Policy Solutions, Duke University.
Siikamäki, J., Sanchirico, J. N., Jardine, S., McLaughlin, D., and Morris, D. (2013). Blue Carbon: coastal ecosystems, their carbon storage, and potential for reducing emissions. Environ. Sci. Policy Sustainable Dev. 55, 14–29. doi: 10.1080/00139157.2013.843981
Small, C., and Nicholls, R. J. (2003). A global analysis of human settlement in coastal zones. J. Coast. Res. 19, 584–599. Available online at: http://www.jstor.org/stable/4299200
Sommerville, M. M., Milner-Gulland, E. J., and Jones, J. P. G. (2011). The challenge of monitoring biodiversity in payment for environmental service interventions. Biol. Conserv. 144, 2832–2841. doi: 10.1016/j.biocon.2011.07.036
Somorin, O. A., Visseren-Hamakers, I. J., Arts, B., Sonwa, D. J., and Tiani, A.-M. (2014). REDD+ policy strategy in Cameroon: actors, institutions and governance. Environ. Sci. Policy 35, 87–97. doi: 10.1016/j.envsci.2013.02.004
Steinicke, E., and Neuburger, M. (2012). The impact of community-based Afro-alpine tourism on regional development. Mt. Res. Dev. 32, 420–430. doi: 10.1659/MRD-JOURNAL-D-11-00102.1
Sunderlin, W. D., Larson, A. M., Duchelle, A. E., Resosudarmo, I. A. P., Huynh, T. B., Awono, A., et al. (2014). How are REDD+ proponents addressing tenure problems? Evidence from Brazil, Cameroon, Tanzania, Indonesia, and Vietnam. World Dev. 55, 37–52. doi: 10.1016/j.worlddev.2013.01.013
Sutton, A. M., and Rudd, M. A. (2014). Deciphering contextual influences on local leadership in community-based fisheries management. Mar. Policy 50, 261–269. doi: 10.1016/j.marpol.2014.07.014
Tacconi, L. (2012). Redefining payments for environmental services. Ecol. Econ. 73, 29–36. doi: 10.1016/j.ecolecon.2011.09.028
TEEB. (2010). “The economics of valuing ecosystem services and biodiversity,” in The Economics of Ecosystems and Biodiversity Ecological and Economic Foundations, eds Pushpam Kumar (London; Washington: Earthscan).
Thomas, S. (2014). Blue carbon: knowledge gaps, critical issues and novel approaches. Ecol. Econ. 107, 22–38. doi: 10.1016/j.ecolecon.2014.07.028
Thompson, B. S., Clubbe, C. P., Primavera, J. H., Curnick, D., and Koldewey, H. J. (2014). Locally assessing the economic viability of blue carbon: a case study from Panay Island, the Philippines. Ecosyst. Serv. 8, 128–140. doi: 10.1016/j.ecoser.2014.03.004
Torres-Pulliza, D., Wilson, J. R., Darmawan, A., Campbell, S. J., and Andréfouët, S. (2013). Ecoregional scale seagrass mapping: a tool to support resilient MPA network design in the coral triangle. Ocean Coast. Manag. 80, 55–64. doi: 10.1016/j.ocecoaman.2013.04.005
Tudela, S. (2004). Ecosystem effects of fishing in the Mediterrean: an analysis of the major threats of fishing gear and practices to biodiversity and marine habitats. Gen. Fish. Council Mediterr. Stud. Rev. 74, 1–44.
Tuya, F., Haroun, R., and Espino, F. (2014). Economic assessment of ecosystem services: monetary value of seagrass meadows for coastal fisheries. Ocean Coast. Manag. 96, 181–187. doi: 10.1016/j.ocecoaman.2014.04.032
UK National Ecosystem Assessment. (2011). The UK National Ecosystem Assessment: Synthesis of the Key Findings. Cambridge: UNEP-WCMC.
Ullman, R., Bilbao-Bastida, V., and Grimsditch, G. (2013). Including blue carbon in climate market mechanisms. Ocean Coast. Manag. 83, 15–18. doi: 10.1016/j.ocecoaman.2012.02.009
UNEP, and CIFOR. (2014). Guiding Principle for Delivering Coastal Wetland Carbon Projects. Nairobi; Bogor: United Nations Environment Programme; Center for International Forestry Research.
UNEP. (2011). Economic Analysis of Mangrove Forest: A Case Study in Gazi Bay, Kenya. Nairobi: United Nations Environment Programme.
UNFCC. (2014). Kyoto Protocol. Available online at: http://unfccc.int/kyoto_protocol/items/2830.php (Accessed November 23, 2014).
Unsworth, R. K. F., and Cullen, L. C. (2010). Recognising the necessity for Indo-Pacific seagrass conservation. Conserv. Lett. 3, 63–73. doi: 10.1111/j.1755-263X.2010.00101.x
Unsworth, R. K. F., Cullen, L. C., Pretty, J. N., Smith, D. J., and Bell, J. J. (2010). Economic and subsistence values of the standing stocks of seagrass fisheries: potential benefits of no-fishing marine protected area management. Ocean Coast. Manage. 53, 218–224. doi: 10.1016/j.ocecoaman.2010.04.002
Unsworth, R. K. F., van Keulen, M., and Coles, R. G. (2014). Seagrass meadows in a globally changing environment. Mar. Pollut. Bull. 83, 383–386. doi: 10.1016/j.marpolbul.2014.02.026
van Noordwijk, M., Leimona, B., Emerton, L., Tomich, T. P., and Velarde, S. J., Kallesoe, M. (2007). Criteria and Indicators for Environmental Service Compensation and Reward Mechanisms: Realistic, Voluntary, Conditional and Pro-poor. CES Scoping Study Issue Paper no. 2. ICRAF Working Paper no. 37. World Agroforestry Centre, Nairobi.
Vaidyanathan, G. (2011). ‘Blue Carbon’ plan takes shape. Nature. doi: 10.1038/news.2011.112. [Epub ahead of print].
Vassallo, P., Paoli, C., Rovere, A., Montefalcone, M., Morri, C., and Bianchi, C. N. (2013). The value of the seagrass Posidonia oceanica: a natural capital assessment. Mar. Pollut. Bull. 75, 157–167. doi: 10.1016/j.marpolbul.2013.07.044
Verma, M., and Negandhi, D. (2011). Valuing ecosystem services of wetlands – a tool for effective policy formulation and poverty alleviation. Hydrol. Serv. J. 56, 1622–1639. doi: 10.1080/02626667.2011.631494
Visseren-Hamakers, I. J., Gupta, A., Herold, M., Peña-Claros, M., and Vijge, M. J. (2012). Will REDD+ work? The need for interdisciplinary research to address key challenges. Curr. Opin. Environ. Sustainability 4, 590–596. doi: 10.1016/j.cosust.2012.10.006
Watson, R. A., Coles, R. G., and Lee Long, W. J. (1993). Simulation estimates of annual yield and landed value for commercial penaeid prawns from a tropical seagrass habitat, Northern Queensland, Australia. Aust. J. Mar. Freshw. Res. 44, 211–219. doi: 10.1071/MF9930211
Waycott, M., Duarte, C. M., Carruthers, T. J. B., Orth, R. J., Dennison, W. C., and Olyarnik, S. (2009). Accelerating loss of seagrasses across the globe threatens coastal ecosystems. Proc. Natl. Acad. Sci. U.S.A. 106, 12377–12381. doi: 10.1073/pnas.0905620106
Wendland, K. J., Honzák, M., Portela, R., Vitale, B., Rubinoff, S., and Randrianarisoa, J. (2010). Targeting and implementing payments for ecosystem services: opportunities for bundling biodiversity conservation with carbon and water services in Madagascar. Ecol. Econ. 69, 2093–2107. doi: 10.1016/j.ecolecon.2009.01.002
Willemen, L., Drakou, E. G., Dunbar, M. B., Mayaux, P., and Egoh, B. N. (2013). Safeguarding ecosystem services and livelihoods: understanding the impact of conservation strategies on benefit flows to society. Ecosyst. Serv. 4, 95–103. doi: 10.1016/j.ecoser.2013.02.004
Williams, S. L., and Heck, K. L., Jr. (2001). “Seagrass community ecology,” in Marine Community Ecology, eds M. D. Bertness, S. D. Gaines, and M. E. Hay (Sunderland, MA: Sinauer Associates), 317–337.
World Bank. (2010). Implementation Completion and Results Report: Western Kenya Integrated Ecosystem Management Project. Report No. ICR00001533.
World Resources InstituteWRI in collaboration with United Nations Development Programme, United Nations Environment Programme, and World Bank. (2005). World Resources 2005: The Wealth of the Poor—Managing Ecosystems to Fight Poverty. Washington, DC: World Resources Institute.
Wunder, S. (2005). Payments for Environmental Services: Some Nuts and Bolts. Occasional Paper No. 42. Bogor: Center for International Forestry Research.
Wunder, S., and Albán, M. (2008). Decentralized payments for environmental services: the case of Pimampiro and PROFAFOR in Ecuador. Ecol. Econ. 65, 685–698. doi: 10.1016/j.ecolecon.2007.11.004
Wunder, S., Engel, S., and Pagiola, S. (2008). Taking stock: a comparative analysis of payments for environmental services programs in developed and developing countries. Ecol. Econ. 65, 834–852. doi: 10.1016/j.ecolecon.2008.03.010
Wünscher, T., Engel, S., and Wunder, S. (2008). Spatial targeting of payments for environmental services: a tool for boosting conservation benefits. Ecol. Econ. 65, 822–833. doi: 10.1016/j.ecolecon.2007.11.014
Wünscher, T., and Engel, S. (2012). International payments for biodiversity services: review and evaluation of conservation targeting approaches. Biol. Conserv. 152, 222–230. doi: 10.1016/j.biocon.2012.04.003
Yandle, T. (2007). Understanding the consequences of property rights mismatches: a case study of New Zealand's marine resources. Ecol. Soc. 12:27. Available online at: http://www.ecologyandsociety.org/vol12/iss2/art27/
Keywords: blue carbon, carbon sequestration, coastal management, marine conservation, payments for ecosystem services, poverty alleviation
Citation: Hejnowicz AP, Kennedy H, Rudd MA and Huxham MR (2015) Harnessing the climate mitigation, conservation and poverty alleviation potential of seagrasses: prospects for developing blue carbon initiatives and payment for ecosystem service programmes. Front. Mar. Sci. 2:32. doi: 10.3389/fmars.2015.00032
Received: 12 February 2015; Accepted: 15 May 2015;
Published: 09 June 2015.
Edited by:
Mary I. O'Connor, University of British Columbia, CanadaReviewed by:
Francesca Rossi, Centre Nationale pour la Recherche Scientifique, FranceFred Short, University of New Hampshire, USA
Copyright © 2015 Hejnowicz, Kennedy, Rudd and Huxham. This is an open-access article distributed under the terms of the Creative Commons Attribution License (CC BY). The use, distribution or reproduction in other forums is permitted, provided the original author(s) or licensor are credited and that the original publication in this journal is cited, in accordance with accepted academic practice. No use, distribution or reproduction is permitted which does not comply with these terms.
*Correspondence: Adam P. Hejnowicz, Environment Department, University of York, Heslington, York, YO10 5DD, UK,YXBoZWpub3dpY3pAZ21haWwuY29t