 Sarah Q. Foster
 Robinson W. Fulweiler
- 1Department of Earth and Environment, Boston University, Boston, MA, USA
- 2Department of Biology, Boston University, Boston, MA, USA
A corrigendum on
Spatial and historic variability of benthic nitrogen cycling in an anthropogenically impacted estuary
by Foster, S. Q., and Fulweiler, R. W. (2014) Front. Mar. Sci. 1:56. doi: 10.3389/fmars.2014.00056
The authors wish to include the following correction based on updated di-nitrogen (N2) gas flux values for three cores included in the original paper (the N2 flux values for the other 38 cores remain unchanged). This update was made in order to be consistent in our N2 flux calculations across all cores. In the three aforementioned cores we originally used a different method to account for the instrument drift of the mass spectrometer during sample analysis. Importantly, the correction of the flux values for these three cores is small and does not change any of our data interpretations. However, in an effort to be as accurate as possible, we would like to provide the corrected values and the associated averages, statistics, and text that also need to be corrected as a result of the flux value adjustments.
For simplicity and clarity, corrections are listed below in bold and underlined font. The page numbers, section heading and paragraph numbers correspond to the paper's downloadable .pdf.
• Page 1. Abstract.
◦ 36 μmol N2-N m−2 h−1 changed to 38 μmol N2-N m−2 h−1
• Page 5. Table 2.
◦ Metoxit Point (MP), 7-Jul-2011, N2-N flux, −19 (±7.2) changed to −22 (±10.0)
◦ Metoxit Point (MP), 11-Jul-2012, N2-N flux, −19 (±39) changed to −30 (±45)
◦ Childs River Estuary (CRE), 11-Jul-2012, N2-N flux, 62 (±3.0) changed to 69 (±4.4)
• Page 7. Figure 3. Panel D, N2-N fluxes.
◦ MP changed from −18 (±11) to −21 (±12)
◦ CRE changed from 30 (±8.4) to 32 (±9.5)
• Page 8. Results. Direct Measure of Sediment Net N2 Flux. Paragraph 1.
◦ p = 0.012 changed to p = 0.010
◦ p = 0.042 changed to p = 0.032
◦ p = 0.021 changed to p = 0.014
◦ 14 (±8.3) μmol N2-N m−2 h−1 changed to 14 (±8.9) μmol N2-N m−2 h−1
◦ R2 = 0.002, p = 0.766 changed to R2 = 0.001, p = 0.844
◦ 33 (±7.5) μmol N2-N m−2 h−1 changed to 34 (±8.0) μmol N2-N m−2 h−1
◦ −16 (±4.3) μmol N2-N m−2 h−1 changed to −18 (±5.3) μmol N2-N m−2 h−1
◦ Sentence beginning with: “Overall, the N2 fluxes…” changed to: “Overall, we measured a high mean N2 flux from Sage Lot Pond but the variability between cores was the highest compared to other stations.”
◦ Sentence beginning with: “The highest mean net N fixation rate…” changed to: “The highest net N fixation rate (−89 μmol N2-N m−2 h−1) was measured in a sediment core collected from Metoxit Point in July 2012.”
◦ p = 0.863 changed to p = 0.881
• Pages 10–11. Discussion. Historic Comparisons. Paragraph 5.
◦ p = 0.012 changed to p = 0.013
◦ 34 (±14) μmol N2-N m−2 h−1 changed to 36 (±16) μmol N2-N m−2 h−1
◦ p = 0.102 (SLP) and p = 0.059 (CRE) changed to p = 0.084 (SLP) and p = 0.089 (CRE)
◦ p = 0.012 changed to p = 0.013
• Page 10. Figure 4. Panel C, N2-N fluxes.
◦ CRE changed from 34 (±14) to 36 (±16)
• Page 11. Discussion. Historic Comparisons. Paragraph 6.
◦ 551 (±227) kg N y−1 changed to 583 (±275) kg N y−1
◦ 10% (±4%) changed to 11% (±5%)
• Page 13. Conclusions. Paragraph 1.
◦ p = 0.012 changed to p = 0.013
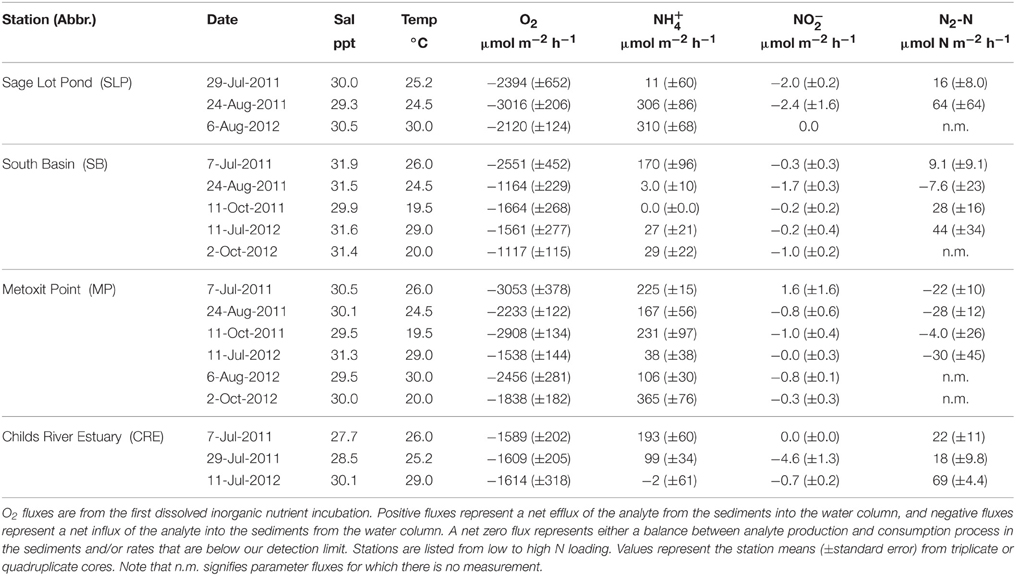
Table 2. Summary of sediment oxygen (O2), ammonium (NH), nitrite (NO) and di-nitrogen gas per mole nitrogen (N2-N) flux rates measured across the sediment-water interface in Waquoit Bay, MA in 2011 and 2012 (July–October).
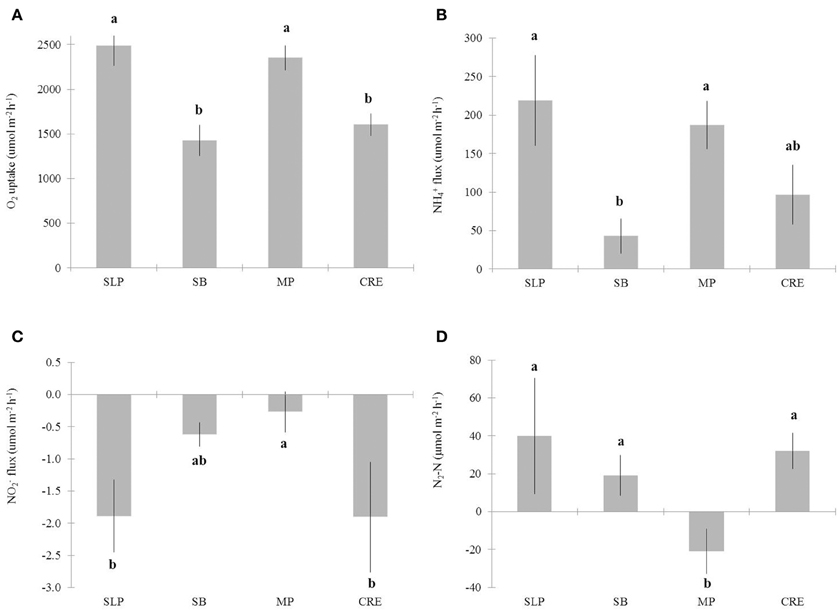
Figure 3. Benthic fluxes for (A) oxygen (O2) uptake, (B) ammonium (NH), (C) nitrite (NO), and (D) di-nitrogen gas per mole nitrogen (N2-N), across the sediment-water interface in Waquoit Bay. Bars represent the station means (± standard error) of all cores measured on seven 2011–2012 sampling dates for O2 uptake, NH and NO fluxes (A–C) and five sampling dates 2011–2012 for N2-N fluxes (D). Stations organized from relatively low to high external nitrogen load: Sage Lot Pond [SLP, n = 10 (A–C), n = 6 (D)], South Basin [SB, n = 16 (A–C), n = 13 (D)], Metoxit Point [MP, n = 21 (A–C), n = 12 (D)], and Childs River Estuary [CRE, n = 9 (A–C), n = 8 (D)]. Note that we did find a significant difference between dates for NO fluxes (p < 0.01), but not for the other flux parameters. Lower case letters above the bars that are not the same indicate fluxes that are significantly different from each other (α = 0.05).
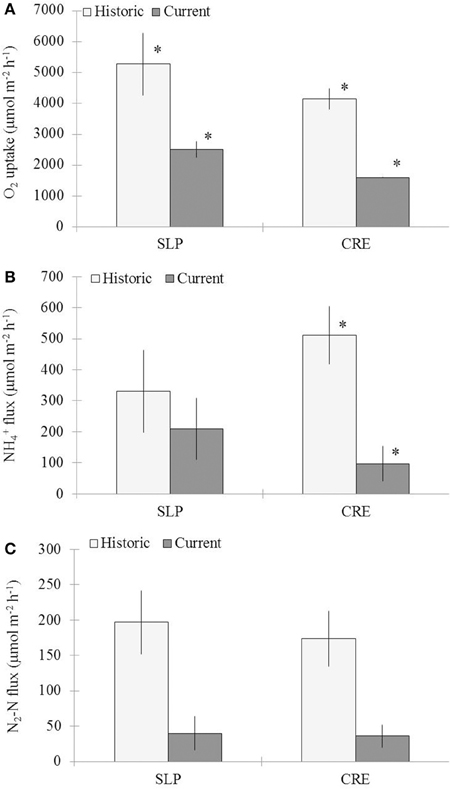
Figure 4. Comparison of historic (July–October, 1992–1994) (LaMontagne, 1996) and current (July–October, 2011–2012) benthic flux rates of (A) oxygen (O2), (B) ammonium (NH), and (C) di-nitrogen gas per mole nitrogen (N2-N) for direct measurements made from sealed cores collected from Sage Lot Pond (SLP) and Childs River Estuary (CRE) in Waquoit Bay. Bars represent station means (± standard error) from incubation dates (SLP Historic n = 4, SLP Current n = 3 except for N2-N flux n = 2, CRE Historic n = 10 except for NH n = 9, CRE Current n = 3). For the comparison between historic and current means for each station stars above the bars indicate fluxes that are significantly different from each other (α = 0.05).
Conflict of Interest Statement
The authors declare that the research was conducted in the absence of any commercial or financial relationships that could be construed as a potential conflict of interest.
Keywords: benthic nitrogen cycling, sediment oxygen demand, net denitrification, Waquoit Bay, historic variability, spatial variability
Citation: Foster SQ and Fulweiler RW (2015) Corrigendum: Spatial and historic variability of benthic nitrogen cycling in an anthropogenically impacted estuary. Front. Mar. Sci. 2:70. doi: 10.3389/fmars.2015.00070
Received: 14 August 2015; Accepted: 31 August 2015;
Published: 07 October 2015.
Edited by:
Paul E. Renaud, Akvaplan-niva AS, NorwayReviewed by:
Moritz Felix Lehmann, University of Basel, SwitzerlandCopyright © 2015 Foster and Fulweiler. This is an open-access article distributed under the terms of the Creative Commons Attribution License (CC BY). The use, distribution or reproduction in other forums is permitted, provided the original author(s) or licensor are credited and that the original publication in this journal is cited, in accordance with accepted academic practice. No use, distribution or reproduction is permitted which does not comply with these terms.
*Correspondence: Robinson W. Fulweiler,cndmQGJ1LmVkdQ==