 Kai Ziervogel1*
 Christopher Osburn2
 Adeline Brym2
 Jessica Battles3Samantha Joye3Nigel D'souza4
 Joseph Montoya4Uta Passow5
 Carol Arnosti1
- 1Department of Marine Sciences, University of North Carolina at Chapel Hill, Chapel Hill, NC, USA
- 2Department of Marine, Earth and Atmospheric Sciences, North Carolina State University, Raleigh, NC, USA
- 3Department of Marine Sciences, University of Georgia, Athens, GA, USA
- 4School of Biology, Georgia Institute of Technology, Atlanta, GA, USA
- 5Marine Science Institute, University of California Santa Barbara, Santa Barbara, CA, USA
Riverine runoff often triggers microbial responses in coastal marine environments, including phytoplankton blooms and enhanced bacterial biomass production that drive the transformation of dissolved and particulate organic matter (POM) on its way from land to the deep ocean. We measured concentrations and characteristics of POM, concentrations of dissolved organic carbon (DOC), and bacterial community abundance and activities in the water column at three sites near the Mississippi River Delta about 2 weeks after Hurricane Isaac made landfall in late August 2012. River plumes had salinities of >30 PSU and high levels of DOC (210–380μM), resulting from the storm surge that pushed large quantities of marine waters upstream. Relatively high concentrations of phytoplankton POM and low levels of microbial exopolymeric particles (TEP and CSP) suggested that storm-induced riverine discharge triggered the development of phytoplankton blooms that were in their initial stages at the time of sampling. Surface water POM had C/N ratios of 5–7 and strong protein-like fluorescence signals in the base-extracted POM (BEPOM) fraction at the two sites closer to the river mouth (Stns. TE and MSP). Freshly produced POM triggered a two-fold increase in heterotrophic bacterial biomass production (3H-leucine incorporation) and a four-fold increase in bacterial peptide hydrolysis (activities of leucine-aminopeptidase). In contrast, elevated DOC concentrations coincided with only moderate bacterial community activity, suggesting that heterotrophic bacterial metabolism near the Mississippi River Delta in the aftermath of Hurricane Isaac was more closely linked with autochthonous primary production.
Introduction
The nature and inventory of organic matter in the coastal ocean is mainly driven by heterotrophic microbial communities that process and transform organic matter from a myriad of potential sources, including riverine inputs, atmospheric deposition, and sediment resuspension, thus regulating carbon export from land to the open ocean. In the Gulf of Mexico, most of the land-sea carbon fluxes are driven by Mississippi River runoff and subsequent biogeochemical organic matter processing that occurs on the Louisiana Shelf near the bird-foot delta, where most of the riverine discharge enters the coastal ocean (e.g., Green et al., 2006). Buoyant freshwater plumes of Mississippi River water generally extend westward from the delta, following the Louisiana coastal current; however, wind-driven changes in the direction of surface water currents near the delta can also lead to an eastward offshore transport of Mississippi River plumes (Schiller et al., 2011).
The Mississippi River is the largest river in North America, draining ~40% of the continental United States. Given its important role in transport and cycling of terrestrial carbon between the land and the ocean, numerous geochemical studies have measured carbon flux from the Mississippi River into near-shore environments (e.g., Bianchi et al., 1997; Wang et al., 2004), suggesting that microbially-driven organic matter transformation could be an important sink for terrestrial carbon on the Louisiana shelf (Benner and Opsahl, 2001; Bianchi et al., 2013). Comparatively fewer studies have directly measured microbial metabolic rates on the shelf near the Mississippi River Delta, focusing on near-shore phytoplankton growth and bacterial biomass production during the high productivity season in early summer that follows highest riverine discharge in late spring (Amon and Benner, 1998; Lohrenz et al., 1999; Pakulski et al., 2000). During that time elevated rates of primary productivity and secondary production driven by high inputs of inorganic nutrients through the Mississippi River often result in the development of seasonal hypoxia on the Louisiana Shelf (Rabalais et al., 2010; Murrell et al., 2013).
In addition to seasonal inputs of riverine organic substrates, and inorganic nutrients and minerals, storm-induced perturbations can also cause elevated runoff from the Mississippi River with possible consequences for microbial growth and metabolism on the shelf. For instance, remote sensing observations revealed phytoplankton blooms near the Mississippi River Delta and on the Louisiana shelf following Tropical Storm Barry in early August, 2001, and Hurricane Lilli in late September 2002 (Yuan et al., 2004). In the aftermath of Hurricanes Katrina and Rita in August and September 2005, respectively, MODIS satellite imagery showed elevated chlorophyll a concentrations, suggesting increased phytoplankton biomass over large areas of the Louisiana shelf. It has been suggested that these elevations in chlorophyll may have been caused by intense deliveries of terrestrial materials into coastal waters, changes in water circulation patterns, and enhanced sediment resuspension on the Louisiana shelf (Lohrenz et al., 2008). Storm-induced sediment resuspension on the Louisiana shelf was also observed after Hurricane George in late September 1998 (Ross et al., 2009). After Hurricane Isaac made landfall in late August 2012, lateral near-bed transport of mainly lithogenic material led to sediment resuspension and subsequent formation of bottom turbidity layers that stimulated heterotrophic bacterial biomass production and organic matter degradation in the deep Gulf of Mexico (Ziervogel et al., 2015).
The goal of the present study was to investigate the effects of Hurricane Isaac's storm-surge on microbial activities, and organic matter processing in the water column at three coastal sites near the Mississippi River Delta. Given that the extent of bacterial processing of organic matter in near-shore environments depends on the characteristics of the substrates, as well as on the capabilities and activities of heterotrophic microbial communities (see Arnosti, 2011 for a recent review), we linked measurements of bacterial activities with chemical analysis of the organic matter pool. In particular, bacterial abundance and biomass production (leucine incorporation), as well as activities of two classes of microbial hydrolytic enzymes indicative of carbohydrate and peptide hydrolysis (leucine-aminopeptidase and β-glucosidase) were measured at distinct depths throughout the water column of the three sites. In parallel we determined concentrations of dissolved and particulate organic carbon and chlorophyll a concentrations, abundance of transparent exopolymeric particles (TEP) and Coomassie-stainable particles (CSP), i.e., carbohydrate- and peptide-rich microparticles, respectively, which form from phytoplankton and bacterial exudates (Long and Azam, 1996; Passow, 2002), along with fluorescence properties of base-extracted particulate organic matter (BEPOM). Base-extraction of POM provides the means to compare fluorescence features indicative of sources and origin of fractions of the POM pool (Brym et al., 2014).
Materials and Methods
Site Locations and Water Column Sampling
Water column samples were taken on September 9–10, 2012, at three sites on the Louisiana shelf, northeastern Gulf of Mexico, aboard RV Endeavor. The sampling occurred 12 days after Hurricane Isaac made landfall on the Louisiana coast on August 28, 2012, producing heavy rains and a storm surge that extended for more than 300 miles upriver (Berg, 2013). Two of the three sites are located to the south (Stn. MSP) and south-east (Stn. O) of the Southwest Pass; Stn. TE is located ~20 km south-east of the South Pass (Figure 1; Table 1), and near a chronic oil leakage from the sunken Taylor Energy platform. Note that in Brym et al. (2014), Stns. O, MSP, and TE are referred to as Stns. 1, 2, and 3, respectively.
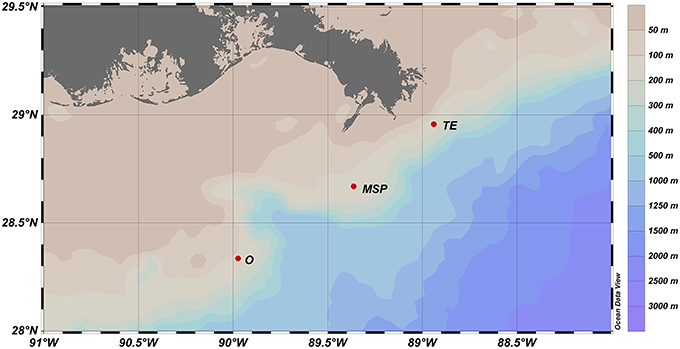
Figure 1. Map of the sampling sites on the Louisiana shelf. See Table 1 for a detailed site description.

Table 1. Description of sampling sites and dates of sampling.
Water column temperature and salinity, beam attenuation (a measure of turbidity), and chlorophyll fluorescence (a proxy for phytoplankton biomass; hereafter referred to as CTD-derived chl fluorescence) were measured by sensors attached to a CTD rosette. Water samples from distinct depths were collected by Niskin bottles attached to the rosette, and analyzed for the parameters described below. The data presented in this study is freely available on the GRIIDC database under the Unique Dataset Identifiyers (UDIs) R1.x132.134:0111 and R1.x132.134:006.
Analysis
Dissolved Organic Carbon (DOC)
Water samples were filtered through 0.2-μm surfactant-free cellulose acetate syringe filters and stored in pre-combusted glass vials at −20°C until analysis (total volume filtered per sample: 15mL). Defrosted samples were acidified (50% phosphoric acid v/v) and injected into a Shimadzu TOC-5000 analyzer that uses high temperature catalytic oxidation. Duplicate samples per station and depth were injected; instrument settings yielded at least three repeated measurements of each sample.
Particulate Organic Carbon (POC) and Nitrogen (PON)
Water samples were vacuum filtered onto replicate pre-combusted and pre-weighed GF/F filters (total volume filtered per sample: 1000 mL) immediately after collection. The filters were stored in clean centrifuge tubes at −20°C. Prior to POC and PON analysis, the filters were dried at 40°C overnight and reweighed on a high-precision balance to determine total suspended matter (TSM). The filters were acidified with 12M HCl for 12 h to remove inorganic carbon, followed by flash combustion to CO2 and N2 on a Carlo-Erba 1500 Elemental Analyzer, using acetanilide as a standard.
Chlorophyll a
Between 75 and 200mL of seawater were filtered onto replicate 0.4μm PC filters immediately after sampling. The filters were stored at −20°C, and soaked in 90% acetone overnight in the freezer before chlorophyll a (chl a) was measured on a fluorometer (Turner 700) according to Strickland and Parsons (1972).
Fluorescence Properties of Base-Extracted Particulate Organic Matter (BEPOM)
Samples were analyzed as described in Osburn et al. (2012) and Brym et al. (2014). In brief, base-soluble POM was extracted from each GF/F filter into 0.1 N sodium hydroxide (NaOH) for 24 h at 4°C. The basic solution was neutralized with concentrated hydrochloric acid (HCl) and filtered (0.2μm PES filter) to remove filter particles prior to absorbance and fluorescence measurement on Varian Cary 300 and Eclipse instruments, respectively. BEPOM absorbance spectra were measured from 220 to 800 nm. Samples with raw absorbance >0.4 at 240 nm were diluted. All samples were blank-corrected against a neutralized NaOH control. Fluorescence of BEPOM samples was measured at excitation wavelengths 220–500 nm at 5 nm intervals, with 5 nm excitation slits. Emission was measured between 240 and 600 nm at 2 nm intervals with 5 nm emission slits. Fluorescence intensities were corrected for spectral variation in lamp intensities and detector response, and calibrated in qunine sulfate units (QSU). Fluorescence results are presented as excitation-emission matrices (EEMs) and visualized as contour plots.
Transparent Exopolymeric Particles (TEP) and Coomassie Stainable Particles (CSP)
TEP and CSP are particulate components of microbial extracellular polymeric substances in the ocean. Abundance and distribution of TEP and CSP were analyzed microscopically as described in Engel (2009). In brief, 5 mL formalin-fixed water (2% final conc.) were filtered at low, constant vacuum (< 200 mmHg) onto replicate 0.4-μm Nuclepore filters and stained with 0.02% Alcian Blue (pH 2.5) or 0.04% Coomassie Brilliant Blue (pH 7.4) for TEP and CSP analysis, respectively. The filters were rinsed with Milli-Q water to remove the excess dye and placed on a CytoClear slide (Sterlitech Corp) with a drop of immersion oil underneath and on top of the filter, then covered with a glass cover slide. Slides were examined and photographed with an inverted microscope (Olympus CK2) equipped with a digital camera (Moticam 2500) at 200× magnification. Thirty pictures were taken for each filter and stained particles were analyzed using ImageJ software. The total numbers of visible particles were used to calculate particle abundance.
Bacterial Abundance
Ten milliliters of water were fixed with formalin (2% final conc.) immediately after collection and stored in the dark at 4°C until analysis. A known volume of each fixed sample was filtered onto 0.2-μm pore, black polycarbonate filter (Millipore, type GTPB) using low vacuum. The filters were transferred to clean microscope slides. Ten microliter of a freshly prepared staining solution containing 50% glycerol in 1× PBS at pH 7.4, ascorbic acid (1% final conc. v/v), and SYBR green I stain (0.45% final conc. v/v) was placed in the middle of a cover slip (25 × 25 mm) and inverted onto the filter (Lunau et al., 2005). The slide was then placed in the dark at 4°C, until the weight of the cover slip dispensed the stain evenly across the filter. Bacterial cells were counted with a Nikon Labophot-2 epifluorscence microscope with blue light excitation at 1000× magnification, respectively. A minimum of 200 cells were enumerated within a grid of fixed dimensions across each filter.
Bacterial Biomass Production (3H-Leucine Incorporation)
3H-leucine incorporation measurements, a measure of bacterial protein production, were conducted onboard immediately after sampling, following the microcentrifuge tube method (Kirchman, 2001). Tritiated leucine was added at substrate saturating levels (11.4 nM final conc.) to triplicate microcentrifuge tubes containing 1.5 mL of water. Killed controls contained substrate and 100% trichloroacetic acid (TCA). Incubations were conducted in the dark at in situ temperature for 1–2 h. Incubations were terminated by addition of 100% TCA, followed by centrifugation of the tubes at 10,000 g for 15 min using a FlexiFuge Centrifuge (Argos). Pellets were consecutively washed with 5% ice-cold TCA and 80% ice-cold ethanol and air dried. The radioactivity of the samples, which reflected incorporation of tracer into biomass, was measured in a scintillation counter. Assuming an isotope dilution factor of 1, bacterial biomass production was estimated by multiplying leucine incorporation rates with a carbon conversion factor of 1.5 kg C per mol (Kirchman, 2001).
Bacterial Hydrolytic Enzyme Activities
Hydrolytic enzymes are the major means for heterotrophic bacteria to access and degrade high molecular weight organic matter in the ocean (Arnosti, 2011). Enzyme activities were measured onboard immediately after sampling using L-leucine-4-methylcoumarinyl-7-amide (MCA) hydrochloride and 4-methylumbelliferone (MUF) β-D-glucopyranoside (Sigma-Aldrich) as substrate proxies for leucine-aminopeptidase (hereafter referred to as peptidase) and β-glucosidase activities (hereafter referred to as glucosidase), respectively (Hoppe, 1983). Enzymatic hydrolysis of MCA- and MUF-substrate proxies can be measured with short-term (several hour) incubations, and is generally considered to reflect activities of the in situ microbial community. Three milliliters of water were added to replicate disposable methacrylate cuvettes containing a single substrate at saturation levels (final concentration: 300 μM). Cuvettes were incubated in the dark at in situ temperature; fluorescence was measured immediately after sample addition and in subsamples from the incubation cuvette at two additional times over the course of 24 h. Because the fluorescence intensity of the tags is pH dependent, 1 ml sample was added to 1 ml 20 mM borate buffer (pH 9.2) and fluorescence was measured using a Turner Biosystems TBS-380 fluorometer (excitation/emission channels set to “UV”; 365 nm excitation, 440–470 nm emission). Fluorescence changes were calibrated using MUF and MCA standard solutions in seawater, and used to calculate hydrolysis rates. Killed controls (autoclaved seawater) showed only minor changes in fluorescence over time.
Statistical Analysis
Pearson's correlation coefficients (r) between bacterial activity parameters and organic matter concentration (POC and DOC) and chl a were calculated in Excel® using the data analysis tool pack (open source add-in). The Student's t-test was used to determine the significance of the r-values.
Results
Water Column Characteristics
All three stations showed freshwater influence in surface waters that reached ~30 PSU at Stn. TE, ~33 PSU at Stn. MSP, and ~31 PSU at Stn. O (Figure 2). Salinity at Stn. TE increased almost linearly in the uppermost 20 m. Stns. MSP and O, in contrast, had an upper mixed layer of ~8 and 11m, respectively. Bottom water salinities at all three sites reached ~36 PSU.
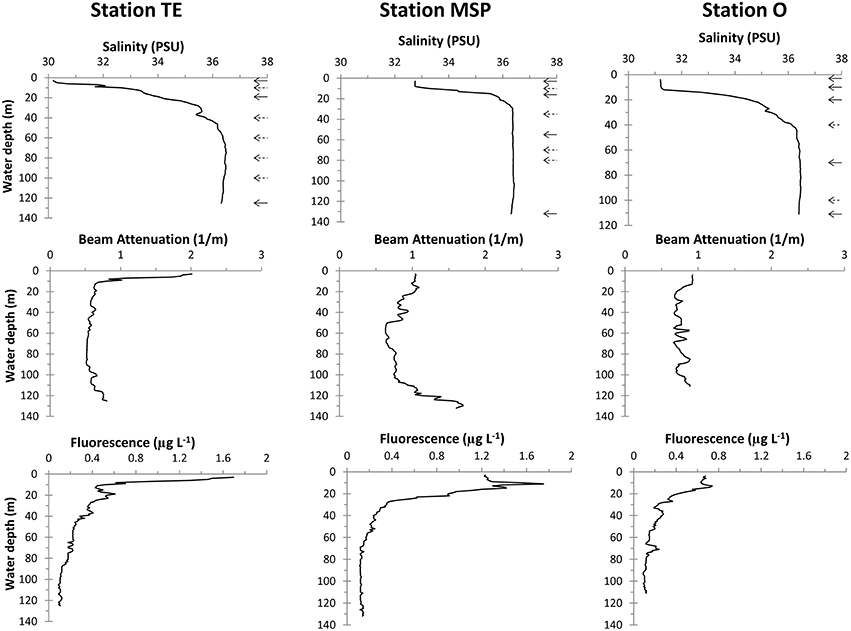
Figure 2. CTD profiles of water column salinity, beam attenuation, and fluorescence. Arrows in the salinity plots indicate the depths of the water column samples (dashed arrows: bacterial community abundance and activities only).
Water column turbidity profiled by beam attenuation differed remarkably among the three sites (Figure 2). Stn. TE showed overall highest turbidity at the surface. Beam attenuation decreased sharply within the upper 10m, and was low and invariant throughout the rest of the water column. At Stn. MSP, beam attenuation was low in surface and subsurface waters, but increased considerably below 110m toward the seafloor. Water column turbidity at Stn. O varied little with depth.
CTD-derived chl fluorescence profiles and chl a concentrations also showed site-specific differences (Figure 2; Table 2). The CTD-derived chl fluorescence profile at Stn. TE peaked at the surface, decreasing sharply within the upper 10m and thus following similar patterns as the beam attenuation profile at this site. Stn. MSP had a distinct sub-surface CTD-derived chl fluorescence peak at 11m water depth; Stn. O also showed a CTD-derived chl fluorescence peak at about 11m, although much weaker than at Stn. MSP.

Table 2. Water column profiles of biogeochemical parameters.
In accordance with the CTD-derived chl fluorescence data, chl a showed a surface maximum at Stn. TE, an even larger subsurface (16 m) maximum at Stn. MSP, and much lower concentrations at all depths at Stn. O (Table 2).
Dissolved Organic Carbon (DOC)
Dissolved organic carbon (DOC) concentrations were high (210–370 μM) in surface waters at all three stations, with highest concentration at Stn. O at 10m water depth, i.e., within the upper mixed layer, followed by Stns. TE and MSP (Table 2). DOC concentration below the halocline were still somewhat elevated (ca. 64–170 μM), but were considerably lower than in the freshwater-influenced surface layers.
Particulate Organic Matter Characteristics
Total Suspended Matter (TSM)
Average TSM concentrations at Stns. TE and MSP were generally higher than at Stn. O (Table 2). Depth-related variations were minor at all three stations, except for the bottom water sample at Stn. MSP (132 m), which had the highest TSM concentrations (4.3 mg L−1); between-sample variation was highest at Stn. TE, suggesting heterogeneous particle distribution at this site.
Particulate Organic Carbon (POC) and C/N Ratios
POC concentrations at all three sites were maximal at the surface and in sub-surface waters (< 20m water depths), and decreased with depth (Table 2). Stn. MSP had highest POC concentrations at 16m, the same depth where chl a concentrations peaked. Bottom water POC at Stn. MSP was slightly elevated compared to the mid-water sample at 55 m. At Stn. O, POC concentration in surface waters (3 and 10m water depth) was slightly lower compared to Stns. TE and MSP, and about a factor of 3 higher than in the mid- and bottom water sample.
The C/N ratios in surface waters were distinctly low at all three sites, ranging between 5.2 (Stn. TE) and 6.8 (Stn. O; Table 2). At Stn. MSP, C/N ratios decreased from 6.7 at the surface to 5.2 at 16m, the depth of the chl a peak. C/N ratios in mid- and bottom waters were higher than at the surface, ranging between 8 (Stn. O) and 9.4 (Stn. MSP).
POC constituted a variable fraction of TSM: in surface waters of Stn. O, where TSM concentrations were comparably low, POC was close to 19% of TSM. At Stn. O POC constituted over 14% of TSM at depths of 1 and 10m, whereas POC contributed much less to TSM (2%) at deeper depths (70 and 111 m). At the other two stations, POC contributions to TSM were lower that at Stn O and generally decreased with depth, with the exception of a comparably high contribution (almost 10%) at 16m at Stn. MSP, where chl a concentration was also elevated.
Fluorescence Properties of Base-Extracted POM (BEPOM)
The EEM plots of the BEPOM fluorescence showed a 3-peak pattern which is characteristic for estuarine waters and distinctive of largely planktonic OM sources (Brym et al., 2014). These peaks are more representative of fluorophore molecules than the continuous longwave emission of humic substances (Ma et al., 2010). Characteristic of this pattern is the protein-like fluorescence (excitation max 275–280 nm, emission max 340–344 nm) similar to the amino acid tryptophan (T peak) which is linked to primary production (Coble, 1996). Also prominent are two peaks at emission max 450 nm with two excitation peaks at 260 and at 365 nm. The identity of this fluorophore (or fluorophore group) is unknown but shares similarity to ubiquinone (Ubq; Li et al., 2011). The intensities of the peaks revealed depth- as well as site-specific differences. Stn. TE at the surface (3m water depth) and Station MSP at 16m (chl a peak) had strong protein-like signals and diminished Ubq signals (Figure 3). BEPOM fluorescence in surface waters at Stns. MSP (3 m) and O (3 and 10 m) revealed lower signals of protein-like fluorescence, and much stronger Ubq signals compared to Stn. TE (Figure 3; note the different scales). At Stn. O, a humic-like peak C was strongly evident at 70m, and was still quite pronounced at 111 m. Note that this signal is distinct from the Ubq signal; its excitation maximum is ca. 10 nm blue-shifted from the secondary excitation peak for Ubq. Sub-surface and bottom water BEPOM fluorescence at Stns. TE and MSP were characterized primarily by a change in peak intensity with depth.
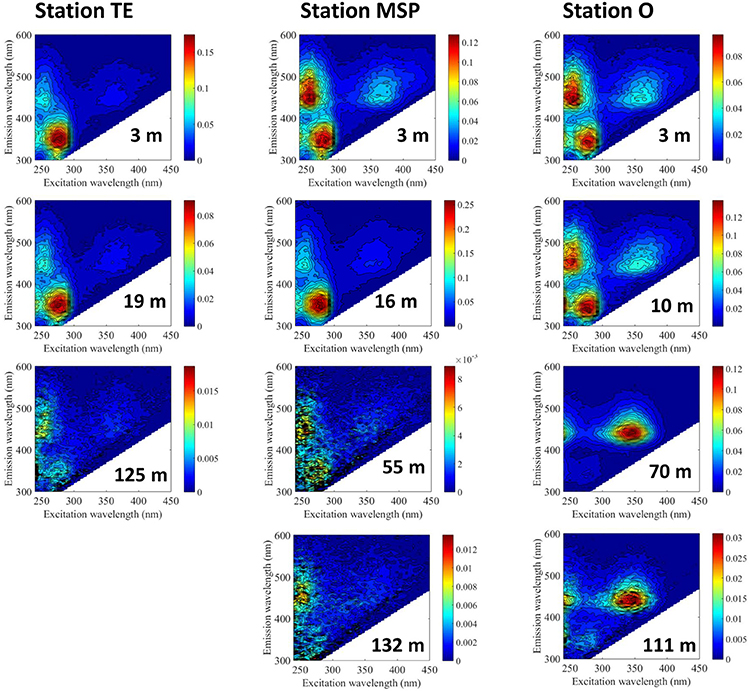
Figure 3. Excitation-emission matrices (EEMs) of base-extracted POM (BEPOM). Note the difference in scale among stations and depths. EEMs of Stn. O (3 and 111 m) were previously shown in Brym et al. (2014) (see Brym et al.'s Figures 4E,F).
TEP and CSP Abundance
TEP abundance at Stns. TE and O were highest at the surface and lowest at the bottom; in contrast at Stn. MSP, TEP abundance peaked near the seafloor (Table 2). Overall site-related differences in TEP abundance were minor, ranging between 19.4 ± 8.1 mL−1 (Stn. O 70 m) and 123 ± 35.8 ml−1 (Stn. MSP 132 m).
CSP were generally more abundant than TEP, ranging between 31.4 ± 2.6 mL−1 at Stn. O at 70m and 391.4 ± 307 ml−1 at Stn. TE at 125m (Table 2). Vertical CSP distributions were similar to those of TEP at two of the three sites (Stns. MSP and O). At Stn. TE, however, the CSP profile was different from the TEP profile with highest CSP abundance at 125m water depth.
Bacterial Abundance and Activities
Bacterial Cell Counts
Bacterial cell numbers at all three sites were highest in surface waters (≤ 16m water depth), ranging between 8.4 × 10⁸ cells L−1 at Stn. MSP and 12.1 × 10⁸ cells L−1 at Stn. O at 16m, and coinciding with the respective chl a peaks (Figure 4). At all three stations, bacterial abundance decreased to below 5 × 10⁸ cells L−1 at depths of 20–35 m, decreasing further to ca. 1 × 10⁸ cells L−1 deeper in the water column. At Stn. TE, however, cell abundance increased again between 100 m and 125 m (to 2.4 × 10⁸ cells L−1).
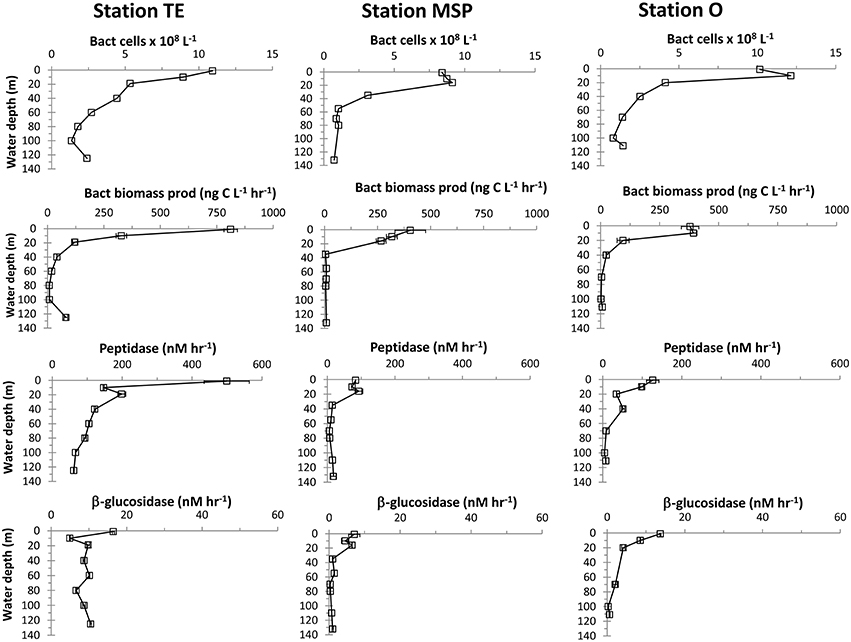
Figure 4. Depth profiles of bacterial cell numbers, bacterial biomass production, and hydrolytic enzyme activities (peptidase and glucosidase). Error bars indicate standard deviations of average values.
Bacterial Biomass Production (Leucine Incorporation)
Depth profiles of bacterial biomass production rates were generally highest in surface waters, decreasing considerably with depth (Figure 4). Biomass production in surface waters of Stn. TE was approximately double the rates at Stns. MSP and O. Bacterial biomass production rates at midwater depths were similar among the three sites. Bottom water rates at Stn TE, however, were one order of magnitude higher than at similar depths at the other two stations. Bacterial production on a per-cell basis (Table 2) showed a pattern very similar to bulk biomass production: highest rates were found at the surface of Station TE; the bottom-most depth also showed an elevated rate (Table 2).
Hydrolytic Enzymatic Activities
Peptidase and glucosidase activities were generally higher at the surface compared to subsurface waters with highest activities in Stn. TE surface waters (Figure 4). In subsurface waters at Stn. TE, peptidase and glucosidase activities were also generally more rapid than at Stns. MSP and O at the same depths. Profiles of cell-specific peptidase activities showed considerable variability with depth at Stn. TE, an increase with depth at Stn. MSP, and a comparatively constant profile with depth at Stn. O, with a single maximum at 40m (Table 2). Cell-specific glucosidase activities at Stn. TE increased considerably with depth. Only minor variations with depth were found at Stn. MSP, while cell-specific glucosidase activities showed a decreasing trend with depth at Stn. O.
Discussion
Characteristics of Organic Matter
All three sites were influenced by Mississippi River water outflow, as indicated by the presence of a strong halocline in the upper ~10m of the water column (Figure 2). Surface water salinities of >30 PSU (Figure 2) are typical for a low discharge season in late summer/early fall (Walker et al., 2005; Green et al., 2006). However, the high surface water DOC concentrations at all three sites greatly exceeded those reported from the same area at low river discharge (Biddanda et al., 1994; Benner and Opsahl, 2001), and are more typical for high riverine outflow conditions (Wang et al., 2004). The DOC concentrations generally followed surface water salinity, which also point toward input from Mississippi River outflow (Stolpe et al., 2010). Thus, high salinity/high DOC surface water at the time of sampling may have resulted in part from intense Mississippi River discharge following the landfall of Hurricane Isaac 2 weeks prior to our sampling. Hurricane Isaac pushed large volumes of marine waters upstream the Mississippi River (Berg, 2013), leading to subsequent discharge of higher salinity river plumes which carried elevated levels of terrestrial material onto the Louisiana shelf. Given the extent of the storm surge (>300 river miles; US Army Corps of Engineers, 2013), riverine discharge likely continued for over 10 days after the storm had passed, into the beginning of our sampling period.
Riverine DOC has generally higher residence times in river plumes than particulate matter from riverine outflow which rapidly flocculates and sediments near the Mississippi River mouth (Bianchi et al., 2002). Near-bed transport of riverine particulate matter onto the shelf is generally high at times of high riverine discharge (Bianchi et al., 2006), and can explain the presence of the bottom water turbidity layer at Stn. MSP (Figure 2) that were also found at sites further offshore during the same cruise (Ziervogel et al., 2015).
Much of the particulate matter in surface waters at the time of sampling was derived from autochthonous primary production, as indicated by C/N ratios (Table 2) that were distinctly lower than those at nearby sites during high riverine discharge in late spring (Wang et al., 2004) as well as from sites sampled further offshore during the same cruise (Ziervogel et al., 2015). Following tropical storms and hurricanes, enhanced flux of inorganic nutrients from the Mississippi River often stimulate phytoplankton blooms on the Louisiana Shelf (Lohrenz et al., 2008). In the aftermath of Hurricane Lili in 2002, for instance, satellite remote sensing detected elevated chl a levels on the Louisiana shelf for over 14 days with varying intensity throughout the observation period (Yuan et al., 2004). We found evidence of considerable surface water phytoplankton biomass at the two sites close to the river mouth (Stns. TE and MSP, Figure 2; Table 2) with peak chl a concentrations that were double those reported from remote sensing observations during storm-induced algal blooms on the Louisiana Shelf (Yuan et al., 2004), and higher than those reported from nearby sites at >30 PSU in late summer/early fall at a time of low riverine discharge (Lohrenz et al., 1999). Strong protein-like fluorescence signals within the BEPOM fraction that were consistent with peak chl a levels also indicated the presence of freshly-produced POM in surface waters (Figure 3; note the difference in scales). Results from Stn. O showed low chl a and strong humic-like BEPOM fluorescence that could indicate substantial microbial processing of autochthonous primary production further away from the river mouth (Burdige et al., 2004; Shimotori et al., 2011).
TEP and CSP that often form from dissolved phytoplankton metabolites during a phytoplankton bloom (Long and Azam, 1996; Passow, 2002) were somewhat disconnected from phytoplankton biomass at all three sites (Table 2), and had lower abundances compared to other coastal waters during peak phytoplankton growth (e.g., Mari and Kiørboe, 1996). TEP and CSP numbers were more similar to those found during early growth stages of cultured phytoplankton (Grossart et al., 2006), suggesting that our sampling coincided with the onset of algal blooms on the Louisiana Shelf.
Microbial Biomass and Activities
Microbial community activities varied considerably among the three stations, despite generally similar cell counts (Figure 4; Table 2), which were in the same range as previously reported cell abundances from the northern Gulf of Mexico (Amon and Benner, 1998; Arnosti and Steen, 2013). Peak bacterial biomass production rates in surface waters at Stn. TE were double compared to Stns. MSP and O, and other near-shore sites in the Gulf of Mexico (Steen et al., 2012) that had somewhat higher cell counts (Arnosti and Steen, 2013). Surface water peptidase activities at Stn. TE were five times higher compared to Stns. MSP and O on a bulk-volume as well as on a per-cell basis. Peptidase activities in Stn TE mid- and bottom waters were also considerably higher compared to the other two sites. Glucosidase activity followed a similar pattern with highest rates on a bulk as well as per-cell basis at Stn. TE, followed by Stn. O, and then by Stn. MSP (Figure 4; Table 2). Compared to previous reports from near-shore sites in the Gulf of Mexico, peak peptidase activities at Stn. TE were more than double those measured in Mississippi River plumes in the Atchafalaya Bay (Ammerman and Glover, 2000), and were more than an order of magnitude higher than at other nearby sites affected by Mississippi River plumes (Liu and Liu, 2015). In Pensacola Bay, northwestern Florida, peptidase and glucosidase activity averaged over different times of a year were 165 and 10 nM L−1, respectively (Murrell, 2003), and thus also considerably lower than peak activities at Station TE. Peptidase and glucosidase activities at the offshore sites sampled during the same cruise were up to one order of magnitude lower than at Stn. TE, MSP, and O (Ziervogel et al., 2015).
Several trends emerge from these data: Bacterial biomass production decreased much more rapidly with depth relative to cell counts at all sites, a pattern in the northern Gulf of Mexico that has been attributed to subsurface communities that grow less actively than their surface counterparts (Skoog et al., 1999; Arnosti and Steen, 2013). Notably, however, cell-normalized peptidase activities decreased comparatively little with depth, and even increased with depth at specific locations, such as bottom waters of Stn. MSP and near-bottom waters of Stn. TE; cell-normalized glucosidase activities increased with depth especially at Stn. TE (Table 2). These data suggest that substrate acquisition was still a major focal point of heterotrophic activity, even if incorporation into cell biomass was less prevalent. Much of the glucose taken up by microbial communities in the northern Gulf of Mexico may be respired to CO2 rather than incorporated into biomass (Arnosti and Steen, 2013); a similar situation may explain high peptidase activities and lower rates of bacterial protein production. High rates of enzyme activities thus do not necessarily correlate directly with increases in microbial biomass, an observation that has been also made in the deep North Atlantic (Baltar et al., 2009).
Patterns of Microbial Activities: Links to Organic Matter
Surface water bacterial activities at Stns. TE and MSP in part followed the patterns of POC concentrations and BEPOM fluorescence. In particular, elevated bacterial protein production and enzyme activities correspond to the depths with peak chl a concentrations, POC with low C/N ratios, and strong protein-like BEPOM fluorescence, and yielded significant correlations between bacterial activities and chl a (Stns. O and TE) and POC (Stns. O and MSP; Table 3). These results indicate that bacterial community activities at the Stns. TE and MSP were mainly driven by freshly produced, autochthonous POM at the time of sampling. In contrast, Stn. O had lowest surface water chl a and POC concentrations at relatively high C/N ratios, as well as comparatively substantial humic-like in addition to the protein-like fluorescence in the BEPOM spectra. Nonetheless, cell-specific peptidase and glucosidase activities in surface waters at Stn. O were somewhat higher compared to Stn. MSP, suggesting that bacterial communities at Stn. O were capable of degrading organic matter substrates that were different in their structure and possibly origin compared to the other two sites.
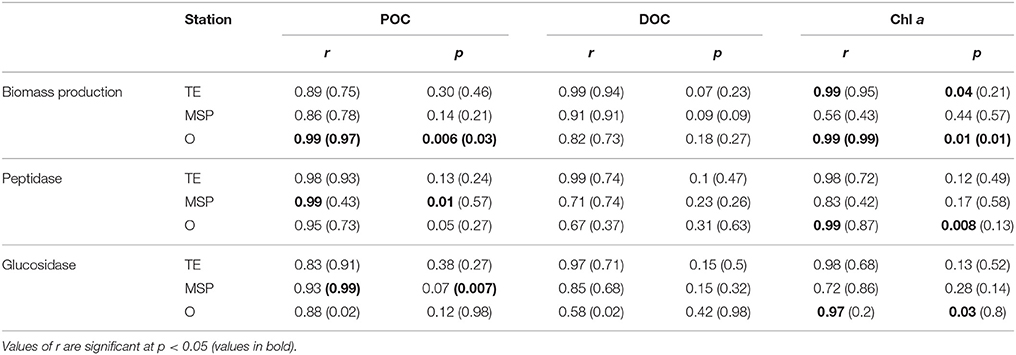
Table 3. Parson's correlation coefficient (r) between bacterial activity parameters and POC, DOC, and Chl a (r and p-values from cell-specific activities in parenthesis).
In contrast to the POM pool, peak DOC concentrations (Stn. O at 10 m), did not support elevated bacterial activities, perhaps a result of the mainly terrestrial origin of the DOC pool at the time of sampling. No significant correlations were found for bacterial activity parameters and DOC (Table 3), and estimates of bacterial utilization of carbon suggest that heterotrophic bacteria used a much higher fraction of the POC pool compared to the DOC pool (Table 4). Neither the DOC nor the POC concentrations, however, provide a ready explanation for the comparatively elevated microbial activities in the deeper water column at Stn. TE. The comparatively high chl a concentration as well as POC with relatively low C/N ratios at a depth of 125m, however, may provide a clue. In particular, a chl a concentration in excess of 1 μg L−1 at a depth of 125 m—four times the concentration at Stn. MSP, and more than 10 times the concentration at Stn. O—suggests that the vertical transport of freshly-produced phytoplankton material at Stn. TE is considerably greater than at the other two stations. The lack of a significant humic (terrestrially-derived) peak in the BEPOM spectrum supports the hypothesis that the POC at depth at Stn. TE is predominantly autochthonous. Moreover, the elevated CSP concentrations at depth support the hypothesis that protein-containing components are abundant in these waters. Assuming that some of this material is also metabolized during vertical sinking through the water column, microbially-driven metabolism of comparatively freshly produced marine organic matter may also drive the higher rates of bacterial biomass production as well as enzyme activities measured at intermediate depths at Stn. TE. Amon and Benner (1998) also found enhanced below-surface bacterial biomass production rates at nearby sites, suggesting that sinking of organic matter from the surface may have fueled heterotrophic activities below the pycnocline.
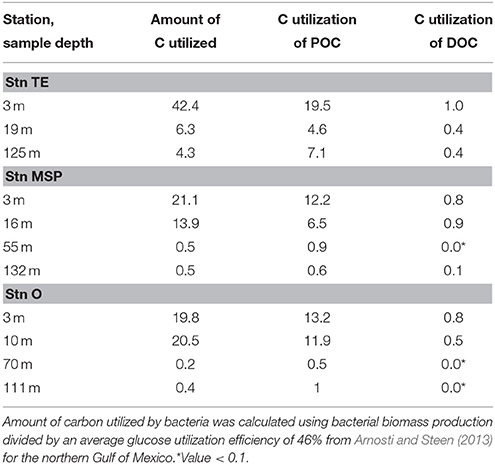
Table 4. Estimates of carbon utilization by heterotrophic bacteria (μg C L−1 d−1) relative to POC and DOC (%).
The site-specific differences in bacterial activities observed here may also reflect functional differences in heterotrophic bacterial communities among water masses and/or sites. Previous investigations in the Gulf of Mexico (Steen et al., 2012), as well as in transects covering riverine-to-marine conditions (Ziervogel and Arnosti, 2009) have demonstrated that the capacity for pelagic microbial communities to hydrolyze a suite of complex substrates varies considerably, differences that may be correlated to differences in microbial community composition (Teske et al., 2011; D'Ambrosio et al., 2014). Factors that may drive differences in bacterial community structure and activities at the investigated sites include differences in freshwater influence due to the location of the three sites relative to the river mouth (Liu and Liu, 2015). It is also possible that bacterial community structure and function is influenced by the chronic oil leakage from the sunken Taylor Energy platform near Stn. TE. Microbial communities in the water column of the Gulf of Mexico contain members capable of degrading petroleum hydrocarbons as well as secondary transformation products (Arnosti et al., 2015); increased peptidase and glucosidase activities in Gulf of Mexico surface waters affected by natural oil seeps (Ziervogel et al., 2014) as well as in surface and deep waters affected by the 2010 BP oil spill (Ziervogel et al., 2012; Ziervogel and Arnosti, 2013) have been recently documented.
Conclusions
Our results that provide a snapshot of biogeochemical processes on the Louisiana shelf following high discharge of the Mississippi River, suggest that heterotrophic microbial community activities were closely linked to phytoplankton-derived POM in the aftermath of Hurricane Isaac. DOC concentrations could only in part explain bacterial activity patterns, showing a disconnect at the station furthest away from the river mouth, where substrates from terrestrial sources may have dominated the DOC pool. The close link between POM and bacterial activities became apparent by combining activity measurements of natural heterotrophic bacterial communities with fluorescence properties of POM (BEPOM) that constituted a substantial fraction of the POC pool (Table 2). This study is the first that merges BEPOM fluorescence with rates of heterotrophic bacterial activities, providing a better understanding of bacterial transformation of POM especially in particle-rich coastal environments.
Author Contributions
KZ measured enzyme activities, TEP and CSP abundance; ND counted bacterial cells, JB measured leucine incorporation rates; KZ, ND, JB, and JM conducted the field sampling with JM leading the CTD operations; AB and CO conducted the BEPOM analysis; UP provided POC/PON and chl a data, and helped preparing TEP and CSP slides; SJ and CA helped planning the field sampling and bacterial activity analysis; KZ and CA wrote the paper with input from all authors.
Conflict of Interest Statement
The authors declare that the research was conducted in the absence of any commercial or financial relationships that could be construed as a potential conflict of interest.
Acknowledgments
We thank the captain and shipboard party of RV Endeavor (cruise 515). We thank Dan Hoer (UNC) for DOC measurements, Julia Sweet (UCSB) for POC and chl a analysis, and Trent Bottoms (UNC) who helped analyzing TEP and CSP. We also thank Andrew Juhl (LDEO, Columbia University) for the use of equipment and supplies for microscopy, and Kendra Bullock (Columbia University), for assistance with microscopy. This research was made possible in part by a grant from The Gulf of Mexico Research Initiative supporting the ECOGIG (Ecosystem Impacts of Oil and Gas Inputs to the Gulf) consortium (ECOGIG contribution # 367). The data are publicly available through the Gulf of Mexico Research Initiative Information & Data Cooperative (GRIIDC) at https://data.gulfresearchinitiative.org (doi: R1.x132.134:0111, R1.x132.134:006). Additional funding for K.Z. came from the National Science Foundation (OCE-1335088) and for C.O. from the Strategic Environmental Research and Development Program Environmental Restoration grant and the North Carolina State University Faculty Research and Professional Development program.
References
Ammerman, J. W., and Glover, W. B. (2000). Continuous underway measurement of microbial ectoenzyme activities in aquatic ecosystems. Mar. Ecol. Prog. Ser. 201, 1–12. doi: 10.3354/meps201001
Amon, R. M., and Benner, R. (1998). Seasonal patterns of bacterial abundance and production in the Mississippi River plume and their importance for the fate of enhanced primary production. Microb. Ecol. 35, 289–300. doi: 10.1007/s002489900084
Arnosti, C. (2011). Microbial extracellular enzymes and the marine carbon cycle. Ann. Rev. Mar. Sci. 3, 401–425. doi: 10.1146/annurev-marine-120709-142731
Arnosti, C., and Steen, A. D. (2013). Patterns of extracellular enzyme activities and microbial metabolism in an arctic fjord of Svalbard and in the northern Gulf of Mexico: contrasts in carbon processing by pelagic microbial communities. Front. Microbiol. 4:318. doi: 10.3389/fmicb.2013.00318
Arnosti, C., Ziervogel, K., Yang, T., and Teske, A. (2015). Oil-derived marine aggregates – hot spots of polysaccharide degradation by specialized bacterial communities. Deep Sea Res. II. doi: 10.1016/j.dsr2.2014.12.008i. [Epub ahead of print].
Baltar, F., Arístegui, J., Sintes, E., van Aken, H. M., Gasol, J. M., and Herndl, G. J. (2009). Prokaryotic extracellular enzymatic activity in relation to biomass production and respiration in the meso- and bathypelagic waters of the (sub)tropical Atlantic. Environ. Microbiol. 11, 1998–2014. doi: 10.1111/j.1462-2920.2009.01922.x
Benner, R., and Opsahl, S. (2001). Molecular indicators of the sources and transformations of dissolved organic matter in the Mississippi River plume. Org. Geochem. 32, 597–611. doi: 10.1016/s0146-6380(00)00197-2
Bianchi, T., Lambert, C., Santschi, P., and Guo, L. (1997). Sources and transport of land-derived particulate and dissolved organic matter in the Gulf of Mexico (Texas shelf/slope): the use of lignin-phenols and loliolides as biomarkers. Org. Geochem. 27, 65–78. doi: 10.1016/S0146-6380(97)00040-5
Bianchi, T. S., Allison, M. A., Canuel, E. A., Corbett, D. R., McKee, B. A., Sampere, T. P., et al. (2006). Rapid export of organic matter to the Mississippi canyon. Eos Trans. Am. Geophy. Union 87, 565–573. doi: 10.1029/2006EO500002
Bianchi, T. S., Garcia-Tigreros, F., Yvon-Lewis, S. A., Shields, M., Mills, H. J., Butman, D., et al. (2013). Enhanced transfer of terrestrially derived carbon to the atmosphere in a flooding event. Geophys. Res. Lett. 40, 116–122. doi: 10.1029/2012GL054145
Bianchi, T. S., Mitra, S., and McKee, B. A. (2002). Sources of terrestrially-derived organic carbon in lower Mississippi River and Louisiana shelf sediments: implications for differential sedimentation and transport at the coastal margin. Mar. Chem. 77, 211–223. doi: 10.1016/S0304-4203(01)00088-3
Biddanda, B., Opsahl, S., and Benner, R. (1994). Plankton respiration and carbon flux through bacterioplankton on the Louisiana shelf. Limnol. Oceanogr. 39, 1259–1279. doi: 10.4319/lo.1994.39.6.1259
Brym, A., Paerl, H. W., Montgomery, M. T., Handsel, L. T., Ziervogel, K., and Osburn, C. L. (2014). Optical and chemical characterization of base-extracted particulate organic matter in coastal marine environments. Mar. Chem. 162, 96–113. doi: 10.1016/j.marchem.2014.03.006
Burdige, D., Kline, S., and Chen, W. (2004). Fluorescent dissolved organic matter in marine sediment pore waters. Mar. Chem. 89, 289–311. doi: 10.1016/j.marchem.2004.02.015
Coble, P. G. (1996). Characterization of marine and terrestrial DOM in seawater using excitation emission matrix spectroscopy. Mar. Chem. 51, 325–346.
D'Ambrosio, L., Ziervogel, K., MacGregor, B., Teske, A., and Arnosti, C. (2014). Bacterial community composition and extracellular enzymatic function in marine waters. ISME J. 8, 2167–2179. doi: 10.1038/ismej.2014.67
Engel, A. (2009). “Determination of marine gel particles,” in Practical Guidelines for the Analysis of Seawater, ed O. Wurl (Boca Raton, FL: CRC Press), 125.
Green, R. E., Bianchi, T. S., Dagg, M. J., Walker, N. D., and Breed, G. A. (2006). An organic carbon budget for the Mississippi River turbidity plume and plume contributions to air-sea CO2 fluxes and bottom water hypoxia. Estuaries Coasts 29, 579–597. doi: 10.1007/BF02784284
Grossart, H.-P., Czub, G., and Simon, M. (2006). Algae-bacteria interactions and their effects on aggregation and organic matter flux in the sea. Environ. Microbiol. 8, 1074–1084. doi: 10.1111/j.1462-2920.2006.00999.x
Hoppe, H.-G. (1983). Significance of exoenzymatic activities in the ecology of brackish water – measurements by means of methylumbelliferyl-substrates. Mar. Ecol. Prog. Ser. 11, 299–308. doi: 10.3354/meps011299
Kirchman, D. L. (2001). “Measuring bacterial biomass production and growth rates from leucine incorporation from aquatic environments,” in Marine Microbiology - Methods in Microbiology, ed J. H. Paul (San Diego, CA: Academic Press), 227–238.
Li, W., Sheng, G., Lu, R., Yu, H., Li, Y., and Harada, H. (2011). Fluorescence spectral characteristics of the supernatants from an anaerobic hydrogen-producing bioreactor. Appl. Microbiol. Biotechnol. 89, 217–224. doi: 10.1007/s00253-010-2867-x
Liu, S., and Liu, Z. (2015). Comparing extracellular enzymatic hydrolysis between plain peptides and their corresponding analogs in the northern Gulf of Mexico Mississippi River plume. Mar. Chem. 177, 398–407. doi: 10.1016/j.marchem.2015.06.021
Lohrenz, S., Cai, W., Chen, X., and Tuel, M. (2008). Satellite assessment of bio-optical properties of northern Gulf of Mexico coastal waters following Hurricanes Katrina and Rita. Sensors 8, 4135–4150. doi: 10.3390/s8074135
Lohrenz, S., Fahnenstiel, G., Redalje, D., Lang, G., Dagg, M., Whitledge, T., et al. (1999). Nutrients, irradiance, and mixing as factors regulating primary production in coastal waters impacted by the Mississippi River plume. Cont. Shelf. Res. 19, 1113–1141. doi: 10.1016/S0278-4343(99)00012-6
Long, R., and Azam, F. (1996). Abundant protein-containing particles in the sea. Aquat. Microb. Ecol. 10, 213–221. doi: 10.3354/ame010213
Lunau, M., Lemke, A., Walther, K., Martens-Habbena, W., and Simon, M. (2005). An improved method for counting bacteria from sediments and turbid environments by epifluorescence microscopy. Environ. Microbiol. 7, 961–968. doi: 10.1111/j.1462-2920.2005.00767.x
Ma, J., Del Vecchio, R., Golanoski, K. S., Boyle, E. S., and Blough, N. V. (2010). Optical properties of humic substances and CDOM: effects of borohydride reduction. Environ. Sci. Technol. 44, 5395–5402. doi: 10.1021/es100880q
Mari, X., and Kiørboe, T. (1996). Abundance, size distribution and bacterial colonization of transparent exopolymeric particles (TEP) during spring in the Kattegat. J. Plankton Res. 18, 969–986. doi: 10.1093/plankt/18.6.969
Murrell, M. C. (2003). Bacterioplankton dynamics in a subtropical estuary: evidence for substrate limitation. Aquat. Microb. Ecol. 32, 239–250. doi: 10.3354/ame032239
Murrell, M. C., Stanley, R. S., Lehrter, J. C., and Hagy, J. D. (2013). Plankton community respiration, net ecosystem metabolism, and oxygen dynamics on the Louisiana continental shelf: implications for hypoxia. Cont. Shelf. Res. 52, 27–38. doi: 10.1016/j.csr.2012.10.010
Osburn, C. L., Handsel, L. T., Mikan, M. P., Paerl, H. W., and Montgomery, M. T. (2012). Fluorescence tracking of dissolved and particulate organic matter quality in a river-dominated estuary. Environ. Sci. Technol. 46, 8628–8636. doi: 10.1021/es3007723
Pakulski, J. D., Benner, R., Whitledge, T., Amon, R., Eadie, B., Cifuentes, L., et al. (2000). Microbial metabolism and nutrient cycling in the Mississippi and Atchafalaya River plumes. Estuar. Coast. Shelf Sci. 50, 173–184. doi: 10.1006/ecss.1999.0561
Passow, U. (2002). Transparent exopolymer particles (TEP) in aquatic environments. Prog. Oceanogr. 55, 287–333. doi: 10.1016/S0079-6611(02)00138-6
Rabalais, N. N., Diaz, R. J., Levin, L. A., Turner, R. E., Gilbert, D., and Zhang, J. (2010). Dynamics and distribution of natural and human-caused hypoxia. Biogeosciences 7, 585–619. doi: 10.5194/bg-7-585-2010
Ross, C. B., Gardner, W. D., Richardson, M. J., and Asper, V. L. (2009). Currents and sediment transport in the Mississippi Canyon and effects of Hurricane Georges. Cont. Shelf Res. 29, 1384–1396. doi: 10.1016/j.csr.2009.03.002
Schiller, R. V., Kourafalou, V. H., Hogan, P., and Walker, N. D. (2011). The dynamics of the Mississippi River plume: impact of topography, wind and offshore forcing on the fate of plume waters. J. Geophys. Res. 116, C06029. doi: 10.1029/2010JC006883
Shimotori, K., Watanabe, K., and Hama, T. (2011). Fluorescence characteristics of humic-like fluorescent dissolved organic matter produced by various taxa of marine bacteria. Aquat. Microb. Ecol. 65, 249–260. doi: 10.3354/ame01552
Strickland, J. D. H., and Parsons, T. R. (1972). A Practical Handbook of Seawater Analysis. Ottawa, ON: Fisheries Research Board of Canada.
Skoog, A., Biddanda, B., and Benner, R. (1999). Bacterial utilization of dissolved glucose in the upper water column of the Gulf of Mexico. Limnol. Oceanogr. 44, 1625–1633. doi: 10.4319/lo.1999.44.7.1625
Steen, A. D., Ziervogel, K., Ghobrial, S., and Arnosti, C. (2012). Functional variation among polysaccharide-hydrolyzing microbial communities in the Gulf of Mexico. Mar. Chem. 138, 13–20. doi: 10.1016/j.marchem.2012.06.001
Stolpe, B., Guo, L., Shiller, A. M., and Hassellhöv, M. (2010). Size and composition of colloidal organic matter and trace elements in the Mississippi River, Pearl River and the northern Gulf of Mexico, as characterized by flow field-flow fractionation. Mar. Chem. 118, 119–128. doi: 10.1016/j.marchem.2009.11.007
Teske, A., Durbin, A., Ziervogel, K., Cox, C., and Arnosti, C. (2011). Microbial community composition and function in permanently cold seawater and sediments from an arctic fjord of Svalbard. Appl. Environ. Microbiol. 77, 2008–2018. doi: 10.1128/AEM.01507-10
US Army Corps of Engineers (2013). Hurricane Isaac with and without 2012 100-year HSDRRS Evaluation. Final Report, US Army Corps of Engineers.
Wang, X. C., Chen, R. F., and Gardner, G. B. (2004). Sources and transport of dissolved and particulate organic carbon in the Mississippi River estuary and adjacent coastal waters of the northern Gulf of Mexico. Mar. Chem. 89, 241–256. doi: 10.1016/j.marchem.2004.02.014
Walker, N. D., Wiseman, W. J., Rouse, L. J., and Babin, A. (2005). Effects of river discharge, wind stress, and slope eddies on circulation and the satellite-observed structure of the Mississippi River Plume. J. Coast. Res. 21, 1228–1244. doi: 10.2112/04-0347.1
Yuan, J., Miller, R., Powell, R., and Dagg, M. (2004). Storm-induced injection of the Mississippi River plume into the open Gulf of Mexico. Geophys. Res. Lett. 31, L09312. doi: 10.1029/2003GL019335
Ziervogel, K., and Arnosti, C. (2009). Enzyme activities in the Delaware estuary affected by elevated suspended sediment load. Estuar. Coast. Shelf Sci. 84, 253–258. doi: 10.1016/j.ecss.2009.06.022
Ziervogel, K., and Arnosti, C. (2013). Enhanced protein and carbohydrate hydrolyses in plume-associated deepwaters initially sampled during the early stages of the Deepwater Horizon oil spill. Deep Sea Res. II. doi: 10.1016/j.dsr2.2013.09.003. [Epub ahead of print].
Ziervogel, K., Dike, C., Asper, V., Montoya, J., Battles, J., D'souza, N., et al. (2015). Enhanced particle fluxes and heterotrophic bacterial activities in gulf of mexico bottom waters following storm-induced sediment resuspension. Deep Sea Res. II. doi: 10.1016/j.dsr2.2015.06.017. [Epub ahead of print].
Ziervogel, K., D'souza, N., Sweet, J., Yan, B., and Passow, U. (2014). Natural oil slicks fuel surface water microbial activities in the Gulf of Mexico. Front. Aquat. Microbiol. 5:188. doi: 10.3389/fmicb.2014.00188
Keywords: hydrolytic enzyme activities, bacterial protein production, base-extracted POM, Mississippi River discharge, carbon cycle, Hurricane Isaac
Citation: Ziervogel K, Osburn C, Brym A, Battles J, Joye S, D'souza N, Montoya J, Passow U and Arnosti C (2016) Linking Heterotrophic Microbial Activities with Particle Characteristics in Waters of the Mississippi River Delta in the Aftermath of Hurricane Isaac. Front. Mar. Sci. 3:8. doi: 10.3389/fmars.2016.00008
Received: 02 October 2015; Accepted: 22 January 2016;
Published: 16 February 2016.
Edited by:
Marta Álvarez, Instituto Español de Oceanografía, SpainReviewed by:
Taichi Yokokawa, Japan Agency for Marine-Earth Science and Technology, JapanFederico Baltar, University of Otago, New Zealand
Copyright © 2016 Ziervogel, Osburn, Brym, Battles, Joye, D'souza, Montoya, Passow and Arnosti. This is an open-access article distributed under the terms of the Creative Commons Attribution License (CC BY). The use, distribution or reproduction in other forums is permitted, provided the original author(s) or licensor are credited and that the original publication in this journal is cited, in accordance with accepted academic practice. No use, distribution or reproduction is permitted which does not comply with these terms.
*Correspondence: Kai Ziervogel, a2FpLnppZXJ2b2dlbEB1bmguZWR1