 Kirralee G. Baker*
 Charlotte M. Robinson
 Dale T. Radford
 Allison S. McInnes
 Christian Evenhuis
 Martina A. Doblin
- Plant Functional Biology and Climate Change Cluster, School of Life Sciences, University of Technology Sydney, Sydney, NSW, Australia
How the functional traits (FTs) of phytoplankton change with temperature is important for understanding the impacts of ocean warming on phytoplankton mediated biogeochemical fluxes. This study quantifies the thermal performance curves (TPCs) of FTs in the cosmopolitan model diatom, Thalassiosira pseudonana, to advance understanding of trade-offs between physiological (photoacclimation, carbon fixation, nitrate, phosphate, and silicate uptake) and morphological traits (cell volume and frustule silicification). We show that each FT has substantial phenotypic plasticity and exhibits a unique TPC, varying in both shape and thermal optimum, and diverging from the growth response. The TPC for growth was symmetric with a thermal optimum (Topt) of 18°C. In comparison, the TPC for primary productivity was warm-skewed with a Topt around 21°C, whereas frustule silicification decreased linearly with increasing temperature. Together, this suggests that the optimal temperature for overall fitness is a balance of trade-offs in the underlying functional traits. Moreover, these results demonstrate that growth is not necessarily an accurate estimate of overall biogeochemical performance and that temperature change will likely influence elemental fluxes such as carbon and silicon. Finally, we show that temperature-driven changes in individual traits e.g., photoacclimation, can mimic responses experienced under other environmental stressors (high light) and so a multi-trait assessment is essential for accurate interpretation of the cellular impact of warming. This study also reveals that multi-trait analysis, in the context of TPCs, provides insight into the cellular physiology regulating the whole cell response and has the potential to provide better estimates of how diatom-mediated biogeochemical fluxes are likely to be impacted in the context of ocean warming. Analyzing the response of multiple traits more comprehensively over other environmental gradients may therefore provide a useful framework to advance understanding of how taxon-specific functional traits will respond to multifaceted ocean change.
Introduction
Marine phytoplankton are a ubiquitous and diverse group of photosynthetic microbes found in the sunlit layers of our global ocean. Their metabolic processes and therefore distribution and abundance, are controlled by ocean temperature (Thomas et al., 2012) which is shifting as a result of contemporary climate change and creating novel environments not yet encountered by phytoplankton (Boyd et al., 2010). Ocean temperature will act selectively on phytoplankton physiology, impacting fitness, and modifying distributions by favoring populations with “fit phenotypes” for their respective habitats (Chevin et al., 2013). From the whole cell perspective, the “fit phenotype” is a culmination of trade-offs between many functional traits (FTs), the underlying elements of the phenotype that dictate fitness and ecological function (Litchman and Klausmeier, 2008). Trade-offs are likely to have significant implications for the functional ecology of our marine systems, because many FTs are either directly or indirectly related to biogeochemical processes (Figure 1; Falkowski et al., 1998; Litchman and Klausmeier, 2008).
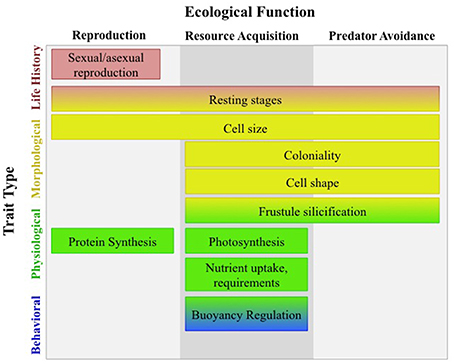
Figure 1. Typology of diatom functional traits redrawn from Litchman and Klausmeier (2008). Trade-offs between many functional traits have significant implications for the functional ecology of marine systems as many of these traits are involved in resource acquisition and have direct control over biogeochemical fluxes. Physiological traits such as nutrient uptake directly affect the elemental cycles of carbon, nitrogen, phosphorus, and silicon; whereas, morphological traits such as cell size and frustule silicification regulate these biogeochemical cycles by effecting cell aggregation and cell sinking rates.
Diatoms, a group of silicifying phytoplankton, are major drivers of both the carbon (C) and silicon (Si) cycles through their proportionally large contribution to total oceanic primary production (20–25%; Nelson et al., 1995), C export from surface oceans, and obligate requirement for Si to build their cell walls. When diatoms experience environmentally stressful conditions, they become more silicified because carbon assimilation relative to silicate uptake slows, leading to an uncoupling between C and Si cycling (Finkel et al., 2010a). To advance our understanding of how diatom-mediated biogeochemical fluxes are impacted by climate change, more detailed experimentation, observations, and modeling are necessary to quantify changes in specific phenotypic traits and physiological trade-offs under different environmental conditions.
Investigation of individual traits of an organism is known as phenomics and the relationship between these traits and the environmental parameter of interest is usually achieved through measurement of performance curves, typically determined under constant conditions along a gradient of one environmental variable. Performance curves are powerful for modeling purposes as they describe the shape of the trait-environment relationship. Thermal performance curves (TPCs) are the distinct case where temperature is chosen as the environmental variable of interest and typically have a bell-curve shape (Huey and Stevenson, 1979). This contrasts with performance curves for increasing light, inorganic carbon or dissolved nutrients, which are often hyperbolic (Cullen et al., 1993). TPCs show significant within (and between) taxon variability, as a community wide study demonstrated when several strains of the same species grown under identical culture conditions had different thermal optimum (Topt) and critical minimum (CTmin) and maximum (CTmax) temperatures (Boyd et al., 2013). Furthermore, FTs may not have the same shaped response as growth, due to differences in their plasticity or underlying mechanistic controls e.g., cell size often changes linearly (Atkinson et al., 2003), and some traits remain relatively constant (Davison, 1991). The significant diversity underlying species and trait-specific TPCs explains why for most studies to date, traits have only been measured at a limited number of points across the range of an environmental parameter (Lohbeck et al., 2012) or in numerous species but for a limited number of traits (Boyd et al., 2013).
To our knowledge, no study to date has provided a comprehensive analysis of multiple trait responses across a full range of temperatures. Additionally, by detailing how physiological traits and rate processes are controlled by temperature, trade-offs between FTs can be examined. Trait-based approaches such as these have been invaluable for demonstrating that trade-offs largely determine species niches and ecological function, but so far have only been modeled along nutrient gradients (Litchman et al., 2007); trade-offs between FTs along temperature gradients remain relatively unknown.
To advance understanding of how ocean warming will affect diatom-mediated biogeochemical fluxes, we conducted an in-depth characterization of TPCs in functional traits of the cosmopolitan, model diatom species Thalassiosira pseudonana. We focused specifically on morphological traits: cell size and frustule silicification, as well as physiological traits: photosynthesis, and the assimilation of carbon and other nutrients (nitrogen, phosphorus, silicon). Whilst the shapes of these TPCs have not yet been elucidated in this species, we hypothesized that the thermal optimum and shape of individual functional traits would differ from the whole organism growth response.
Methods and Materials
Experimental Setup
The coastal centric diatom, T. pseudonana CS-173 was obtained from the Australian National Algae Culture Collection (CSIRO, Hobart, Australia). This marine strain originates from Moriches Bay of the Forge River (Long Island, New York, USA) in the North Atlantic Ocean and is identical to the National Centre of Marine Algae and Microbiota (NCMA) strain CCMP1335. T. pseudonana was maintained in glass Erlenmeyer flasks at 20°C in seawater medium (0.2 μm filtered coastal seawater obtained from Port Hacking National Reference Station, PH100, New South Wales, Australia) with f/2 enrichment (Guillard and Ryther, 1962); 8.82 × 10⁻⁴ M NaNO3; 3.62 × 10⁻⁵ M, NaH2PO4 H2O; 1.06 10−4 M, Na2SiO3H2O, trace metal solution and vitamin solution). Before experimental measurements were made, cultures of 30 ml were grown in triplicate glass vessels for 3–4 generations over a temperature gradient spanning 11–35°C which was monitored using a calibrated thermocouple (Comark, United Kingdom). The temperature gradient was established using a thermal gradient block; where hot and cold water was generated using separate immersion heater chillers (Julabo GmbH, Germany) and was then circulated through milled channels at opposite ends of the block. Light (cool white) was supplied (50 μmol photons m−2 s−1) by an array of light emitting diodes (LEDs; Schenzen Cidly Group, China) set to a 12: 12 light: dark cycle. This irradiance was consistent with previous light conditions of inoculum cultures and was verified with a microspherical quantum sensor (Walz, Germany). Morphological and physiological trait measurements (described below) were made during the exponential growth phase following 3–4 generations of acclimation.
Phenotype Fitness
The exponential growth of cells was used to estimate fitness of the phenotype expressed at each temperature (12 temperatures across the 11–35°C gradient). Cell counts were performed daily using a flow cytometer (BD Influx, Becton Dickinson, Brussels, Belgium) equipped with a 50 mW laser emitting at a fixed wavelength of 488 nm. To assess mortality and estimate growth of live cells, a nucleic acid stain (SYTOX green, Molecular Probes, Leden, Nederland) was used to quantify living cells following the protocol of Peperzak and Brussaard (2011). Briefly, samples of 100 μl were incubated with the stain (final concentration 0.5 μM) in the dark at room temperature for 10 min prior to flow cytometric analysis. Live cells were selected as negative for SYTOX stain (gated on side scatter and green fluorescence (585/40 nm) (for more information see gating logic in Supplementary Figure 1). Population statistics were calculated using particle counts in gates that were consistent across the experiment, acquired with the same instrument settings.
Morphological Traits
Cellular Volume
Cells were harvested in exponential growth phase when volumes of 1 ml were sampled and stored in glutaraldehyde (final concentration 1% v/v) until later analysis was carried out using a Coulter Counter equipped with a 20 μm aperture (Multisizer 4, Beckman Coulter GmbH, Germany). Sample volumes of 1 ml were diluted in 4 ml freshly filtered seawater (0.2 μm) to meet instrument operational requirements (minimum analytical volume of 5 ml). Population statistics were then calculated from ≥500 cells, ranging from 2 to 9 μm. These cell sizes were then calibrated against external standards with beads of known size (2.0, 4.1, and 5.7 μm; ThermoFisher Scientific, Australia) and produced a linear regression of R2 > 0.99.
Frustule Silicification
To measure newly deposited diatom frustules, samples of 10 ml were harvested in exponential phase and incubated in the presence of the fluorescent label Lysosensor Yellow/Blue DND-160 (otherwise known as PDMPO, ThermoFisher Scientific, Australia) following the labeling protocol of Leblanc and Hutchins (2005). Briefly, cells were incubated in the presence of the dye (final concentration 0.125 uM) along with a control sample that did not contain PDMPO (to quantify background fluorescence) at experimental conditions for 24 h. Following incubation, a 500 uL aliquot of each sample was enumerated flow cytometrically (BD Influx, Becton Dickinson, Brussels, Belgium) where the relative fluorescence of incorporated PDMPO was quantified against fluorescent beads (1 μm, ThermoFisher Scientific, Australia) at UV excitation of 355 nm and blue fluorescence at 469/29 nm (for more information see gating logic in Supplementary Figure 2). Fluorescence per cell was then normalized to cellular volume (quantified by the Coulter Counter method as described above) to correct for any differences in fluorescence due to cell size.
Physiological Traits
Photophysiology
Fast repetition rate fluorometry (FRRf) was applied to assess the electron transport kinetics of photosystem II (PSII) at each temperature. Two milliliter samples were harvested during exponential growth and measurements were made on each sample immediately after being removed from the temperature block. The first measurement was performed in the dark (semi-dark adapted to allow down-regulation of very fast relaxing non-photochemical quenching) and actinic white light at the growth irradiance intensity (47 μmol photons m−2 s−1) was supplied by a white LED for 1 min and measurements performed at 20 s intervals during the actinic light exposure. The last measurement of each set was used in further calculations of photochemical efficiency. A Chelsea Technologies FASTocean fluorometer supplied single-turnover excitation flashlets (of 1.1 μs duration) at 450 nm at a rate of 2 μs to achieve full saturation of PSII reaction centers followed by longer intervals of 100 μs to allow relaxation and re-oxidation of QA. Profiles of the fluorescence emission were fitted within the FastPro8 software (v. 1.0.55; Chelsea Technologies) to the Kolber-Prasil-Falkowski model to yield the minimum (FO or F′; “indicates light adapted samples”) and maximum fluorescence (FM or FM′), effective absorption cross section of PSII (σ or σ′; nm2) and re-oxidation kinetic of QA (τ; μs). Values for the photochemical efficiency (ΦPSII or ΦPSII′; both dimensionless) were calculated from these parameters as (FM − FO/FM) or (FM′ − F′/FM′) for light adapted samples. Sample filtrate (after filtration through 0.2 μm Millipore syringe filters) was also measured in the FRRf to account for background fluorescence. The data was visually inspected to ensure no fluorescence induction in the filtrate (indicating an absence of phytoplankton) and the mean FO and FM of the filtrate were averaged into a single value to be subtracted from all FO(or F′) and FM (or FM′) values.
A second series of measurements was performed to parameterize the light-dependent response of electron transport kinetics and identify shifts in the light-saturated rates of electron transport and the light utilization efficiency. In the interest of minimizing diurnal impacts (Schuback et al., 2016), we conducted rapid light curves on a single replicate for each temperature to reduce the time period of measurements. Measurements of the light dependent electron transport rate (ETR) were achieved with a rapid light curve protocol where samples were illuminated by the FASTAct instrument chamber that supplied actinic white light at increasing light intensities of 0, 10, 28, 47, 66, 85, 104, 123, 160, 251, 330, 402, 550, 756, 905, 1208 μmol photons m−2 s−1. Each sample was dark adapted for 10 min prior to measurement at ambient temperature, and each actinic light intensity was applied for 20 s and measurements collected every 10 s, with the last measurement at each light step recorded as the fluorescence yield for that light step. The ambient temperature of each temperature treatment was maintained during the light curves using a flow-through water bath attached to the FASTAct sample chamber set at the required temperature. The electron transport rate was calculated using an in-built “Sigma algorithm” within FASTPro8 (see Oxborough et al., 2012; Robinson et al., 2014). The light dependency of the electron transport rate was modeled by fitting ETR to a Jasby-Platt model to derive the light utilization efficiency (α) and light saturation irradiance (Ek).
Chlorophyll a Content
Sample volumes of 2 ml were harvested in exponential growth phase and centrifuged at 5000 g for 5 min at 20°C. The supernatant was discarded and cell pellets stored frozen at −80°C until analysis (carried out within 3 months). Pigments were extracted for 15 min in the dark at 4°C in a 3 ml volume of 3:2 90% acetone: 100% dimethyl sulfoxide extraction reagent (Shoaf and Lium, 1976). Chlorophyll a was determined in a fluorometer (TD-700, Turner Designs, USA) using the non-acidification method of (Welschmeyer, 1994). The fluorometer was calibrated with pure chlorophyll a (Sigma-Aldrich, USA), whose concentration was calculated from absorbance via using the coefficients in Jeffrey et al. (1997).
Primary Productivity (14C Uptake)
To estimate primary productivity across the temperature gradient, carbon fixation rates were measured using 14C-labeled bicarbonate in small volume incubations as described in Doblin et al. (2011). Specifically, radiolabeled NaH14CO3 (stock solution 1.85 × 10⁷ Bq) was added to 5 ml of culture in clear glass tubes (1.5 μCi per tube) and incubated in the thermal gradient block for 60–80 min under the growth irradiance. Activity in the samples was determined by removing a 100 μl aliquot from three randomly selected tubes and placing it into 5 ml of refrigerated 0.1 M NaOH, adding 10 ml scintillation fluid (Ultima Gold™, Perkin Elmer) and shaking before counting using a liquid scintillation counter (Packard TriCarb 2900 TR). Each temperature contained a dark sample wrapped in aluminum foil to quantify carbon fixation in the dark. Following incubation, tube contents were transferred to scintillation jars, acidified with 100 μL 6 M HCl and shaken on an orbital shaker for 12 h to remove inorganic 14C. Scintillation fluid (10 ml Ultima Gold™; Perkin Elmer) was then added to each sample, vigorously shaken and left for 3 h before counting. Counting time was set to 5 min so that counts were within a 5% counting error.
Elemental Uptake of Nitrogen, Phosphate, and Silicate
To estimate the net cellular uptake of N, P, and Si, (added to cultures as nitrate, phosphate and silicate) the difference between nutrient concentrations at the start and end of the experiment was calculated and normalized to the difference in cell abundance to account for differences in growth. Subsamples at each time point were removed from all experimental vessels and centrifuged at 5000 g for 5 min at 20°C. The supernatant (500 uL) was then removed and stored frozen at −20°C until colorimetric analysis to determine concentrations of nitrate (), nitrite (), phosphate (), and reactive silicate (). Nitrate () contents were determined indirectly as described in Schnetger and Lehners (2014). Briefly, nitrite () concentrations were analyzed by the Griess-Ilosvay method and subtracted from total nitrogen (NOx) obtained though the vanadium (III) chloride reduction reaction. The nitrate values were linear between 1 and 100 μM and the detection limit was 0.15 μM. Inorganic phosphorus was determined by the sensitive detection method of Hoenig et al. (1989) where values were linear between 1 and 15 μM and the detection limit was 0.95 μM. Reactive silicate was determined by a miniaturized modification of Strickland and Parsons (1968) where values were linear between 1 and 150 μM and the detection limit was 9.5 μM. Where necessary, samples were diluted in order to obtain concentrations within the linear detection range of each colorimetric method.
Data Analysis
Prior to this study, the TPCs for many functional traits had not been described, so trait responses were visually inspected before analysis. Traits that showed positive, negative, or no relationships with temperature were described using simple linear regression where statistical significance was accepted at p < 0.01. Traits that exhibited a bell-shaped curve were described by the following equation:
This is a transformation of the equation described by Thomas et al. (2012), Boyd et al. (2013) so that it is parameterized by the CTmin and CTmax temperatures. The shape of the TPC is controlled by three important temperature traits: CTmin and CTmax (which determine the thermal niche width), and b, a coefficient of the Eppley curve (Eppley, 1972), an exponential relationship thought to provide the constraint on community-level phytoplankton growth as a function of temperature. The optimum temperature, Topt, is where the slope of the curve is zero. This can be found by taking the derivative of Equation (1) with respect to T and finding where it is 0 by solving a quadratic equation. This yields the following equation:
where:
When fitting curves to data for individual traits, it was found that estimates of CTmin produced unrealistic results and therefore it was necessary to constrain b and CTmin to positive values.
The parameter values in Equation (1) were found by Maximum Likelihood Estimation (MLE) (assuming normally distributed errors). Confidence intervals were found by parametric bootstrapping. Using the MLE of the parameters: (i) synthetic data with the same temperature sampling as the experimental data was generated using Equation 1, (ii) Equation 1 was then fitted to a synthetic data set by MLE, (iii) new parameter values, as well as the Topt and maximum values were stored. This process was repeated a total of 5000 times. From these distributions the 95% confidence intervals were calculated as the range between the 2.5th and 97.5th quantiles. These estimates of uncertainty were vital for subsequent analyses, as they allowed us to appropriately account for the inherent differences in uncertainty between different traits. Confidence bands were calculated in a similar fashion. For each synthetic dataset the function values were stored from 0 to 40°C in 0.5°C increments. At each stored temperature the confidence intervals were calculated as above.
Results
Consistent with our hypothesis, the TPCs of some functional traits could be well described by bell-shaped curves, including growth rate, primary productivity, and chlorophyll content. These FTs had better goodness-of-fit, with relatively low values of root mean squared error; RMSE (i.e., close to zero) and hence better predictability with temperature (Table 1). In contrast, cellular uptake of nitrite, phosphate, and silicate was less predictable, with higher values of RMSE (i.e., wider confidence intervals; Table 1). Other traits were better described by linear functions (Table 2), showing significant positive or negative linearity with temperature (p < 0.01) including cell volume, frustule silicification, effective quantum yield, reoxidation of QA and chlorophyll normalized productivity (Pb) (Table 2). Other traits such as cross-sectional area servicing PSII, electron transport rates and nitrate uptake showed no relationship with temperature—i.e., remained relatively constant from 11 to 35°C (p > 0.01). Some of these traits were more strongly correlated with temperature than others (i.e., higher R2) such as re-oxidation of QA (Table 2).
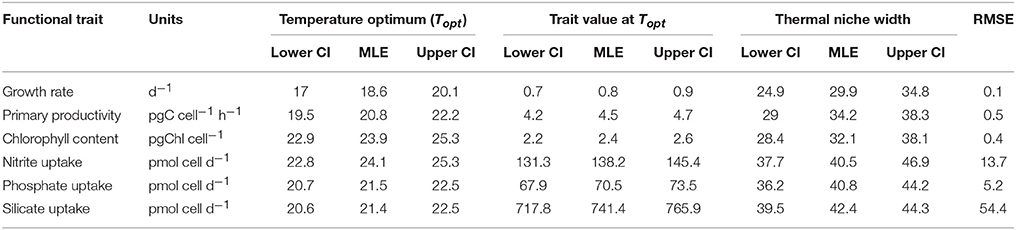
Table 1. Estimated thermal performance curve parameters and associated uncertainty calculated from parametric bootstrapping for each functional trait fitted using Equation 1; thermal optimum Topt, trait value at thermal optimum and thermal niche width.

Table 2. Estimated thermal reaction norm parameters for functional traits fitted using linear regression and associated uncertainty calculated by parametric bootstrapping, including: the proportional change in trait value per degree Celsius relative to the thermal optimum (Topt) for growth (Δ°C) and trait calue at thermal optimum.
T. pseudonana revealed considerable thermal plasticity, demonstrating relatively high fitness (growth > 0.2 d−1) over a large temperature range (Figure 2). Temperature was found to be a good predictor of growth (RMSE = 0.1) and the MLE of the thermal optimum for growth was 18.6 °C, with 95% confidence interval being 17.0–20.1°C (Topt range). The maximum growth rate attained within the Topt range (hereafter referred to Topt for simplicity) was estimated as 0.8 ± 0.07 d−1. Growth rates were lowest at 33°C (0.18 ± 0.1 d−1) and ceased at 35°C (CTmax) where loss of cells indicated mortality. Samples from 35°C were therefore excluded from further trait analyses. Unlike the CTmax, the CTmin for growth was not observed in the experimental data. As a result, we lack critical values at the lower temperature threshold to fully characterize CTmin and consequently, our estimates of both CTmin and niche widths have high uncertainty (i.e., lie between 0 and 6°C for CTmin). Note this is also the case for all remaining functional traits (Table 1).
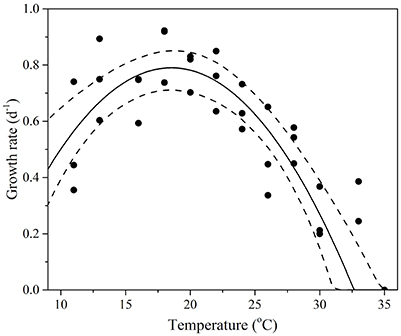
Figure 2. Thermal performance curves of fitness in the cosmopolitan model diatom Thalassiosira pseudonana depicting growth rate as a function of temperature (n = 33, RSME = 0.1). Each symbol represents a distinct biological replicate. The solid line corresponds to maximum likelihood estimate with broken lines corresponding to the 95% confidence intervals of the bell-shape function (Equation 1) estimated by parametric bootstrapping.
Temperature also affected T. pseudonana morphology, as cell volume and frustule silicification exhibited significant linear relationships (p < 0.001) with increasing temperature but with opposite signs (Figure 3). Cell volume ranged between 22 ± 0.4 μm3 at the lowest (11°C) and 26 ± 0.4 μm3 at the highest (33°C) temperatures assayed (15% rise overall), with a median cell volume of 23.9 ± 0.2 μm3 observed at the growth Topt (Figure 3A). In contrast, silicification of T. pseudonana decreased with increasing temperature, from 0.3 relative fluorescence units (RFUs) per μm3 at 11°C to 0.1 RFUs per μm3 at 33°C, equivalent to a 66% reduction in frustule thickness (Figure 3B).
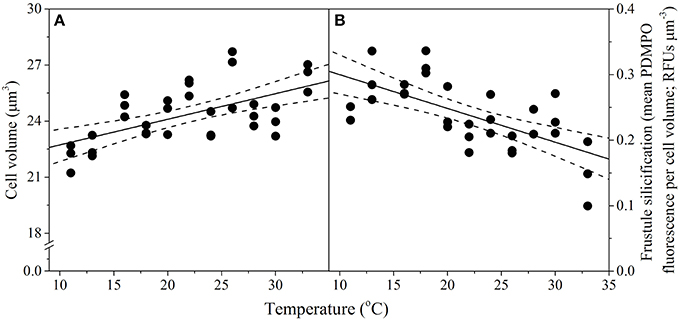
Figure 3. Thermal performance curves of morphological traits in the diatom Thalassiosira pseudonana depicting (A) cell volume (n = 33, p < 0.01, R2 = 0.34); and (B) frustule silicification (n = 31, p < 0.01, R2 = 0.41), as a function of temperature. Each symbol represents a distinct biological replicate. The solid line corresponds to maximum likelihood estimate with broken lines corresponding to the 95% confidence intervals of a linear regression both estimated by parametric bootstrapping.
Photophysiological trait analysis of T. pseudonana revealed assay temperature significantly affected a number of biophysical properties such as light harvesting and utilization. The functional absorption cross-section servicing functional PSII reaction centers (σPSII) was similar (3 nm2 PSII−1; p = 0.03) across all temperatures assayed, varying by as little as 0.5 nm2 over the ~20°C gradient. Greater variability in σPSII was observed at temperature extremes (i.e., wider confidence band; Figure 4A). While cells retained the ability to harvest light over the entire temperature range, the ability to utilize light declined at warming temperatures, demonstrated by a significant decrease (p < 0.001; R2 = 0.32) in the photochemical efficiency of PSII (effective quantum yield; ΦPSII) (Figure 4B). Despite the decline in light energy being directed toward photochemistry with increasing temperatures, electron flux through PSII was relatively similar across all temperatures assayed, as there was no significant relationship between ETRs and temperature (p = 0.23; R2 = 0.2; Figure 4C). There was however, an acceleration of downstream electron transport processes (acceptor side of PSII, donor side of PSI), accounting for the reduced operational efficiency at PSII. This was indicated by the decrease in the re-oxidation time of QA(τ) with increasing temperature (p < 0.01; R2 = 0.84), from 800 μs at 11°C to 600 μs at 33°C (Figure 4D). Rapid light curve measurements indicated that there is a trend of increasing irradiance needed to saturate photosynthesis with warming temperatures, as the saturation irradiance (Ek) increased from 100 to 500 μmol photons m−2 s−1 for samples incubated at 11 and 33°C, respectively (Figure 4E). Finally, the thermal performance curve of light harvesting efficiency (α) followed a similar trend to ETRs, showing a small decrease at intermediate temperatures. Cells at lower and higher temperatures had highest light utilization efficiency (Figure 4F).
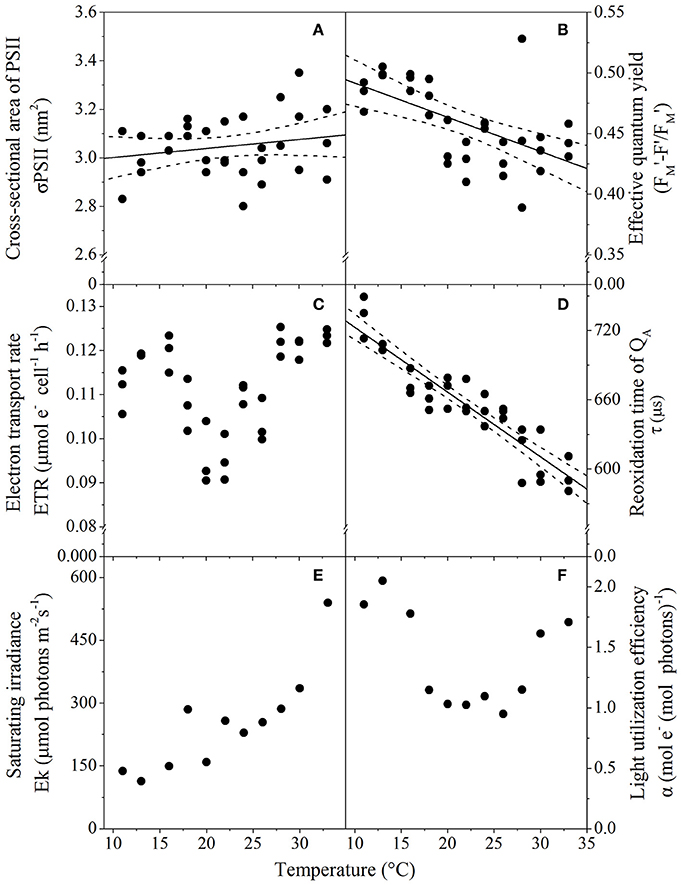
Figure 4. Thermal performance curves of T. pseudonana photophysiological traits relating to light acquisition and harvesting depicting (A) Functional cross-sectional area of PSII (n = 32, p = 0.03, R2 = 0.59); (B) Effective quantum yield (n = 33, p < 0.01, R2 = 0.32); (C) Electron transport rate (n = 33, p = 0.23, R2 = 0.01); (D) Reoxidation time of QA(n = 33, p < 0.01, R2 = 0.59); (E) Saturating irradiance (n = 12); and (F) Light harvesting efficiency (n = 12), as a function of temperature. Cells were harvested from cultures grown at 50 μmol photons m−2 s−1, with each symbol representing a distinct biological replicate. Solid line corresponds to maximum likelihood estimate with broken lines corresponding to the 95% confidence intervals of a linear regression, all estimated by parametric bootstrapping. (E,F) Data shown are parameters derived from rapid light curves with a single biological replicate, hence no MLE and confidence interval.
Temperature had a direct and predictable affect on key metrics of carbon cycling traits of primary productivity (RSME = 0.5), cellular chlorophyll content (RSME = 0.4) and chlorophyll normalized productivity rates (p < 0.001; R2 = 0.44; Figure 5). Primary productivity (PP) gradually increased from 3.4 ± 0.8 pgC cell−1 h−1 at 11°C, to a maximum rate of 4.5 ± 0.2 pgC cell−1 h−1 at Topt (between 19.5 and 22.2°C) and then decreased more sharply with warming temperatures, where PP was lowest at 33°C with values of 1.9 ± 0.1 pgC cell−1 h−1 (Figure 5A). Minimum cellular chlorophyll-a content was observed at the cold end of the temperature spectrum (0.75 ± 0.3 pgChl cell−1), rising rapidly with increasing temperature to a maximum cell quota of 2.4 ± 0.2 pgChl cell−1 between 22.9 and 25.3°C and then gradually declined to 1.5 ± 0.25 pgChl cell−1 at 33°C (Figure 5B). Chlorophyll-normalized productivity was greatest at colder temperatures, decreasing linearly with temperature from ~2.4 pgC pgChl−1 h−1 at 11°C to ~1.3 pgC pgChl−1 h−1 at 33°C (Figure 5C), at a rate of 0.37 pgC pgChl−1 h−1 per °C (Table 2).
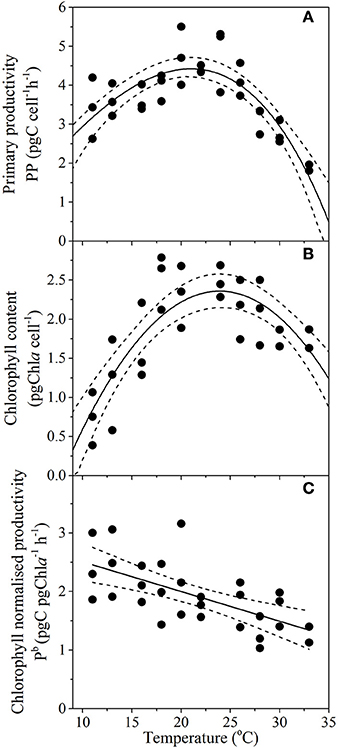
Figure 5. Thermal performance curves of physiological traits in the diatom Thalassiosira pseudonana depicting (A) primary productivity (n = 32, RSME = 0.5); (B) chlorophyll content (n = 29, RSME = 0.4); and (C) chlorophyll normalized productivity (n = 29, p < 0.01, R2 = 0.44), as a function of temperature. Each symbol represents a distinct biological replicate. Solid lines correspond to maximum likelihood estimate with broken lines corresponding to the 95% confidence intervals of the (A,B) bell-shape function (Equation 1), and (C) linear regression, all estimated by parametric bootstrapping.
Resource acquisition of dissolved N, P, and Si by T. pseudonana differed across the experimental temperature gradient (Figure 6), but responded less predictably with temperature in comparison to primary productivity and chlorophyll content (i.e., greater RSME; Table 1). Unlike the other dissolved nutrients measured in this study, uptake was not affected by temperature (p = 0.04; R2 = 0.01; Table 2). In contrast to , uptake of , P and Si exhibited bell-shaped curves as a function of temperature (Figures 6B–D). The MLE of the thermal optimum for uptake was 24.1°C, with 95% confidence interval being 22.8–25.3°C (Topt range; Table 1). Dissolved uptake increased gradually from ~80 pmol cell d−1 at 11°C to a maximum uptake rate of 138 ± 7 pmol cell d−1 at Topt and then decreased gradually with further increases in temperature to ~95 pmol cell d−1 at 33°C (Figure 6B). This Topt range significantly differed from that of P and Si, where very similar MLE of Topt were obtained for both nutrients, with maximum net uptake occurring at 21.5 and 21.4°C, respectively (Table 1). Temperatures exceeding the Topt range of P and Si, resulted in a gradual decline of P and Si uptake, to a minimum of ~50 pmol cell d−1 and ~450 pmol cell d−1, respectively at 33°C (Figures 6C,D). This decrease of Si uptake at supra-optimal temperatures may also explain the reduced frustule silicification observed with warming temperatures (Figure 3B).
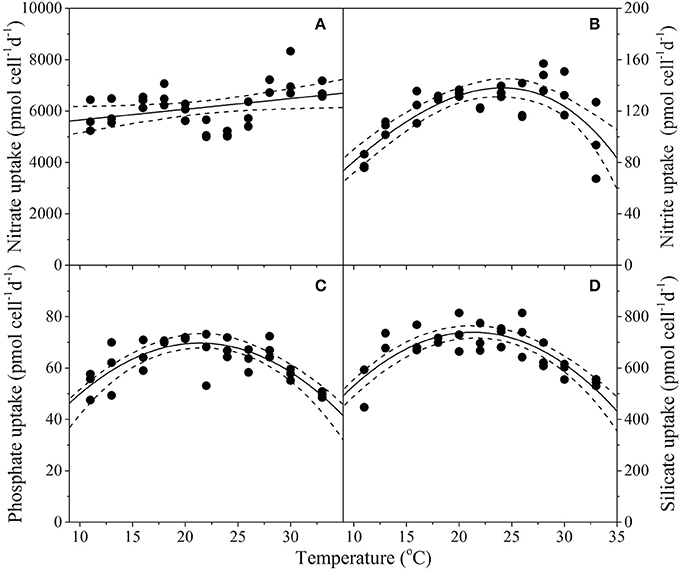
Figure 6. Thermal performance curves of physiological traits in the diatom Thalassiosira pseudonana depicting uptake of dissolved nutrients (A) nitrate (n = 33, p = 0.039, R2 = 0.10); (B) nitrite (n = 33, RSME = 13.7); (C) phosphate (n = 33, RSME = 5.2); and (D) silicate (n = 33, RSME = 54.4), as a function of temperature. Each symbol represents a distinct biological replicate. Solid lines corresponds to maximum likelihood estimate with broken lines corresponding to the 95% confidence intervals of (A) linear regression, and (B–D) the bell-shape function (Equation 1), all estimated by parametric bootstrapping.
A comparison of the thermal optima and niche widths of different traits was made with overall fitness (Figure 7). Functional traits were observed to separate into three distinct groups: similar Topt and niche width to growth (Group I), greater Topt but similar niche width to growth (Group II), and greater Topt and greater niche width than growth (Group III). Some FTs appeared to overlap between different groups (e.g., primary productivity between Group I, II, and II), whereas others were clearly distinguishable (e.g., Si uptake in Group III only). Physiological traits related to photosynthesis operated over similar niche widths but showed greater thermal optima than growth—e.g., chlorophyll content. In comparison, FTs related to resource acquisition (, P, and Si uptake) were characterized by their ability to function over wider niche widths and higher thermal optima in comparison to growth (Figure 7).
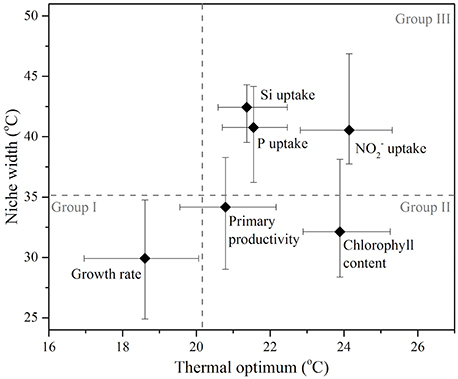
Figure 7. A comparison of the thermal optimum (temperature range over which the maximum trait value is obtained), and niche width (temperature range over which trait value is positive) of various functional traits measured in the diatom Thalassiosira pseudonana, which were parameterized by fitting the bell-shaped function (Equation 1). Symbols represent maximum likelihood estimate and error bars correspond to the 95% confidence intervals, both estimated by parametric bootstrapping corresponding to values in Table 1. Functional traits are sub-categorized into three groups (Group I, II, and II) separated by the upper 95% confidence interval for the thermal optimum and niche width for growth (broken gray lines).
FTs that exhibited a significant and relatively strong linear relationship with temperature (p < 0.05; R2 > 0.30) are summarized in Table 2, including important thermal characteristics such as: the trait value at Topt, and the proportional change in trait value per °C relative to the optimal for growth (Δ°C). Comparing Δ°C between FTs provided insight into differences in thermal sensitivities. For example, Δ°C was relatively consistent between traits, changing between 0.0064 (e.g., cell volume) and 0.0186 (e.g., Pb) relative units, equivalent to 0.6 and 1.8% per degree Celsius (Table 2). However, these traits varied in their direction of change (positive or negative; Table 2). One trait was an exception: chlorophyll normalized productivity (Pb) that changed by 0.02 Δ°C Topt (i.e., gradient more vertical) indicating increased flexibility and perhaps greater thermal sensitivity of this trait per unit increase in temperature.
Discussion
TPCs Reveal Phenotypic Plasticity
The shape and thermal optimum of TPCs are unique for each functional trait assessed in this study. These have yielded insight into the biological controls underlying the trait response and also provide a measure of thermal sensitivity. The most thermally resilient traits measured were the σPSII and ETRs, which had a flat thermal response (Figures 4A,C). Regulation of σPSII under thermal stress has also been found in heat tolerant phylotypes of the symbiotic dinoflagellate Symbiodinium (McGinley et al., 2012) suggesting that the photosynthetic apparatus of the broadly distributed diatom T. pseudonana is also thermally stable. Large temperature deviations from the growth Topt had significant implications on growth (reduced by 80%). In comparison, small changes were observed for cell volume and effective quantum yield (Δ°C; Table 2); both of these traits showed linear TPCs. Nutrient fluxes (NO2, PO4, SiO4) decreased by ~10% across the temperature gradient compared to optimal conditions, with a large proportion of the TPC being flat. The greatest magnitude of temperature-induced change was observed for traits with bell-shaped TPCs, specifically carbon fixation, which was ~50% lower at temperature extremes compared to the thermal optimum. The shape of the curves suggest that the thermal sensitivity of traits increased in the following order: flat (light harvesting; σPSII) > linear (light utilization; ΦPSII, cell morphology; volume) > concave (NO2, PO4, SiO4 flux) > bell-shaped (growth, primary productivity, chlorophyll content). This is because in a linear performance curve, a given amount of change in temperature always produces the same amount of change in the trait response. In contrast, for a trait with a bell-shaped performance curve, the specific temperature dictates the degree of response; a given amount of temperature change will induce a small change for temperature close to the Topt but a large response toward the tails. If we use the derivative of the performance curve to define trait plasticity, we observe greater thermal sensitivity in traits that express more plasticity (for further discussions see; Angilletta, 2009). On the other hand, traits must have considerable plasticity to express a flat response curve because in order to maintain performance, cells must be able to adjust their physiology at the same rate of the environmental change (Schulte et al., 2011). Whichever way it is defined, it is clear that phenotype plasticity plays a significant role in thermal acclimation.
Temperature Driven Changes in Fitness and Other Functional Traits
In keeping with our hypothesis, we observed the Topt of growth was different to the thermal optimum for each underlying functional trait, being the lowest amongst all traits measured (Figure 7). The mechanisms behind these trait responses are likely due to the thermal specificity of the underlying enzymes responsible for these processes. Furthermore, some FT TPCs do not have a definitive thermal optimum because they were constant (i.e., electron transport rate) or linear (i.e., photosynthetic efficiency of PSII, cell volume). Despite these traits not exhibiting a typical TPC shape, it does not mean that they are not thermally regulated. In the following sections we discuss the likely candidates of the biological processes that underlie the shapes and thermal optima of TPCs obtained for the morphological and physiological traits measured in this study.
The cosmopolitan model diatom, T. pseudonana, demonstrated relatively high fitness over a large thermal range (Figure 2), consistent with the global distribution of this genus (Leblanc et al., 2012). Furthermore, maximum growth rates were comparable to previously reported values for this strain; ~0.9 d−1 at 18°C and 80 μmol photons m−2 sec−1 (Li and Campbell, 2013). In contrast to other studies, we found that the thermal optimum range (17.0 and 20.1°C, centered on 18.6°C) was slightly colder than previously reported values (Thompson et al., 1992; Boyd et al., 2015) and may be due to the lower growth irradiance used in our study (Sandnes et al., 2005). In terms of morphological traits, absolute cell volumes were within range of previously reported values (Li and Campbell, 2013) and consistent with Thompson et al. (1992), with cells becoming larger with increasing temperature (Figure 3A). These changes in cell volume, although small (i.e., ~10%), may have significant implications for vertical export of carbon, as has been demonstrated in other small, spherical phytoplankton taxa (coccolithophores; Pantorno et al., 2013). However, the degree of frustule silicification (Figure 3B) must also be taken into consideration, because the density of biogenic silica exceeds that of any other polymer and has significant effects on the density of the cell as a whole (Raven and Waite, 2004). For example, colder temperatures (11°C) result in smaller, thicker diatoms (Figure 3) and may be more likely to reach the deep sea floor for burial because of their proportionally greater cell density. In contrast, warmer temperatures (33°C) result in larger but thinner diatoms (Figure 3) that may sink more rapidly because of their larger cell size (as explained above). Alternatively, thinner frustules also reduce physical defenses, making them more palatable to grazers (Raven and Waite, 2004) and as a result may reduce the likelihood of the whole cell reaching the cell floor. Therefore, interaction between these two morphological traits (i.e., cell volume and frustule silicification) along a temperature gradient will create different phenotypes with different functional and biogeochemical roles.
Furthermore, the temperature driven changes in cell volume observed in this study have significant impacts for photophysiological responses to irradiance as cells may increase light-harvesting pigment content to balance downstream processes (Finkel et al., 2010b). We see evidence of temperature-driven changes in photophysiological responses through changes in chlorophyll normalized primary productivity (Pb), light harvesting efficiency (α), and saturation irradiance (Ek). Despite the cross-sectional area of the pigment antennae funneling light to PSII remaining relatively unchanged with temperature (Figure 4A), photosynthesis-irradiance curves reveal different functional light responses by cells at cold and high temperatures. At cold temperatures (between 11 and 16°C) lower Ek and higher α values suggest the presence of a “bottle-neck” in downstream electron-transport processing from harvested photons, e.g., in the Calvin Cycle. To a phytoplankton cell, these biomolecular triggers mimic those experienced when PSII is under pressure from excess light, and signals cold-acclimated cells to down-regulate chlorophyll synthesis (Behrenfeld et al., 2016) and cell volume declines to compensate for pigment packaging effects (Raven, 1984; Kirk, 1994). As temperature rises, cells appear to require more light to saturate photosynthesis despite light conditions remaining constant. This is evidenced by the increases in saturation irradiance (Figure 4E), coupled by corresponding declines in Pb (Figure 4C) and re-oxidation time of QA (Figure 4D) and because Ek = 1/σ * τ (Sakshaug et al., 1997). Together these results suggest that with increasing temperature, photosynthesis becomes rate-limited by the light reactions. As a result, cells attempt to increase light-harvesting capacity by synthesizing nitrogen-rich chlorophyll (Figure 5B). However, cells become increasingly larger and pigment-packaging effects seem to counteract any benefits associated with increased pigmentation and absolute rates of primary productivity decline (Figure 5C). As the efficiency of the Calvin Cycle decreases, alternative electron sinks e.g., cyclic electron transport around PSII, Mehler reaction, terminal oxidase activity, nitrate reduction also become progressively more important with increasing temperature (Hancke et al., 2008; Kulk et al., 2012).
Resource acquisition of , P, and Si appeared to conform to a TPC shape but was less predictable than growth (Figure 6). Additionally, the curvature of these TPCs appeared less pronounced in comparison to the TPCs of growth and primary productivity and as a result exhibited a wider thermal niche. As has been demonstrated previously, temperatures below the growth optimum appeared to lower the affinity for all inorganic substrates and is believed to be due to more inflexible membranes leading to decreased efficiency of embedded transporter proteins (Nedwell, 1999). Comparatively, at higher temperatures, membranes become more fluid and may become more susceptible to attack by reactive oxygen species and as a result, membrane transporter proteins become targeted by oxidative protein damage (Lesser, 2006). The TPCs of nitrite, phosphate, and silicate suggest a high degree of thermal stability in these physiological processes as the net uptake rates at the hot (33°C) and cold (11°C) end of the gradient were only reduced by ~10% in comparison to the thermal optimum. This might mean that elemental fluxes may be relatively resilient to temperature variation at least in comparison to other processes such as growth and carbon fixation. In stark contrast, uptake remained relatively unaffected by temperature (weakly significant; p = 0.04). However, this does not necessarily mean that temperature does not mediate nitrate utilization. For example, the assimilation of involves a number of mechanisms: reductase, reductase, associated active transport systems, cellular ATP and NADPH (Mulholland and Lomas, 2008). In T. pseudonana, these linked cellular processes may not necessarily result in an overall TPC, even though each underlying step may be affected by temperature (Schulte et al., 2011). Furthermore, it is known that can be released shortly after it is assimilated, on timescales as short as hours (Mulholland and Lomas, 2008). As such, it is possible that measuring the drawdown of dissolved from the culture medium, is not a sensitive enough method to detect temperature affects on nitrate acquisition, due to the timescale over which the nutrient can be exported from the cell.
Phenotype-Dependent Functional Roles
Defining the relationship between the TPCs of various FTs provides insight into how functional roles of different phytoplankton types can be altered under current and future ocean temperature change. The oceanic province from which this strain originates (North Atlantic Ocean) experiences substantial fluctuations in temperature. On an annual timescale, sea surface temperatures (SST) reach a maximum of ~25°C and minimum of ~10°C in boreal summer and winter, respectively (Reynolds and Smith, 1995; NOAA, 2015). Overlaying this annual temperature window (solid lines; Figure 8) on the TPCs of the various FTs obtained in this study, provided insight into the degree of phenotypic plasticity experienced by an individual diatom on a yearly timescale. These natural temperature fluctuations help to explain why this strain of T. pseudonana has wide thermal niches (i.e., >30°C) for a number of FTs including: resource acquisition, growth and primary productivity. This is because without phenotypic plasticity, this diatom would be unlikely to proliferate over such a wide temperature range. Under future ocean change, modeling suggests departures of up to +2°C from present SST are expected by 2100 for the North Atlantic Ocean province (Boyd et al., 2015). In these new conditions, the annual temperature window becomes warm-shifted (broken lines; Figure 8) and a further uncoupling between cell volume and frustule silicification occurs, along with a sharp decrease in primary productivity and overall fitness.
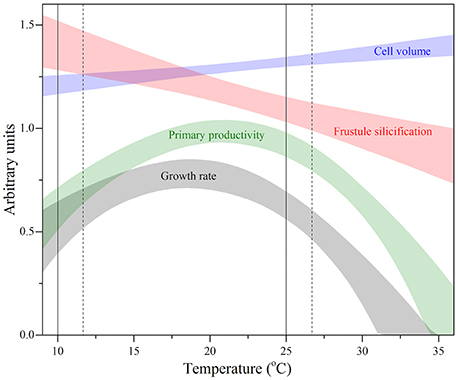
Figure 8. Thermal performance curves of fitness (gray band) and other functional traits including primary productivity (green band), cell volume (blue band), and frustule silicification (red band) in the marine diatom Thalassiosira pseudonana (CCMP 1335) originally isolated from the North Atlantic Ocean. Each confidence band represents the maximum likelihood estimate with 95% confidence intervals, both estimated by parametric bootstrapping for each functional trait. Solid vertical lines correspond to the thermal window currently experienced in the North Atlantic Ocean ranging from the minimum boreal winter temperature (~10°C) and maximum boreal summer temperature (~25°C), both estimated from monthly sea surface temperatures for December 2014 and July 2015 obtained from NOAA. Broken line depicts predicted estimates of future sea surface temperature warming of the North Atlantic Ocean (Boyd et al., 2015).
The interaction between the two morphological traits measured along the temperature gradient, i.e., cell volume and frustule silicification, results in different diatom phenotypes (Figure 8) with potentially distinct functional roles. For example, at cold temperatures, where diatom frustules are thicker, the increased cellular density, and resistance to grazers (Raven and Waite, 2004) may increase vertical export of C. In contrast, larger but thinner cells, that are more palatable to grazers (Raven and Waite, 2004) may increase the elemental residence times of C and Si in the euphotic zone through assimilation into grazer biomass (Hutchins et al., 1995). This may result in two alternative pathways: either the subsequent transfer of C and Si to higher trophic levels, or, its incorporation into fecal pellets, resulting in more rapid transfer to the ocean's interior (Hutchins et al., 1995; Honjo et al., 2008). Together these results demonstrate that temperature can directly affect the biogeochemical fate of C and Si, through alterations in diatom morphology.
Implications and Future Research Directions
Quantitatively, the most important phytoplankton belong to the centric diatoms, including genera such as Chaetoceros and Thalassiosira because together, they contribute almost a third of total biomass of marine diatoms, globally (Leblanc et al., 2012). Due to their high species diversity, phytoplankton blooms dominated by Thalassiosira sp. can occur worldwide, including in such locations as Antarctica, upwelling regions off the African coastline, and recurrent blooms in temperate and boreal regions (Sorokin, 1999; Leblanc et al., 2012; Schmidt and Schaechter, 2012). As evidenced by sediment traps, these episodic, seasonal blooms that often coincide with high nutrient concentrations, typically result in high vertical export (Sarthou et al., 2005; Honjo et al., 2008). If the TPCs of FTs in T. pseudonana (this study) are representative of the thermal response of the genus or centric diatoms as a whole, we anticipate that temperature driven distributions of diatom phenotypes may differentially regulate the biogeochemical fate of C and Si, and subsequently, the marine food web and biological carbon pump.
Our findings exemplify the need to better quantify the performance curves of specific functional traits so that we can make comparisons between their plasticity. This will help us understand the capacity of specific taxa to physiologically adjust to changing oceans and examine the implications of these responses in current and future scenarios. Secondly, whilst diatoms play a significant role in marine biogeochemical functioning, they are not the only contributors to global elemental cycles. We suggest that similar studies should be conducted for model species of other functional types of phytoplankton in order to advance the understanding of the diversity of taxon-specific responses to temperature change and what implications this has on the biogeochemical fluxes that they regulate. Thirdly, current and future global change is multifaceted and includes not only warming but also changes in CO2 concentrations, nutrient, and light availability, as well as the interactions between these environmental variables. Taxon- and trait-specific performance curves are not restricted to temperature and can therefore be extended to all of the stressors mentioned above. Equally, it is not only the mean trajectory of these stressors that is changing but also increased variability. Multi-trait analyses over more resolved environmental gradients provides a useful framework to advance understanding of how taxon-specific functional traits will respond to complex ocean change and how these are likely to be differentially distributed. Finally, we have seen evidence that the distribution of phenotypes has changed over evolutionary timescales (Finkel et al., 2010a), suggesting that to predict the future functioning of the biological carbon pump and other biogeochemical processes we must consider adaptive constraints or trade-offs between these functional traits (Litchman et al., 2015). To explore this, evolutionary experiments (Huertas et al., 2011) could be combined with studies such as ours by incorporating longer timescales on the axis of exposure.
Author Contributions
KB conceived and designed the experiment. KB, CR, DR, AM, and MD acquired the data and all authors analyzed and interpreted the data. KB drafted the work and all authors critically revised the work for intellectual content. All authors approved the final version to be published and agreed to be accountable for all aspects of the work.
Funding
This research was funded by a student scholarship awarded through the School of Life Sciences and Plant Functional Biology and Climate Change Cluster- (C3), University of Technology Sydney to KB and an Australian Research Council Discovery Grant Scheme (DP14010134) to MD.
Conflict of Interest Statement
The authors declare that the research was conducted in the absence of any commercial or financial relationships that could be construed as a potential conflict of interest.
Acknowledgments
The authors would like to thank Associate Professor David Suggett, Professor Douglas Campbell and Dr. Katherina Petrou for their insightful discussions and Professor Maria Byrne for access to the thermal gradient blocks. The authors would also like to thank two anonymous reviewers for their invaluable improvements to this manuscript.
Supplementary Material
The Supplementary Material for this article can be found online at: http://journal.frontiersin.org/article/10.3389/fmars.2016.00044
References
Angilletta, M. J. (2009). Thermal Adaptation: A Theoretical and Empirical Synthesis. Oxford: Oxford University Press.
Atkinson, D., Ciotti, B. J., and Montagnes, D. J. (2003). Protists decrease in size linearly with temperature: ca. 2.5% C− 1. Proc. R. Soc. Lond. B Biol. Sci. 270, 2605–2611. doi: 10.1098/rspb.2003.2538
Behrenfeld, M. J., O'Malley, R. T. O., Boss, E. S., Westberry, T. K., Graff, J. R., Halsey, K. H., et al. (2016). Revaluating ocean warming impacts on global phytoplankton. Nat. Clim. Change 6, 323–330. doi: 10.1038/nclimate2838
Boyd, P. W., Lennartz, S. T., Glover, D. M., and Doney, S. C. (2015). Biological ramifications of climate-change-mediated oceanic multi-stressors. Nat. Clim. Change 5, 71–79. doi: 10.1038/nclimate2441
Boyd, P. W., Rynearson, T. A., Armstrong, E. A., Fu, F., Hayashi, K., Hu, Z., et al. (2013). Marine phytoplankton temperature versus growth responses from polar to tropical waters – outcome of a scientific community-wide study. PLoS ONE 8:e63091. doi: 10.1371/journal.pone.0063091
Boyd, P. W., Strzepek, R., Fu, F., and Hutchins, D. A. (2010). Environmental control of open-ocean phytoplankton groups: now and in the future. Limnol. Oceanogr. 55, 1353–1376. doi: 10.4319/lo.2010.55.3.1353
Chevin, L. M., Collins, S., and Lefèvre, F. (2013). Phenotypic plasticity and evolutionary demographic responses to climate change: taking theory out to the field. Funct. Ecol. 27, 967–979. doi: 10.1111/j.1365-2435.2012.02043.x
Cullen, J. J., Geider, R. J., Ishizaka, J., Kiefer, D. A., Marra, J., Sakshaug, E., et al. (1993). “Towards a general description of phytoplankton growth for biogeochemical models,” in Towards a Model of Ocean Biogeochemical Processes, eds G. T. Evans and M. J. R. Fasham (Berlin: Springer), 153–176.
Davison, I. R. (1991). Environmental effects on algal photosynthesis: temperature. J. Phycol. 27, 2–8. doi: 10.1111/j.0022-3646.1991.00002.x
Doblin, M. A., Petrou, K. L., Shelly, K., Westwood, K., Van Den Enden, R., Wright, S., et al. (2011). Diel variation of chlorophyll-a fluorescence, phytoplankton pigments and productivity in the Sub-Antarctic and Polar Front Zones south of Tasmania. Aust. Deep Sea Res. II Top. Stud. Oceanogr. 58, 2189–2199. doi: 10.1016/j.dsr2.2011.05.021
Falkowski, P. G., Barber, R. T., and Smetacek, V. (1998). Biogeochemical controls and feedbacks on ocean primary production. Science 281, 200–206. doi: 10.1126/science.281.5374.200
Finkel, Z. V., Beardall, J., Flynn, K. J., Quigg, A., Rees, T. A. V., and Raven, J. A. (2010b). Phytoplankton in a changing world: cell size and elemental stoichiometry. J. Plankton Res. 32, 119–137. doi: 10.1093/plankt/fbp098
Finkel, Z. V., Matheson, K., Regan, K., and Irwin, A. (2010a). Genotypic and phenotypic variation in diatom silicification under paleo-oceanographic conditions. Geobiology 8, 433–445. doi: 10.1111/j.1472-4669.2010.00250.x
Guillard, R. R., and Ryther, J. H. (1962). Studies of marine planktonic diatoms. I. Cyclothella nana Hustedt and Detonula confervacea Gran. Can. J. Microbiol. 8, 229–239. doi: 10.1139/m62-029
Hancke, K., Hancke, T. B., Olsen, L. M., Johnsen, G., and Glud, R. N. (2008). Temperature effects on microalgal photosynthesis-light responses measured by O2 production, pulse-amplitude-modulated fluorescence, and 14C-assimilation. J. Phycology 44, 501–514. doi: 10.1111/j.1529-8817.2008.00487.x
Hoenig, M., Lee, R. J., and Ferguson, D. C. (1989). A microtiter plate assay for inorganic phosphate. J. Biochem. Biophys. Methods 19, 249–251. doi: 10.1016/0165-022X(89)90031-6
Honjo, S., Manganini, S. J., Krishfield, R. A., and Francois, R. (2008). Particulate organic carbon fluxes to the ocean interior and factors controlling the biological pump: a synthesis of global sediment trap programs since 1983. Prog. Oceanogr. 76, 217–285. doi: 10.1016/j.pocean.2007.11.003
Huertas, I. E., Rouco, M., López-Rodas, V., and Costas, E. (2011). Warming will affect phytoplankton differently: evidence through a mechanistic approach. Proc. R. Soc. B Biol. Sci. 278, 3534–3543. doi: 10.1098/rspb.2011.0160
Huey, R. B., and Stevenson, R. (1979). Integrating thermal physiology and ecology of ectotherms: a discussion of approaches. Am. Zool. 19, 357–366. doi: 10.1093/icb/19.1.357
Hutchins, D. A., Wang, W. X., and Fisher, N. S. (1995). Copepod grazing and the biogeochemical fate of diatom iron. Limnol. Oceanogr. 40, 989–994. doi: 10.4319/lo.1995.40.5.0989
Jeffrey, S. W., Mantoura, R. F. C., and Bjørnland, T. (1997). Data for the Identification of 47 Key Phytoplankton Pigments. Phytoplankton Pigments in Oceanography: Guidelines to Modern Methods. Paris: UNESCO.
Kirk, J. T. O. (1994). Light and Photosynthesis in Aquatic Ecosystems. Cambridge: Cambridge University Press.
Kulk, G., de Vries, P., van de Poll, W. H., Visser, R. J. W., and Buma, A. G. J. (2012). Temperature-dependent growth and photophysiology of prokaryotic and eukaryotic oceanic picophytoplankton. Mar. Ecol. Prog. Ser. 466, 43–55. doi: 10.3354/meps09898
Leblanc, K., Arístegui, J., Armand, L., Assmy, P., Beker, B., Bode, A., et al. (2012). A global diatom database – abundance, biovolume and biomass in the world ocean. Earth Syst. Sci. Data 4, 149–165. doi: 10.5194/essd-4-149-2012
Leblanc, K., and Hutchins, D. A. (2005). New applications of a biogenic silica deposition fluorophore in the study of oceanic diatoms. Limnol. Oceanogr. 3, 462–476. doi: 10.4319/lom.2005.3.462
Lesser, M. P. (2006). Oxidative stress in marine environments: biochemistry and physiological ecology. Annu. Rev. Physiol. 68, 253–278. doi: 10.1146/annurev.physiol.68.040104.110001
Li, G., and Campbell, D. A. (2013). Rising CO2 interacts with growth light and growth rate to alter photosystem II photoinactivation of the coastal diatom Thalassiosira pseudonana. PLoS ONE 8:e55562. doi: 10.1371/journal.pone.0055562
Litchman, E., and Klausmeier, C. A. (2008). Trait-based community ecology of phytoplankton. Annu. Rev. Ecol. Evol. Syst. 39, 615–639. doi: 10.1146/annurev.ecolsys.39.110707.173549
Litchman, E., Klausmeier, C. A., Schofield, O. M., and Falkowski, P. G. (2007). The role of functional traits and trade-offs in structuring phytoplankton communities: scaling from cellular to ecosystem level. Ecol. Lett. 10, 1170–1181. doi: 10.1111/j.1461-0248.2007.01117.x
Litchman, E., Tezanos Pinto, P., Edwards, K. F., Klausmeier, C. A., Kremer, C. T., and Thomas, M. K. (2015). Global biogeochemical impacts of phytoplankton: a trait-based perspective. J. Ecol. 103, 1384–1396. doi: 10.1111/1365-2745.12438
Lohbeck, K. T., Riebesell, U., and Reusch, T. B. (2012). Adaptive evolution of a key phytoplankton species to ocean acidification. Nat. Geosci. 5, 346–351. doi: 10.1038/ngeo1441
McGinley, M. P., Aschaffenburg, M. D., Pettay, D. T., Smith, R. T., Lajeunesse, T. C., and Warner, M. E. (2012). Transcriptional response of two core photosystem genes in Symbiodinium spp. exposed to thermal stress. PLoS ONE 7:e50439. doi: 10.1371/journal.pone.0050439
Mulholland, M. R., and Lomas, M. W. (2008). “Nitrogen uptake and assimilation,” in Nitrogen in the Marine Environment, 2nd Edn., ed D. G. Capone (New York, NY: Elsevier), 303–384.
Nedwell, D. B. (1999). Effect of low temperature on microbial growth: lowered affinity for substrates limits growth at low temperature. FEMS Microbiol. Ecol. 30, 101–111. doi: 10.1111/j.1574-6941.1999.tb00639.x
Nelson, D. M., Treguer, P., Brzezinski, M. A., Leynaert, A., and Queguiner, B. (1995). Production and dissolution of biogenic silica in the ocean - revised global estimates, comparison with regional data and relationship to biogenic sedimentation. Global Biogeochem. Cycles 9, 359–372. doi: 10.1029/95GB01070
NOAA (2015). NOAA Optimum Interpolation Sea Surface Temperature Analysis. National Oceanic Atmospheric Administration. Available online at: http://www.emc.ncep.noaa.gov/research/cmb/sst_analysis/images/archive/monthly_sst/ (Accessed November 20, 2015).
Oxborough, K., Moore, C. M., Suggett, D. J., Lawson, T., Chan, H. G., and Geider, R. J. (2012). Direct estimation of functional PSII reaction center concentration and PSII electron flux on a volume basis: a new approach to the analysis of Fast Repetition Rate fluorometry (FRRf) data. Limnol. Oceanogr. 10, 142–154. doi: 10.4319/lom.2012.10.142
Pantorno, A., Holland, D. P., Stojkovic, S., and Beardall, J. (2013). Impacts of nitrogen limitation on the sinking rate of the coccolithophorid Emiliania huxleyi (Prymnesiophyceae). Phycologia 52, 288–294. doi: 10.2216/12-064.1
Peperzak, L., and Brussaard, C. P. (2011). Flow cytometry applicability of fluorescent vitality probes on phytolankton. J. Phycol. 47, 692–702. doi: 10.1111/j.1529-8817.2011.00991.x
Raven, J., and Waite, A. (2004). The evolution of silicification in diatoms: inescapable sinking and sinking as escape? New Phytol. 162, 45–61. doi: 10.1111/j.1469-8137.2004.01022.x
Raven, J. A. (1984). A cost-benefit analysis of photon absorption by photosynthetic unicells. New Phytol. 98, 593–625. doi: 10.1111/j.1469-8137.1984.tb04152.x
Reynolds, R. W., and Smith, T. M. (1995). A high-resolution global sea surface temperature climatology. J. Clim. 8, 1571–1583.
Robinson, C., Suggett, D. J., Cherukuru, N., Ralph, P. J., and Doblin, M. A. (2014). Performance of Fast Repetition Rate fluorometry based estimates of primary productivity in coastal waters. J. Mar. Syst. 139, 299–310. doi: 10.1016/j.jmarsys.2014.07.016
Sakshaug, E., Bricaud, A., Dandonneau, Y., Falkowski, P. G., Kiefer, D. A., Legendre, L., et al. (1997). Parameters of photosynthesis: definitions, theory and interpretation of results. J. Plankton Res. 19, 1637–1670. doi: 10.1093/plankt/19.11.1637
Sandnes, J. M., Källqvist, T., Wenner, D., and Gislerød, H. R. (2005). Combined influence of light and temperature on growth rates of Nannochloropsis oceanica: linking cellular responses to large-scale biomass production. J. Appl. Phycol. 17, 515–525. doi: 10.1007/s10811-005-9002-x
Sarthou, G., Timmermans, K. R., Blain, S., and Tréguer, P. (2005). Growth physiology and fate of diatoms in the ocean: a review. J. Sea Res. 53, 25–42. doi: 10.1016/j.seares.2004.01.007
Schmidt, T. M., and Schaechter, M. (2012). Topics in Ecological and Environmental Microbiology. San Diego, CA: Academic Press.
Schnetger, B., and Lehners, C. (2014). Determination of nitrate plus nitrite in small volume marine water samples using vanadium (III) chloride as a reduction agent. Mar. Chem. 160, 91–98. doi: 10.1016/j.marchem.2014.01.010
Schuback, N., Flecken, M., Maldonado, M. T., and Tortell, P. D. (2016). Diurnal variation in the coupling of photosynthetic electron transport and carbon fixation in iron-limited phytoplankton in the NE subarctic Pacific. Biogeosciences 13, 1019–1035. doi: 10.5194/bg-13-1019-2016
Schulte, P. M., Healy, T. M., and Fangue, N. A. (2011). Thermal performance curves, phenotypic plasticity, and the time scales of temperature exposure. Integr. Comp. Biol. 51, 691–702. doi: 10.1093/icb/icr097
Shoaf, W. T., and Lium, B. W. (1976). Improved extraction of chlorophyll a and b from algae using dimethyl sulfoxide. Limnol. Oceanogr. 21, 926–928. doi: 10.4319/lo.1976.21.6.0926
Sorokin, Y. I. (1999). Data on primary production in the Bering Sea and adjacent Northern Pacific. J. Plankton Res. 21, 615–636. doi: 10.1093/plankt/21.4.615
Strickland, J. D. H., and Parsons, T. R. (1968). A Practical Handbook of Seawater Analysis. Ottawa, ON: Fisheries Research Board of Canada.
Thomas, M. K., Kremer, C. T., Klausmeier, C. A., and Litchman, E. (2012). A global pattern of thermal adaptation in marine phytoplankton. Science 338, 1085–1088. doi: 10.1126/science.1224836
Thompson, P. A., Guo, M. X., and Harrison, P. J. (1992). Effects of variation in temperature. I. On the biochemical composition of eight species of marine phytoplankton. J. Phycology 28, 481–488. doi: 10.1111/j.0022-3646.1992.00481.x
Keywords: temperature, warming, thermal performance curves, phytoplankton, biogeochemistry, functional traits, plasticity, photoacclimation
Citation: Baker KG, Robinson CM, Radford DT, McInnes AS, Evenhuis C and Doblin MA (2016) Thermal Performance Curves of Functional Traits Aid Understanding of Thermally Induced Changes in Diatom-Mediated Biogeochemical Fluxes. Front. Mar. Sci. 3:44. doi: 10.3389/fmars.2016.00044
Received: 27 November 2015; Accepted: 21 March 2016;
Published: 05 April 2016.
Edited by:
Michael William Lomas, Bigelow Laboratory for Ocean Sciences, USAReviewed by:
Jason Michel Smith, Monterey Bay Aquarium Research Institute, USAGotzon Basterretxea, Consejo Superior de Investigaciones Cientificas, Spain
Copyright © 2016 Baker, Robinson, Radford, McInnes, Evenhuis and Doblin. This is an open-access article distributed under the terms of the Creative Commons Attribution License (CC BY). The use, distribution or reproduction in other forums is permitted, provided the original author(s) or licensor are credited and that the original publication in this journal is cited, in accordance with accepted academic practice. No use, distribution or reproduction is permitted which does not comply with these terms.
*Correspondence: Kirralee G. Baker, a2lycmFsZWUuZy5iYWtlckBzdHVkZW50LnV0cy5lZHUuYXU=