 Sarah W. Davies
 Adrian Marchetti
 Justin B. Ries
 Karl D. Castillo
- 1Department of Marine Sciences, University of North Carolina at Chapel Hill, Chapel Hill, NC, USA
- 2Department of Marine and Environmental Sciences, Northeastern University, Nahant, MA, USA
The oceans are becoming warmer and more acidic as a result of rising atmospheric pCO2. Transcriptome plasticity may facilitate marine organisms' acclimation to thermal and acidification stress by tailoring gene expression to mitigate the impacts of these stressors. Here, we produce the first transcriptome of the abundant, ubiquitous, and resilient Caribbean reef-building coral Siderastrea siderea, and investigate this corals' transcriptomic response to 95 days of thermal (T = 25, 28, 32°C) and CO2-induced acidification (324, 477, 604, 2553 μatm) stress. The S. siderea transcriptome was assembled using RNAseq and then Weighted Gene Correlation Network Analysis was employed to obtain systems-level insights into the coral's stress response. Exposure of the coral to both elevated temperature and acidification elicited strong but divergent transcriptomic responses. Gene Ontology analysis suggests that long-term thermal stress disrupts homeostasis by increasing transcription of protein-coding genes associated with protein catabolism and suppressing transcription of genes involved in responding to environmental stimuli. Both next century (604 μatm) and extreme-high (2553 μatm) pCO2 stress increased transcription of genes associated with respiration, highlighting the potentially greater energetic requirements of maintaining calcification under high-pCO2 conditions. Under extreme-high-pCO2, increased transcription of H+-transporter genes was observed, consistent with the proposed role of proton transport in facilitating coral calcification under elevated pCO2. These results suggest that 95 days of exposure to 32°C seawater elicits a more adverse transcriptomic response (i.e., broad scale reductions in gene expression) than exposure to extreme-high acidification (2553 μatm; i.e., increased expression of genes associated with ion transport) within S. siderea—with the response to extreme warming suggesting cellular shutdown and the response to extreme acidification indicating capacity for acclimation. These results are consistent with the observation that rates of net calcification for the investigated corals were more negatively affected by the prescribed thermal stress than by the prescribed acidification stress. This study demonstrates how transcriptome plasticity may promote coral acclimation to these global change stressors, but that there are limits to the efficacy of this plasticity.
Introduction
The partial pressure of atmospheric carbon dioxide (pCO2) has increased from 280 μatm to levels exceeding 400 μatm since the Industrial Revolution in the mid-eighteenth century (Doney et al., 2009). Over the last 100 years, increasing atmospheric pCO2 has elevated mean sea surface temperatures (SST) by 0.7°C and reduced mean seawater pH by 0.1 (Bindoff et al., 2007). It is predicted that atmospheric pCO2 will surpass 700 μatm by the end of the twenty-first century, resulting in additional CO2-induced warming and ocean acidification (Doney et al., 2012). Along with other marine organisms, reef-building corals have already experienced the negative effects of these CO2-induced stressors, with annual episodes of “coral bleaching” (i.e., breakdown of the coral–algae symbiosis) predicted to affect all reefs by the year 2040 (van Hooidonk et al., 2013) and increased SST and pCO2 projected to impair coral calcification and reef accretion (Hoegh-Guldberg et al., 2007).
The phenotypic responses of marine calcifiers to both increased temperature and acidification have been well characterized and responses vary widely across species (Ries et al., 2009; Pandolfi, 2015) and populations (Dixon et al., 2015). Reef-construction by scleractinian corals provides numerous ecological services and is integral to maintaining health of the entire reef ecosystem (Moberg and Folke, 1999). Therefore, even small reductions in coral calcification rates have the potential to disrupt the balance of accretion and erosion on reefs, which can negatively affect their ecological function (Chan and Connolly, 2013). Numerous studies have documented reductions in coral calcification in response to both low and high temperature (Cooper et al., 2008; De'Ath et al., 2009; Kenkel et al., 2013a; Castillo et al., 2014) and pCO2 (Langdon and Atkinson, 2005; Doney et al., 2009; Kleypas and Yates, 2009; Chan and Connolly, 2013; Castillo et al., 2014). However, over the range of pCO2 and temperatures predicted for the next several centuries, increased temperatures have been shown to cause a greater decline in coral calcification rate than increased pCO2 (Chua et al., 2013; Castillo et al., 2014).
The transcriptomic response of corals to short-term (hours-days) temperature stress consistently includes regulation of heat-shock proteins, apoptosis pathways, and genes associated with ion transport and metabolism (Meyer et al., 2011; Barshis et al., 2013; Dixon et al., 2015), with longer-term thermal stress causing broad-scale downregulation of basic metabolic processes (Vidal-Dupiol et al., 2014). The coral transcriptomic response to CO2-induced acidification has received far less attention, with existing studies focused on relatively short-term exposures of 3 days (Moya et al., 2012), 9 days (Moya et al., 2015), 3 weeks (Vidal-Dupiol et al., 2013), and 28 days (Kaniewska et al., 2012), and with somewhat conflicting outcomes. Moya et al. (2012) observed metabolic suppression and enhancement of extracellular skeletal organic matrix in Acropora millepora recruits exposed to elevated pCO2 (750 and 1000 μatm) for 3 days. However, this response was not maintained in 9-day experiments on conspecifics where, in contrast to the 3-day study, anti-apoptotic genes were upregulated (Moya et al., 2015). In a 28-day pCO2 stress experiment on adult A. millepora (Kaniewska et al., 2012), the transcriptomic response was consistent with the metabolic impairment observed in the Moya et al. (2012) study. A 21-day experiment on adult Pocillopora damicornis revealed increased expression of genes encoding for ion-transport and energy-production proteins, suggesting increased metabolic demands under elevated pCO2 (Vidal-Dupiol et al., 2013). These contrasting responses to pCO2 may reflect taxonomic differences, differences in the time scale of the investigation, and/or differences in nutritional status and/or environmental histories of the investigated specimens. Indeed the majority of studies have focused on the emerging coral model A. millepora (Kaniewska et al., 2012; Moya et al., 2012, 2015), which is highly genetically divergent from corals in other lineages (Kitahara et al., 2010), making it difficult to extrapolate results to other species of reef-building corals.
Despite the inconsistencies observed in corals' transcriptomic responses to pCO2 stress, the general repertoire of responses appears to contrast that of the responses of corals to elevated temperature. However, in order to directly investigate how these transcriptomic responses differ across stressors, a comparative study explicitly testing these stress responses in parallel is required. Although corals may experience these stressors in tandem, it is essential to conduct experiments that isolate the effects of these stressors on the same time scale in order to identify the mechanisms by which they may impact coral calcification in the future.
Castillo et al. (2014) recently demonstrated that S. siderea exhibits parabolic calcification responses to both warming and acidification, whereby moderately elevated temperature and pCO2 enhanced calcification and extremely elevated temperature and pCO2 impaired calcification (Figure 1). Despite the consistent parabolic shape of the corals' calcification responses to both stressors, the prescribed warming (32 vs. 28°C) was shown to have a much more adverse impact on net calcification rates (80% decrease relative to control treatment) than the prescribed increase in pCO2 (2553 vs. 477 μatm—resulting in only 25% decrease in net calcification relative to control). In the present study, transcriptomic profiles of the same coral specimens from the Castillo et al. (2014) study were generated using RNAseq. Gene expression patterns were explored across three temperature and four pCO2 treatments to investigate the molecular underpinnings of this coral's differential calcification responses to ocean acidification (i.e., milder response) and warming (i.e., stronger response; Table 1).
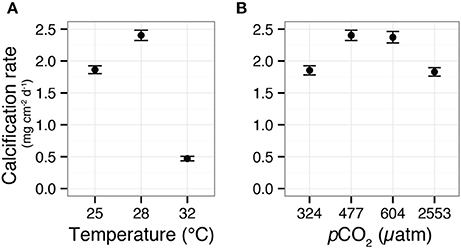
Figure 1. Calcification responses of the coral Siderastrea siderea to elevated pCO2 and temperature across a 95-day experiment. Mean (±SE) coral calcification rates in temperatures of 25, 28, and 32°C (A). Mean (±SE) coral calcification rates at pCO2 of 324, 477, 604, and 2553 μatm (B). Figure modified from Castillo et al. (2014).
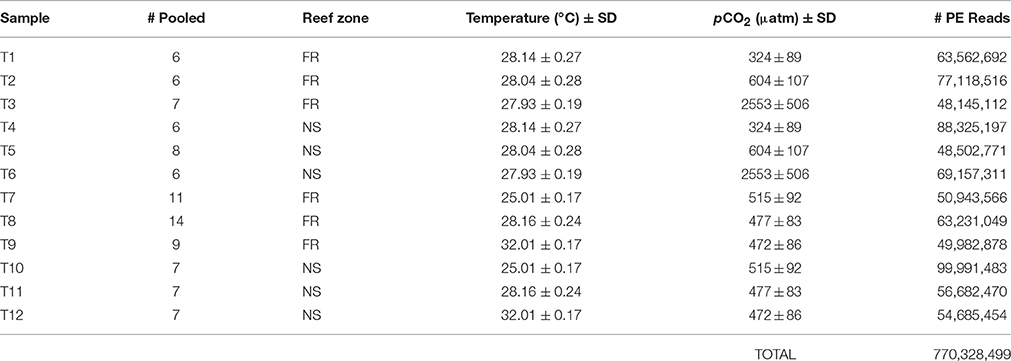
Table 1. Summary of RNA libraries including the number of individual nubbins from which RNA was pooled, reef zone where corals were collected (forereef = “FR” and nearshore = “NS”), temperature (°C) ±SD, pCO2 (μatm) ±SD, and total number of raw 100 bp paired-end (“PE”) reads sequenced with Illumina Hiseq 2000.
Temperature treatments include the coral's in situ monthly minimum (25°C), mean (control: 28°C), and maximum temperature (32°C), all maintained at approximately the same pCO2 (ca. 488 μatm). The pCO2 treatments include pre-industrial (324 μatm), near present-day (control: 477 μatm), next-century (604 μatm), and extreme-high pCO2 (2553 μatm), all maintained at approximately the same temperature (28°C). The reef-building coral Siderastrea siderea is an ideal candidate for investigating the transcriptomic response of corals to global change stressors because it is abundant and ubiquitously distributed throughout the Caribbean basin (Veron, 2000), inhabits a wide spectrum of habitats spanning broad pH and temperature ranges (Lirman and Fong, 2007), is a robust species shown to be highly tolerant of chronic stress (Colella et al., 2012; Castillo et al., 2014) and, despite its ecological importance, remains relatively unexplored from a genomic perspective.
The reference transcriptome for S. siderea was assembled from RNAseq data. A Weighted Gene Coexpression Network Analysis (WGCNA; an established method for investigating pathway-level transcriptomic responses; Dixon et al., 2015; Rose et al., 2016) was employed to acquire systems-level insights into the corals' transcriptomic responses to the treatment conditions. This study was designed to isolate and compare the transcriptomic responses of S. siderea to thermal and pCO2 stress and assess potential linkages between the resulting gene expression profiles and the differential calcification responses previously observed in response to these two stressors.
Materials and Methods
Experimental Design
Detailed descriptions of the experimental design are available in Castillo et al. (2014) and the specific parameters of the experimental treatments (temperature, salinity, pH, total alkalinity, dissolved inorganic carbon, pCO2 of the mixed gases in equilibrium with the experimental seawaters, carbonate ion concentration, bicarbonate ion concentration, dissolved carbon dioxide, and aragonite saturation state) can be found in the supplementary information of Castillo et al. (2014). In brief, six colonies of S. siderea from nearshore environments and six colonies from forereef environments were collected in July 2011 from the Belize Mesoamerican Barrier Reef and immediately transported to the University of North Carolina (UNC) Aquarium Research Center. Colonies were sectioned into 18 fragments, which were maintained in one of six experimental treatments (3 replicate tanks per treatment) for 95 days.
Partial pressures of CO2 (standard deviation: SD) of 324 (89), 477 (83), 604 (107), and 2553 (506) μatm were employed to correspond to near-pre-industrial, near-present-day, predicted end-of-century, and an extreme year 2500 scenario (the latter to investigate how S. siderea responds to seawater that is undersaturated with respect to aragonite). Seawater temperatures (SD) of 25.01 (0.14), 28.16 (0.24), and 32.01 (0.17)°C were employed to approximate monthly minimum, mean, and maximum seawater temperatures over the past 10 years (2002–2012) as determined from in situ seawater temperature records obtained near the coral collection sites (Castillo and Helmuth, 2005; Castillo and Lima, 2010; Castillo et al., 2012), and also to encompass the range of average annual seawater temperatures predicted for the next century. All experimental tanks were illuminated with a conservative irradiance of 250 μmol photons m−2 s−1 on a 12-h light-dark cycle in order to minimize potential light stress that could confound the corals' responses to the prescribed treatments (Supplementary Figure 1). Coral tissue was removed with a seawater sprayer (WaterPik) at the completion of the experiment, immediately preserved in RNAlater, and stored at −80°C until RNA isolation.
RNA Isolation and Sequencing Preparation
To achieve a sufficient quantity of RNA for sequencing, RNA was isolated from a total of 94 individual nubbins and then pooled by reef environment within each experimental treatment, yielding a total of 12 sequencing libraries (Table 1), each of which contained the RNA of at least six individuals. RNA pooling within treatments was necessary due to low RNA quantity per individual and is generally regarded as appropriate when the primary objective is to examine population-level, rather than individual-level, characteristics (Kendziorski et al., 2003). The nearshore and forereef pools within each treatment were individually sequenced and, therefore, considered biological replicates (Kendziorski et al., 2003)—a replication scheme that is accepted in transcriptomic studies (Daniels et al., 2015).
Coral RNA was isolated with the ToTALLY RNA Kit (Ambion) using the manufacturer's protocol with some additional steps. Prior to RNA extraction, samples were thawed on ice and centrifuged at 8000 rpm for 1 min. The RNA-later was then decanted and replaced with 500 uL lysis buffer along with a small amount of glass beads. Samples were then placed in a bead beater for 1 min and centrifuged again at 8000 rpm for 1 min before proceeding with the manufacturer's protocol. Trace DNA contamination was eliminated by DNase 1 (Ambion) digestion at 37°C for 45 min. Library preparation, including a poly(A)+-selection to obtain eukaryotic mRNA, cDNA normalization, and sequencing were completed at the UNC High Throughput Sequencing Facility (UNC-HTSF). Twelve pooled libraries were prepared using poly(A)+-selection and sequencing was performed using two lanes of Illumina HiSeq 2000 at the UNC-HTSF, which yielded paired-end (PE) 100 bp reads (Table 2). Technical replicates of each lane were then re-sequenced to increase depth of coverage, yielding a total of four lanes of Illumina HiSeq 2000.
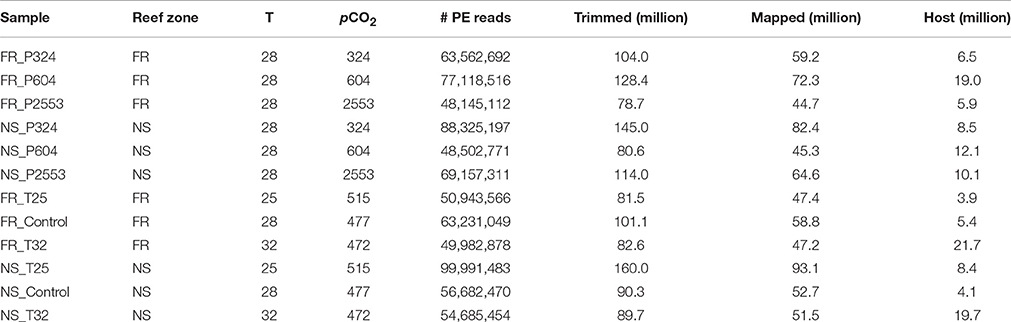
Table 2. Summary of sequence mapping details, including reef zone from where corals were collected (forereef = “FR” and nearshore = “NS”), temperature (“T,” °C), pCO2 (μatm), total number of raw 100 bp paired-end (PE) reads sequenced with Illumina Hiseq 2000 (“# PR Reads”), millions of unpaired reads remaining after trimming and quality control (“Trimmed”), millions of reads that mapped to the holobiont transcriptome (“Mapped”), and total millions of mapped S. siderea reads (“Host”).
Transcriptome Assembly
For transcriptome assembly purposes, all sequencing data were pooled, yielding over 770 million PE reads. Fastx_toolkit trimmed Illumina TruSeq adapters and poly(A)+ tails using the fastx_clipper function. Sequences <50bp in length were removed for assembly purposes. Resulting reads were then quality filtered using fastq_quality_filter with the requirement that ≥80% of bases meet a cutoff score of 20. Reads were repaired and data redundancy was removed using fastx_collapser. Collapsed files then served as input for RNAseq de novo assembly using Trinity (Grabherr et al., 2011) with 750 GB of system memory and 24 CPUs at the Texas Advanced Computing Center (TACC) at the University of Texas at Austin.
Separation of Host- and Symbiont-Derived Contigs
All currently available (as of November 2014) Symbiodinium and cnidarian transcriptomes and genomes were obtained from public databases and assembled into four distinct databases (Table 3; Putnam et al., 2007; Zhang et al., 2007; Shinzato et al., 2011; Bayer et al., 2012; Ladner and Palumbi, 2012; Lehnert et al., 2012; Moya et al., 2012; Barshis et al., 2013; Kenkel et al., 2013b; Shoguchi et al., 2013; Wright et al., 2015). These databases were (1) all available cnidarian data (N = 23), (2) all available Symbiodinium data (N = 15), (3) aposymbiontic cnidarian data only (N = 14), and (4) cultured Symbiodinium data only (N = 6). Databases were indexed and a translated blast search (tblastx) of the Trinity-assembled transcriptome was completed against each of the four databases. A contig was considered a host contig if it had an amino acid (AA) length overlap greater than 100 bp with a 75% identity cutoff to any cnidarian. However, if the same contig was also assigned to cultured Symbiodinium with a 100 bp AA overlap with 80% identity, it was removed from the host transcriptome. Lower threshold identity (75%) was used for the host when compared to Symbiodinium (80%) since, at the time of sequencing, no sequences were available for Siderastrea spp. Symbiodinium contigs were assigned in the same manner as described above and contigs were removed if they also assigned to aposymbiotic cnidarians with 100 bp AA overlap and 80% identity. If a contig was present in host and symbiont transcriptomes after filtering, this contig was removed from both transcriptomes. In addition, any contigs in the host transcriptome annotated as being chloroplast-associated genes were removed. Lastly, ribosomal RNA contamination was identified as sequences exhibiting significant nucleotide similarity (BLASTN, e-value ≤ 1 × 10⁻⁸) to the SILVA LSU and SSU rRNA databases (http://www.arb-silva.de/). A total of three contigs from the Siderastrea siderea transcriptome, each of which matched a coral-specific rRNA, were identified using this approach and were removed from the database.
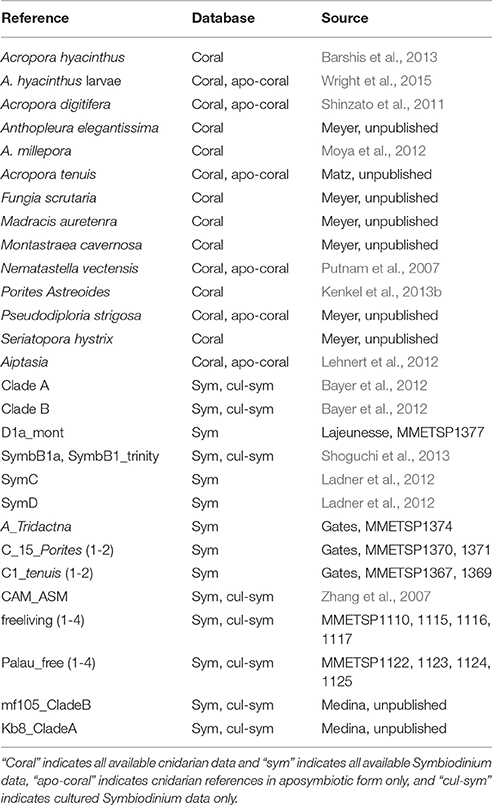
Table 3. Summary of mapping databases used to determine whether a contig originated from Siderastrea siderea or Symbiodinium.
Siderastrea siderea Transcriptome Annotation
Cnidarian-specific contigs were annotated by BLAST sequence homology searches against UniProt and Swiss-Prot NCBI NR protein databases with an e-value cutoff of e−5 and annotated sequences were then assigned to Gene Ontology (GO) categories (Consortium, 2015). Metrics of transcriptome contiguity and Core Eukaryotic Genes Mapping Approach (CEGMA) were employed to gauge transcriptome completeness. Contiguity determines the percentage of expressed reference transcripts covered by the longest assembled transcript (i.e., protein coverage) and CEGMA assesses the proportion of core eukaryotic genes (CEGs) from an unbiased set of proteins expressed and conserved within eukaryotes (Parra et al., 2007).
Read Mapping and Differential Gene Expression Analysis
Read mapping and differential gene expression were first compared across the technical sequencing replicates to investigate lane effects. No differences were observed in numbers of isogroups or numbers of differentially expressed genes (DEGs). Therefore, lane replicates were combined for final analysis. Raw reads across libraries ranged from 48.1 to 100.0 million PE 100 bp sequences (Table 1). Fastx_toolkit was used to remove Illumina TruSeq adapters and poly(A)+ tails. Sequences <20 bp in length with <90% (10% more stringent than trimming threshold used for transcriptome assembly) of bases having quality cutoff scores >20 were also trimmed. The resulting quality filtered reads (R1 and unpaired reads only) were then mapped to the holobiont transcriptome (Siderastrea siderea + Symbiodinium) using Bowtie2.2.0 (Langmead and Salzberg, 2012). Total counts of S. siderea mapped reads ranged from 3.9 (FR_T25) to 21.7 (FR_32) million with holobiont mapping efficiencies ranging from 46.0 to 52.9% (Table 2 and Supplementary Data Sheet 1).
Differential gene expression analyses were performed with DESeq2 v. 1.6.3 (Love et al., 2014) in R v. 3.1.1 (R Development Core Team, 2015). Expression data were normalized using the rlog function, which is a robust normalization method when size factors vary across samples (Love et al., 2014). First, all normalized data (N = 16,931 genes) were subjected to a principle coordinate analysis to visualize the overall transcriptomic differences of all transcriptomic samples using the pcoa function in the R package vegan. Then, independent differences between treatments and reef sites were tested using the Adonis function (Oksanen et al., 2013). Second, a subset of these genes (FDR adjusted p < 0.05 for any treatment, described below, N = 7242 genes) was subjected to the same analysis. Pooled libraries from both environments within a treatment yielded similar expression data (described in results) and were therefore treated as biological replicates.
Numbers of DEGs were determined using the model: design ~ reef zone + treatment. First, counts were normalized and then independent pairwise contrasts were computed independently for each treatment relative to the control. Genes identified as differentially expressed were then corrected for false positives using the Benjamini and Hochberg false discovery rate (FDR) correction for multiple testing (Benjamini and Hochberg, 1995). A contig was considered significantly differentially expressed if it had an average basemean expression >5 and it had an FDR adjusted p < 0.05. Because environment was explicitly modeled, dispersion estimates should reduce the discovery of DEGs within each treatment if genes of corals from the two environments express differently, thereby maintaining a conservative statistical approach.
Weighted Gene Co-expression Network Analysis
The primary objective of this study is to investigate the effects of thermal and acidification stress on full molecular pathways within corals, rather than on the expression of individual genes. Correlation structure in the expression data was therefore examined using a systems genetics approach, in which all rlog-transformed genes were subjected to Weighted Gene Coexpression Network Analysis (WGCNA) (Langfelder and Horvath, 2008). This methodology identifies groups of genes (“modules”) that are co-regulated within treatments across experimental samples. Although appropriate for interpreting the results of the present study, it should be noted that this systems level analysis may not yield outcomes that are directly comparable to those generated from traditional gene expression analysis.
The expression of genes in these modules can be summarized by the overall module expression profile, which is represented by the module's eigengene. This eigengene expression can then be correlated post-hoc with treatment conditions (“traits”). Gene significance is defined as the absolute value of the correlation between individual genes within a module and the treatment condition of interest, while module membership represents the correlation of the individual gene's expression with the module eigengene (Langfelder and Horvath, 2008). Here, correlations with experimental treatment condition were assessed to identify modules that capture entire co-expressed pathways correlating with the corals' stress responses to temperature and pCO2. Data were visualized using heatmaps of all genes within individual libraries, along with overall eigengene expression of that library for the specific module of genes, in order to explore the expression patterns of individual genes within each module.
Module Gene Ontology (GO) Enrichment
A typical “GO enrichment” analysis based on Fisher's exact tests was applied to the statistically conservative binary (presence/absence) measure of a gene's presence within a WGCNA module to identify GO enrichment within that module. Results were then plotted as a dendrogram, which traces the level of gene sharing between significant GO categories and lists the number of genes represented in the module over the total number of genes assigned to each category within the entire expression dataset (Dixon et al., 2015).
Results
Siderastrea siderea Transcriptome
The investigation of gene expression differences across treatments first required the assembly of a complete reference transcriptome for S. siderea. After adapter trimming and quality filtering, a total of 1,255,626,250 reads were retained (81.5%), of which 536,426,960 were paired (69.6%) and 182,772,330 were unpaired (11.9%). A total of 333,835 contigs (N50 = 1673) were in the assembled holobiont metatranscriptome, of which 46,387 were unambiguously assigned as S. siderea specific contigs, with an average length of 2236 bp and an N50 of 2753. Among host contigs, 16,931 unique isogroups were obtained, of which 12,088 (71.4%) had gene annotations based on sequence homology. Forty-seven percent of S. siderea contigs had protein coverage exceeding 0.75 (Supplementary Figure 2) and results from the Core Eukaryotic Genes Mapping Approach (CEGMA; (Parra et al., 2007) suggest that 73.3% of complete highly conserved core genes were present (77.1% partially complete), indicating that the transcriptome was comprehensive. All raw reads are archived in the National Center for Biotechnology Information Short Read Archive (SRA) under accession number PRJNA307543, with transcriptome assembly and annotation files available at https://sarahwdavies.wordpress.com/data/ and www.bco-dmo.org/project/635863.
S. siderea Transcriptomic Responses to Temperature and pCO2
RNAseq analysis revealed that the effect of reef site was insignificant when comparing both the entire transcriptome (Adonis psite = 0.055, Supplementary Figure 3) and the DEG data subset (Adonis psite = 0.079, Figure 2C), supporting the use of these pooled RNA libraries as biological replicates. Instead, strong associations were observed between expression levels of transcripts within each of the six treatments, regardless of reef environment. These treatment-specific responses held for both the entire transcriptome (Adonis ptreatment < 0.001, Supplementary Figure 3) and the DEG data subset (Adonis ptreatment < 0.001, Figure 2C), suggesting that each treatment elicited a distinct stress response. Relative to control conditions (pCO2 = 477 μatm, 28°C), 1.1, 12.0, and 5.5% of S. siderea genes were identified as differentially expressed under low (324 μatm), high (604 μatm), and extreme-high (2553 μatm) pCO2 conditions, respectively, while 2.9% and 18.2% of genes were identified as differentially expressed under 25 and 32°C, respectively (Figures 2A,B; Supplementary Data Sheets 2–6). Notably, the majority (72.3%) of DEGs in the high-temperature treatment (32°C) were underrepresented relative to the control, far more than under the extreme-high pCO2 treatment (48%; Figures 2A,B). Importantly, these results suggest that the thermal stress investigated in this study (32°C) had a more adverse impact on the coral (i.e., greater proportion of underrepresented genes) than the extreme acidification stress (2553 μatm; i.e., greater proportion of overrepresented genes)—consistent with observed ca. 80% reduction in net calcification rate (relative to the control) at 32°C vs. the ca. 25% reduction observed at 2553 μatm (Figure 1; Castillo et al., 2014). Differential gene expression information for each treatment is included in Supplementary Data Sheets 2–6.
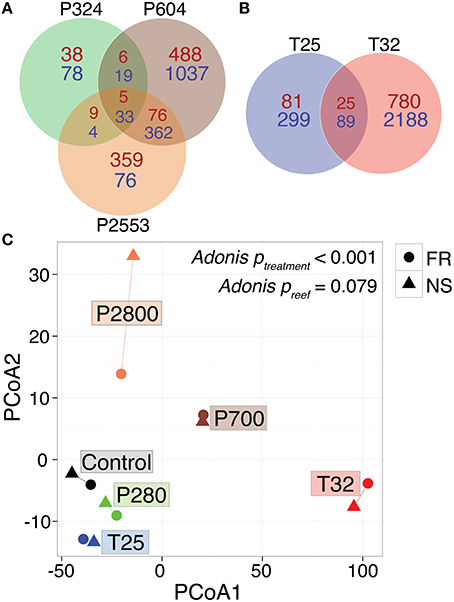
Figure 2. Global RNA-Seq patterns for Siderastrea siderea under various temperature and pCO2 treatments. Venn diagram of differentially expressed genes in Siderastrea siderea (FDR = 0.05), with respect to pCO2 treatments (A) and temperature treatments (B) relative to the control treatment (pCO2 = 477 μatm, 28°C). Red numbers indicate overrepresented genes and blue numbers indicate underrepresented genes. (C) Principal coordinate analysis (PCoA) of all r-log transformed isogroups passing the FDR-corrected p < 0.05 threshhold clustered by experimental treatment, demonstrating significantly different transcriptomic responses of corals across different experimental treatments, regardless of reef zone origin (“NS” = nearshore and “FR” = forereef; Adonis ptreatment < 0.001, Adonis psite = 0.0779). Symbol colors represent treatment conditions: black = control: (477 μatm, 28°C), green = low pCO2 (324 μatm, 28°C), brown = high pCO2 (604 μatm, 28°C), orange = extreme-high pCO2 (2553 μatm, 28°C), blue = low temperature (515 μatm, 25°C), and red = high temperature (472 μatm, 32°C).
Treatment-Specific Transcriptomes Show Overrepresentation of Distinct Pathways
The WGCNA assigned all 16,931 rlog-transformed isogroups to seven co-expression modules (designated by colors) with a module merging of 0.6, which effectively merged modules with highly correlated eigengenes (Figure 3A). Four module eigengenes were significantly correlated with distinct stressors (Figure 3): “blue” (679 genes) and “turquoise” (3919 genes) modules correlated with extreme temperature (32°C) (rblue = 0.98, rturquoise = −0.91), while “green” (4871 genes, rgreen = 0.79) and “purple” modules (1648 genes, rpurple = 0.86) correlated with high (604 μatm) and extreme-high (2553 μatm) pCO2, respectively (Figures 3B,C). Correlations between gene significance and module membership were used to further substantiate these relationships, with correlations ranging from 0.61 for the (purple) module to 0.97 for the “blue” module (Figure 3C). No modules were significantly correlated with low temperature (25°C) and the only module correlating with low pCO2 (324 μatm) was the “gray” module, which only contained 47 genes, a number too small for system-level analyses.
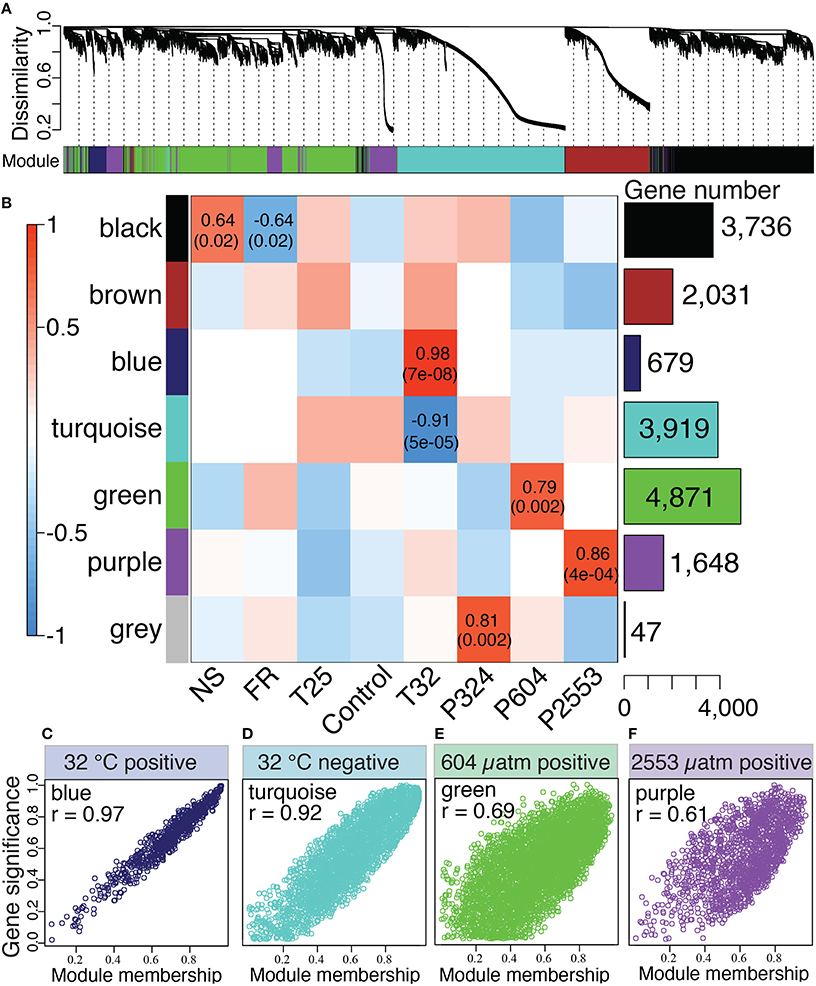
Figure 3. Network analysis of Siderastrea siderea gene expression. (A) Dendrogram showing clustering of genes based on similarity of their expression patterns among all libraries, regardless of experimental treatment. The colored bar below the dendrogram denotes inferred co-expression modules. (B) Correlations between module eigengenes (rows) and presence-absence of a particular treatment (columns). The bar graph and numbers on the right indicate number of genes belonging to each module. The two numbers in the cells are Pearson's correlation coefficients and p-values of the correlation test (not listed for cells with p > 0.05). (C–F) Scatterplots illustrating the relationship between a gene's module membership score (x-axis) and the gene's significance for the experimental treatment (y-axis). Higher correlations between these parameters indicate stronger associations of the “blue” (C), “turquoise” (D), “green” (E), and “purple” (F) modules with their associated treatments (32°C, 32°C, 604 μatm, and 2553 μatm, respectively).
Gene Ontology (GO) enrichment analysis of the overrepresented genes in the “blue” module correlating to the extreme temperature treatment found no enrichment of any GO terms for “cellular compartment” (CC). However, within the “biological process” (BP) GO category enrichment of many metabolism and catabolism pathways was observed (Figure 4A). These GO terms were often specifically associated with the breakdown of amino acids (i.e., cellular amino acid catabolic process; GO:0009063). Gene Ontology enrichment of the “blue” module also detected mild enrichment of oxidoreductase activity in the “molecular function” (MF) category (oxidoreductase, acting on the CH-NH group of donors; GO:0016645); however, this GO term was only marginally significant (p < 0.10; Figure 4A).
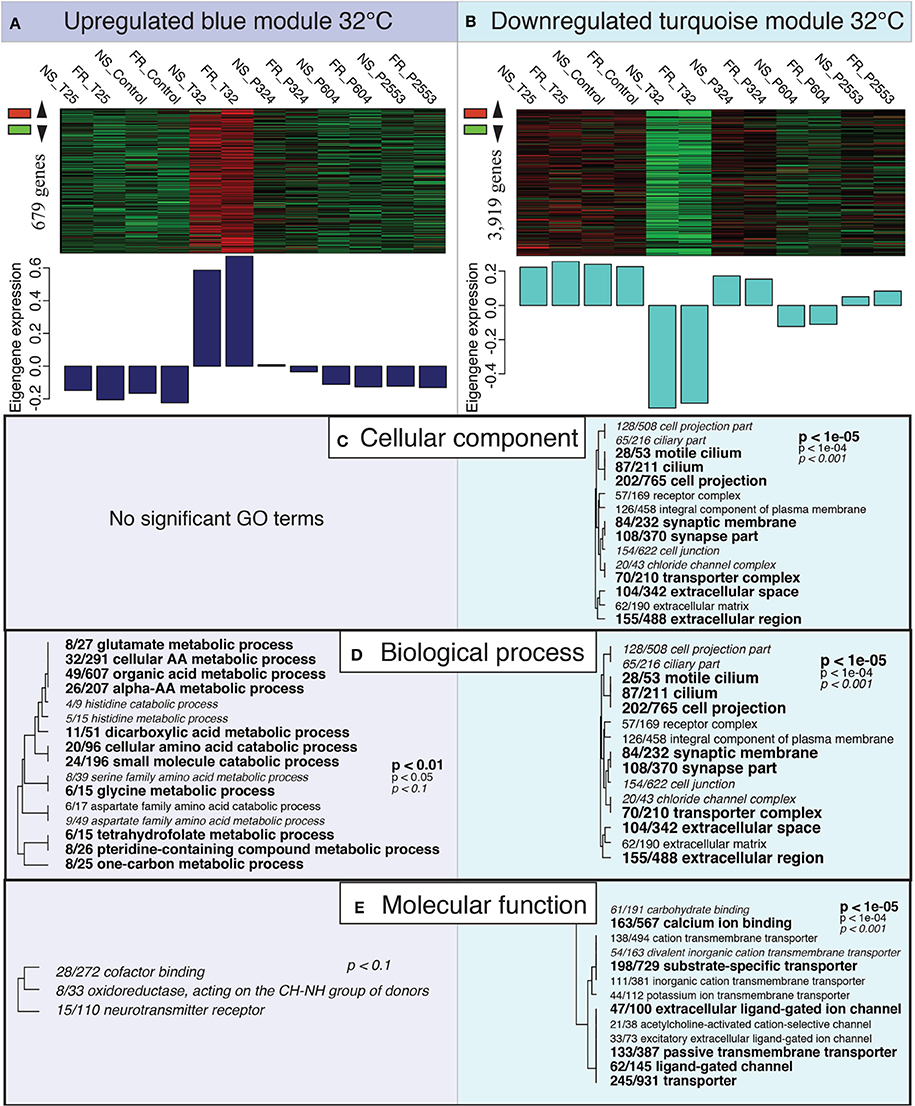
Figure 4. Expression modules correlated with high temperature treatment. Heatmaps of all genes assigned to the “blue” (A) and “turquoise” (B) modules by individual RNAseq libraries and barplots showing the relative eigengene expression for that sample. Bars >0 indicate overall higher expression of genes in that module (i.e., 32°C samples for the “blue” module), while bars <0 indicate lower expression of genes in that module (i.e., 32°C samples for the “turquoise” module). (C–E) Gene Ontology (GO) categories significantly enriched for each expression module by “cellular component” (C), “biological process” (D) and “molecular function” (E) using Fisher's exact test. Dendrograms depict sharing of genes between categories (the categories with no branch length between them are subsets of each other), with the fraction corresponding to proportion of genes contained within the module relative to the total number of genes within the GO category. Text size and boldness indicate the significance (Fisher's exact test) of the term, as indicated by the inset key.
Gene Ontology enrichment of the highly underrepresented module for 32°C (“turquoise”), which contained 3919 genes, detected many significant GO terms across all GO categories (CC, BP, MP; Figure 4B). Gene Ontology terms within CC and BP included many GO terms associated with cilia [e.g., cilium (GO:0005929) and cell projection (GO:0042995)] and synaptic activity [e.g., synaptic membrane (GO:0097060) and synapse part (GO:0045202)]. Furthermore, the “turquoise” module was also enriched for GO terms in the MF category associated with cellular transport, which included ion transport (GO:0006811) and calcium ion binding (GO:0005509; Figure 4B).
Both the “green” (604 μatm pCO2) and the “purple” (2553 μatm pCO2) modules included genes that were overrepresented under increased pCO2 (Figure 5). Interestingly, both of these modules exhibited significant GO enrichment in the CC category for the term mitochondrial part (GO:0044429; Figures 5A,B). The “purple” module included enrichment of GO terms related to hydrogen ion/proton transport [e.g., hydrogen ion transmembrane transporter (GO:1902600) and ATP synthesis coupled proton transport (GO:0015986)] across all GO categories, suggesting that these pathways were particularly enriched at 2553 μatm pCO2 (Figure 5B). Lastly, the “purple” module was also enriched with GO terms in the BP category associated with cell death, which included apoptotic signaling pathway (GO:0097190) and regulation of cell death (GO:0010941).
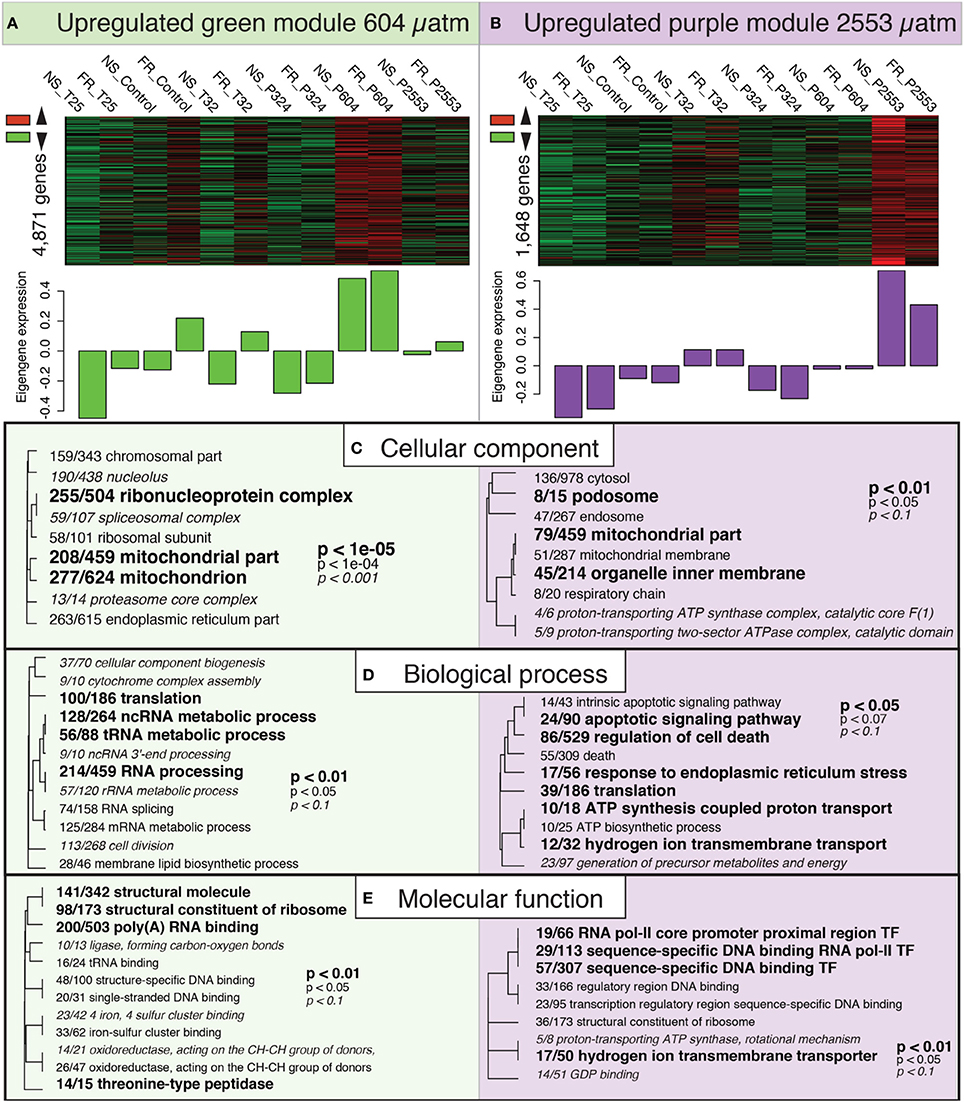
Figure 5. Expression modules correlated with high pCO2 treatment. Heatmaps of all genes assigned to the “green” (A) and “purple” (B) modules by individual RNAseq libraries and barplots showing the relative eigengene expression for that sample. Bars >0 indicate overall higher expression of the genes in that module. (C–E) Gene ontology (GO) categories significantly enriched for each expression module by “cellular component” (C), “biological process” (D) and “molecular function” (E) using Fisher's exact test. Dendrograms depict sharing of genes between categories (the categories with no branch length between them are subsets of each other), the fraction corresponds to genes contained within the module relative to the total number of genes within the GO category. Text size and boldness indicate the significance (Fisher's exact test) of the term, as indicated by the inset key.
Discussion
Contrasting Transcriptomic Responses to Temperature and pCO2
Transcriptomic responses of S. siderea to thermal and acidification stress were highly divergent, with warming causing broad-scale disruption of genes associated with homeostasis and acidification causing overrepresentation of genes associated with ion transport and respiration (Figures 4, 5). The divergent nature of these transcriptomic responses is consistent with that observed for terrestrial (Arabidopsis; Rizhsky et al., 2004) and other marine (Crassostrea virginica; Chapman et al., 2011) organisms exposed to multiple stressors. Notably, however, no modules were correlated with the low pCO2 or low temperature treatments (Figure 3B). This observation, combined with the reduced numbers of DEGs observed in these treatments (Figure 2A) suggests that low temperature and low pCO2 do not generate strong transcriptomic responses in S. siderea.
Calcification rates for corals grown under pre-industrial (324 μatm) and extreme-high (2553 μatm) pCO2 were statistically indistinguishable; Figure 1B). Conversely, the transcriptome at pCO2 of 2553 μatm exhibited many more overrepresented genes than at 324 μatm. This transcriptomic enrichment of genes linked to proton regulation at 2553 μatm pCO2 may play a role in the capacity of S. siderea to acclimate to extreme-high pCO2, enabling these corals to continue calcifying (albeit at a slower rate) throughout the 95-day experiment, even at near undersaturated conditions. However, additional physiological measurements are needed to unambiguously define the relationship between the observed transcriptomic responses and the role that pH regulation at the site of calcification plays in defining a coral's response to ocean acidification. Furthermore, the observed metabolic restructuring of S. siderea's transcriptome under extreme-high pCO2 also involved increased expression of respiration-linked genes (Figure 5C), which is consistent with the hypothesis that this acclimation is energetically costly. However, a strict test of this hypothesis would require direct measurement of respiration rates and energy reserves, neither of which were quantified in the present study.
Acclimation costs and/or tradeoffs have been previously documented in corals. For example, Jones and Berkelmans (2010) found that corals hosting more thermally tolerant Symbiodinium (clade D), potentially for thermal acclimation, exhibited a nearly 38% reduction in calcification rates. Although energetic costs appear to be manifest as impaired calcification rates in the previous example (Jones and Berkelmans, 2010), this was not observed in the present study on S. siderea. Corals in the low pCO2 treatments exhibited little transcriptomic change, but calcified at the same rate as the extreme-high pCO2 corals, which exhibited substantial transcriptomic modifications. However, it is possible that the increased metabolic costs associated with this broadscale upregulation in the extreme-high pCO2 treatments was not captured by the net calcification measurements (Lang et al., 2009). Indeed, previous work has demonstrated that tissue growth may be more responsive to environmental stress than skeletal growth (Anthony et al., 2002), which highlights the importance of measuring both tissue and skeletal growth in future coral stress experiments.
Metabolic Modifications and Homeostatic Disturbance under High Temperature
Two modules were associated with the transcriptomic response to extreme temperature (32°C) after 95 days (“blue” and “turquoise”, Figure 3). Gene Ontology enrichment analysis of the overrepresented extreme temperature module (“blue”) suggests metabolic modification—specifically, increased catabolism (Figure 4D). This is consistent with the assertion that metabolic depression is an adaptive strategy for managing short-term stress (Portner and Farrell, 2008). However, under the long-term stress implemented in this study, the most overrepresented GO term in the “blue” module was cellular amino acid catabolic process (Figure 3D, GO:0009063). This transcriptomic response suggests that the corals' response to long-term heat stress may promote protein breakdown. In healthy corals, symbiont-derived photosynthetic products have been shown to provide up to 100% of their daily metabolic requirements. In bleached corals, however, these inputs of organic carbon decrease and corals must rely more heavily on energy reserves and/or heterotrophy to survive (Grottoli et al., 2006). In the present study, S. siderea specimens at 32°C exhibited varying degrees of bleaching after 95 days. It is therefore possible that the corals' energy reserves were diminished or depleted under these conditions—although these physiological parameters (e.g., lipid, protein, carbohydrate) were not quantified in the present study.
In the highly underrepresented module for 32°C (“turquoise”), GO enrichment analysis suggested downregulation of what are generally considered key biological processes, including cilium (GO:0005929), synaptic membrane (GO:0097060), synapse part (GO:004520), ion transport (GO:0006811), and calcium ion binding (GO:0005509; Figures 4C–E). Coral cilia have been compared to the external neuromasts in the lateral lines of fish (Vermeij et al., 2010), which are used to detect environmental stimuli and are also known to play important roles in muco-ciliary processes that can be disrupted during bleaching (Brown and Bythell, 2005). In addition, reductions in calcium ion binding may indicate the interruption of cell-signaling pathways (Kaniewska et al., 2012). Collectively, these disruptions suggest a restriction of the coral's ability to respond to their environment under thermal stress. These reductions in ion transport and calcium ion binding may also reflect disruption of calcification, as the downregulation of these categories has been consistently associated with the coral transcriptomic response to increased pCO2 (Kaniewska et al., 2012), increased UV radiation (Aranda et al., 2011), and bleaching (DeSalvo et al., 2008). Although one cannot be certain what these GO categories represent in terms of coral physiology, the observed widespread underrepresentation of transcripts has been previously observed in corals (Meyer et al., 2011; Vidal-Dupiol et al., 2014), oysters (Zhao et al., 2012), and even yeast (Gasch et al., 2000) exposed to environmental stress, suggesting that gene downregulation may be a conserved transcriptomic response to severe environmental stress. The underrepresentation of genes (this study) and correspondingly reduced rates of calcification (Castillo et al., 2014) observed for S. siderea cultured for 95 days at 32°C (Figure 1) suggest that this temperature stress exceeds this species' threshold for acclimation.
Overrepresentation of Metabolism and Proton-Pumping under Increased pCO2
Two modules were significantly associated with the corals' transcriptomic response to pCO2 after 95 days: the “green” module, which included overrepresented genes (4871) at 604 μatm pCO2, and the “purple” module, which showed strong overrepresentation of genes (1648 genes) at 2553 μatm pCO2 (Figures 3, 5). Both modules exhibited GO enrichment for mitochondrial part (GO:0044429), suggesting that oxidative metabolism in S. siderea may increase under high and extreme-high pCO2 (Figures 5C–E), which is consistent with the hypothesis that the maintenance of calcification under these conditions comes with increased energetic demands. This finding contrasts the results of other transcriptomic studies investigating the effects of acidification on corals (Kaniewska et al., 2012; Moya et al., 2012), which observed a reduction in the expression of genes involved in respiration under increased pCO2. Results of these studies may differ from the results of the present study on S. siderea because corals in the present experiment were exposed to environmental stress for a much longer period of time (95 days), at least three times longer than any previous study investigating coral transcriptomic responses to increased pCO2 and temperature, thereby providing more time for the corals to acclimate. However, these differences may also reflect interspecific variation, since S. siderea is known to be highly resilient and better able to cope with chronic environmental stress (Colella et al., 2012; Castillo et al., 2014), and/or different life history stages.
The highly overrepresented module at 2553 μatm pCO2 (“purple”) included GO enrichment for hydrogen ion transmembrane transporter (GO:1902600) and ATP synthesis coupled proton transport (GO:0015986; Figure 5), suggesting that upregulation of hydrogen ion (H+/proton) transport is a major component of the corals' transcriptomic response to extreme-high pCO2. Proton-transport out of the coral calcifying fluid (thereby increasing calcifying fluid saturation state with respect to aragonite) has previously been proposed as a mechanism for coral calcification (Cohen and McConnaughey, 2003), with microelectrode (Ries, 2011), boron isotope (McCulloch et al., 2012), antibody immunolabeling (Barott et al., 2015), and pH-sensitive dye studies (Venn et al., 2013) demonstrating that corals are able to calcify under normal and elevated pCO2 by elevating pH of their calcifying fluid relative to their surrounding seawater. Ca2+ plasma membrane ATPase upregulation was observed in P. damicornis, although this result was only observed at two (856 and 2181 μatm) of the three (3880 μatm) high-pCO2treatments (Vidal-Dupiol et al., 2013). Kaniewska et al. (2012) describe enrichment of H+-exchange pathways in corals exposed to elevated pCO2. However, GO enrichment does not necessarily indicate expression direction and further inspection of V-type ATPase actually suggested downregulation of H+-exchange under increased pCO2 in A. millepora. Furthermore, Kaniewska et al. (2012) observed no differences in A. millepora calcification across pCO2 treatments, raising the possibility that this species mitigates effects of ocean acidification by regulating pH at the site of calcification. We also report the overrepresentation and upregulation of H+-transport genes under elevated pCO2, even though reductions in calcification rate were observed under the most extreme pCO2treatment (Castillo et al., 2014).
These species-level differences in transcriptomic and calcification responses to acidification are consistent with the assertion that marine calcifiers that have stronger control over the pH of their calcifying fluid are more resilient to the effects of acidification, and that this ability varies amongst species (Ries, 2011). Furthermore, this potential to acclimate to ocean acidification via increased expression of genes linked to proton transport may be energetically costly (Cohen and McConnaughey, 2003). Although these costs have not yet been substantiated with physiological measurements, their existence is supported by the gene expression data showing increased oxidative metabolism via the respiration pathway under conditions of elevated pCO2 (Figure 5).
Implications for Coral Acclimation to Global Change
Under ocean acidification scenarios predicted for the next several centuries, observed expression patterns (i.e., general upregulation) were suggestive of acclimation, demonstrating that the S. siderea populations investigated in this study are resilient to substantial acidification stress over the time scale that they were investigated. However, under the extreme temperatures tested here, expression patterns (i.e., general downregulation) corroborate previous observations of substantially reduced calcification rates, which collectively suggest physiological shutdown of the coral under such extreme temperature conditions. These results are consistent with prior physiological-based studies showing that ocean warming poses a greater threat to the coral S. siderea than ocean acidification, at least at levels predicted for the next several centuries. However, it is important to note that although this experiment was conducted over a relatively long duration (95 days), it is possible that this species would continue to acclimate to these stressors beyond the 95-day window that they were evaluated, and to evolve via natural selection over much longer timescales. Furthermore, because CO2-induced warming and acidification may occur in tandem over the foreseeable future, it is critical that future studies also assess the combined and interactive effects of these stressors on the transcriptomic profile and physiology of S. siderea and other scleractinian corals. Lastly, despite apparent acclimation of the corals to acidification via overrepresentation of calcification-linked genes, these transcriptomic responses appear to come with energetic costs that may ultimately limit corals' resilience to acidification. Future investigations of corals' transcriptomic responses to acidification and thermal stress should seek to constrain these potential linkages between differential gene expression and acclimation by coupling transcriptomic observations with detailed measurements of key physiological parameters beyond calcification rate, such as lipid and tissue content, rates of photosynthesis and respiration, and protein degradation.
Funding
Coral pCO2-temperature experiments were supported by NOAA award NA13OAR4310186 (to JR and KC) and NSF award OCE-1357665 (to JR), sequencing-related activities were supported by AM/KC/JR's start-ups and NSF award 1357665 (to JR), and salary/travel for SD was supported by AM/KC/JR's start-ups, NSF awards OCE-1437371, OCE-1459706 (to JR), and NSF OCE-1459522 (to KC).
Author Contributions
KC and JR designed the study. AM completed all molecular preparations for sequencing. SD analyzed data with contributions from AM. SD wrote the paper with contributions from AM, JR, and KC.
Conflict of Interest Statement
The authors declare that the research was conducted in the absence of any commercial or financial relationships that could be construed as a potential conflict of interest.
Acknowledgments
We thank Garbutt Marine for help in the field and Belize Fisheries Department for permit authorization. B. Elder, E. Chow, K. Patel, R. Yost, and D. Shroff helped maintain the experimental tanks and I. Westfield analyzed carbonate chemistry of the experimental treatments. N. Cohen and K. Delong performed coral tissue extractions and preservations, and H. Masters performed RNA extractions. We are grateful to M. Matz, D. Barshis, M. Love, and S. Vollmer for guidance on transcriptome assembly and gene expression analyses.
Supplementary Material
The Supplementary Material for this article can be found online at: http://journal.frontiersin.org/article/10.3389/fmars.2016.00112
Supplementary Figure 1. Sample profile of photosynthetically active radiation (PAR) within the temperature and pCO2 treatment tanks over a 24-h interval during the 95-day experiment. Light profile was designed to replicate the light cycle at 3 to 5 m depth where Siderastrea siderea coral colonies were collected.
Supplementary Figure 2. Transcriptome contiguity based on the Siderastrea siderea transcriptome blastx hits to the reference protein database, with visualized distribution of reference coverages based on the longest matching contig. Forty-seven percent of the S. siderea transcriptome has protein coverage > 0.75.
Supplementary Figure 3. Principal coordinate analysis (PCoA) of all r-log transformed isogroups clustered by experimental treatment demonstrating significantly different transcriptomic responses of corals across different experimental treatments, regardless of reef zone origin (“NS” = nearshore and “FR” = forereef; Adonis ptreatment < 0.001, Adonis psite = 0.055). Symbol colors represent treatment conditions: black = control: (477 μatm, 28°C), green = low pCO2 (324 μatm, 28°C), brown = high pCO2 (604 μatm, 28°C), orange = extreme-high pCO2 (2553 μatm, 28°C), blue = low temperature (515 μatm, 25°C), and red = high temperature (472 μatm, 32°C).
References
Anthony, K. R. N., Connolly, S. R., and Willis, B. L. (2002). Comparative analysis of energy allocation to tissue and skeletal growth in corals. Limnol. Oceanogr. 47, 1417–1429. doi: 10.4319/lo.2002.47.5.1417
Aranda, M., Banaszak, A. T., Bayer, T., Luyten, J. R., Medina, M., and Voolstra, C. R. (2011). Differential sensitivity of coral larvae to natural levels of ultraviolet radiation during the onset of larval competence. Mol. Ecol. 20, 2955–2972. doi: 10.1111/j.1365-294X.2011.05153.x
Barott, K. L., Perez, S. O., Linsmayer, L. B., and Tresguerres, M. (2015). Differential localization of ion transporters suggests distinct cellular mechanisms for calcification and photosynthesis between two coral species. Am. J. Physiol. Regul. Integr. Comp. Physiol. 309, R235–R246. doi: 10.1152/ajpregu.00052.2015
Barshis, D. J., Ladner, J. T., Oliver, T. A., Seneca, F. O., Traylor-Knowles, N., and Palumbi, S. R. (2013). Genomic basis for coral resilience to climate change. Proc. Natl. Acad. Sci. U.S.A. 110, 1387–1392. doi: 10.1073/pnas.1210224110
Bayer, T., Aranda, M., Sunagawa, S., Yum, L. K., DeSalvo, M. K., Lindquist, E., et al. (2012). Symbiodinium transcriptomes: genome insights into the dinoflagellate symbionts of reef-building corals. PLoS ONE 7:e35269. doi: 10.1371/journal.pone.0035269
Benjamini, Y., and Hochberg, Y. (1995). Controlling the false discovery rate: a practical and powerful approach to multiple testing. J. R. Stat. Soc. B 57, 289–300.
Bindoff, N. L., Willebrand, J., Artale, V., Cazenave, A., Gregory, J., Gulev, S., et al. (2007). “Observations: oceanic climate change and sea level,” in Climate Change 2007: The Physical Science Basis. Contribution of Working Group I to the Fourth Assessment Report of the Intergovernmental Panel on Climate Change, eds S. Solomon, D. Qin, M. Manning, Z. Chen, M. Marquis, K. B. Averyt, M. Tignor and H. L. Miller (New York, NY; Cambridge, UK: Cambridge University Press), 385–432.
Brown, B. E., and Bythell, J. C. (2005). Perspectives on mucus secretion in reef corals. Mar. Ecol. Prog. Ser. 296, 291–309. doi: 10.3354/meps296291
Castillo, K. D., and Helmuth, B. S. T. (2005). Influence of thermal history on the response of Montastraea annularis to short-term temperature exposure. Mar. Biol. 148, 261–270. doi: 10.1007/s00227-005-0046-x
Castillo, K. D., and Lima, F. P. (2010). Comparison of in situ and satellite-derived (MODIS-Aqua/Terra) methods for assessing temperatures on coral reefs. Limnol. Oceanogr. Methods 8, 107–117. doi: 10.4319/lom.2010.8.0107
Castillo, K. D., Ries, J. B., Bruno, J. F., and Westfield, I. T. (2014). The reef-building coral Siderastrea siderea exhibits parabolic responses to ocean acidification and warming. Proc. R. Soc. B 281:20141856. doi: 10.1098/rspb.2014.1856
Castillo, K. D., Ries, J. B., Weiss, J. M., and Lima, F. P. (2012). Decline of forereef corals in response to recent warming linked to history of thermal exposure. Nat. Clim. Chang. 2, 756–760. doi: 10.1038/nclimate1577
Chan, N. C. S., and Connolly, S. R. (2013). Sensitivity of coral calcification to ocean acidification: a meta-analysis. Glob. Chang. Biol. 19, 282–290. doi: 10.1111/gcb.12011
Chapman, R. W., Mancia, A., Beal, M., Veloso, A., Rathburn, C., Blair, A., et al. (2011). The transcriptomic responses of the eastern oyster, Crassostrea virginica, to environmental conditions. Mol. Ecol. 20, 1431–1449. doi: 10.1111/j.1365-294X.2011.05018.x
Chua, C. M., Leggat, W., Moya, A., and Baird, A. H. (2013). Temperature affects the early life history stages of corals more than near future ocean acidification. Mar. Ecol. Prog. Ser. 475, 85–92. doi: 10.3354/meps10077
Cohen, A. L., and McConnaughey, T. A. (2003). Geochemical perspectives on coral mineralization. Biomineralization 54, 151–187. doi: 10.2113/0540151
Colella, M. A., Ruzicka, R. R., Kidney, J. A., Morrison, J. M., and Brinkhuis, V. B. (2012). Cold-water event of January 2010 results in catastrophic benthic mortality on patch reefs in the Florida Keys. Coral Reefs 31, 621–632. doi: 10.1007/s00338-012-0880-5
Consortium, T. U. (2015). UniProt: a hub for protein information. Nucleic Acids Res. 43, D204–D212. doi: 10.1093/nar/gku989
Cooper, T. F., De'Ath, G., Fabricius, K. E., and Lough, J. M. (2008). Declining coral calcification in massive Porites in two nearshore regions of the northern Great Barrier Reef. Glob. Chang. Biol. 14, 529–538. doi: 10.1111/j.1365-2486.2007.01520.x
Daniels, C. A., Baumgarten, S., Yum, L. K., Michell, C. T., Bayer, T., Arif, C., et al. (2015). Metatranscriptome analysis of the reef-building coral Orbicella faveolata indicates holobiont response to coral disease. Front. Mar. Sci. 2:62. doi: 10.3389/fmars.2015.00062
De'Ath, G., Lough, J. M., and Fabricius, K. E. (2009). Declining coral calcification on the great barrier reef. Science 323, 116–119. doi: 10.1126/science.1165283
DeSalvo, M. K., Voolstra, C. R., Sunagawa, S., Schwarz, J. A., Stillman, J. H., Coffroth, M. A., et al. (2008). Differential gene expression during thermal stress and bleaching in the Caribbean coral Montastraea faveolata. Mol. Ecol. 17, 3952–3971. doi: 10.1111/j.1365-294X.2008.03879.x
Dixon, G. B., Davies, S. W., Aglyamova, G. A., Meyer, E., Bay, L. K., and Matz, M. V. (2015). Genomic determinants of coral heat tolerance across latitudes. Science 348, 1460–1462. doi: 10.1126/science.1261224
Doney, S. C., Fabry, V. J., Feely, R. A., and Kleypas, J. A. (2009). Ocean acidification: the other CO2 problem. Ann. Rev. Mar. Sci. 1, 169–192. doi: 10.1146/annurev.marine.010908.163834
Doney, S. C., Ruckelshaus, M., Duffy, J. E., Barry, J. P., Chan, F., English, C. A., et al. (2012). Climate change impacts on marine ecosystems. Ann. Rev. Mar. Sci. 4, 11–37. doi: 10.1146/annurev-marine-041911-111611
Gasch, A. P., Spellman, P. T., Kao, C. M., Carmel-Harel, O., Eisen, M. B., Storz, G., et al. (2000). Genomic expression programs in the response of yeast cells to environmental changes. Mol. Biol. Cell 11, 4241–4257. doi: 10.1091/mbc.11.12.4241
Grabherr, M. G., Haas, B. J., Yassour, M., Levin, J. Z., Thompson, D. A., Amit, I., et al. (2011). Full-length transcriptome assembly from RNA-Seq data without a reference genome. Nat. Biotechnol. 29, 644–652. doi: 10.1038/nbt.1883
Grottoli, A. G., Rodrigues, L. J., and Palardy, J. E. (2006). Heterotrophic plasticity and resilience in bleached corals. Nature 440, 1186–1189. doi: 10.1038/nature04565
Hoegh-Guldberg, O., Mumby, P. J., Hooten, A. J., Steneck, R. S., Greenfield, P., Gomez, E., et al. (2007). Coral reefs under rapid climate change and ocean acidification. Science 318, 1737–1742. doi: 10.1126/science.1152509
Jones, A., and Berkelmans, R. (2010). Potential costs of acclimatization to a warmer climate: growth of a reef coral with heat tolerant vs. sensitive symbiont types. PLoS ONE 5:e10437. doi: 10.1371/journal.pone.0010437
Kaniewska, P., Campbell, P. R., Kline, D. I., Rodriguez-Lanetty, M., Miller, D. J., Dove, S., et al. (2012). Major cellular and physiological impacts of ocean acidification on a reef building coral. PLoS ONE 7:e34659. doi: 10.1371/journal.pone.0034659
Kendziorski, C. M., Zhang, Y., Lan, H., and Attie, A. D. (2003). The efficiency of pooling mRNA in microarray experiments. Biostatistics 4, 465–477. doi: 10.1093/biostatistics/4.3.465
Kenkel, C. D., Goodbody-Gringley, G., Caillaud, D., Davies, S. W., Bartels, E., and Matz, M. V. (2013a). Evidence for a host role in thermotolerance divergence between populations of the mustard hill coral (Porites astreoides) from different reef environments. Mol. Ecol. 22, 4335–4348. doi: 10.1111/mec.12391
Kenkel, C. D., Meyer, E., and Matz, M. V. (2013b). Gene expression under chronic heat stress in populations of the mustard hill coral (Porites astreoides) from different thermal environments. Mol. Ecol. 22, 4322–4334. doi: 10.1111/mec.12390
Kitahara, M. V., Cairns, S. D., Stolarski, J., Blair, D., and Miller, D. J. (2010). A comprehensive phylogenetic analysis of the scleractinia (Cnidaria, Anthozoa) based on mitochondrial CO1 sequence data. PLoS ONE 5:e11490. doi: 10.1371/journal.pone.0011490
Kleypas, J. A., and Yates, K. K. (2009). Coral Reefs and Ocean Acidification. Oceanography 22, 108–117. doi: 10.5670/oceanog.2009.101
Ladner, J. T., Barshis, D. J., and Palumbi, S. R. (2012). Protein evolution in two co-occurring types of Symbiodinium: an exploration into the genetic basis of thermal tolerance in Symbiodiniumclade D. BMC Evol. Biol. 12:217. doi: 10.1186/1471-2148-12-217
Ladner, J. T., and Palumbi, S. R. (2012). Extensive sympatry, cryptic diversity and introgression throughout the geographic distribution of two coral species complexes. Mol. Ecol. 21, 2224–2238. doi: 10.1111/j.1365-294X.2012.05528.x
Lang, G. I., Murray, A. W., and Botstein, D. (2009). The cost of gene expression underlies a fitness trade-off in yeast. Proc. Natl. Acad. Sci. U.S.A. 106, 5755–5760. doi: 10.1073/pnas.0901620106
Langdon, C., and Atkinson, M. J. (2005). Effect of elevated pCO2 on photosynthesis and calcification of corals and interactions with seasonal change in temperature/irradiance and nutrient enrichment. J. Geophys. Res. 110, C09S07. doi: 10.1029/2004JC002576
Langfelder, P., and Horvath, S. (2008). WGCNA: an R package for weighted correlation network analysis. BMC Bioinformatics 9:559. doi: 10.1186/1471-2105-9-559
Langmead, B., and Salzberg, S. L. (2012). Fast gapped-read alignment with Bowtie 2. Nat. Methods 9, 357–359. doi: 10.1038/nmeth.1923
Lehnert, E. M., Burriesci, M. S., and Pringle, J. R. (2012). Developing the anemone Aiptasia as a tractable model for cnidarian-dinoflagellate symbiosis: the transcriptome of aposymbiotic A. pallida. BMC Genomics 13:271. doi: 10.1186/1471-2164-13-271
Lirman, D., and Fong, P. (2007). Is proximity to land-based sources of coral stressors an appropriate measure of risk to coral reefs? An example from the Florida Reef Tract. Mar. Pollut. Bull. 54, 779–791. doi: 10.1016/j.marpolbul.2006.12.014
Love, M. I., Huber, W., and Anders, S. (2014). Moderated estimation of fold change and dispersion for RNA-seq data with DESeq2. Genome Biol. 15, 550. doi: 10.1186/s13059-014-0550-8
McCulloch, M., Falter, J., Trotter, J., and Montagna, P. (2012). Coral resilience to ocean acidification and global warming through pH up-regulation. Nat. Clim. Chang. 2, 623–633. doi: 10.1038/nclimate1473
Meyer, E., Aglyamova, G. V., and Matz, M. V. (2011). Profiling gene expression responses of coral larvae (Acropora millepora) to elevated temperature and settlement inducers using a novel RNA-Seq procedure. Mol. Ecol. 20, 3599–3616. doi: 10.1111/j.1365-294x.2011.05205.x
Moberg, F., and Folke, C. (1999). Ecological goods and services of coral reef ecosystems. Ecol. Econ. 29, 215–233. doi: 10.1016/S0921-8009(99)00009-9
Moya, A., Huisman, L., Ball, E. E., Hayward, D. C., Grasso, L. C., Chua, C. M., et al. (2012). Whole transcriptome analysis of the coral Acropora millepora reveals complex responses to CO(2)-driven acidification during the initiation of calcification. Mol. Ecol. 21, 2440–2454. doi: 10.1111/j.1365-294X.2012.05554.x
Moya, A., Huisman, L., Foret, S., Gattuso, J. P., Hayward, D. C., Ball, E. E., et al. (2015). Rapid acclimation of juvenile corals to CO2 -mediated acidification by upregulation of heat shock protein and Bcl-2 genes. Mol. Ecol. 24, 438–452. doi: 10.1111/mec.13021
Oksanen, J. F., Blanchet, G., Kindt, R., Legendre, P., Minchin, P. R., O'Hara, R. B., et al. (2013). vegan: Community Ecology Package. R package version 2.0–7.
Pandolfi, J. M. (2015). Incorporating uncertainty in predicting the future response of coral reefs to climate change. Annu. Rev. Ecol. Evol. Syst. 46, 281–303. doi: 10.1146/annurev-ecolsys-120213-091811
Parra, G., Bradnam, K., and Korf, I. (2007). CEGMA: a pipeline to accurately annotate core genes in eukaryotic genomes. Bioinformatics 23, 1061–1067. doi: 10.1093/bioinformatics/btm071
Portner, H. O., and Farrell, A. P. (2008). ECOLOGY physiology and climate change. Science 322, 690–692. doi: 10.1126/science.1163156
Putnam, N. H., Srivastava, M., Hellsten, U., Dirks, B., Chapman, J., Salamov, A., et al. (2007). Sea anemone genome reveals ancestral eumetazoan gene repertoire and genomic organization. Science 317, 86–94. doi: 10.1126/science.1139158
R Development Core Team (2015). R: A Language and Environment for Statistical Computing. Vienna: R Foundation for Statistical Computing.
Ries, J. B. (2011). A physicochemical framework for interpreting the biological calcification response to CO2-induced ocean acidification. Geochim. Cosmochim. Acta 75, 4053–4064. doi: 10.1016/j.gca.2011.04.025
Ries, J. B., Cohen, A. L., and McCorkle, D. C. (2009). Marine calcifiers exhibit mixed responses to CO2-induced ocean acidification. Geology 37, 1131–1134. doi: 10.1130/G30210A.1
Rizhsky, L., Liang, H. J., Shuman, J., Shulaev, V., Davletova, S., and Mittler, R. (2004). When Defense pathways collide. The response of Arabidopsis to a combination of drought and heat stress. Plant Physiol. 134, 1683–1696. doi: 10.1104/pp.103.033431
Rose, N. H., Seneca, F. O., and Palumbi, S. R. (2016). Gene networks in the wild: identifying transcriptional modules that mediate coral resistance to experimental heat stress. Genome Biol. Evol. 8, 243–252. doi: 10.1093/gbe/evv258
Shinzato, C., Shoguchi, E., Kawashima, T., Hamada, M., Hisata, K., Tanaka, M., et al. (2011). Using the Acropora digitifera genome to understand coral responses to environmental change. Nature 476, 320–323. doi: 10.1038/nature10249
Shoguchi, E., Shinzato, C., Kawashima, T., Gyoja, F., Mungpakdee, S., Koyanagi, R., et al. (2013). Draft assembly of the Symbiodinium minutum nuclear genome reveals dinoflagellate gene structure. Curr. Biol. 23, 1399–1408. doi: 10.1016/j.cub.2013.05.062
van Hooidonk, R., Maynard, J. A., and Planes, S. (2013). Temporary refugia for coral reefs in a warming world. Nat. Clim. Chang. 3, 508–511. doi: 10.1038/nclimate1829
Venn, A. A., Tambutte, E., Holcomb, M., Laurent, J., Allemand, D., and Tambutte, S. (2013). Impact of seawater acidification on pH at the tissue-skeleton interface and calcification in reef corals. Proc. Natl. Acad. Sci. U.S.A. 110, 1634–1639. doi: 10.1073/pnas.1216153110
Vermeij, M. J. A., Marhaver, K. L., Huijbers, C. M., Nagelkerken, I., and Simpson, S. D. (2010). Coral larvae move toward reef sounds. PLoS ONE 5:e10660. doi: 10.1371/journal.pone.0010660
Veron, J. E. N. (2000). Corals of the World, Edited by M. Stafford-Smith. Townsville, QLD: Australian Institute of Marine Science. p. 1382.
Vidal-Dupiol, J., Dheilly, N. M., Rondon, R., Grunau, C., Cosseau, C., Smith, K. M., et al. (2014). Thermal stress triggers broad Pocillopora damicornis transcriptomic remodeling, while Vibrio coralliilyticus infection induces a more targeted immuno-suppression response. PLoS ONE 9:e107672. doi: 10.1371/journal.pone.0107672
Vidal-Dupiol, J., Zoccola, D., Tambutte, E., Grunau, C., Cosseau, C., Smith, K. M., et al. (2013). Genes related to ion-transport and energy production are upregulated in response to CO2-driven pH decrease in corals: new insights from transcriptome analysis. PLoS ONE 8:e58652. doi: 10.1371/journal.pone.0058652
Wright, R. M., Aglyamova, G. V., Meyer, E., and Matz, M. V. (2015). Gene expression associated with white syndromes in a reef building coral, Acropora hyacinthus. BMC Genomics 16:371. doi: 10.1186/s12864-015-1540-2
Zhang, H., Hou, Y., Miranda, L., Campbell, D. A., Sturm, N. R., Gaasterland, T., et al. (2007). Spliced leader RNA trans-splicing in dinoflagellates. Proc. Natl. Acad. Sci. U.S.A. 104, 4618–4623. doi: 10.1073/pnas.0700258104
Keywords: climate change, ocean acidification, thermal stress, coral, transcriptome, Siderastrea siderea, proton pump, WGCNA
Citation: Davies SW, Marchetti A, Ries JB and Castillo KD (2016) Thermal and pCO2 Stress Elicit Divergent Transcriptomic Responses in a Resilient Coral. Front. Mar. Sci. 3:112. doi: 10.3389/fmars.2016.00112
Received: 23 March 2016; Accepted: 15 June 2016;
Published: 30 June 2016.
Edited by:
Christian Wild, University of Bremen, GermanyReviewed by:
Jian-Wen Qiu, Hong Kong Baptist University, ChinaDavid Suggett, University of Technology Sydney, Australia
Copyright © 2016 Davies, Marchetti, Ries and Castillo. This is an open-access article distributed under the terms of the Creative Commons Attribution License (CC BY). The use, distribution or reproduction in other forums is permitted, provided the original author(s) or licensor are credited and that the original publication in this journal is cited, in accordance with accepted academic practice. No use, distribution or reproduction is permitted which does not comply with these terms.
*Correspondence: Sarah W. Davies, ZGF2aWVzc3dAZ21haWwuY29t
†These authors have contributed equally to this work.