 Stefan Sommer1*
 David Clemens1
 Mustafa Yücel2
 Olaf Pfannkuche1Per O. J. Hall3Elin Almroth-Rosell4
 Heide N. Schulz-Vogt5
 Andrew W. Dale1
- 1GEOMAR Helmholtz-Zentrum für Ozeanforschung Kiel, Kiel, Germany
- 2Institute of Marine Sciences, Middle East Technical University, Erdemli, Turkey
- 3Department of Marine Sciences, University of Gothenburg, Gothenburg, Sweden
- 4Oceanography, Swedish Meteorological and Hydrological Institute, Västra Frölunda, Sweden
- 5Biological Oceanography, Leibniz Institut für Ostseeforschung, Warnemünde, Germany
Redox-sensitive mobilization of nutrients from sediments strongly affects the eutrophic state of the central Baltic Sea; a region associated with the spread of hypoxia and almost permanently anoxic and sulfidic conditions in the deeper basins. Ventilation of these basins depends on renewal by inflow of water enriched in oxygen (O2) from the North Sea, occurring roughly once per decade. Benthic fluxes and water column distributions of dissolved inorganic nitrogen species, phosphate (), dissolved inorganic carbon (DIC), sulfide (HS−), and total oxygen uptake (TOU) were measured along a depth gradient in the Eastern Gotland Basin (EGB). Campaigns were conducted during euxinic conditions of the deep basin in Aug./Sept. 2013 and after two inflow events in July/Aug. 2015 and March 2016 when O2 concentrations in deep waters reached 60 μM. The intrusion of O2-rich North Sea water into the EGB led to an approximate 33 and 10% reduction of the seabed and ammonium () release from deep basin sediments. Post-inflow, the deep basin sediment was rapidly colonized by HS− oxidizing bacteria tentatively assigned to the family Beggiatoaceae, and HS− release was completely suppressed. The presence of a hypoxic transition zone (HTZ) between 80 and 120 m water depth was confirmed not only for euxinic deep-water conditions during 2013 but also for post-inflow conditions. Because deep-water renewal did not ventilate the HTZ, where and fluxes were highest, high seabed nutrient release there was relatively unchanged. Extrapolation of the in situ nutrient fluxes indicated that, overall, the reduction in and release in response to deep-water renewal can be considered as minor, reducing the internal nutrient load by 2 and 12% only, respectively. Infrequent inflow events thus have a limited capacity to sustainably reduce internal nutrient loading in the EGB and mitigate eutrophication.
Introduction
The Baltic Sea is a landlocked marginal sea with a narrow connection to the North Sea through the Kattegat. It consists of a series of basins separated by shallow sills and narrow channels. Restricted water exchange with the North Sea and freshwater input from river run-off maintain a strong surface salinity gradient from around 3 in the Bothnian Bay at the northern end to 20 in the Kattegat (Samuelsson, 1996). Density differences result in a strong stratification of the central basins, with a stable halocline located at water depths of 60–80 m (HELCOM, 2009b). Consequently, hypoxia (O2 < 63 μM) has occurred naturally in the deep basins of the Baltic Sea since its formation at about 8000 year BP (Zillén et al., 2008; Conley et al., 2009). With increased terrestrial nutrient inputs, however, the spatial extent and intensity of hypoxia and degree of eutrophication is increasing (Conley et al., 2009; HELCOM, 2009a). Intense efforts backed by the Helsinki Commission have so far failed to significantly reduce eutrophication there (HELCOM, 2009b).
Ongoing chronic hypoxia in the Baltic Sea is partly due to a rapid turnover of phosphorus (P) from hypoxic and anoxic sediments (Conley et al., 2002; Savchuk, 2005; Stigebrandt et al., 2014). Rapid internal P cycling is superimposed on the slow long-term sink of P removal by burial in the sediments (Mort et al., 2010; Viktorsson et al., 2013a; Noffke et al., 2016). As hypothesized by Vahtera et al. (2007), this internal nutrient release delays recovery of the Baltic Proper from eutrophication despite major efforts to reduce the external nutrient load. For this reason, there have been calls to artificially ventilate the deep basins to help permanently sequester P in the sediment as iron-bound minerals and other forms (Stigebrand and Gustafsson, 2007), although such large scale engineering solutions are not without complications (Conley et al., 2009). Pilot studies in an anoxic fjord have demonstrated the potential for major alterations to benthic nutrient cycles before and after forced bottom water oxygenation (Viktorsson et al., 2013b; Brabandere et al., 2015).
Natural ventilation of the deep central basins of the Baltic Sea exclusively depends on episodic inflow events from the North Sea (Matthäus and Franck, 1992; Stigebrandt, 2003). The physics of these overflows has been investigated intensively (see reviews by e.g., Meier et al., 2006; Reissmann et al., 2009; Omstedt et al., 2014; Mohrholz et al., 2015; and references therein). Saline inflows can be of baroclinic or barotropic type. Barotropic inflows are driven by wind and air-pressure induced sea level differences between the Kattegat and the central Baltic Sea. They mainly occur during autumn and winter when wind forcing is highest. Baroclinic inflows are driven by a salinity gradient between the Kattegat and the Baltic and typically occur during summer under calm wind conditions. Summer inflows usually contribute less to the ventilation of the deep basins. Small inflows are soon diluted on their pathway toward the central Baltic (Mohrholz et al., 2015). Flushing that is sufficiently dense (saline) to reach the central Baltic basins is termed a Major Baltic Inflow event (MBI). Specific weather conditions are a prerequisite for the formation of MBIs. Long lasting easterly winds depressing the sea level by about 10 cm to normal, followed by strong westerly winds push North Sea water through the Belt Sea to the entrance area of the Baltic proper (Reissmann et al., 2009 and references therein). The strength of inflow events is related to the mass of imported salt, where strong events range between 2 and 3 Gt of salt and moderate inflows between 1 and 2 Gt (Reissmann et al., 2009). Overflows over the Belt Sea sills transport saline water into the entrance areas of the Baltic Sea where they form gravity-driven dense bottom currents. Those are subjected to entrainment, interleaving and boundary mixing strongly affecting dilution of solutes and geochemical processes (Reissmann et al., 2009; cf. their Figure 2). Due to volume conservation, the deep inflows lead to a compensating uplift of water masses in the central Baltic Sea. Stagnation periods in between inflow events cause strong O2 depletion in the basin bottom waters due to respiration of organic carbon exported from the surface mixed layer. This often leads to fully anoxic conditions below the pycnocline and the build-up of elevated HS− concentrations (Schincke and Matthäus, 1998).
Before ca. 1980, inflow events were relatively frequent and could be observed on average once a year (Matthäus and Franck, 1992). Since then the frequency of MBIs decreased strongly, and strong events were only recorded in 1993 and 2003 (Matthäus et al., 2008; Mohrholz et al., 2015, cf. their Figure 16). In December 2014, a MBI occurred with a total volume of ~198 km3 and terminated a long stagnation period following the last MBI event in 2003. This ventilated the bottom water that had been euxinic since 2005 (Nausch et al., 2012). In comparison to previous MBI events, this was ranked the third strongest since 1880 (Mohrholz et al., 2015). The strongest inflow was recorded in 1951 with an estimated volume of 225 km3 (Mohrholz et al., 2015). The spreading velocity of MBIs into the Baltic proper depends on bathymetry as well as on its density, such that 4–5 months are required for the inflow to reach the Gotland basin (Nehring and Franke, 1981), which is the largest basin in the Baltic proper and the second deepest basin (249 m) in the Baltic Sea. The MBI of December 2014 reached the Eastern Gotland Basin (EGB) in March 2015 and replaced the anoxic deep water (Mohrholz et al., 2016). The deep water below 140 m was completely ventilated until at least May 2015. A moderate MBI triggered in November 2015 reached the EGB in February 2016 and lasted until May 2016 (Mohrholz et al., 2016).
Here, we report on benthic fluxes of nutrients and O2 in the EGB before and after the strong MBI in December 2014 and the moderate MBI in November 2015. Recent studies of nutrient release measured in situ (Viktorsson et al., 2013a; Noffke et al., 2016) and modeled (Almroth-Rosell et al., 2015) from the seabed in the EGB identified the deep sediments as an exceptionally high source of as well as under euxinic bottom water conditions. However, sediments lying within the HTZ between about 80 and 120 m water depth were also identified as a particularly important zone for the recycling of biogenic material (Noffke et al., 2016). Sediments here were observed to be densely covered with mats of filamentous sulfur bacteria of the family Beggiatoaceae. Basin wide release of was extrapolated to 152 kt year−1 (Viktorsson et al., 2013a) and 109 kt year−1, from which as much as 70% (76 kt) was released from the HTZ (Noffke et al., 2016). Similar patterns were observed for (Noffke et al., 2016). These P fluxes are several-fold higher than the external P load of 14 kt year−1 reported for 2006 (HELCOM, 2009b). Hence, one of the main motivations for this study was to determine whether rapid P and N cycling at the seafloor is strongly altered during MBIs. Comparison of in situ benthic flux measurements in the pre- and post-inflow phases both made in late summer revealed markedly different dynamics in the deep basin, but little change in the HTZ where most P and N regeneration takes place.
Methods
Field Campaigns
Sampling campaigns in the EGB were conducted on the RV Alkor cruise AL422 in August/September 2013, RV Poseidon cruise POS487 in July/August 2015 and RV Alkor cruise AL473 in March 2016 (Table 1; Figure 1). A previous cruise on Alkor AL355 taking place under euxinic conditions of the deep basin in May/June 2010 has been described by Noffke et al. (2016); results from that study are not re-tabulated here. In subsequent sections this cruise will be referred to as pre-inflow (early summer) cruise. Data from AL422 are representative of late summer stagnant, euxinic conditions in the deep basin at a time of cyanobacterial bloom development referred to here as pre-inflow (late summer) cruise. Data from POS487 is referred to as post-inflow (summer) cruise and were taken at the same time of year under ventilated deep basin conditions. Hence, comparison of data from these cruises should allow the effect of the MBI on sediment fluxes to be addressed directly without being too confounded by seasonality, although some degree of inter-annual variation in primary production and benthic respiration is to be expected. Data from winter 2016 [cruise AL473, referred to a post-inflow (winter) cruise] are presented here to show the evolution of benthic fluxes under prolonged ventilation, but are not the focus of the present study. This cruise took place in March 2016 and captured the moderate MBI that was triggered in November 2015.
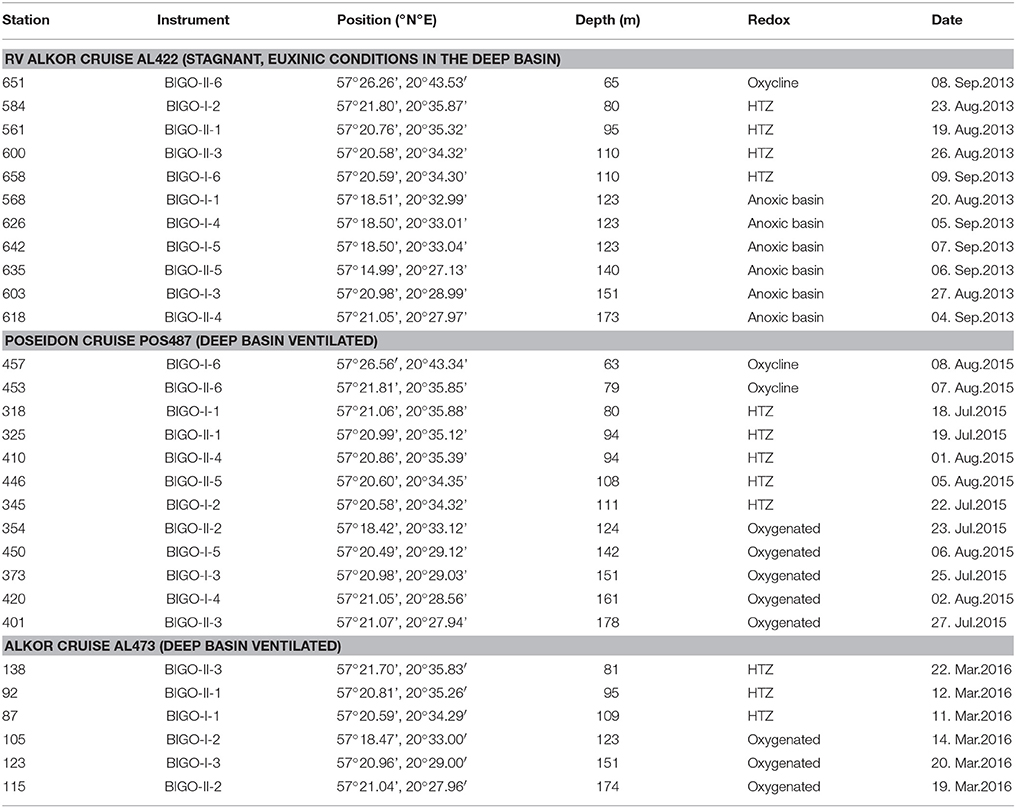
Table 1. Locations of the sites of benthic lander (BIGO) deployments in the EGB along with water depth and redox characteristics of the deep water during cruise AL422 (pre-inflow, euxinic bottom water in deep basin, late summer), cruise POS487 (post-inflow, late summer), and cruise AL473 (post-inflow, subsequent winter).
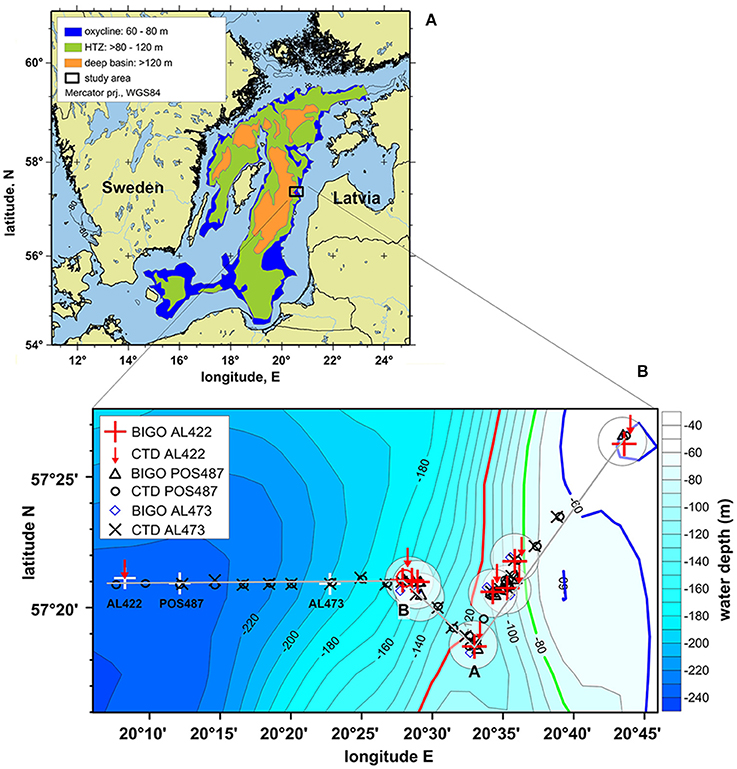
Figure 1. (A) Study location (black rectangle) in the Eastern Gotland Basin (modified after Noffke et al., 2016). To extrapolate benthic , , and fluxes for the Baltic proper excluding regions <60 m (see Section Revised budget of benthic and DIN fluxes before and after inflow events), in situ fluxes were related to three different depth zones as defined by Noffke et al. (2016); (B) detailed map of depth transect showing the lander and CTD casts for the pre-inflow (late summer) cruise AL422, post-inflow (summer) cruise POS487, and the post-inflow (winter) cruise AL473. (A,B) in this plot denote locations along the transect referred to in Figures 4, 5. White crosses denote CTD stations shown in Figure 2 (AL422 CTD 22 57°21.12′N 20.08.27′E; POS487 CTD 40 57°20.92′N 20°12.14′E; AL473 CTD 15 57°20.91′N 20°22.75′E). White circles indicate areas of lander deployments.
For this study we will adopt the definitions suggested by Noffke et al. (2016) based on water column O2 profiles in the Baltic Proper under stagnant conditions. The depth range 60–80 m was identified as the oxycline where O2 in the bottom water is mostly present although highly variable. The range > 80–120 m was characterized as the HTZ with O2 levels typically < 30 μM but which can be variable. The zone below 120 m and a well-expressed redoxcline defines the deep anoxic and sulfidic basin. During MBIs, this zone becomes oxygenated (Table 1).
Conductivity, temperature, depth (CTD) measurements were performed during casts of a Seabird CTD system equipped with a water-sampling rosette. These casts were made at water depths between 50 and 223 m along the redox depth transect shown in Table 1 and Figure 1B. Immediately after retrieval, water samples from Niskin bottles were analyzed for the nitrogen species nitrate (), nitrite (), and . Phosphate and hydrogen sulfide measurements include all dissolved species. Their ionic forms and HS− are referred to in this study.
In situ fluxes were determined at eight sites during the pre-inflow (late summer) cruise AL422 (Table 1, Figure 1) covering the entire oxic to anoxic/sulfidic gradient. Flux measurements were repeated at 110 and 123/124 m, giving a total of 11 deployments. The same sites were investigated on the post-inflow (summer) cruise POS487, with a further site at 161 m to achieve a better resolution during this ventilation period. During the post-inflow (winter) cruise AL473, in situ measurements were conducted at six sites along the transect.
Sea Floor Observation
Sea floor images were obtained using the towed camera system OFOS (Ocean Floor Observation System) equipped with a video and still camera (Nikon D70s), two Xenon lights (Oktopus) and a flashlight (Benthos). The system was towed ~1.5 m above the sea floor at ~0.3 knots. Seven OFOS deployments were conducted during the pre-inflow late summer cruise along the depth transect where in situ fluxes were determined (Figure 1B). Additionally, 11 OFOS deployments were conducted to the north and south of the depth transect to confirm presence of microbial mats in the HTZ as described by Noffke et al. (2016). During the post-inflow (summer) cruise, OFOS deployments completely surveyed the depth gradient where in situ fluxes were performed covering a distance of about 27 km of continuous video surveillance, spanning water depths from 70 to 240 m. A second depth transect was investigated to the north of the main working area covering a distance of ~18 km and a depth range of ~63–195 m (not shown). During the post-inflow (winter) cruise OFOS deployments were conducted at the depths where flux measurements were made.
In situ Flux Measurements and Sediment Sampling
In situ fluxes were determined using benthic chambers mounted in two Biogeochemical Observatories (BIGO) (Sommer et al., 2009; Pfannkuche and Linke, 2003). Each BIGO contains two chambers. The water volume enclosed by the chambers ranged from ca. 9 to 20 L and incubation times ranged from 29 to 56 h. Solute fluxes in each chamber were determined from concentrations measured in discrete water samples removed periodically with eight glass syringes (each ~46 mL). Immediately after retrieval of the observatories, the water samples were stored (max. 4 h) in the onboard cold room (about 6°C) before geochemical analyses. Furthermore, chamber water was sampled into 5 slender glass tubes (each ~15 mL) for onboard determination of DIC. TOU was determined from in situ O2 concentration measurements in the chambers using optical sensors (Aanderaa Instruments, Norway; Model 3830, Tengberg et al., 2006). Optode performance was cross-checked with O2 concentrations determined in the water samples by Winkler titration. Solute fluxes were calculated from the linear increase or decrease of concentration versus time, corrected for the surface area to volume ratio of each chamber.
The landers are also equipped to recover the upper incubated sediment layers (~10–15 cm), which serves as a check for sediment disruption during seafloor operations and chamber insertion. The sediment surface for all lander deployments during the pre-inflow (late summer) cruise was intact and undisturbed. On post-inflow cruises the sediments close to the chamber wall of BIGO-II-3 at the 178 m site and of BIGO-I-3 at 151 m were slightly disturbed. It is not known whether this was caused during insertion of the chambers into the sediment or during lander retrieval. The concentration data did not indicate any artifacts during the flux measurements, and the initial concentrations inside the chamber at the start of the incubation were close to the bottom-water concentrations. Consequently, we have no reason to disregard the fluxes determined from these deployments.
Geochemical Measurements
Concentration measurements of dissolved inorganic nitrogen (, , ), and HS− were performed on board. Nutrients (, , ) were determined on a QuAAtro autoanalyzer (Seal Analytical) using standard photometrical methods (Grasshoff et al., 1999). and HS− were measured using photometry with a Hitachi U2800 photometer. Analytical details are described by Sommer et al. (2016). fluxes were always < 10% of fluxes, and here we report fluxes as Σ + . Dissolved O2 in Niskin bottles was determined using automated Winkler titration with a detection limit of 3 μmol L−1. Concentrations below the detection limit were considered to be anoxic for purposes of defining the prevailing bottom water O2 regime.
DIC measurements were performed using a quadrupole membrane inlet mass spectrometer (MIMS, GAM200, In Process Instruments). The instrument was equipped with inline sample acidification to shift the carbonate system entirely to the volatile CO2 species, which then was measured on the MIMS at a mass to charge ratio of 44 (Bell et al., 2011). The general setup is described in detail in Noffke et al. (2016). In short, the water samples taken during the BIGO deployments were pumped using a peristaltic pump (Ismatec, REGLO Digital MS-4/6) at 1.0 mL min−1 through a membrane inlet (Sommer et al., 2015), where extraction of dissolved gases takes place. Gas flow from the inlet to the mass spectrometer was conducted in a steel capillary supported with helium that was supplied through a fused silica capillary. The distance between the inlet and the ion source of the quadrupole was about 80 cm. An in-line cryo-trap (−35°C, ethanol) between the inlet and the mass spectrometer was used to reduce water vapor. The water samples were first analyzed without acidification and recovered in Labco Exetainers capped without a headspace. Subsequently, an acidification inlet was integrated into the sample flow in front of the membrane inlet and 4 M hydrochloric acid added at a rate of 0.15 mL h−1 using a precision syringe pump (KDS-100-CE, kd Scientific) resulting in a sample-acid ratio of 402:1 transforming all DIC into CO2. The DIC measurements were calibrated with a Na2CO3 standard (Merck) that was diluted with a sodium chloride solution (10 g L−1) to standards in the range of 1.50–2.25 mM. The standards were prepared at the respective in-situ temperature and were measured before and after each measurement session.
Results
Water Column
Pre-inflow Conditions
The O2 concentrations in the pre-inflow phase (late summer) were similar to those previously described by Noffke et al. (2016) (Figure 2). Below the oxycline (70–80 m) that coincided with the pycnocline, O2 concentrations were < 30 μM down to ca. 120 m. This depth interval marks the HTZ. In the deep basin below the HTZ, O2 was undetectable. The deep basin was highly enriched in HS− (Figure 3), reaching levels of 238 μM; much higher than the maximum value of 150 μM reported for euxinic conditions in May/June 2010 (Noffke et al., 2016). HS− clearly diffuses upwards to the base of the HTZ whereupon it is oxidized. accumulated to 43 μM in the deep basin, again higher than in 2010 where concentrations reached 25 μM (Noffke et al., 2016). At the base of the HTZ, the levels were much lower and remained < 3 μM within the HTZ but were depleted toward the oxycline. showed a peak of 7 μmol L−1 at 70–80 m, but was depleted toward the surface and below ~120 m water depth. concentrations were highest in the deep basin (7 μM) and declined toward the mixed surface layer, illustrating that the deep anoxic basin is a source of to surface waters. As already shown for pre-inflow conditions in early summer 2010 (Noffke et al., 2016), displayed a pronounced gradient change at about 100 m water depth with elevated concentrations (~2.5 μM) between 60 m and 100 m, indicating an additional source in the HTZ.
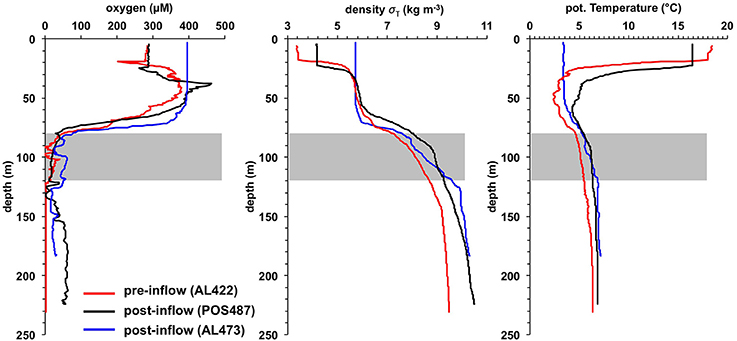
Figure 2. Water-column O2 concentration, density (σT) and potential temperature profiles for the pre- (AL422) and post-inflow conditions in summer (POS487) and winter (AL473). The gray bars indicate the HTZ. Station positions are indicated in Figure 1B.
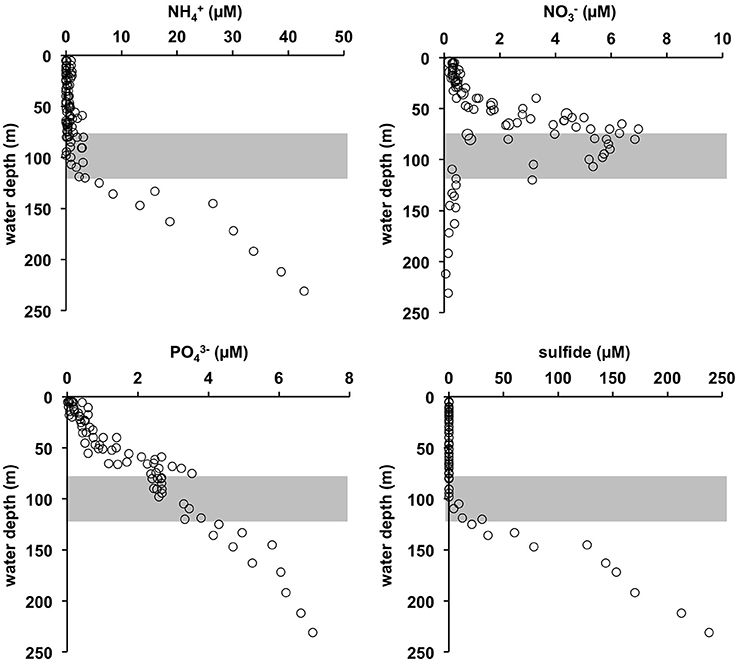
Figure 3. Water column concentration profiles of , , and sulfide compiled during several CTD casts during pre-inflow cruise AL422 (for positions see Figure 1B). The gray shaded area approximates the extent of the HTZ.
Post-inflow Conditions
The strong MBI triggered in 2014 oxygenated the deep basin, leading to dissolved O2 concentrations of up to ~70 μM at 173 m water depth (Figures 2, 4). In deeper parts of the basin the O2 levels decreased to about 40 μM. Unexpectedly, the O2 levels remained below 30 μM within the HTZ, and the 111 m site was characterized with lowest O2 concentrations. The oxycline was located at around 60–80 m water depth; similar to the pre-inflow phase. The O2 level in the surface layer was 90 μM lower than measured during pre-inflow conditions (early summer) (Noffke et al., 2016) yet similar to the level measured during pre-inflow conditions (late summer) indicating a seasonal effect of O2 consumption and temperature effects on O2 solubility. HS− was not detectable in the post-inflow water column.
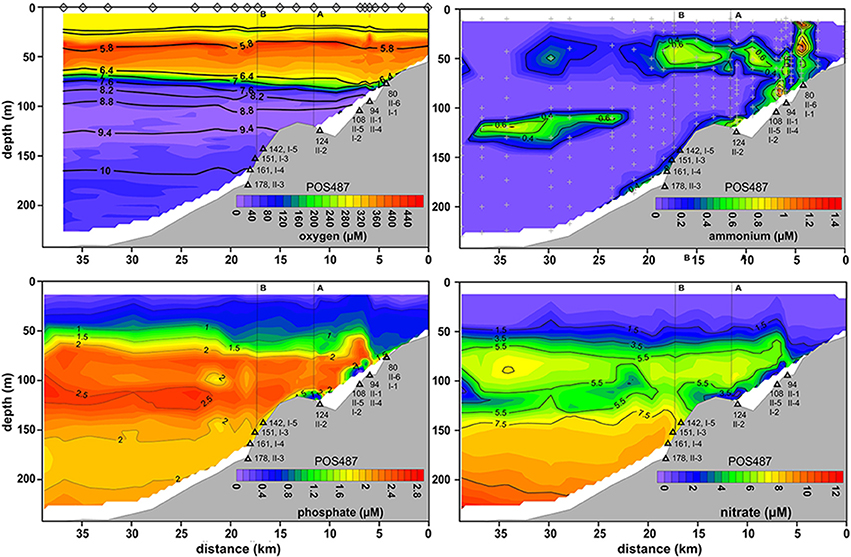
Figure 4. Distributions of O2, , , and across the depth transect reconstructed from CTD casts taken during post-inflow conditions in summer 2015 (POS487). Black contours superimposed on the O2 plot indicate density, σT. The positions of the CTD casts to construct the O2 plot are indicated by diamonds. CTD casts for nutrient distribution are shown by gray crosses in the plot. Deployment sites of the benthic landers are depicted as black triangles along with water depth and instrument deployment number (Table 1). (A,B) on the top of each plot denote the locations provided in Figure 1B.
The MBI caused a massive perturbation to nutrient distributions. , which serves as an important electron acceptor during anaerobic respiration, increased with water depth from the base of the HTZ to 12 μM in the deep basin (Figure 4). As for O2, the 110–120 m site appeared to be the station with the lowest availability of electron acceptors with a marked minimum. Above this depth in the HTZ, reached maximum levels of about 7 μM; the same as measured during euxinic conditions (pre-inflow early and late summer; Noffke et al., 2016 and this study).
did not accumulate in the deep basin post-inflow and remained below 1 μM (Figure 4). Only at the benthic boundary were levels slightly increased. However, increased concentrations were measured in a distinct layer in the water column at about 125 m water depth at the lower edge of the HTZ. Similarly, concentrations in the deep basin were ca. three-fold lower compared to those measured during euxinic conditions. Again, within the HTZ, concentrations were similar to those measured during euxinic conditions (~2.4 μM).
As a result of the moderate MBI that was triggered in November 2015, oxygenated water masses were detected in the deep basin although with lower O2 levels compared to the post-inflow (summer) cruise (Figures 2, 5). The surface layer was well mixed with a steep oxycline between 70 and 80 m resulting in an enhanced O2 penetration compared to the pre-inflow (summer) and post-inflow (summer) situation. As during all previous cruises, the HTZ was retained yet with slightly elevated O2 levels. Deep-water renewal maintained elevated levels of , whereas accumulation of and or HS− was impeded.
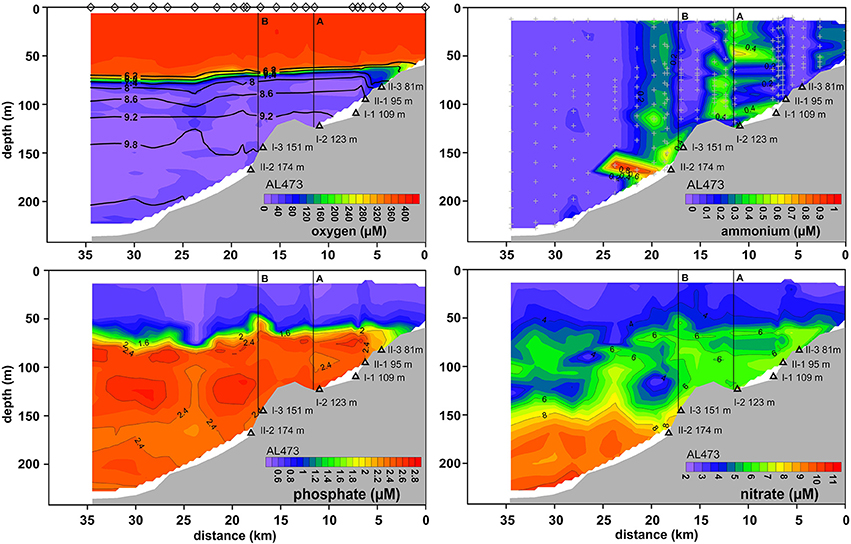
Figure 5. Distributions of O2, , , and across the depth transect reconstructed from CTD casts taken during post-inflow conditions in winter 2016 (AL473). For further information, see Figure 4 caption.
Seafloor Observations
Seafloor imaging during all cruises showed that the sediment surface in the HTZ was densely covered with white filamentous microbial mats, tentatively identified as belonging to the family Beggiatoaceae. Also the stations to the south and north of the main working area showed occurrences of microbial mats confirming earlier observations made during cruises R/V Poseidon (POS369 July–Aug. 2008), R/V Alkor (AL346 Sept.–Oct. 2009) as well as R/V Alkor cruise AL355 (Noffke et al., 2016). Notably, under euxinic conditions only sporadic occurrence of microbial mats was observed below 120 m water depth and they became absent with increasing depth. In contrast, during ventilated conditions the microbial mats extended down to water depths of 240 m and extensively covered the sediment surface. Mats were dominated by different size-classes of filaments, with smaller filaments of 4–5 μm in diameter being more abundant at oxic stations and larger filaments with diameters of 22–32 μm dominating at stations where bottom water O2 concentrations approached zero.
In situ Fluxes
Pre-inflow Conditions
fluxes showed a distinct maximum of ca. 1.5 mmol m−2 d−1 in the HTZ between 100 and 120 m (Table 2; Figure 6), with a second maximum of 1.1 mmol m−2 d−1 in the deep basin (173 m). was taken up by the sediment at all sites in the oxycline and HTZ with a maximum of −0.72 mmol m−2 d−1 at 96 m and 110 m in the HTZ. fluxes were zero at the deep sulfidic stations due to the absence of in the bottom water. Overall, the sediments were a source of DIN with elevated release at the oxycline, inside the HTZ, and at the transition between the HTZ and the deep basin (124 m) (Table 2). As for , pre-inflow fluxes were directed out of the sediment and elevated inside the HTZ (0.25 mmol m−2 d−1). Fluxes decreased at the lower boundary of the HTZ but increased again in the deep basin to 0.21 mmol m−2 d−1. Below the HTZ, HS− fluxes increased and reached a maximum value of 10.2 mmol m−2 d−1 at 173 m (Table 2). In general, the above trends are within the uncertainty of the flux measurements made during the pre-inflow (summer) cruise in 2010 by Noffke et al. (2016). The exception is the 80 m site where fluxes were lower in that study and directed into the sediment. DIC fluxes decreased from the oxycline (10.3 mmol m−2 d−1) to a minimum at 140 m (3.4 mmol m−2 d−1) coinciding with a minimum of and fluxes. TOU of up to 14.6 mmol m−2 d−1 was only measurable at the oxycline station and at the upper boundary of the HTZ (0.44 mmol m−2 d−1) (Table 2).
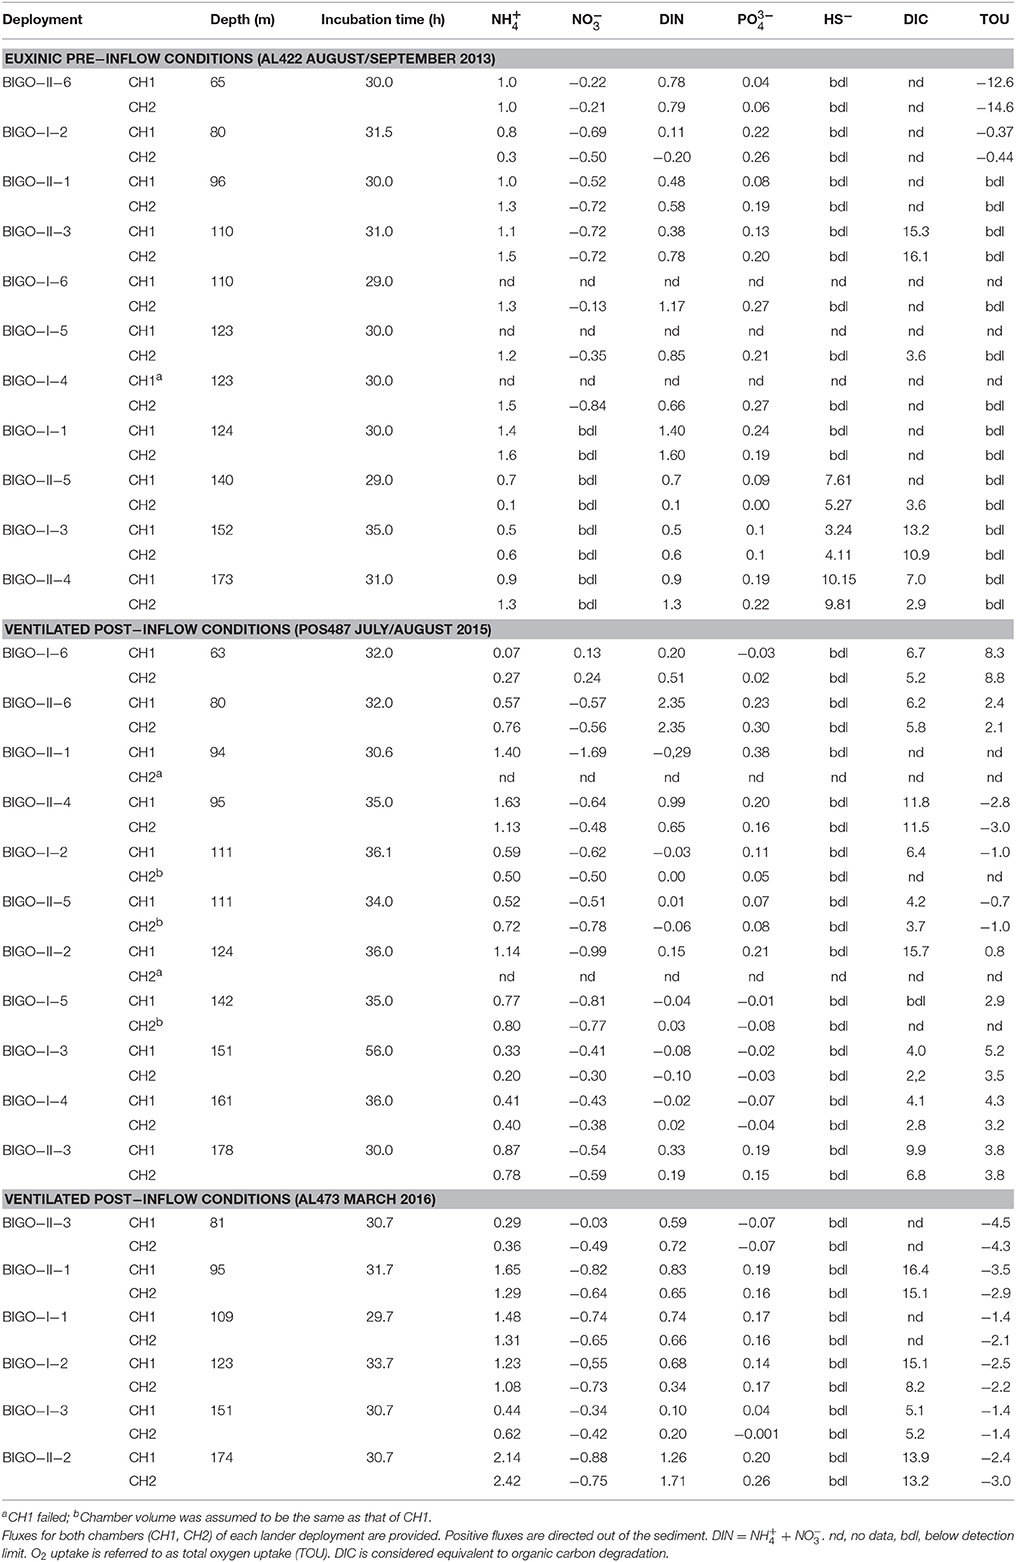
Table 2. Benthic fluxes in the EGB measured using benthic landers (mmol m−2 d−1).
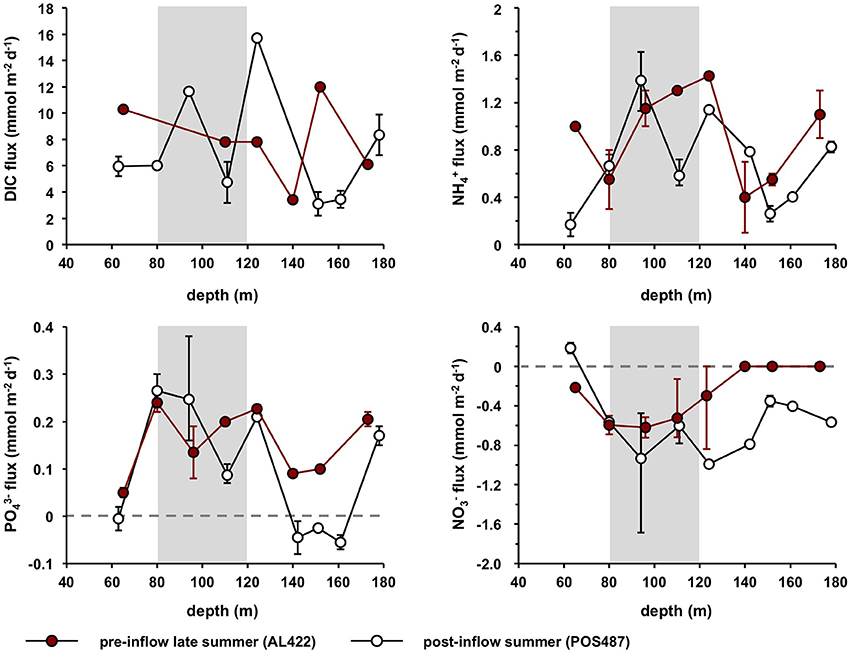
Figure 6. Average benthic fluxes of DIC, , , and for pre- (AL422) and post inflow conditions (POS487) during summer. Fluxes measured during post-inflow conditions in winter (AL473) are provided in Table 2. Positive fluxes are directed out of the sediment and vice versa. Error bars indicate minimum and maximum values of the flux measurements from the different chambers (Table 2). The horizontal dashed line denotes zero flux and the gray shaded area approximates the extent of the HTZ.
Post-inflow Conditions
During both post-inflow cruises, ventilation resulted in elevated TOU rates in the deep basin ranging from 0.8 to 5.2 mmol m−2 d−1 (post-inflow, summer) and from 1.4 to 3.0 mmol m−2 d−1 (post-inflow, winter) (Table 2). Within the HTZ, TOU was now higher at the 80 m site with rates of 2.4 and 4.5 mmol m−2 d−1 during cruises POS487 (summer) and AL473 (winter), respectively. During both post-inflow cruises, DIC fluxes were elevated at the deepest station with maximum rates of 9.9 and 13.9 mmol m−2 d−1 as well as at the upper boundary of the deep basin at 123 m water depth (15.7 and 15.1 mmol m−2 d−1) (Figure 6, Table 2).
Despite oxygenated bottom waters, the depth distribution of fluxes during the post-inflow (summer) cruise was similar as described above for the pre-inflow situation (Figure 6, Table 2). Maximum average release was 1.4 mmol m−2 d−1 at 96 m inside the HTZ with a second pronounced peak of 0.8 mmol m−2 d−1 at the deepest station. Fluxes at 110 m were lower than measured previously (0.6 mmol m−2 d−1) but had increased again to high values (1.4 mmol m−2 d−1) in the following winter (cruise AL473, Table 2). In contrast to the late summer pre-inflow scenario, was slightly released at the oxycline with an average rate of 0.2 mmol m−2 d−1. Due to the presence of in the bottom water, was taken up by sediments between 80 and 173 m at average rates between −0.4 mmol m−2 d−1 at 151 m and −1.0 mmol m−2 d−1 at 124 m. During winter (AL473), was taken up at all sites at rates similar to the summer post-inflow condition (Table 2). fluxes in the HTZ measured during pre-and post-inflow summer were similar, with elevated release rates in the range of 0.09–0.27 mmol m−2 d−1 (Figure 6). However, during summer post-inflow conditions, was taken up by the sediments at the oxycline (65 m) and at the now oxic deep-water stations (142, 151, and 161 m) with a maximum uptake rate of 0.06 mmol m−2 d−1. was still being released to bottom waters at the deepest site at 0.17 mmol m−2 d−1 despite ventilated bottom water conditions. In the following winter, was released from all sites at rates similar to the pre-inflow conditions except for the 80 m site (Table 2). Benthic HS− release was apparently efficiently diminished to below detection limit under oxic conditions.
Discussion
The objective of this study is to first identify changes in benthic nutrient fluxes in response to two MBIs. These inflows led to increased availability of O2 and in the deep basin, and lowered and (this study, Mohrholz et al., 2015; Nausch et al., 2016). Benthic fluxes can then be extrapolated for the Baltic Proper in order to assess MBIs with regard to their potential to mitigate eutrophication in this area.
Differential Response to Ventilation in Deep Basin and HTZ
As known from previous MBIs in 1993 and 2003 (e.g., Nausch and Nehring, 1994), the ventilation in 2015/2016 profoundly changed the redox landscape of the water column below ca. 125 m. Deep-water renewal resulted in similar low and concentrations to those observed after the inflow event in 1993 (Nausch and Nehring, 1994) as well as elevated . The water column HS− inventory was completely oxidized and not detectable, in stark contrast to euxinic conditions (240 μM, this study). This entails very efficient HS− oxidation mechanisms in the water column as well as at the sediment surface. Oxidation of reduced compounds likely becomes enhanced in the water column following ventilation due to bottom boundary mixing. Furthermore, during propagation of dense bottom currents, entrainment of less saline water also leads to interleaving of incoming oxygenated water masses with the ambient water mass at the level of neutral buoyancy and concomitant ventilation at different depths (Reissmann et al., 2009, cf. their Figure 2). In the sediments, sulfate reduction below the oxic sediment surface still produces high amounts of HS− whose oxidation represents a strong sink for O2. Mohrholz et al. (2015) estimate that the total amount of O2 transported into the Baltic Sea during 2015 amounts to ~2.04 × 10⁶ t. Given a benthic HS− flux of 6.7 mmol m−2 d−1 during pre-inflow (Table 2), and a deep basin area of ~19,000 km2 (Table 3), one can estimate that the sediments alone could consume this flux within 8 months. This is a maximum lifetime of O2 in the basin with respect to benthic respiration in the deep basin since the O2 inventory in the Gotland Basin will be lower than the total inflow into the Baltic (Schmidt, 2014) and a fraction of O2 will be consumed by respiration of reduced dissolved and particulate compounds in the water column. Indeed, a fast decrease of O2 levels was recorded in September and December 2015 during time-series observations conducted at 2 and 20 m above the seafloor, respectively (Mohrholz et al., 2016). This calculation, whilst necessarily first-order, nonetheless emphasizes that HS− oxidation at the sediment water interface strongly contributes to the rapid depletion in O2 following deep basin ventilation.
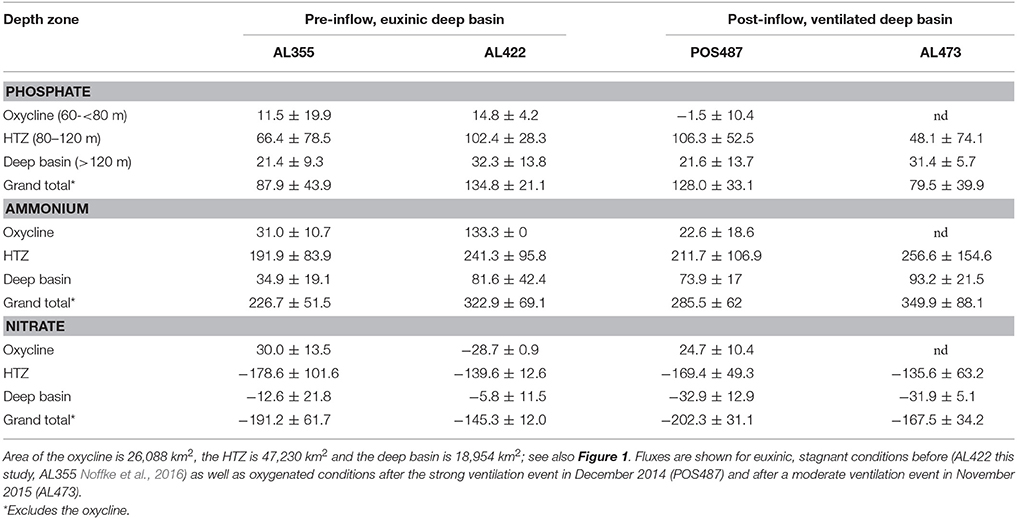
Table 3. Regionalization of P and N fluxes (ktons year−1) based on average local , , and fluxes measured in the different depth zones in the Baltic Proper.
In contrast to elevated P release under euxinic bottom water conditions (this study; Jilbert et al., 2011; Viktorsson et al., 2013a; Noffke et al., 2016; and references therein), was taken up by the sediment at the sites at 142–161 m water depth under ventilated conditions during July/August 2015. A significant removal pathway for phosphorus occurs by way of its adsorption onto iron oxides while pH < 9 (Berner, 1973; Van Cappellen and Ingall, 1996), and reactive iron might become increasingly available in surface sediments under oxic conditions. Remarkably, though, despite oxic conditions during both inflow cruises POS487 (summer) and AL473 (winter) at the deepest sites, average release (0.17 and 0.23 mmol m−2 d−1 respectively) was similar to respective fluxes during euxinic conditions in July/August (0.21 mmol m−2 d−1, this study) or even higher compared to May/June (0.15 mmol m−2 d−1, Noffke et al., 2016). This might be related to the time course of the inflow spreading into the Gotland Basin. O2-rich intrusions of North Sea waters propagate as dense bottom currents, such that the deepest sites were likely ventilated first followed by ventilation of the shallower sites sometime later as the deep water is progressively replaced. Hence, reactive iron for P sequestration might already have become limited at the deeper sites since organic P degradation rates are relatively elevated here resulting in a low P retention capacity of the sediments (Noffke et al., 2016). During both post-inflow cruises, release from the deepest station resulted in the gradual accumulation of in the water column as observed in the deepest part of the EGB (compare Figures 4, 5).
At the upper boundary of the deep basin at 124 m water depth, the release during both post inflow cruises in summer and winter was as high or almost as high as under pre-inflow euxinia. An O2 time series recorded at this site over the entire cruise POS487 revealed strong bottom water O2 fluctuations between 0 and 15 μM and extended periods of O2 levels < 5 μM (not shown). The O2 profiles and distributions (Figures 2, 4) suggest that the bottom water at this site has the lowest availability of electron acceptors following ventilation. Hence, this site can be considered as strongly hypoxic, thereby providing a partial explanation for the ongoing high release rates. These O2 fluctuations are likely caused by internal waves and seiches (Reissmann et al., 2009), which drive water mass movement across the 124 m site resulting in the periodic entrainment of colder anoxic water from above (HTZ) as well as warmer North Sea water rich in O2 and from below.
Seafloor imaging revealed that sulfur bacteria belonging to the family Beggiatoacea extensively colonized the sediment surface even down to the deepest part of the EGB. So far these organisms were only observed in water depths of about 70–120 m where electron acceptors are at least temporarily available (Noffke et al., 2016; Sommer et al., unpublished results). These chemotrophic organisms gain their energy from HS− oxidation using O2 as terminal electron acceptor (e.g., Teske and Nelson, 2006). However, some members of the Beggiatoaceae have the capacity to switch to a based HS− oxidation, releasing to the environment as a metabolic waste product (reviewed by Jørgensen and Nelson, 2004). In contrast to denitrification and anammox, this process known as dissimilatory nitrate reduction to ammonium (DNRA) retains DIN in the ecosystem and has been argued to be an important benthic process under low O2 conditions in the HTZ (Noffke et al., 2016). It has also been reported for sediments from Eckernförde Bay (Dale et al., 2011, 2013), the northern Baltic Proper, and the coastal Gulf of Finland (Kuparinen and Tuominen, 2001; Hietanen and Lukkari, 2007; Jäntti et al., 2011; Jäntti and Hietanen, 2012). When all the data is considered collectively, release rates under ventilated conditions were similar to those measured during euxinic conditions and thus apparently not greatly enhanced by DNRA. The release rates measured during post inflow conditions are consistently below the expected based on Redfield organic matter degradation (Figure 7A). However, it is possible that a fraction of produced by DNRA may be consumed by close coupling with nitrifying bacteria in adjacent sediment layers, thereby explaining the low N:C ratio of the fluxes. Only a few sites, including those from our previous study in 2010 (Noffke et al., 2016), hint toward an excess of release from the sediment, and thus an excess of DNRA over nitrification. It is important to note that during the post-inflow cruise in March (AL473), larger filaments of Beggiatoaceae with internal concentrations of 2.5 ± 1.8 mM dominated within the HTZ at 100 and 110 m water depth as well as at the upper boundary of the deep basin (124 m) (Schulz-Vogt, unpublished). This strongly indicates the potential capacity for DNRA in this region. Due to higher concentrations of O2 in the deep basin, aerobic respiration by HS− oxidizing bacteria may have been energetically more preferable than anaerobic, respiration.
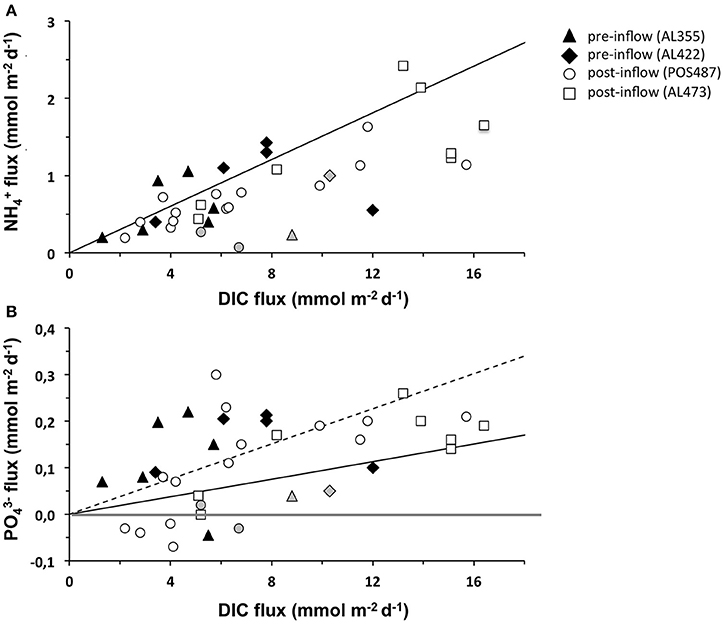
Figure 7. Compilation of (A) and fluxes (B) vs. DIC flux measured for the pre-inflow (AL422, summer 2013) and post-inflow conditions in summer 2015 (POS487) and winter 2016 (AL473). The gray markers indicate fluxes measured in the oxycline environment during pre- and post-inflow conditions. The compilation also includes data for cruise AL355 (pre-inflow conditions early summer 2010, Noffke et al., 2016). Expected release of and according to Redfield mineralization of organic matter is indicated by the solid black line. The dashed line indicates twice higher preferential release over DIC. The gray horizontal differentiates between positive (release) and negative (uptake) fluxes.
Filamentous HS− oxidizing microbes may also play an important role in benthic P cycling. They are able to perform luxury uptake of from the porewater and bottom water under oxic conditions that is subsequently stored as polyphosphates in their vacuoles (Brock and Schulz-Vogt, 2011). During anoxic conditions, these organisms degrade the polyphosphates and release the stored back into the porewater. Evidence for this metabolic mechanism has been provided for the genera Thiomargarita spp. and Beggiatoa spp. in sediments from the Namibian upwelling system (Schulz and Schulz, 2005; Goldhammer et al., 2010; Winkel et al., 2016). Breakdown of polyphosphates may account for the fact that sediments in the deep basin again acted as a source in March 2016 where O2 in the bottom water had decreased to < 40 μM. Interestingly, though, during March 2016 filaments of Beggiatoaceae were void of polyphosphates, whereas smaller granules of polyphosphates were abundantly observed in the surface sediment (Schulz-Vogt, unpublished). The source of these particles remains an open question, and could conceivably be attributed to authigenic formation at the former pelagic oxycline, dead phytoplankton, or polyphosphate accumulated by smaller benthic bacteria (Diaz et al., 2008, 2012). The absence of polyphosphate in the filamentous Beggiatoacea is an additional indication that polyphosphate accumulation is not a trait shared by all Beggiatoaceae under all environmental conditions. Members of the genus Marithioploca, (former Thioploca) prevailing in sediments off the Chilean coast were also reported not to contain visible polyphosphate granules (Høgslund et al., 2009).
A plot of the vs. DIC flux from all cruises demonstrates that the sediments in the EGB behave in a highly non-Redfield manner (Figure 7B). Most sites with a positive flux lie far above the expected Redfield ratio (solid black curve). Even accounting for preferential remineralization of organic P relative to C by a factor of two (Dale et al., 2016), additional P sources are needed to explain the data distribution (dashed black curve). Off Peru, Lomnitz et al. (2016) observed a clear correlation between flux and cell number of the filamentous bacterium Marithioploca. In principal, as described above, transient P storage and release from bacterial mats of Beggiatoaceae spp. that almost completely cover the sediment surface in the HTZ could conceivably contribute to the measured P fluxes if they had accumulated polyphosphate during conditions prior to March 2016. As mentioned, smaller less conspicuous sediment bacteria may instead be responsible for polyphosphate mediated P cycling. In addition, iron-bound P dissolution could be significant and deserves greater attention to constrain potential fluxes from this source (e.g., Jilbert et al., 2011). Clearly, future work must now focus on process-based studies to fully address the factors leading to the highly dynamic nature of N and P fluxes in the EGB.
The O2 depth profiles obtained during post inflow summer conditions indicate that the MBI only affected water masses deeper than ~120 m. Above this, the O2 levels were close to zero and reached ~30 μM at 80 m at the base of the oxycline. During winter inflow the O2 profile shows a similar trend, yet with slightly higher O2 levels in the HTZ. An identical O2 distribution has been previously described during euxinia and, along with the distribution of microbial mats, was used as a major criterion to define the HTZ (Noffke et al., 2016). Further similar observations (e.g., Schmale et al., 2016), coupled with the observation that the sediments were also densely covered with mats of sulfur bacteria, imply that the HTZ can be considered as a typical and persistent feature of this water depth range. Pre- and post-inflow solute fluxes in the HTZ were variable but generally indistinguishable. These findings have important implications because the HTZ has been recognized to be a major region strongly contributing to the internal loading of and (Noffke et al., 2016).
Revised Budget of Benthic and DIN Fluxes before and after Inflow Events
The above discussion has demonstrated that the deep basin and HTZ behaved differently during the most recent MBI events. In order to assess the importance of the expected basin wide reduction of nutrient release during ventilation, we approximated the entire benthic nutrient load for the Baltic Proper before and after ventilation (Table 3) using the approach put forward by Noffke et al. (2016). Here, the Arkona Basin has been excluded from the analysis since this is a seasonally hypoxic setting and the presence of more extensive mats of filamentous sulfur oxidizing bacteria there is in doubt. The Baltic Proper was divided into three depth zones according to the vertical distribution of O2 in the water column during pre-inflow conditions (Figure 1A, Table 1). To arrive at regional nutrient fluxes, the areas of each depth zone were multiplied with the respective averages of the benthic , , and ( + ) fluxes measured in each depth zone. Our flux measurements were only conducted in water depths below 60 m, which approximately separates deeper muddy from sandy sediments in the Baltic Proper (www.helcom.fi/baltic-sea-trends/data-maps).
For ease of comparison with other published rates (e.g., Viktorsson et al., 2013a; Noffke et al., 2016) the fluxes are reported on a yearly basis. However, the ventilation events are transient and the strong MBI triggered in December 2014 only lasted from March to September 2015 when O2 was already consumed 2 m above the seafloor (Mohrholz et al., 2016). The second moderate ventilation event captured during AL473 only lasted for about 3 months (Mohrholz et al., 2016). Hence, we made the assumption that the fluxes we measured in the deep basin in response to the deep-water renewal prevailed only for 6 and 3 months respectively. For the remaining time of the year we assumed fluxes as measured during pre-inflow conditions. This neglects the dynamics of the inflowing water that progressively replaces the anoxic and sulfidic deep water before the shallower sites of the eastern flank of the basin. It also neglects the time needed for the microbiological community to become established in response to oxygenation, although observations of rapid establishment of Beggiatoaceae in response to anoxia in Eckernförde Bay implies colonization times of < 1 month (Dale et al., 2013).
Ventilation during the MBI from December 2014 (post-inflow summer cruise POS487) reduces the yearly release from the deep basin sediments by about 33 and about 10% for (Table 3, Figure 8). In parallel to the flux study during cruise POS487, benthic P fluxes were measured in the ventilated deep basin at 170 and 210 m water depth in July 2015 on the Swedish site of the EGB (Hall et al., 2017). Basin-wide P release extrapolated for the deep basin was 17.4 ktons year−1 compared to 50.3 ktons year−1, which was measured by these authors during euxinic conditions corresponding to a reduction of 65%. During the moderate inflow event from November 2015 (post-inflow winter cruise AL473) there was only a 3% reduction of the release compared to flux measurements made during euxinic conditions (pre-inflow summer cruise AL422). In contrast, release was even higher compared to all previous cruises.
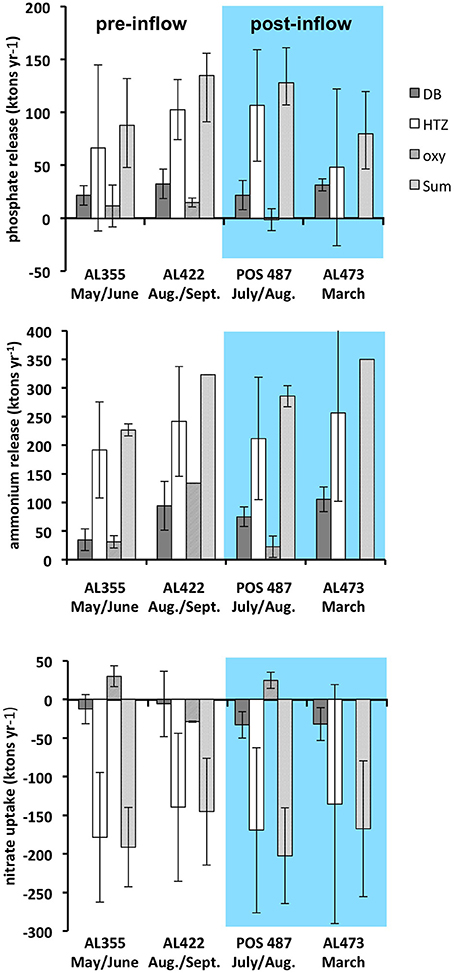
Figure 8. Yearly integrated , , and fluxes extrapolated for the deep basin (DB), the HTZ, and the oxycline environment (oxy) as well as the total of DB and HTZ environments for pre- and post-inflow conditions. The sites from oxycline were excluded from the total since nutrient release there is apparently highly variable there based on data from one site only. Fluxes based on data from cruise AL355 are also indicated (Noffke et al., 2016).
Importantly, since the fluxes in the HTZ were apparently not greatly affected by the inflows, the HTZ remained a major nutrient release site. With the exception of data from the pre-inflow early summer cruise AL355 (Noffke et al., 2016), differences between pre- and post-inflow conditions are indistinguishable from the range of variability measured in individual chambers. A major source of variability of the fluxes within the HTZ is contributed by the 80 m site located just beneath the oxycline. As already shown (Noffke et al., 2016, cf. their Figure 3), O2 levels are highly variable there and range between close to zero and 160 μM, which affects mobilization of as well as N cycling. Despite the reduction of the seabed nutrient release from deep basin sediments, the overall, basin-wide, reduction in nutrient release for the strong MBI (post-inflow summer cruise) only amounts to 5 and 12% for and respectively. For the moderate MBI (post-inflow winter cruise), there was no reduction with regard to , yet there was an overall reduction of the release by 42%, which was caused by a drop of release within the HTZ and thus not greatly affected by the inflow. This implies that changes in benthic fluxes induced by the inflow may simply lie within the natural spatial and temporal variability exhibited by the basin sediments. We excluded the sites from oxycline and shallower waters from our analysis since nutrient release there is highly variable based only on one site.
The analysis shows that seabed nutrient release in the basin is controlled by processes in the HTZ rather than the deep basin as previously assumed. Even the largest MBI recorded from December 1951 (225 km3), which compares to 198 km3 of the MBI in 2014, would be very likely insufficient to ventilate the HTZ and suppress seafloor nutrient release. Despite the uncertainties involved, this simple extrapolation highlights that the effect of deep basin ventilation on the reduction of benthic nutrient release can be considered as minor in the context of the entire nutrient budget. It should be noted that the above extrapolation was conducted under the assumption that the HTZ is present throughout the Baltic Proper (Figure 1). During the MBI triggered in December 2014, an O2 deficient zone was also retained at the Swedish side of EGB with a still-elevated average P release rate of 0.34 mmol m−2 d−1 (Hall et al., 2017). Up-scaling of this P flux yields a P-load of 94 ktons year−1, which is very similar to that estimated for the HTZ during euxinia as well as during post inflow conditions presented in this study.
Conclusions
The intrusion of O2 and rich North Sea water into the EGB during a major Baltic inflow event in 2014 led to an approximate 33 and 10% reduction of the seabed and release from deep basin sediments (>120 m water depth) compared to euxinic, stagnant conditions that prevailed for the previous decade. Post-inflow, the deep basin, was colonized by vacuolated HS− oxidizing bacteria tentatively assigned to the family Beggiatoaceae. HS− oxidation was highly efficient and seabed HS− release was completely suppressed. O2 consumption during HS− oxidation in the water column and the sediment-water interface was rapid and must have contributed to the short duration of ventilated conditions that only lasted a few months.
The presence of the HTZ, which has been identified recently as a second major zone for rapid nutrient recycling and nutrient release (Noffke et al., 2016), was confirmed for euxinic deep water conditions as well as for post inflow conditions. Detection of deep-water renewal and associated bottom water ventilation at this particular depth zone where seabed release of and was ongoing at high rates was not overly apparent. Extrapolation of the in situ nutrient fluxes of the deep basin and the HTZ for the Baltic Proper (excluding the Arkona basin and sediments in water depth < 60 m) indicated that the reduction in and release in response to strong deep-water renewal can be considered as minor, reducing the internal and load by 5 and 12%, respectively. Despite that the presence of the HTZ has not been confirmed throughout the Baltic Proper, an O2 deficient zone similar to the HTZ was retained at the Swedish side of the EGB after the strong MBI with similar consequences for the nutrient release.
Ventilation events suppress HS− toxification and nutrient release only for short time periods of several months. If the inflow events occur as infrequently in the future as during the past decade they have only limited impact to sustainably reduce internal nutrient loading in the EGB. In the long-term, eutrophication will not be diminished by these events because recycling of P (and N) between the water column and surface sediments is relatively rapid compared to slower sequestration of P by burial in the sediments.
Author Contributions
SS, OP, and AD designed the study, coordinated ship operations, lander deployments, sediment sampling, and the data selection process; SS, DC, MY, HS, and AD took and processed samples; All authors contributed ideas and wrote the manuscript.
Conflict of Interest Statement
The authors declare that the research was conducted in the absence of any commercial or financial relationships that could be construed as a potential conflict of interest.
Acknowledgments
We very much thank Captain J. Lass and officers and crew of RV Alkor, Captain K. Ricke, and officers and crew of RV Poseidon for their excellent support during cruises AL422, AL473, and POS487. Many thanks are due to A. Beck, T. Berghäuser, J. Braasch, E. Fabrizius, S. Cherednichenko, S. Kriwanek, N. Meides, A. Petersen, M. Steffen, A. Stephan, M. Türk, and K. Stolpovsky for technical support deploying the benthic landers, the Ocean Floor Observation System (OFOS), the CTD water sampling rosette and for taking care of water and sediment samples retrieved by the landers. We thank A. Bleyer, B. Domeyer, C. Laudan, K. Qelaj, G. Schüßler, R. Surberg, V. Thoenissen, S. Trinkler, and J. Wemhöner for the excellent biogeochemical analyses onboard and in the home laboratory. We are grateful for the support of J. Wölfel and L. Bryant at sea. The Technology and Logistics Centre at GEOMAR and C. Utecht are acknowledged for logistical support. We are grateful for the very helpful and constructive reviews of two reviewers. Funding was provided by the Helmholtz Alliance “ROBEX-Robotic Exploration of Extreme Environments” and the Sonderforschungsbereich 754 “Climate-Biogeochemistry Interactions in the Tropical Ocean” supported by the Deutsche Forschungsgemeinschaft. This work was further supported financially by the Swedish Research Council (VR).
References
Almroth-Rosell, E., Eilola, K., Kuznetsov, I., Hall, P. O. J., and Meier, H. E. M. (2015). A new approach to model oxygen dependent benthic phosphate fluxes in the Baltic Sea. J. Mar. Sys. 144, 127–141. doi: 10.1016/j.jmarsys.2014.11.007
Bell, R. J., Short, R. T., and Byrne, R. H. (2011). In situ determination of total dissolved inorganic carbon by underwater membrane introduction mass spectrometry. Limnol. Oceanogr. Methods 9, 164–175. doi: 10.4319/lom.2011.9.164
Berner, R. A. (1973). Phosphate removal from sea water by adsorption on volcanogenic ferric oxides. Earth Planet. Sci. Lett. 18, 77–86. doi: 10.1016/0012-821X(73)90037-X
Brabandere, L., De Bonaglia, S., Kononets, M. Y., Viktorsson, L., Stigebrandt, A., Thamdrup, B., et al. (2015). Oxygenation of an anoxic fjord basin strongly stimulates benthic denitrification and DNRA. Biogeochemistry 126, 131–152. doi: 10.1007/s10533-015-0148-6
Brock, J., and Schulz-Vogt, H. (2011). Sulfide induces phosphate release from polyphosphate in cultures of a marine Beggiatoa strain. ISME J. 5, 497–506. doi: 10.1038/ismej.2010.135
Conley, D. J., Björck, S., Bonsdorff, E., Carstensen, J., Destouni, G., Gustafsson, B. G., et al. (2009). Hypoxia related processes in the Baltic Sea. Environ. Sci. Technol. 43, 3412–3420. doi: 10.1021/es802762a
Conley, D. J., Humborg, C., Rahm, L., Savchuk, O. P., and Wulff, F. (2002). Hypoxia in the Baltic Sea and basin-scale changes in phosphorus biogeochemistry. Environ. Sci. Technol. 36, 5315–5320. doi: 10.1021/es025763w
Dale, A. W., Bertics, V., Treude, T., Sommer, S., and Wallmann, K. (2013). Modeling benthic-pelagic nutrient exchange processes and porewater distributions in a seasonally hypoxic sediment: evidence for massive phosphate release by Beggiatoa? Biogeosciences 10, 629–651. doi: 10.5194/bg-10-629-2013
Dale, A. W., Boyle, R. A., Lenton, T. M., Ingall, E. D., and Wallmann, K. (2016). A model for microbial phosphorus cycling in bioturbated marine sediments : significance for phosphorus burial in the early Paleozoic. Geochim. Cosmochim. Acta 189, 251–268. doi: 10.1016/j.gca.2016.05.046
Dale, A. W., Sommer, S., Bohlen, L., Treude, T., Bertics, V. J., Bange, H. W., et al. (2011). Rates and regulation of nitrogen cycling in seasonally hypoxic sediments during winter (Boknis Eck, SW Baltic Sea): sensitivity to environmental variables. Est. Coast. Shelf Sci. 95, 14–28. doi: 10.1016/j.ecss.2011.05.016
Diaz, J., Ingall, E., Benitez-Nelson, C., Paterson, D., de Jonge, M. D., McNulty, I., et al. (2008). Marine polyphosphate: a key player in geologic phosphorus sequestration. Science 320, 652–655. doi: 10.1126/science.1151751
Diaz, J. M., Ingall, E. D., Snow, S. D., Benitez-Nelson, C. R., Taillefert, M., and Brandes, J. A. (2012). Potential role of inorganic polyphosphate in the cycling of phosphorus within the hypoxic water column of Effingham Inlet, British Columbia. Global Biogeochem. Cycles 26, 1–13. doi: 10.1029/2011GB004226
Goldhammer, T., Brüchert, V., Ferdelman, T. G., and Zabel, M. (2010). Microbial sequestration of phosphorus in anoxic upwelling sediments. Nat. Geosci. 3, 557–561. doi: 10.1038/ngeo913
Grasshoff, K., Erhardt, M., and Kremling, K. (1999). Methods of Seawater Analysis, 3rd Edn. Weinheim; New York, NY; Chester; Brisbane, QLD; Singapore; Toronto, ON: Wiley-VCH.
Hall, P. O., Almroth Rosell, E., Bonaglia, S., Dale, A. W., Hyl9n, A., Kononets, M., et al. (2017). Influence of natural oxygenation of Baltic proper deep water on benthic recycling and removal of phosphorus, nitrogen, silicon and carbon. Front. Mar. Sci. 4:27. doi: 10.3389/fmars.2017.00027
HELCOM (2009a). “Eutrophication in the Baltic Sea — an integrated thematic assessment of the effects of nutrient enrichment in the Baltic Sea region: Executive summary,” in Baltic Sea Environment Proceedings (Helsinki: Helsinki Commission).
HELCOM (2009b). “Eutrophication in the Baltic Sea — an integrated thematic assessment of the effects of nutrient enrichment and eutrophication in the Baltic Sea region,” in Baltic Sea Environment Proceedings (Helsinki: Helsinki Commission).
Hietanen, S., and Lukkari, K. (2007). Effects of short-term anoxia on benthic denitrifcation, nutrient fluxes and phosphorus forms in coastal Baltic sediment. Aquat. Microb. Ecol. 49, 293–302. doi: 10.3354/ame01146
Høgslund, S., Revsbech, N. P., Kuenen, J. G., Jørgensen, B. B., Gallardo, V. A., van de Vossenberg, J., et al. (2009). Physiology and behaviour of marine Thioploca. ISME J. 3, 647–657. doi: 10.1038/ismej.2009.17
Jäntti, H., and Hietanen, S. (2012). The effects of hypoxia on sediment nitrogen cycling in the Baltic Sea. Ambio 41, 161–169. doi: 10.1007/s13280-011-0233-6
Jäntti, H., Stange, F., Leskinen, E., and Hietanen, S. (2011). Seasonal variation in nitrification and nitrate-reduction pathways in coastal sediments in the Gulf of Finland, Baltic Sea. Aquat. Microb. Ecol. 63, 171–181. doi: 10.3354/ame01492
Jilbert, T., Slomp, C. P., Gustafsson, B. G., and Boer, W. (2011). Beyond the Fe-P redox connection: preferential regeneration of phosphorus from organic matter as a key control on Baltic Sea nutrient cycles. Biogeosciences 8, 1699–1720. doi: 10.5194/bg-8-1699-2011
Jørgensen, B. B., and Nelson, D. C. (2004). Sulfide oxidation in marine sediments: geochemistry meets microbiology. GSA Spec. Pap. 379, 63–81. doi: 10.1130/0-8137-2379-5.63
Kuparinen, J., and Tuominen, L. (2001). Eutrophication and self-purification: counteractions forced by large-scale cycles and hydrodynamic processes. Ambio 30, 190–194. doi: 10.1579/0044-7447-30.4.190
Lomnitz, U., Sommer, S., Dale, A. W., Löscher, C., Noffke, A., Wallmann, K., et al. (2016). Benthic phosphorus cycling in the Peruvian oxygen minimum zone. Biogeosciences 13, 1367–1386. doi: 10.5194/bg-13-1367-2016
Matthäus, W., and Franck, H. (1992). Characteristics of major Baltic inflows — a statistical analysis. Cont. Shelf Res. 12, 1375–1400. doi: 10.1016/0278-4343(92)90060-W
Matthäus, W., Nehring, D., Feistel, R., Nausch, G., Mohrholz, V., and Lass, H. U. (2008). “The inflow of highly saline water into the Baltic Sea,” in State and Evolution of the Baltic Sea 1952–2005, eds R. Feistel, G. Nausch, and N. Wasmund (Hoboken, NJ: Wiley), 265–309.
Meier, M. H. E., Feistel, R., Piechura, J., Arneborg, L., Burchard, H., Feikas, V., et al. (2006). Ventilation of the Baltic Sea deep water: a brief review of present knowledge from observations and models. Oceanologia 48, 133–164.
Mohrholz, V., Heene, T., Beier, S., Naumann, M., and Nausch, G. (2016). “The impact of the recent series of barotropic inflows on deep water conditions in the eastern gotland basin – time series observation,” in Talk 1st Baltic Earth Conference, (Nida). Available online at: (http://www.baltic-earth.eu/nida2016/presentations.html)
Mohrholz, V., Naumann, V., Nausch, G., Krüger, S., and Gräwe, U. (2015). Fresh oxygen for the Baltic Sea – An exceptional saline inflow after a decade of stagnation. J. Mar. Syst. 148, 152–166. doi: 10.1016/j.jmarsys.2015.03.005
Mort, H. P., Slomp, C. P., Gustafsson, B. G., and Andersen, T. J. (2010). Phosphorus recycling and burial in Baltic Sea sediments with contrasting redox conditions. Geochim. Cosmochim. Acta 74, 1350–1362. doi: 10.1016/j.gca.2009.11.016
Nausch, G., Feistel, R., and Mohrholz, V. (2012). Water Exchange Between the Baltic Sea and the North Sea, and Conditions in the Deep Basins. HELCOM Baltic Sea Environment Fact Sheets, 2012. Available online at: www.helcom.fi/baltic-sea-trends/environment-fact-sheets/
Nausch, G., Naumann, M., Umlauf, L., Mohrholz, V., Siegel, H., and Schulz-Bull, D. E. (2016). Hydrographic-hydrochemical assessment of the Baltic Sea 2015. Meereswiss. Ber. Warnemünde 101. doi: 10.12754/msr-2016-0101
Nausch, G., and Nehring, D. (1994). “Nutrient dynamics in the Gotland Deep — reactions to the major salt water inflow in 1993,” in Proceedings of the 19th Conference of Baltic Oceanographers, (Sopot), 551–559.
Nehring, D., and Franke, E. (1981). Hydrographisch-chemische Untersuchungen in der Ostsee 1969-1978. I. Die hydrographisch-chemischen Bedingungen–Geod. Geoph. Veröff. R. IV. H. 35, 3–38.
Noffke, A., Sommer, S., Dale, A. W., Hall, P. O. J., and Pfannkuche, O. (2016). Benthic nutrient fluxes in the Eastern Gotland Basin (Baltic Sea) with particular focus on microbial mat ecosystems. J. Mar. Syst. 158, 1–12. doi: 10.1016/j.jmarsys.2016.01.007
Omstedt, A., Elken, J., Lehmann, A., Leppäranta, M., Meier, H. E. M., Myrberg, K., et al. (2014). Progress in physical oceanography of the Baltic Sea during the 2003-2014 period. Prog. Oceanogr. 128, 139–171. doi: 10.1016/j.pocean.2014.08.010
Pfannkuche, O., and Linke, P. (2003). GEOMAR Landers as long-term deep-sea observatories. Sea Technol. 40, 50–55.
Reissmann, J. H., Burchard, H., Feistel, R., Hagen, E., Lass, H. U., Mohrholz, V., et al. (2009). Vertical mixing in the Baltic Sea and consequences for eutrophication – A review. Prog. Oceanogr. 82, 47–80. doi: 10.1016/j.pocean.2007.10.004
Samuelsson, M. (1996). Interannual salinity variations in the Baltic Sea during the period 1954-1990. Cont. Shelf Res. 16, 1463–1477 doi: 10.1016/0278-4343(95)00082-8
Savchuk, O. P. (2005). Resolving the Baltic Sea into seven subbasins: N and P budgets for 1991-1999. J. Mar. Syst. 56, 1–15. doi: 10.1016/j.jmarsys.2004.08.005
Schincke, H., and Matthäus, W. (1998). On the causes of major Baltic inflows — an analysis of long time series. Cont. Shelf Res. 18, 67–97. doi: 10.1016/S0278-4343(97)00071-X
Schmale, O., Krause, S., Holtermann, P., Power Guerra, N. C., and Umlauf, L. (2016). Dense bottom gravity currents and their impact on pelagic methanotrophy at oxic/anoxic transition zones. Geophys. Res. Lett. 43, 5225–5232. doi: 10.1002/2016gl069032
Schmidt, M. (2014). Cruise Report of RV “Elisabeth Mann-Borgese” Cruise No. EMB089. 17. Available online at: http://www.io-warnemuende.de/tl_files/forschung/pdf/cruise-reports/cremb089.pdf
Schulz, H. N., and Schulz, H. D. (2005). Large sulfur bacteria and the formation of phosphorite. Science 21, 416–418. doi: 10.1126/science.1103096
Sommer, S., Gier, J., Treude, T., Lomnitz, U., Dengler, M., Cardich, J., et al. (2016). Depletion of oxygen and nitrite in the Peruvian oxygen minimum zone cause an imbalance of benthic nitrogen fluxes. Deep Sea Res. I Oceanogr. Res. Pap. 112, 113–122. doi: 10.1016/j.dsr.2016.03.001
Sommer, S., Linke, P., Pfannkuche, O., Schleicher, T., Schneider v. Deimling, J., Reitz, A., et al. (2009). Seabed methane emissions and the habitat of frenulate tube worms on the Captain Arutyunov mud volcano (Gulf of Cadiz). Mar. Ecol. Prog. Ser. 382, 69–86. doi: 10.3354/meps07956
Sommer, S., Schmidt, M., and Linke, P. (2015). Continuous inline mapping of a dissolved methane plume at a blowout site in the Central North Sea UK using a membrane inlet mass spectrometer – Water colunm stratification impedes immediate methane release into the atmosphere. Mar. Petr. Geol. 68, 766–775. doi: 10.1016/j.marpetgeo.2015.08.020
Stigebrand, A., and Gustafsson, B. G. (2007). Improvement of Baltic proper water quality using large-scale ecological engineering. Ambio 36, 280–286. doi: 10.1579/0044-7447(2007)36[280:IOBPWQ
Stigebrandt, A. (2003). Regulation of the vertical stratification, length of stagnation periods and oxygen conditions in the deeper deepwater of the Baltic proper. Meereswiss. Ber. Warnemünde 54, 69–80.
Stigebrandt, A., Rahm, L., Viktorsson, L., Ödalen, M., Hall, P. O. J., and Liljebladh, B. (2014). A new phosphorus paradigm for the Baltic proper. Ambio 43, 634–643. doi: 10.1007/s13280-013-0441-3
Tengberg, A., Hovdenes, J., Andersson, H. J., Brocandel, O., Diaz, R., Hebert, D., et al. (2006). Evaluation of a life-time based optode to measure oxygen in aquatic systems. Limnol. Oceanogr. 4, 7–17. doi: 10.4319/lom.2006.4.7
Teske, A., and Nelson, D. C. (2006). The genera Beggiatoa and Thioploca. Prokaryotes 6, 784–810. doi: 10.1007/0-387-30746-x_27
Vahtera, E., Conley, D. J., Gustafsson, B. G., Kuosa, H., Pitkänen, H., Savchuk, O. P., et al. (2007). Internal ecosystem feedbacks enhance nitrogen-fixing cyanobacteria blooms and complicate management in the Baltic Sea. Ambio 36, 186–194. doi: 10.1579/0044-7447(2007)36[186:IEFENC
Van Cappellen, P., and Ingall, E. D. (1996). Redox stabilization of the atmosphere and oceans by phosphorous-limited marine productivity. Science 271, 493–496. doi: 10.1126/science.271.5248.493
Viktorsson, L., Ekeroth, N., Nilsson, M., Kononets, M., and Hall, P. O. J. (2013a). Phosphorus recycling in sediments of the central Baltic Sea. Biogeosciences 10, 3901–3916. doi: 10.5194/bg-10-3901-2013
Viktorsson, L., Kononets, M., Roos, P., and Hall, P. O. J. (2013b). Recycling and burial of phosphorus in sediments of an anoxic fjord — the by fjord, western Sweden. J. Mar. Res. 71, 351–374. doi: 10.1357/002224013810921636
Winkel, M., Salman-Carvalho, V., Woyke, T., Richter, M., Schulz-Vogt, H. N., Flood, B. E., et al. (2016). Single-cell sequencing of Thiomargarita reveals genomic flexibility for adaptation to dynamic redox conditions. Front. Microbiol. 7:964. doi: 10.3389/fmicb.2016.00964
Keywords: major baltic inflows, benthic nutrient fluxes, euxinia, hypoxia, ventilation, sulfur bacteria, Gotland basin, Baltic Sea
Citation: Sommer S, Clemens D, Yücel M, Pfannkuche O, Hall POJ, Almroth-Rosell E, Schulz-Vogt HN and Dale AW (2017) Major Bottom Water Ventilation Events Do Not Significantly Reduce Basin-Wide Benthic N and P Release in the Eastern Gotland Basin (Baltic Sea). Front. Mar. Sci. 4:18. doi: 10.3389/fmars.2017.00018
Received: 28 October 2016; Accepted: 16 January 2017;
Published: 07 February 2017.
Edited by:
Tim Kalvelage, ETH Zurich, SwitzerlandReviewed by:
Perran Cook, Monash University, AustraliaSusanna Hietanen, University of Helsinki, Finland
Copyright © 2017 Sommer, Clemens, Yücel, Pfannkuche, Hall, Almroth-Rosell, Schulz-Vogt and Dale. This is an open-access article distributed under the terms of the Creative Commons Attribution License (CC BY). The use, distribution or reproduction in other forums is permitted, provided the original author(s) or licensor are credited and that the original publication in this journal is cited, in accordance with accepted academic practice. No use, distribution or reproduction is permitted which does not comply with these terms.
*Correspondence: Stefan Sommer, c3NvbW1lckBnZW9tYXIuZGU=