 Malika Kheireddine1*
 Mustapha Ouhssain1,2,3
 Hervé Claustre2,3
 Julia Uitz2,3
 Bernard Gentili2,3
 Burton H. Jones1
- 1Biological and Environmental Sciences and Engineering Division, Technology, Red Sea Research Center, King Abdullah University of Science and Technology, Thuwal, Saudi Arabia
- 2Laboratoire d'Océanographie de Villefranche, Sorbonne Université, UPMC Univ Paris 06, UMR 7093, Observatoire Oceanologique, Villefranche-Sur-Mer, France
- 3Laboratoire d'Océanographie de Villefranche, Centre Nationnal de la Recherche Scientifique, UMR 7093, Observatoire Oceanologique, Villefranche-Sur-Mer, France
Pigment-based phytoplankton community composition and primary production were investigated for the first time in the Red Sea in February-April 2015 to demonstrate how the strong south to north environmental gradients determine phytoplankton community structure in Red Sea offshore regions (along the central axis). Taxonomic pigments were used as size group markers of pico, nano-, and microphytoplankton. Phytoplankton primary production rates associated with the three phytoplankton groups (pico-, nano-, and microphytoplankton) were estimated using a bio-optical model. Pico- (Synechococcus and Prochlorococcus sp.) and Nanophytoplankton (Prymnesiophytes and Pelagophytes) were the dominant size groups and contributed to 49 and 38%, respectively, of the phytoplankton biomass. Microphytoplankton (diatoms) contributed to 13% of the phytoplankton biomass within the productive layer (1.5 Zeu). Sub-basin and mesoscale structures (cyclonic eddy and mixing) were exceptions to this general trend. In the southern Red Sea, diatoms and picophytoplankton contributed to 27 and 31% of the phytoplankton biomass, respectively. This result induced higher primary production rates (430 ± 50 mgC m−2 d−1) in this region (opposed to CRS and NRS). The cyclonic eddy contained the highest microphytoplankton proportion (45% of TChla) and the lowest picophytoplankton contribution (17% of TChla) while adjacent areas were dominated by pico- and nano-phytoplankton. We estimated that the cyclonic eddy is an area of enhanced primary production, which is up to twice those of the central part of the basin. During the mixing of the water column in the extreme north of the basin, we observed the highest TChla integrated (40 mg m−2) and total primary production rate (640 mgC m−2 d−1) associated with the highest nanophytoplankton contribution (57% of TChla). Microphytoplankton were a major contributor to total primary production (54%) in the cyclonic eddy. The contribution of picophytoplankton (Synechococcus and Prochlorococcus sp.) reached maximum values (49%) in the central Red Sea. Nanophytoplankton seem to provide a ubiquitous substantial contribution (30–56%). Our results contribute to providing new insights on the spatial distribution and structure of phytoplankton groups. An understanding and quantification of the carbon cycle in the Red Sea was made based on estimates of primary production associated with pico-, nano-, and microphytoplankton.
Introduction
Phytoplankton play a key role in the biogeochemistry of the ocean (Le Quéré et al., 2005; Nair et al., 2008; Doney et al., 2009a,b,c,d,e; Weber and Deutsch, 2010, 2012). Phytoplankton diversity (size, shape, pigmentation) critically influence biogeochemical processes such as photosynthetic efficiency, trophic interactions (Legendre and Lefevre, 1989; Hansen et al., 1994; Scharf et al., 2000; Jennings et al., 2002), and global carbon fluxes from the euphotic zone (Michaels and Silver, 1988; Peinert et al., 1989; Buesseler, 1998).
The physico-chemical parameters, such as light, temperature, salinity, pH, nutrients, and turbulence, are the major factors that control the spatial and temporal variations of phytoplankton in marine ecosystems (Margalef, 1978; Edwards and Richardson, 2004; Mann and Lazier, 2006; Huertas et al., 2011). Seasonal variations in these parameters have an important role in the distribution and seasonality of phytoplankton biomass and species (Margalef, 1978; Cullen et al., 2002). Recently, Raitsos et al. (2013) studied the spatial and temporal variations of phytoplankton in the Red Sea using ocean color remote sensing. They mentioned that the Southern Red Sea was the most productive region (1–3 mg m−3) compared to the Northern Red Sea (0.2–0.45 mg m−3) and also identified that the central part of the basin was the most oligotrophic region compared to the southern and northern regions (0.15–0.30 mg m−3). They clearly showed that the Red Sea phytoplankton biomass is marked by seasonality with a high biomass during winter time and a low biomass during the summer.
They suggested that the seasonal variability of phytoplankton biomass in the Red Sea may be controlled by physical processes, which carry nutrients into the euphotic layer. This input of new nutrients into the euphotic layer is expected to affect the structure of the phytoplankton community and contributes to new production (Legendre and Lefevre, 1989; Goldman, 1993; Legendre and Rassoulzadegan, 1995). Significantly, the main physical processes that occur in the Red Sea are the winter mixing in the Northern Red Sea, the horizontal advection and the intrusion of nutrient-rich waters from the Gulf of Aden (via Bab-el-Mandeb) into the Southern Red Sea. However, they also mentioned that the seasonal cycle of phytoplankton biomass could be affected by mesoscale features such as cyclonic and anticyclonic eddies in the whole basin. Essential information about the seasonal variability of Chlorophyll a concentration in the Red Sea are provided in Raitsos et al. (2013), Triantafyllou et al. (2014), and Racault et al. (2015).
The Red Sea, one of the most saline and warmest deep seas in the world, is a semi-enclosed marginal sea of about 2,000 km length, with an average width of about 300 km (Longhurst, 2007; Belkin, 2009; Raitsos et al., 2011, 2013). Typical seawater temperature varies from 21 to 28°C in the north and from 26 to 32°C in the south (Nandkeolyar et al., 2013). The Red Sea is characterized by low precipitation, little riverine input (Patzert, 1974), high evaporation rates (Sofianos and Johns, 2003) and cyclonic and anticyclonic eddies appear to dominate the horizontal circulation (Raitsos et al., 2013; Yao et al., 2014a,b; Zhan et al., 2014). The Red Sea's primary connection with the global ocean is with the Arabian Sea through the Gulf of Aden via the Strait of Bab-el-Mandab. The Red Sea is defined by strong latitudinal gradients in physico-chemical variables, with increasing temperature, nutrients and decreasing salinity toward the south primarily dependent on the exchange of water through the strait of Bab-el-Mandeb and the thermohaline circulation of the Red Sea (Neumann and McGill, 1962; Sofianos et al., 2002; Churchill et al., 2014; Sawall et al., 2014; Ismael, 2015). During the Arabian Sea southwest monsoon, cool, less salty, and nutrient-rich Gulf of Aden Intermediate Water (GAIW) enters the southern the Red Sea, stimulating primary production and increased phytoplankton biomass (Neumann and McGill, 1962; Sofianos and Johns, 2007; Raitsos et al., 2013; Churchill et al., 2014; Wafar et al., 2016). The Red Sea is considered oligotrophic mainly due to the depletion in nutrients in the upper layer as the water advects northward due to the thermohaline forcing. The Northern Red Sea is marked with significant physical variability, with deep mixed layers occurring in winter and a strong stratification during summer.
As a consequence, the phytoplankton community structure responds to changes in environmental conditions modifying the Red Sea food web, the functioning of the ecosystem, and thus the overall biogeochemical cycle. The motivation of the present study, therefore, is to investigate the diversity and dominance of Red Sea phytoplankton population along the significant latitudinal gradient.
Few studies of the phytoplankton distribution of the Red Sea have been undertaken during the two past decades (Shaikh et al., 1986; Sommer et al., 2002; Al-Najjar et al., 2007; Acosta et al., 2013). Al-Najjar et al. (2007) examined the phytoplankton community structure in the Gulf of Aqaba at the northeast-most end of the Red Sea. They suggested that prochlorophytes dominated this part of the Red Sea, comprising 55% of the total phytoplankton biomass during the summer. They also observed that eukaryotic algae dominated during the winter mixing period when they comprised close to 60% of the total phytoplankton biomass. Other phytoplankton groups (prymnesiophytes, chrysophytes, chlorophytes, and diatoms) have been identified in this area in low concentration during winter and spring periods. Nassar et al. (2014) found that the northwestern coastal region of the Red Sea is dominated by diatoms and dinoflagellates. Other algal classes such as cyanophytes, chlorophytes, and nanoflagellates have also been observed in low abundance, representing just 9% of the phytoplankton biomass in this area. Recently, Pearman et al. (2016), have investigated changes in the phytoplankton community composition and structure at both extremities of the basin: the Northern and Southern Red Sea. They observed that cyanobacteria were, in general, the most abundant group of the phytoplankton biomass at surface regardless of the region of the Red Sea. On the other hand, they found that dinoflagellates were more represented in the north whereas diatoms and chlorophytes were more prominent in the southern region. Pearman et al. (2016) suggested that the distribution of diatoms and chlorophytes in the southern Red Sea correlated with increased nutrients and Chlorophyll a found in this region which is influenced by the inflow of nutrient-rich water from the Gulf of Aden.
Full understanding of the spatial distribution of the phytoplankton communities in the entire Red Sea remains incomplete. The available information is restricted to sub-regions of the Red Sea.
Several approaches may be used to analyze and quantify the temporal and spatial variability of phytoplankton communities in the world's oceans, such as flow cytometry, microscopy, and molecular analysis. Flow cytometry and microscopy are limited with respect to their particle size detection range. Moreover, microscopic observations are time-consuming and rely on the observer's taxonomic experience (Wright and Jeffrey, 2006). Over the past two decades, therefore, phytoplankton carotenoids and Chlorophyll pigments as analyzed by High-Performance Liquid Chromatography (HPLC) have been commonly used as indicators to quantitatively characterize major taxa of phytoplankton (Claustre, 1994; Mackey et al., 1996; Wright et al., 1996, 2010; Vidussi et al., 2001; Uitz et al., 2006; Van den Meersche et al., 2008; Hirata et al., 2011). Increasingly, HPLC has become a cost-effective method to address the spatial (horizontal and vertical) distribution of the main phytoplankton groups in various oceanic environments. As such, this approach was selected for resolving and identifying Red Sea phytoplankton depth distribution in this study.
More specifically, we analyzed a data set of HPLC measurements collected during three different cruises performed in the Red Sea for monitoring Red Sea phytoplankton. Several authors (Claustre, 1994; Vidussi et al., 2001; Uitz et al., 2006) have proposed to derive pigment-based size classes relevant to picophytoplankton (between 0.2 and 2 μm), nanophytoplankton (between 2 and 20 μm) and microphytoplankton (>20 μm).
In this study we sought to: (1) examine changes observed in the pigment-based phytoplankton community structure and vertical distribution along the central axis of the whole basin of the Red Sea; and (2) address the relationship between phytoplankton community structure and primary production using a combination of pigment information and a semi-empirical model (developed by Uitz et al., 2008) that describes the dependence of algal photophysiological response on the community composition and irradiance within the euphotic layer. To our knowledge, this is the first attempt to study pigment-based phytoplankton communities in Red Sea waters.
Materials and Methods
Sampling Area and In situ Measurements
Hydrographic observations and seawater sampling were carried out during three research cruises performed in the Red Sea between February and April 2015 aboard the R/V Thuwal: in the Southern Red Sea (SRS) (8–21 February 2015); in the Central Red Sea (CRS) (29 March-3 April 2015) and in the Northern Red Sea (NRS) (17–28 April 2015). A total of 17 stations were sampled: four in the SRS, six in the CRS and seven in the NRS (Figure 1). Temperature and salinity profiles were obtained using a SBE 9 (Sea-Bird Electronics) Conductivity-Temperature-Depth (CTD) probe. Discrete seawater samples for determining phytoplankton pigments were collected using a rosette system equipped with 10 L Niskin bottles at 8–12 depths within the upper 200 m of the water column. The euphotic layer depth, Zeu, defined as the depth where Photosynthetically Active Radiation (PAR) is reduced to 1% of its surface value was computed using in situ Chlorophyll a concentration profiles according to the model developed by Morel and Maritorena (2001). To provide a general overview of the spatial distribution of phytoplankton community and size structure along the central axis of the Red Sea, measurements collected during the three different research campaigns were combined.
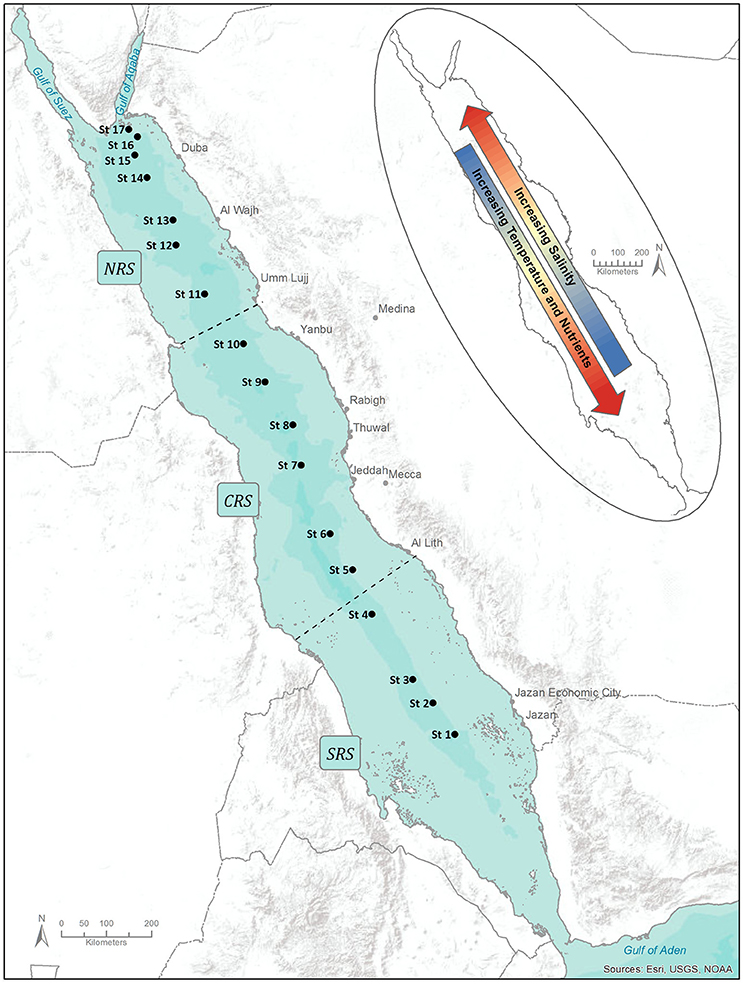
Figure 1. Locations of stations sampled during the different cruises in the Red Sea between February and April 2015. The delineation of Northern Red Sea (NRS), the Central Red Sea (CRS) and the Southern Red Sea (SRS) is indicated on the map. The direction of latitudinal gradients in temperature, salinity and nutrients are illustrated. Map Produced using ArcGIS.
Phytoplankton Pigments
We followed the HPLC analytical procedure proposed by Ras et al. (2008). Briefly, photosynthetic phytoplankton pigments were obtained at different depths in the upper 200 m of the water column. Seawater samples of 2.8 L were collected from Niskin bottles and filtered through 25 mm diameter Whatman GF/F filters (0.7 μm porosity). Filters were stored in liquid nitrogen during the cruise, then at −80°C in the laboratory until analysis. Samples were extracted in 3 mL 100% methanol, disrupted with glass pearls on a cooled vibratory homogenizer, centrifuged, and filtered (Teflon syringe filter of 0.2 μm) 2 h later. Within 24 h, the extracts were analyzed by HPLC using a complete 1,260 Agilent Technologies system. This method has proven to be satisfactory in terms of resolution, sensitivity, accuracy, and precision (Hooker et al., 2005). The limit of detection (three times signal:noise ratio) for Chlorophyll a is of 0.0005 mg m−3 and with an injection precision of 0.6%. The HPLC method enables the identification and quantification of pigments that were used in this study (see Table 1 for details and pigment abbreviations).
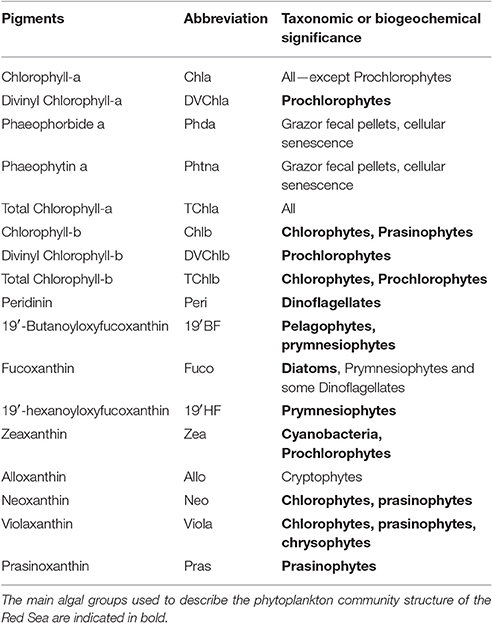
Table 1. List of the pigments and their abbreviations used in this study and their taxonomic/biogeochemical significance [modified from Jeffrey and Vesk (1997)].
Uncertainties of the determination of pigment concentrations were calculated using the principles of uncertainty propagation and were ~5.3% for the primary pigments and 5.9% on average for the secondary pigments.
Pigment Interpretation
It is now well established that accessory pigments are typical of phytoplankton groups and may be used as biomarkers to estimate the composition of phytoplankton communities. This approach, however, has rarely been compared with others techniques such as flow cytometry, microscopy, and molecular analysis (Claustre, 1994; Vidussi et al., 2001; Uitz et al., 2006). We utilized seven major diagnostic pigments to estimate the biomass associated with three pigment-derived size classes, i.e., microphytoplankton, nanophytoplankton, and picophytoplankton. These seven pigments are fucoxanthin, peridinin, 19′ hexanoyloxyfucoxanthin, 19′-butanoyloxyfucoxanthin, alloxanthin, Total Chlorophyll b (TChlb), and zeaxanthin (abbreviations in Table 1).
The basic assumptions are as follows: (1) fucoxanthin and peridinin are diagnostic pigments for diatoms and dinoflagellates, which dominate the microphytoplankton (>20 μm); (2) nanophytoplankton (2–20 μm) is characterized by alloxanthin, 19′ hexanoyloxyfucoxanthin and 19′-butanoyloxyfucoxanthin, that are abundant in cryptophytes, chromophytes, and nanoflagellates and (3) picophytoplankton (<2 μm) is assessed from zeaxanthin and TChlb, which are abundant in green flagellates, prochlorophytes, and cyanobacteria.
The relative proportions of picophytoplankton (size <2 μm), nanophytoplankton (2–20 μm), and microphytoplankton (20–200 μm) are derived from the concentrations of phytoplankton diagnostic pigments using the equations described in Uitz et al. (2006):
where DP is the sum of the seven diagnostic pigment concentrations:
It is also possible to derive the Total Chlorophyll a concentration associated with each of the three phytoplankton classes ([TChla]-micro, [TChla]-nano and [TChla]-pico) according to the following equations:
There are certainly many exceptions to these pigment/size relationships. Previous studies (Claustre, 1994; Vidussi et al., 2001; Uitz et al., 2006, 2008) mentioned that these assumptions may sometimes lead to errors. For example, some diagnostic pigments are shared by several phytoplankton groups and some groups may cover a broad size range, such as zeaxanthin containing Trichodesmium (microphytoplankton), or 19′BF and 19′HF, pigments specific of prymnesiophytes, present in some picoplankton prymnesiophytes. Additionally, some phytoplankton groups may spread over a wide size range (Moon-van der Staay et al., 2000; Cuvelier et al., 2010; Jardillier et al., 2010; Treusch et al., 2012). Nevertheless, this approach has proven valuable to provide the dominant trends of the phytoplankton community and size structure at the regional and seasonal scales (Uitz et al., 2006, 2015; Ras et al., 2008).
Computation of Primary Production
The class-specific primary production model rates were computed according to the bio-optical primary production model proposed by Morel and Andre (1991) in combination with the phytoplankton class-specific photophysiological properties proposed by Uitz et al. (2008). The model requires the following inputs: (1) surface PAR estimated from ocean color remote sensing (https://oceancolor.gsfc.nasa.gov/); (2) vertical profiles of [TChla]-micro, [TChla]-nano and [TChla]-pico and (3) the class-specific photophysiological properties proposed by Uitz et al. (2008).
A model describing the dependence of phytoplankton photophysiological properties (i.e., the chlorophyll-specific absorption coefficient, and the dependent quantum yield of carbon fixation, the photosaturation parameter and the slope of the photosynthesis-irradiance curve) on the phytoplankton community and size structure and water column depth was provided by Uitz et al. (2008) allowing estimation of vertical profiles of photophysiological properties for each pigment-based phytoplankton size class. The model was established by analyzing a large database including measurements of HPLC-determined pigments, phytoplankton absorption spectra, and photosynthesis-irradiance curve parameters collected in various temperate, subtropical, and tropical open ocean regions.
In this study, the photophysiological parameters required for running the primary production model of Morel and Andre, 1991) were computed from our in situ pigment-based phytoplankton size class profiles using the model established by Uitz et al. (2008). Computations applied to the vertical profiles of phytoplankton class-specific enable estimation of the primary production rates associated with micro-, nano-, and picophytoplankton over the productive layer. The depth of this layer is defined as 1.5 times the depth of Zeu. The total primary production, attributed to the whole algal biomass, is defined as the sum of the contributions of each class.
Essential information about the computation of the class-specific primary production rates are provided in Morel and Andre (1991) and Uitz et al. (2006, 2008).
Results and Discussion
In this section, datasets of hydrographic measurements (temperature, salinity, and density) and phytoplankton pigments acquired in the SRS from 8 to 21 February 2015, in the CRS from 29 March to 03 April 2015 and in the NRS from 17 to 28 April 2015 have been combined to provide a basin scale perspective of the Red Sea and facilitate interpretation of the data in Figures 2–7. While the data set is not synoptic, it provides a general perspective of the phytoplankton community distributions along the physico-chemical latitudinal gradients observed in the Red Sea.
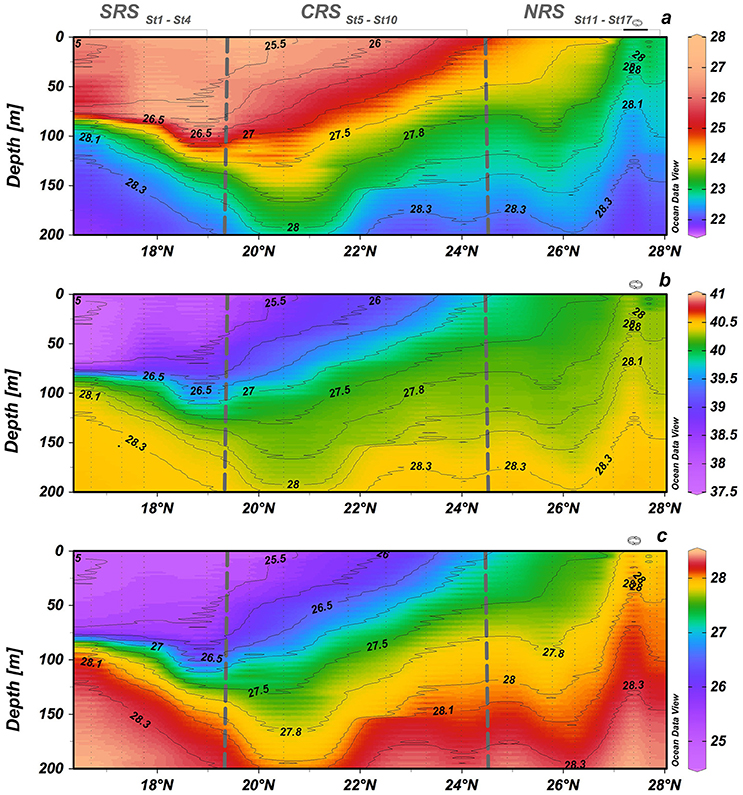
Figure 2. Hydrographic section along the south-north transect in the 0–200 layer. (a) Potential temperature (°C), (b) salinity, and (c) potential density (kg m−3). The contour lines in each plot are density isopycnal surfaces. Eddy stations marked along the top of the upper graph.
Hydrographic Conditions
Latitudinal variations in temperature, salinity and density are shown in Figure 2. As observed in previous studies, the Red Sea is characterized by a strong latitudinal gradient in salinity, temperature and density (Sofianos and Johns, 2007; Yao et al., 2014a,b). Low salinity water (<37) enters the Red Sea from the Gulf of Aden, and surface salinity then generally increases from south to north through evaporation (Figure 2b). Temperature generally decreases from south to north (Figure 2a). The northern Red Sea, is characterized by the highest upper layer salinities, with surface salinities in excess of 40.3 observed near 27.25°N (Figure 2b). These salty waters results from evaporation with almost no precipitation input. The doming of temperature and salinity isolines at 27.3° N is indicative of an upwelling of deeper waters, which is typical of a cyclonic eddy (cold core eddy; Figures 2a,b) and confirmed by density fields (Figure 2c). The surface water in the eddy center was ~1.5°C cooler, 0.3 saltier, and 0.4 kg m−3 denser than adjacent surface waters outside the eddy. Modeling results indicate that the northern Red Sea is often characterized by a cyclonic circulation (Yao et al., 2014a,b). In the CRS, the isotherm and isohaline surfaces generally tilted upward from south to north resulting in cooler, saltier and denser water present nearer the surface toward the north (Figures 2a–c). In the SRS, the upper layer was characterized by relatively cold (<26°C), less saline (<38.25), and less dense (<27 kg m−3) water advecting from the south (16.75°–17.4° N) (Figures 2a–c).
Phytoplankton Pigments Distribution
Total Chlorophyll a (TChl a) concentrations in the Red Sea ranged between 0.04 and 0.60 mg m−3 in the upper 0–20 m, while at the deep chlorophyll maximum (DCM) the concentrations varied between 0.28 and 0.78 mg m−3 (Figure 3). Within our sampling, surface TChla concentrations were lowest in the northern Red Sea (0.04 mg m−3), while the highest surface values were found at both extremities of the Red Sea, up to 0.60 mg m−3 in the south and 0.43 mg m−3 in the north. The highest TChl a concentrations of the northern region were observed within a feature with steeply shallowing isopycnals, characteristic of a cyclonic eddy, centered at 27.3° N. Within the feature, the mixed layer depth (MLD) increased to about ~80 m, computed using a density gradient criterion of 0.125 kg m−3 (Figure 3). The Red Sea was characterized by increasing oligotrophic conditions with a deepening of the DCM position and a decrease in TChla concentrations from south to north (16.75°–27°N). These results are in agreement with the expected Chlorophyll a gradients along the Red Sea (Racault et al., 201), where Chlorophyll a concentrations tend to be higher in the south than in the north. The Chlorophyll a maximum reaches its deepest position (around 80 m) in the northern Red Sea and its shallowest position (around 20 m) in the Southern Red Sea. Fluctuations in the DCM depth occurred between 27° and 28°N where the DCM was shallower (~50 m at 27.5°N) at stations associated with the eddy and when the MLD reached its deepest position (at 27.75°N) around 115 m (Figure 3). The position of the DCM is mostly close to Zeu, suggesting that the DCM is light-driven.
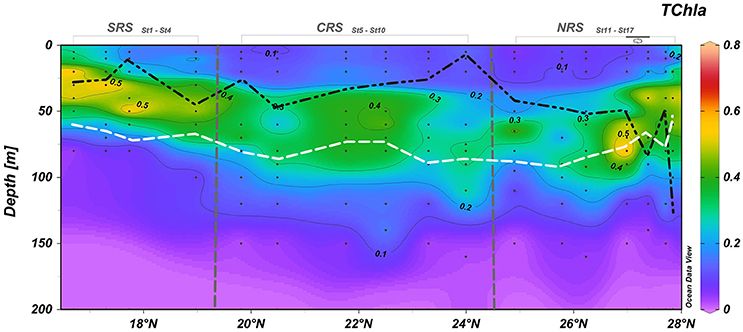
Figure 3. Contour plot of the TChla concentrations (mg m−3) along the the south-north transect. White and black dashed lines represent the depth of the euphotic layer, Zeu (m) and the mixed layer depth, MLD (m), respectively. Small black dots represent collected water samples at each sampling station. Eddy stations marked along the top of the upper graph.
The distribution of some accessory pigments did not always exhibit the same pattern as TChla distribution. The respective spatial distribution of some of the pigments appeared to relate with water mass variability. Fuco, specifically, appeared to be associated with the northern cyclonic eddy.
The distributions of TChlb and 19′HF were generally similar to that of TChla. The deep maxima of both TChlb and 19′HF deepened from the SRS to the CRS, and shallowed in the vicinity of the eddy in the NRS (Figures 4A,D). The 19′HF concentrations below the DCM (110–160 m depth) in the CRS and NRS were two to three times higher than surface concentrations (Figure 4D). In previous studies, high concentrations of 19′HF below the DCM have been reported in the Atlantic Ocean (Claustre and Marty, 1995) and the Pacific Ocean (Ras et al., 2008). DVChla was mainly observed in the CRS and in the NRS except in the eddy area (Figure 4B). The DVChla trend is characterized by a progressive increase in concentrations from the surface to the depth of the DCM (Figure 4B). Zea was detected in the surface layer along the entire transect and generally decreased depth below the mixed layer (Figure 4C). High concentrations of Fuco were observed within the cyclonic eddy in the NRS (0.160 ± 0.028 mg m−3) and in lower concentrations (>0.051 mg m−3) within the DCM in the SRS (Figure 4E). Elsewhere, Fuco concentrations were very low (0.0178 ± 0.004 mg m−3).
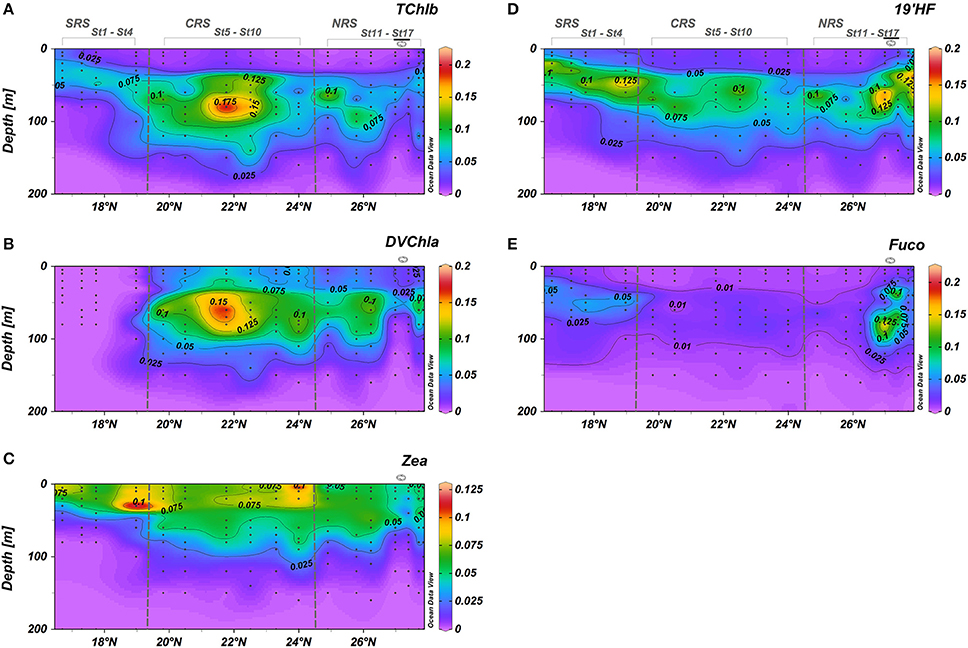
Figure 4. Vertical cross sections for pigment concentrations (mg m−3) across the south-north transect. (A) Total chlorophyll-b; (B) Divinyl chlorophyll-a; (C) Zeaxanthin; (D) 19′Hexanoyloxyfucoxanthin; (E) Fucoxanthin. Black dots represent sampling points. Eddy stations marked along the top of the upper graph.
Low amounts of minor accessory pigments (0.0005–0.059 mg m−3) have also been identified and are of interest as biomarkers for particular phytoplankton groups. Briefly, Pras, Viola, Allo, Peri, and Neo, were detected at DCM throughout the study area: highest concentrations were found in the SRS and in the eddy (Figure 5). In the 0–35 m layer, Pras, Allo, and Neo were hardly detected in the SRS and were below detection in this surface layer in the other regions of the basin (Figures 5A–C). Only Viola and Peri persisted throughout the basin from surface to 100 m depth (Figures 5D,E). The highest concentrations of Viola and Peri occurred the most southern stations within the DCM in the low salinity Gulf of Aden inflow (Figures 5D,E). The vertical distribution of most of the pigments were affected by the cyclonic eddy.
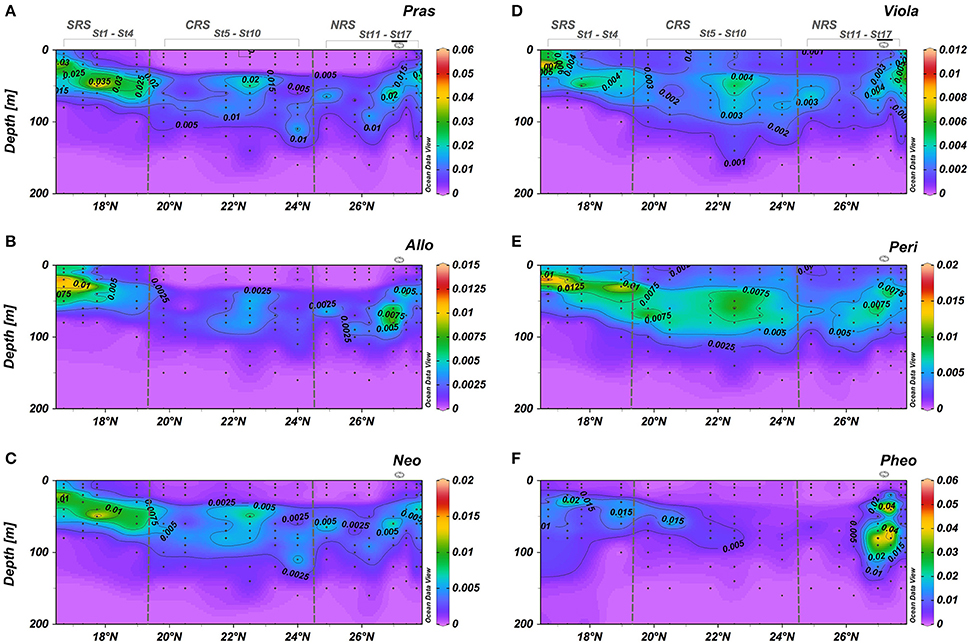
Figure 5. Vertical cross sections for pigment concentrations (mg m−3) across the south-north transect. (A) Prasinoxanthin; (B) Alloxanthin; (C) Neoxanthin; (D) Violaxanthin; (E) Peridinin; (F) Phaeopigments. Black dots represent sampling points. Eddy stations marked along the top of the upper graph.
Phaeopigments (Phaeophorbide a + Phaeophytin a) revealed a spatial distribution similar to the distribution of Fuco (Figures 4E, 5F, respectively). Phaeopigment concentrations were very low within the CRS and more abundant in the SRS (~30–40 m depth) and in the eddy in the NRS (20–120 m depth).
Phytoplankton Group Distribution
Based on phytoplankton pigment signatures, picophytoplankton accounted for 30–75% of phytoplankton biomass throughout the upper 200 m water column along the central axis of the Red Sea (Figure 6A). They contributed 60–70% of the biomass in the upper 40 m between 19 and 26.5°N. In the SRS and within the cyclonic eddy in the NRS, picophytoplankton dominated only in the upper 30 m where their contribution was 30–40% of total biomass (Figure 6A). Below 40 m, the picophytoplankton contribution was relatively homogeneously, except for the very southern region. In surface waters, the highest biomasses of picophytoplankton were associated with the dominance of Zea and DChla (Figures 7A,B). These two pigments, indicators of cyanobacteria and prochlorophytes, represented phytoplankton biomass of up to 45% in the SRS and up to 80% in the CRS and NRS (Figures 7A,B). This result is similar to observations from other tropical and temperate oceanic areas (Campbell et al., 1994; Claustre and Marty, 1995; Mackey et al., 1996; Barlow et al., 1997; Partensky et al., 1999; Ras et al., 2008; Shibl et al., 2014, 2016; Pearman et al., 2016). Prochlorococcus and Synechococcus are known to be the most abundant organisms in highly stratified and nutrient depleted oceans between 45°N and 45°S (Olson et al., 1990; Partensky et al., 1999; Johnson et al., 2006). While these organisms co-occur in the Red Sea, differences in their respective spatio-vertical distribution have been observed (Figure 7). Elevated Zea/TChla ratios reveal the dominance of Synechococcus in the surface layer (0–50 m depth) along the entire transect (Figure 7A). Except in the SRS and within the eddy area (26.5°–27.5°N), the Prochlorococcus population with DVChla displayed maximum contributions in the upper 50 meters (less than Synechococcus) and decreased with depth (Figure 7B) whereas prochlorophytes with DVChlb were mainly observed below the surface layer (50–200 m) from 18° to 26.5° N (Figure 7C). This pigment differentiation likely indicates a difference in the light adaptation of this population. Several studies suggested that the effect of photoacclimation could explain this observation and also revealed that Prochlorococcus populations adapted to grow at higher irradiances contained much less DVChlb than Prochlorococcus populations adapted to low light irradiance (Partensky et al., 1997; Roy et al., 2011). However, it is known that phytoplankton pigments do not always respond uniformly to changes in irradiance. Variations in either community structure or photoacclimation processes, may explain the observed vertical structure of the Prochlorococcus population. Prochlorococcus with high DVChlb (DVChlb/DVChla around 2.8 from 100 to 200 m depth), are apparent below 50 m and those with high DVChla are primarily observed between the surface and 50 m depth.
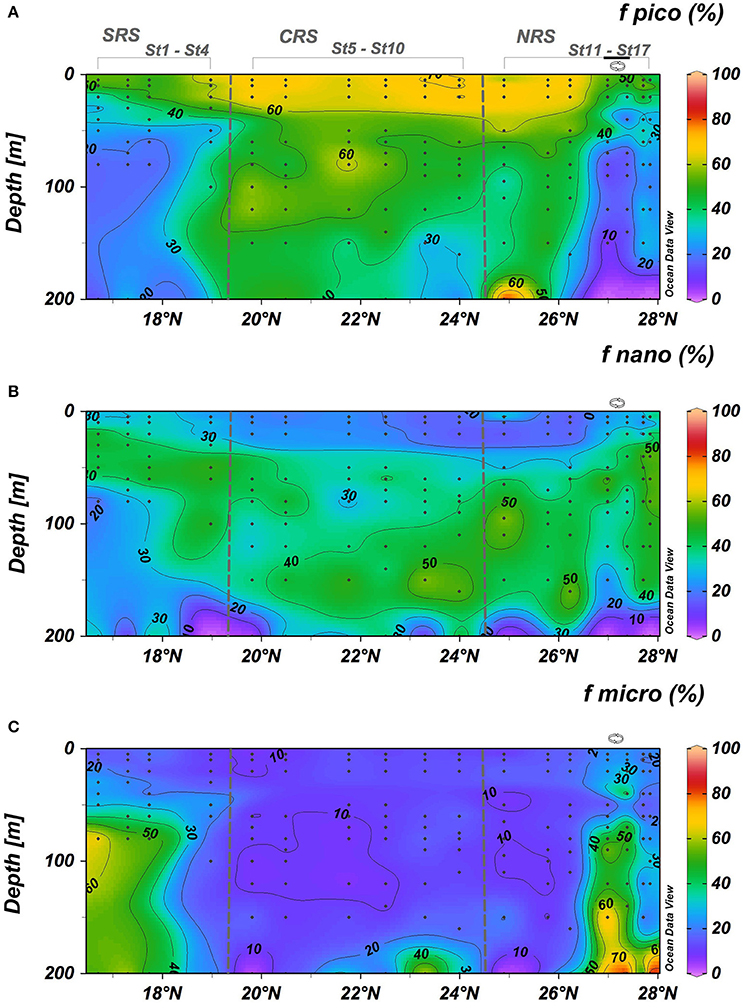
Figure 6. Vertical cross percentages (A–C) associated to the pico-, nano-, and micro-phytoplankton groups. Black dots represent sampling points. Eddy stations marked along the top of the upper graph.
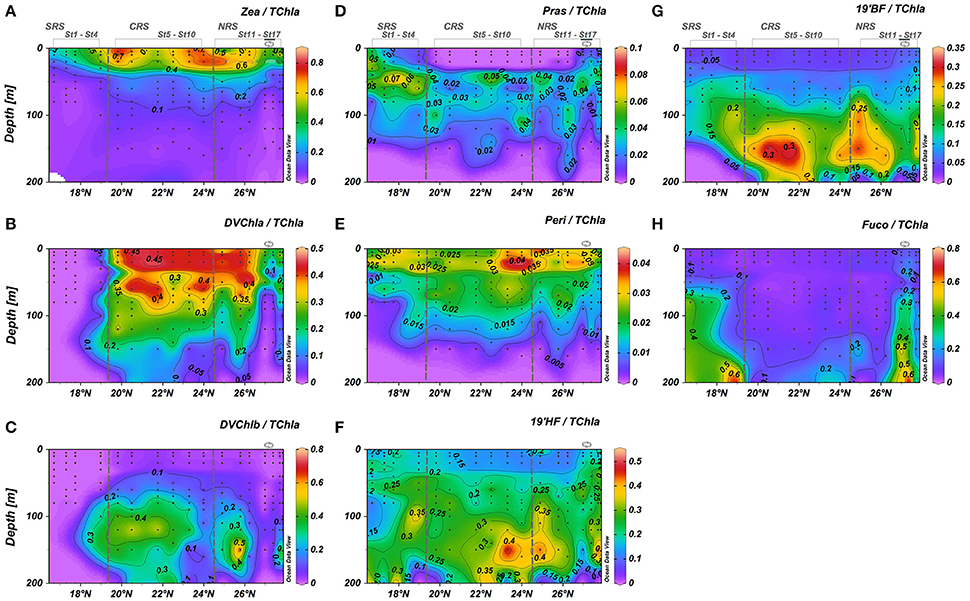
Figure 7. Cross sections for pigment concentrations normalized to Total chlorophyll-a across the south-north transect. (A) Zeaxanthin/TChl-a; (B) Divinyl Chlorophyll-a/TChl-a; (C) Divinyl Chlorophyll-b/TChla; (D) Pasinoxanthin/TChla; (E) Peridinin/TChla; (F) 19′Hexanoyloxyfucoxanthin/ TChl-a; (G) 19′Butanoyloxyfucoxanthin/TChl-a; (H) Fucoxanthin/TChl-a. Black dots represent sampling points. Eddy stations marked along the top of the upper graph.
The vertical distribution of Prochlorococcus in the Red Sea is similar to distributions observed in the North Atlantic, South Pacific Ocean, Mediterranean Sea and Red Sea (Goericke and Repeta, 1992; Partensky et al., 1997, 1999; Johnson et al., 2006; Ras et al., 2008; Zwirglmaier et al., 2008; Pearman et al., 2016). Several different ecotypes of Prochlorococcus, exhibiting distinct ecophysiologies and vertical distributions, coexist in the water column (Moore et al., 1998; Moore and Chisholm, 1999; Rocap et al., 2002; Johnson et al., 2006; Coleman and Chisholm, 2007; Zwirglmaier et al., 2007, 2008). Shibl et al. (2016) showed that the upper layer of the euphotic zone is occupied by high-light-adapted ecotypes, whereas between 80 and 150 m depth, they observed that high-light and low-light-adapted ecotypes co-occurred in the Red Sea. The distribution of high-light and low-light adapted ecotypes has been reported in several oceans, and could represent a bio-indicator of community shifts to changes in environmental conditions (Partensky et al., 1999; West and Scanlan, 1999; Johnson et al., 2006; Penno et al., 2006; Zinser et al., 2006, 2007; Rusch et al., 2010; Shibl et al., 2014).
The intrusion of waters from the Gulf of Aden did not appear to affect the distribution of surface Synechococcus in the southern Red Sea. By contrast, a clear spatial shift in the Prochlorococcus community occurred between the southern and central regions of the Red Sea (at ~19° N). Phytoplankton populations are known to be influenced by variations in chemical and physical parameters (Blanchot et al., 1992; Vaulot and Partensky, 1992; Campbell and Vaulot, 1993; Veldhuis and Kraay, 1993; Moore et al., 1995; Graziano et al., 1996). Prochlorococcus community structure appeared to be affected by the intrusion of cooler, fresher, nutrient-rich water from the Gulf of Aden (Churchill et al., 2014). Veldhuis and Kraay (1993) and Veldhuis et al. (1997) showed that fractional contribution of Prochlorococcus diminished greatly in the Arabian Sea during the southwest monsoon from May to September when strong upwelling occurs. It might be possible that the conditions encountered in the SRS (temperature, salinity, and nutrients concentrations) affect the occurrence of Prochlorococcus in these waters and thus, induce a seasonal cycle in Prochlorococcus population in this region. The remaining few percent of picophytoplankton biomass in the upper layer were mainly associated to prasinophytes (2–5% of the phytoplankton biomass) in the SRS and in the cyclonic eddy area (Figure 7D). Based on phytoplankton pigment ratios, Veldhuis and Kraay (1993) observed that the picoeukaryotes population of the southern Red Sea was attributed to the presence of prasinophytes and prymnesiophytes. Pearman et al. (2016), using molecular approaches, observed that the picophytoplankton fraction was also dominated by prasinophytes in the upper layer (0–30 m depth) of the southern region of the Red Sea, which is consistent with the observations in this study.
Nanophytoplankton were relatively abundant in the Red Sea (30–60% of the phytoplankton biomass) below 25 m along the entire transect (Figure 6B). Within the cyclonic eddy, the relative contribution of nanophytoplankton tended to decrease below 70 m depth due to the uplifting of low biomass, deeper water. At the southern part of the SRS (16.5 to 17.75° N), nananophytoplankton was higher within the DCM (±50%) and in low abundance (±30%) below the DCM. 19′HF and 19′BF revealed that the nanophytoplankton biomass was dominated by prymnesiophytes and pelagophytes, which represent 30–40% and 20–30% of the phytoplankton biomass along the whole transect, respectively (Figures 7F,G). Investigations in other oligotrophic areas revealed that prymnesiophytes and pelagophytes were prominent below the DCM (Veldhuis and Kraay, 1990; Ondrusek et al., 1991; Letelier et al., 1993; Claustre and Marty, 1995; Barlow et al., 1999; Monger et al., 1999; Ras et al., 2008). Elevated 19′HF/TChla and 19′BF/TChla ratios revealed the dominance of prymnesiophytes and pelagophytes at depths of 150–180 m in the CRS and the southern portion of the NRS (Figures 7F,G). This type of distribution has been observed in other oligotrophic areas of the global ocean (Claustre and Marty, 1995; Monger et al., 1999), but the explanation for the distribution remains unclear. The presence of a deep coccolithophorid population was advanced to explain the increase of nano-phytoplankton population with depth in the Pacific Ocean (Beaufort et al., 2007). In the Pacific Ocean, Twardowski et al. (2007) observed that increase of 19′HF/TChla was associated with an increased backscattering ratio indicating that the proportion in particles had increased. Their observed increase of backscattering ratio is consistent with the increase in 19′HF/TChla, which could be explained by the presence of coccolithophorids and associated free coccoliths at depth (Honjo and Okada, 1974). Several studies observed that some species of prymnesiophytes and pelagophytes can be found in the lower euphotic layer, at the top of the nutricline in various temperate, subtropical, and tropical open ocean regions (Molfino and McIntyre, 1990; Claustre et al., 1994; Barlow et al., 1997; Jordan and Chamberlain, 1997; Marty et al., 2002; Malinverno et al., 2003). The overall ubiquity of nanophytoplankton, in particular prymnesiophytes and pelagophytes, reflects their adaptation to the spectrum of environmental conditions (temperature, salinity, light, and nutrients availability) encountered in the different regions of the Red Sea.
As Barlow et al. (1999) observed in the Arabian Sea and Liu et al. (2009) for the global ocean, prymnesiophytes appear to be adapted to various environmental conditions that range from nutrient sufficient surface water to nutrient-depleted oligotrophic waters, from to fresher to more saline, and from cool to warm Red Sea waters. The 19′BF/19′HF ratio was used to study the distribution of prymnesiophytes and pelagophytes along the water column (not shown). The ratio increased with depth with values ranging between 0.75 and 1.75 from 90 to 200 m depth, consistent with the values found in the North Atlantic (Claustre and Marty, 1995). Claustre and Marty (1995) suggested that increase in the 19′BF/19′HF ratio at depth coincides with increasing nitrate levels in the oligotrophic environment and indicates that pelagophytes may be more efficient than prymnesiophytes in capturing light at the low levels associated with the nitracline in oligotrophic environments.
The microphytoplankton pool, characterized by Fuco, was observed in the SRS (20–40% of the phytoplankton biomass), and within the core of the cyclonic eddy in the NRS (30–60% of the phytoplankton biomass), but was very low (<15% of the phytoplankton biomass) in the region between these two features (Figures 6C, 7H). Dinoflagellates, indicated by the Peri/TChla ratio, were primarily observed in surface waters (Figure 7E) but were a small fraction of the total biomass (3–5%). This observation is consistent with observations from other oligotrophic regions (Bidigare and Ondrusek, 1996; Pearman et al., 2016). However, some dinoflagellates species lack peridinin pigments and thus caution is needed for the interpretation. Diatom distributions (20–40%) in the SRS agree with the findings of Pearman et al. (2016). They suggested that diatom abundance in this region is explained by the increase in nutrient availability from the Gulf of Aden inflow. Low diatom abundance in the NRS was observed by Sommer (2000) and Pearman et al. (2016). They attributed the quasi-absence of diatoms to nutrient limitation rather than grazing control of their population. In this study, diatoms were abundant within the cyclonic eddy near 27°N (Figure 7H). Microphytoplankton contribution to biomass increased by a factor of 3 to 8 through the water column (up to 60% of the phytoplankton biomass) compared with the water column outside of the eddy (5–20% of the phytoplankton biomass). Cyclonic mesoscale eddies have been proposed as a mechanism by which new nutrients are episodically injected into the euphotic zone, enhancing new production and shifting the phytoplankton community structure and size distribution. This new production can in turn contribute to an increased particle sinking flux (McGillicuddy and Robinson, 1997; Bibby et al., 2008; Brown et al., 2008; Rii et al., 2008; Coria-Monter et al., 2014). The observed increase in diatoms supports the view that local cyclonic mesoscale eddy dynamics result in doming of isopycnals, potentially lifting nutrient-rich water into the productive layer (defined as 1.5 times Zeu), and leading to a rapid diatom response. Phytoplankton community structure is known to affect biological carbon export to the deep ocean. Carbon flux to the deeper layer can be comprised of aggregated small organisms and other detrital material, biomass of larger organisms, and fecal pellets (Michaels and Silver, 1988; Boyd and Newton, 1999). Diatoms are believed to be very important to the rate of carbon export (Goldman, 1988, 1993). Within the cyclonic eddy, elevated Fuco/TChla were observed at depth (150–200 m; Figure 7H) and could be attributed to a flux of phytoplankton cells sinking in the deeper layer. Sweeney et al. (2003) reported that the presence of diatoms in deep waters could be attributed to sinking or to attachment to sinking aggregates, rather than a physiological adaptation to deep layers. The presence of pigment degradation related to grazing correlated well with the presence of diatoms in the SRS and within the eddy (Figures 5F, 7H), suggesting the presence of zooplankton fecal pellets (Bidigare et al., 1986). Proulx and Mazumder (1998) and Worm et al. (2002) suggested that grazing is expected to increase when nutrient supply is replete and decrease under nutrient-poor conditions.
Specific Phytoplankton Biomasses and Their Relation to Primary Production
For a quantitative comparison of phytoplankton biomass distribution in the Red Sea, concentrations of TChla, [TChla]-pico, [TChla]-nano, and [TChla]-micro were integrated over the productive layer (1.5 Zeu) (Figure 8A). The average integrated TChla biomass for each subregion was 26.25 ± 2.75, 27.36 ± 5.46, and 29.74 ± 6.93 mg m−2 for the SRS, CRS, and NRS, respectively. Picophytoplankton communities were most abundant in the CRS (15.55 ± 3.59 mg m−2). The lowest integrated [TChla]-pico (5.69 ± 2.55 mg m−2) occurred within the eddy. The distribution of the integrated [TChla]-nano supports the substantial contribution prymnesiophytes (nanophytoplankton group) in the Red Sea and suggests that prymnesiophytes are likely a ubiquitous group. The highest integrated [TChla]-nano was observed at the northern edge of the transect with a value of 22.72 mg m−2. Along the basin, integrated [TChla]-micro values were low in the CRS and NRS except within the cyclonic eddy (3.5 ± 1.8 mg m−2) and tended to increase in the SRS where concentrations ranging between 5.6 and 6.91 mg m−2 were observed. The highest integrated [TChla]-micro concentration (14.6 ± 2.94 mg m−2) was observed in the eddy.
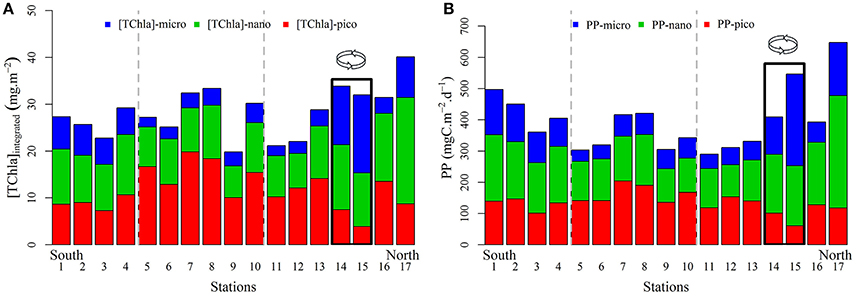
Figure 8. Distribution of the 0–1.5 Ze integrated TChla contents (mg m−2) (A) and primary production rates (mgC m−2 d−1) (B) associated to the three pigment-based size groups: pico- (red), nano- (green), and microphytoplankton (blue) for each station sampled along the transect. The stations within the eddy area are surrounded by a rectangle.
The distribution of calculated primary production was marked by high values at the southern and northern edges of the transect (500 and 650 mgC m−2 d−1, respectively) and also within the cyclonic eddy (480 ± 100 mgC m−2 d−1) where environmental conditions enhance biological responses (Figure 8B). In the SRS, primary production ranged between 360 and 500 mgC m−2 d−1, in the CRS between 300 and 420 mgC m−2 d−1 and in the NRS, between 300 and 650 mgC m−2 d−1 (Figure 8B). The rates of primary production in the Red sea are in the range of rates reported for other oligotrophic regions of the global ocean (220–600 mgC m−2 d−1) (Koblentz-Mishke et al., 1970; Knauer et al., 1990; Lohrenz et al., 1992a,b; Karl et al., 1996; Uitz et al., 2010). As expected, the contribution of picophytoplankton was highest in the CRS (49.2%). The minimum contribution of picophytoplankton occurred within the northern eddy. Nanophytoplankton accounted for 30–60% of primary production. Microphytoplankton showed the greatest variability (11–54%) in their relative contribution to the integrated productivity. Contributions of diatoms to primary production were similar or slightly higher than their contribution to phytoplankton biomass in all regions, ranging from 25–35, 12–20, 14–20, and 35–55% in the SRS, CRS, NRS, and within the eddy area, respectively. These results agree with those reported in numerous studies (Nelson and Brzezinski, 1997; Brzezinski et al., 2011; Krause et al., 2011). Each of these studies demonstrates similar disproportionate importance of diatoms in primary production relative to their biomass, suggesting that diatoms play quantitatively significant roles in biogeochemical cycles. Numerous studies have also shown that mesoscale features can be disproportionately important for primary production, nutrient cycling, and trophic ecology (Nelson and Smith, 1986; Yoder et al., 1994; Powell and Ohman, 2015). Within these features, diatoms biomass may be stimulated and increase primary production in response to their high growth and grazing rates (in contrast to areas beyond the eddy; Benitez-Nelson et al., 2007; McGillicuddy et al., 2007; Krause et al., 2009a,b, 2010; Taylor et al., 2012). Microphytoplankton are known to develop in a dynamic environment where nutrients and light are available (Malone, 1981; Goldman, 1993; as is the case in the SRS), in upwelling systems (e.g., cyclonic eddy) and where vertical mixing episodically delivers new nutrients into the euphotic zone. Because of their response to available nutrients microphytoplankton generally increase the total primary production of an area.
Conclusions
The present study demonstrates that pigment-based phytoplankton community structure and primary production vary along the central axis of the Red Sea from the surface to 200 m depth. Depth profiles of phytoplankton pigments and primary production distribution revealed differences between the main regions of the Red Sea, revealing the response of various phytoplankton communities to the varying environmental conditions prevailing in the Red Sea. To our knowledge, until now only Chlorophyll a derived from ocean color has been used to study phytoplankton seasonality in the Red Sea (Acker et al., 2008; Raitsos et al., 2013). Although phytoplankton community structure and primary production were documented for the winter-spring period, this study is the most complete survey at the basin scale. From the distribution of phytoplankton biomass and primary production, it is clear that the Red Sea cannot be treated as a homogeneous oligotrophic water body. Large scale and mesoscale variability were documented in this study. A differential phytoplankton community and primary production was observed to be associated with the cyclonic eddy: there was a large contribution of diatoms within the core of the eddy which are usually only observed in the southern waters of the Red Sea. The central Red Sea, the most oligotrophic part of the Red Sea, was mainly dominated by a picophytoplankton population. The southern Red Sea which experiences inflow from the Gulf of Aden is where the contribution of diatoms increased and the picophytoplankton contribution decreased. Therefore, relatively high rates of primary production were observed in the southern region (428 ± 58 mgC m−2 d−1), in the cyclonic eddy (480 ± 100 mgC m−2 d−1) and in the northern region (650 mgC m−2 d−1) where deeper vertical mixing was observed. The central Red Sea appeared to be the most oligotrophic region where smaller phytoplankton dominated the community and where primary production was low (351 ± 54 mgC m−2 d−1). Assessing changes in primary production associated with pico-, nano-, and microphytoplankton groups provides a significant improvement to understanding and quantifying the carbon cycle in the Red Sea. Nevertheless, our results are based on a combination of the pigment-based approach and a bio-optical model for the retrieval of the primary production. Further work is required to compare our estimates with rates measured using isotopic (13/14C or 15N) uptake rates.
Author Contributions
MK, MO, and BJ designed the study. MK, MO, BG, and BJ carried out fieldwork, analyzed the samples, and processed the data. MK and MO interpreted the data and wrote the manuscript. HC, JU, MO, and BJ provided editorial advices.
Funding
This study is funded by the King Abdullah University of Science and Technology (KAUST), Kingdom of Saudi Arabia.
Conflict of Interest Statement
The authors declare that the research was conducted in the absence of any commercial or financial relationships that could be construed as a potential conflict of interest.
Acknowledgments
The authors express their gratitude to the scientists, officers, and crews of the research vessel Thuwal and also the Coastal and Marine Resources Core Lab for logistical support and assistance onboard during the fieldwork. We are grateful to the Analytical Core Lab for providing facilities for the analyses of the samples collected during the fieldwork. U. Langner is cordially thanked for plotting the map of the Red Sea and J. Otoadese for proof-reading the manuscript. The authors would thank the reviewers for their constructive comments toward improving the manuscript. The data presented in this study are available from the authors upon request (bWFsaWthLmtoZWlyZWRkaW5lQGthdXN0LmVkdS5zYQ==).
References
Acker, J., Leptoukh, G., Shen, S., Zhu, T., and Kempler, S. (2008). Remotely-sensed chlorophyll a observations of the northern Red Sea indicate seasonal variability and influence of coastal reefs. J. Mar. Syst. 69, 191–204. doi: 10.1016/j.jmarsys.2005.12.006
Acosta, F., Ngugi, D. K., and Stingl, U. (2013). Diversity of picoeukaryotes at an oligotrophic site off the Northeastern Red Sea Coast. Aquat. Biosyst. 9:16. doi: 10.1186/2046-9063-9-16
Al-Najjar, T., Badran, M. I., Richter, C., Meyerhoefer, M., and Sommer, U. (2007). Seasonal dynamics of phytoplankton in the Gulf of Aqaba, Red Sea. Hydrobiologia 579, 69–83. doi: 10.1007/s10750-006-0365-z
Barlow, R. G., Mantoura, R. F. C., and Cummings, D. G. (1999). Monsoonal influence on the distribution of phytoplankton pigments in the Arabian Sea. Deep-Sea Res. Part II-Top. Stud. Oceanogr. 46, 677–699. doi: 10.1016/S0967-0645(98)00123-4
Barlow, R. G., Mantoura, R. F. C., Cummings, D. G., and Fileman, T. W. (1997). Pigment chemotaxonomic distributions of phytoplankton during summer in the western Mediterranean, Deep-Sea Res. Part II-Top. Stud. Oceanogr. 44, 833–850. doi: 10.1016/S0967-0645(96)00089-6
Beaufort, L., Couapela, M., Bucheta, N., and Claustre, H. (2007). Calcite production by Coccolithophores in the South Pacific Ocean: from desert to jungle. Biogeosci. Discuss. 4, 3267–3299. doi: 10.5194/bgd-4-3267-2007
Belkin, I. M. (2009). Rapid warming of Large Marine Ecosystems. Prog. Oceanogr. 81, 207–213. doi: 10.1016/j.pocean.2009.04.011
Benitez-Nelson, C. R., Bidigare, R. R., Dickey, T. D., Landry, M. R., Leonard, C. L., Brown, S. L., et al. (2007). Mesoscale eddies drive increased silica export in the subtropical Pacific Ocean. Science 316, 1017–1021. doi: 10.1126/science.1136221
Bibby, T. S., Gorbunov, M. Y., Wyman, K. W., and Falkowski, P. G. (2008). Photosynthetic community responses to upwelling in mesoscale eddies in the subtropical North Atlantic and Pacific Oceans. Deep-Sea Res. Part II-Top. Stud. Oceanogr. 55, 1310–1320. doi: 10.1016/j.dsr2.2008.01.014
Bidigare, R. R., and Ondrusek, M. E. (1996). Spatial and temporal variabilityof phytoplankton pigment distributions in the central equatorial Pacific Ocean. Deep-Sea Res. II 43, 809–833. doi: 10.1016/0967-0645(96)00019-7
Bidigare, R. R., Frank, T. J., Zastrow, C., and Brooks, J. M. (1986). The distribution of algal chlorophylls and their degradation products in the Southern Ocean. Deep-Sea Res. Part A Oceanogr. Res. Papers 33, 923–937.
Blanchot, J., Rodier, M., and Lebouteiller, A. (1992). Effect of El Niño Southern Oscillation events on the distribution and abundance of phytoplankton in the Western Pacific Tropical Ocean along 165°E. J. Plankton Res. 14, 137–156. doi: 10.1093/plankt/14.1.137
Boyd, P. W., and Newton, P. P. (1999). Does planktonic community structure determine downward particulate organic carbon flux in different oceanic provinces? Deep Sea Res. Part I 46, 63–91. doi: 10.1016/S0967-0637(98)00066-1
Brown, S. L., Landry, M. R., Selph, K. E., Yang, E. J., Rii, Y. M., and Bidigare, R. R. (2008). Diatoms in the desert: plankton community response to a mesoscale eddy in the subtropical North Pacific. Deep-Sea Res. Part II Top. Stud. Oceanogr. 55, 1321–1333. doi: 10.1016/j.dsr2.2008.02.012
Brzezinski, M. A., Baines, S. B., Balch, W. M., Beucher, C. P., Chai, F., Dugdale, R. C., et al. (2011). Co-limitation of diatoms by iron and silicic acid in the equatorial Pacific. Deep Sea Res. Part II 58, 493–511. doi: 10.1016/j.dsr2.2010.08.005
Buesseler, K. O. (1998). The decoupling of production and particulate export in the surface ocean. Global Biogeochem. Cycles 12, 297–310. doi: 10.1029/97GB03366
Campbell, L., and Vaulot, D. (1993). Photosynthetic picoplankton community structure in the subtropical North Pacific Ocean near Hawaii (station ALOHA). Deep Sea Res. Part I-Oceanogr. Res. Papers 40, 2043–2060. doi: 10.1016/0967-0637(93)90044-4
Campbell, L., Nolla, H. A., and Vaulot, D. (1994). The importance of Prochlorococcus community in the central North Pacific Ocean. Limnol. Oceanogr. 39, 954–961. doi: 10.4319/lo.1994.39.4.0954
Churchill, J. H., Bower, A. S., McCorkle, D. C., and Abualnaja, Y. (2014). The transport of nutrient-rich Indian Ocean water through the Red Sea and into coastal reef systems. J. Mar. Res. 72, 165–181. doi: 10.1357/002224014814901994
Claustre, H. (1994). The trophic status of various oceanic provinces revealed by phytoplankton pigment signatures. Limnol. Oceanogr. 39, 1206–1210. doi: 10.4319/lo.1994.39.5.1206
Claustre, H., and Marty, J. C. (1995). Specific phytoplankton biomasses and their relation to primary production in the tropical North-Atlantic. Deep Sea Res. Part I-Oceanogr. Res. Pap. 42, 1475–1493. doi: 10.1016/0967-0637(95)00053-9
Claustre, H., Kerhervé, P., Marty, J. C., Prieur, L., Videau, C., and Hecq, J.-H. (1994). Phytoplankton dynamics associated with a geostrophic front: ecological and biogeochemical implications. J. Mar. Res. 52, 711–742. doi: 10.1357/0022240943077000
Coleman, M. L., and Chisholm, S. W. (2007). Code and context: Prochlorococcus as a model for cross-scale biology. Trends Microbiol. 15, 398–407. doi: 10.1016/j.tim.2007.07.001
Coria-Monter, E., Adela Monreal-Gomez, M., Alberto Salas-de-Leon, D., Aldeco-Ramirez, J., and Merino-Ibarra, M. (2014). Differential distribution of diatoms and dinoflagellates in a cyclonic eddy confined in the Bay of La Paz, Gulf of California. J. Geophys. Res. Oceans 119, 6258–6268. doi: 10.1002/2014JC009916
Cullen, H. M., Kaplan, A., Arkin, P. A., and Demenocal, P. B. (2002). Impact of the North Atlantic Oscillation on Middle Eastern climate and streamflow. Climatic Change 55, 315–338. doi: 10.1023/A:1020518305517
Cuvelier, M. L., Allen, A. E., Monier, A., McCrow, J. P., Messié, M., Tringe, S. G., et al. (2010). Targeted metagenomics and ecology of globally important uncultured eukaryotic phytoplankton. Proc. Natl. Acad. Sci. 107, 14679–14684. doi: 10.1073/pnas.1001665107
Doney, S. C., Balch, W. M., Fabry, V. J., and Feely, R. A. (2009a). Ocean acidification: a critical emerging problem for the Ocean Sciences. Oceanography 22, 16–25. doi: 10.5670/oceanog.2009.93
Doney, S. C., Fabry, V. J., Feely, R. A., and Kleypas, J. A. (2009b). Ocean acidification: the other CO2 Problem. Ann. Rev. Mar. Sci. 1, 169–192. doi: 10.1146/annurev.marine.010908.163834
Doney, S. C., Lima, I., Feely, R. A., Glover, D. M., Lindsay, K., Mahowald, N., et al. (2009c). Mechanisms governing interannual variability in upper-ocean inorganic carbon system and air-sea CO2 fluxes: physical climate and atmospheric dust. Deep Sea Res. Part II-Top. Stud. Oceanogr. 56, 640–655. doi: 10.1016/j.dsr2.2008.12.006
Doney, S. C., Lima, I., Moore, J. K., Lindsay, K., Behrenfeld, M. J., Westberry, T. K., et al. (2009d). Skill metrics for confronting global upper ocean ecosystem-biogeochemistry models against field and remote sensing data. J. Mar. Syst. 76, 95–112. doi: 10.1016/j.jmarsys.2008.05.015
Doney, S. C., Tilbrook, B., Roy, S., Metzl, N., Le Quere, C., Hood, M., et al. (2009e). Surface-ocean CO2 variability and vulnerability. Deep Sea Res. Part II-Top. Stud. Oceanogr. 56, 504–511. doi: 10.1016/j.dsr2.2008.12.016
Edwards, M., and Richardson, A. J. (2004). Impact of climate change on marine pelagic phenology and trophic mismatch. Nature 430, 881–884. doi: 10.1038/nature02808
Goericke, R., and Repeta, D. J. (1992). The Pigments of Prochlorococcus-marinus- the presence of divinyl chlorophyll-a and chlorophyll-b in a marine prokaryote. Limnol. Oceanogr. 37, 425–433. doi: 10.4319/lo.1992.37.2.0425
Goldman, J. C. (1988). “Spatial and temporal discontinuities of biological processes in pelagic surface waters,” in Toward a Theory on Biological-Physical Interactions in the World Ocean. ed B. J. Rothschild (Springer Netherlands), 273–296. doi: 10.1007/978-94-009-3023-0_15
Goldman, J. C. (1993). Potential role of large oceanic diatoms in new primary production. Deep Sea Res. Part I-Oceanogr. Res. Pap. 40, 159–168. doi: 10.1016/0967-0637(93)90059-C
Graziano, L. M., Geider, R. J., Li, W. K. W., and Olaizola, M. (1996). Nitrogen limitation of North Atlantic phytoplankton: analysis of physiological condition in nutrient enrichment experiments. Aquat. Microb. Ecol. 11, 53–64. doi: 10.3354/ame011053
Hansen, B., Bjornsen, P. K., and Hansen, P. J. (1994). The size ratio between planktonic predators and their prey. Limnol. Oceanogr. 39, 395–403. doi: 10.4319/lo.1994.39.2.0395
Hirata, T., Hardman-Mountford, N. J., Brewin, R. J. W., Aiken, J., Barlow, R., Suzuki, K., et al. (2011). Synoptic relationships between surface Chlorophyll-a and diagnostic pigments specific to phytoplankton functional types. Biogeosciences 8, 311–327. doi: 10.5194/bg-8-311-2011
Honjo, S., and Okada, H. (1974). Community structure of coccolithophores in the photic layer of the mid-Pacific. Micropaleontology 20, 209–230. doi: 10.2307/1485061
Hooker, S. B., Van Heukelem, L., Thomas, C. S., Claustre, H., Ras, J., Barlow, R., et al. (2005). The Second SeaWiFS HPLC Analysis Round-Robin Experiment (SeaHARRE-2). NASA, Goddard Space Flight Center, Maryland, Technical Memorandum NASA/TM-2005-212787, 112.
Huertas, I. E., Rouco, M., López-Rodas, V., and Costas, E. (2011). Warming will affect phytoplankton differently: evidence through a mechanistic approach. Proc. R. Soc. 278, 3534–3543. doi: 10.1098/rspb.2011.0160
Ismael, A. A. (2015). “Phytoplankton of the Red Sea,” in The Red Sea, eds N. M. A. Rasul and I. C. F. Stewart (Berlin; Heidelberg: Springer), 567–583. doi: 10.1007/978-3-662-45201-1_32
Jardillier, L., Zubkov, M. V., Pearman, J., and Scanlan, D. J. (2010). Significant CO2 fixation by small prymnesiophytes in the subtropical and tropical northeast Atlantic Ocean. ISME J. 4, 1180–1192. doi: 10.1038/ismej.2010.36
Jeffrey, S. W., and Vesk, M. (1997). “Introduction to marine phytoplankton and their pigment signatures,” in Phytoplankton Pigment in Oceanography: Guidelines to Modern Methods, eds S. W. Jeffrey, R. F. C. Mantoura, and S. W. Wright (UNESCO), 33–84.
Jennings, S., Warr, K. J., and Mackinson, S. (2002). Use of size-based production and stable isotope analyses to predict trophic transfer efficiencies and predator-prey body mass ratios in food webs. Mar. Ecol. Prog. Ser. 240, 11–20. doi: 10.3354/meps240011
Johnson, Z. I., Zinser, E. R., Coe, A., McNulty, N. P., Woodward, E. M. S., and Chisholm, S. W. (2006). Niche partitioning among Prochlorococcus ecotypes along ocean-scale environmental gradients. Science 311, 1737–1740. doi: 10.1126/science.1118052
Jordan, R. W., and Chamberlain, A. H. L. (1997). Biodiversity among haptophyte algae. Biodivers. Conserv. 6, 131–152. doi: 10.1023/A:1018383817777
Karl, D. M., Christian, J. R., Dore, J. E., Hebel, D. V., Letelier, R. M., Tupas, L. M., et al. (1996). Seasonal and interannual variability in primary production and particle flux at Station ALOHA. Deep Sea Res. Part II-Top. Stud. Oceanogr. 43, 539–568. doi: 10.1016/0967-0645(96)00002-1
Knauer, G. A., Redalje, D. G., Harrison, W. G., and Karl, D. M. (1990). New production at the VERTEX time-series site. Deep Sea Res. Part A Oceanogr. Res. Pap. 37, 1121–1134.
Koblentz-Mishke, J., Volkovinsky, V V., and Kabanova Yu, G. (1970). “Plankton primary production in the World Ocean,” in Scientific Exploration of the South Pacific Ocean, ed. W. Wooster (Washington, DC: National Academy of Sciences), 183–19.
Krause, J. W., Lomas, M. W., and Nelson, D. M. (2009a). Biogenic silica at the Bermuda Atlantic time-series study site in the Sargasso Sea: temporal changes and their inferred controls based on a 15-year record. Global Biogeochem. Cycles 23:GB3004. doi: 10.1029/2008GB003236
Krause, J. W., Nelson, D. M., and Brzezinski, M. A. (2011). Biogenic silica production and the diatom contribution to primary production and nitrate uptake in the eastern equatorial Pacific Ocean. Deep Sea Res. Part II 58, 434–448. doi: 10.1016/j.dsr2.2010.08.010
Krause, J. W., Nelson, D. M., and Lomas, M. W. (2009b). Biogeochemical responses to late-winter storms in the Sargasso Sea, II: Increased rates of biogenic silica production and export. Deep Sea Res. Part I Oceanogr. Res. Pap. 56, 861–874. doi: 10.1016/j.dsr.2009.01.002
Krause, J. W., Nelson, D. M., and Lomas, M. W. (2010). Production, dissolution, accumulation, and potential export of biogenic silica in a Sargasso Sea mode-water eddy. Limnol. Oceanogr. Methods. 55, 569–579. doi: 10.4319/lo.2010.55.2.0569
Le Quéré, C., Harrison, S. P., Prentice, C., Buitenhuis, E. T., Aumont, O., Bopp, L., et al. (2005). Ecosystem dynamics based on plankton functional types for global ocean biogeochemistry models. Global Change Biol. 11, 2016–2040. doi: 10.1111/j.1365-2486.2005.1004.x
Legendre, L., and Lefevre, J. (1989). “Hydrodynamical singularities as controls of recycled versus export production in oceans,” in Productivity of the Ocean: Present and Past, eds W. H. Berger, V. S. Smetacek, and G. Wefer (Chichester: Wiley), 49–63.
Legendre, L., and Rassoulzadegan, F. (1995). Plankton and nutrient dynamics in marine waters. Ophelia 41, 153–172. doi: 10.1080/00785236.1995.10422042
Letelier, R. M., Bidigare, R. R., Hebel, D. V., Ondrusek, M., Winn, C. D., and Karl, D. M. (1993). Temporal variability of phytoplankton community structure based on pigment analysis. Limnol. Oceanogr. 38, 1420–1437. doi: 10.4319/lo.1993.38.7.1420
Liu, H., Probert, I., Uitz, J., Claustre, H., Aris-Brosou, S., Frada, M., et al. (2009). Extreme diversity in noncalcifying haptophytes explains a major pigment paradox in open oceans. Proc. Natl. Acad. Sci. U.S.A. 106, 12803–12808. doi: 10.1073/pnas.0905841106
Lohrenz, S. E., Knauer, G. A., Asper, V. L., Tuel, M., Michaels, A. F., and Knap, A. H. (1992a). Seasonal variability in primary production particle flux in the northwestern Sargasso Sea: U.S. JGOFS Bermuda Atlantic time-series study. Deep Sea Res. Part A Oceanogr. Res. Pap. 39, 1373–1391. doi: 10.1093/plankt/14.2.201
Lohrenz, S. E., Wiesenburg, D. A., Rein, C. R., Arnone, R. A., Taylor, C. D., Knauer, G. A., et al. (1992b). A comparison of in situ and simulated in situ methods for estimating oceanic primary production. J. Plankton Res. 14, 201–221.
Longhurst, A. R. (2007). “Toward an ecological geography of the sea,” in Ecological Geography of the Sea, Academic, 2nd Edn. (San Diego, CA), 1–17. doi: 10.1016/B978-012455521-1/50002-4
Mackey, M. D., Mackey, D. J., Higgins, H. W., and Wright, S. W. (1996). CHEMTAX - A program for estimating class abundances from chemical markers: application to HPLC measurements of phytoplankton. Mar. Ecol. Prog. Ser. 144, 265–283. doi: 10.3354/meps144265
Malinverno, E., Ziveri, P., and Corselli, C. (2003). Coccolithophorid distribution in the Ionian Sea and its relationship to eastern Mediterranean circulation during late fall to early winter 1997. J. Geophys. Res. 108:8115. doi: 10.1029/2002JC001346
Malone, T. C. (1981). “Algal size,” in The Physiological Ecology of Phytoplankton, eds. I. Morris (Berkeley, CA: University of California), 433–463.
Mann, K. H., and Lazier, J. R. N. (eds.). (2006). “Vertical structure of the open ocean: biology of the mixed layer,” in Dynamics of Marine Ecosystems, 3rd Edn. (Malden, MA: Blackwell Publishing Ltd.), 68–117. doi: 10.1002/9781118687901
Margalef, R. (1978). Life-forms of phytoplankton as survival alternatives in an unstable environment. Oceanol. Acta 1, 493–509.
Marty, J. C., Chiavérini, J., Pizay, M. D., and Avril, B. (2002). Seasonal and interannual dynamics of nutrients and phytoplankton pigments in the western Mediterranean Sea at the DYFAMED time-series station (1991–1999). Deep Sea Res. Part II 49, 1965–1985. doi: 10.1016/S0967-0645(02)00022-X
McGillicuddy, D. J., and Robinson, A. R. (1997). Eddy-induced nutrient supply and new production in the Sargasso Sea. Deep Sea Res. Part I-Oceanogr. Res. Pap. 44, 1427–1450. doi: 10.1016/S0967-0637(97)00024-1
McGillicuddy, D. J., Anderson, L. A., Bates, N. R., Bibby, T., Buesseler, K. O., Carlson, C. A., et al. (2007). Eddy/wind interactions stimulate extraordinary mid-ocean plankton blooms. Science 316, 1021–1026. doi: 10.1126/science.1136256
Michaels, A. F., and Silver, M. W. (1988). Primary production, sinking fluxs and the microbial food web. Deep Sea Res. Part A-Oceanogr. Res. Pap. 35, 473–490.
Molfino, B., and McIntyre, A. (1990). Precessional forcing of nutricline dynamics in the equatorial Atlantic. Science 249:766. doi: 10.1126/science.249.4970.766
Monger, B. C., Landry, M. R., and Brown, S. L. (1999). Feeding selection of heterotrophic marine nanoflagellates based on the surface hydrophobicity of their picoplankton prey. Limnol. Oceanogr. 44, 1917–1927. doi: 10.4319/lo.1999.44.8.1917
Moon-van der Staay, S. Y., van der Staay, G. W., Guillou, L., Vaulot, D., Claustre, H., and Medlin, L. K. (2000). Abundance and diversity of prymnesiophytes in the picoplankton coμmunity from the equatorial Pacific Ocean inferred from 18S rDNA sequences. Limnol. Oceanogr. 45, 98–109. doi: 10.4319/lo.2000.45.1.0098
Moore, L. R., and Chisholm, S. W. (1999). Photophysiology of the marine cyanobacterium Prochlorococcus: ecotypic differences among cultured isolates. Limnol. Oceanogr. 44, 628–638. doi: 10.4319/lo.1999.44.3.0628
Moore, L. R., Goericke, R., and Chisholm, S. W. (1995). Comparative Physiology of Synechococcus and Prochlorococcus—influence of light and temperature on growth, pigments, fluorescence and absorptive properties. Mar. Ecol. Prog. Ser. 116, 259–275. doi: 10.3354/meps116259
Moore, L. R., Rocap, G., and Chisholm, S. W. (1998). Physiology and molecular phylogeny of coexisting Prochlorococcus ecotypes. Nature 393, 464–467. doi: 10.1038/30861
Morel, A., and Andre, J. M. (1991). Pigment distribution and primary production in the Western Mediterranean as derived and modeled from Coastal Zone Color Scanner observations. J. Geophys. Res. Oceans 96, 12685–12698.
Morel, A., and Maritorena, S. (2001). Bio-optical properties of oceanic waters: A reappraisal. J. Geophys. Res. Oceans 106, 7163–7180. doi: 10.1029/2000JC000319
Nair, A., Sathyendranath, S., Platt, T., Morales, J., Stuart, V., Forget, M. H., et al. (2008). Remote sensing of phytoplankton functional types. Remote Sens. Environ. 112, 3366–3375. doi: 10.1016/j.rse.2008.01.021
Nandkeolyar, N., Raman, M., Sandhya Kiran, G., and Ajai (2013). Comparative analysis of sea surface temperature pattern in the Eastern and Western Gulfs of Arabian Sea and the Red Sea in recent past using satellite data. Int. J. Oceanogr. 2013, 16. doi: 10.1155/2013/501602
Nassar, M. Z., Mohamed, H. R., Khiray, H. M., and Rashedy, S. H. (2014). Seasonal fluctuations of phytoplankton community and physico-chemical parameters of the north western part of the Red Sea, Egypt. Egypt. J. Aquat. Res. 40, 395–403. doi: 10.1016/j.ejar.2014.11.002
Nelson, D. M., and Brzezinski, M. A. (1997). Diatom growth and productivity in an oligotrophic midocean gyre: a 3-yr record from the Sargasso Sea near Bermuda. Limnol. Oceanogr. 42, 473–486. doi: 10.4319/lo.1997.42.3.0473
Nelson, D. M., and Smith, W. O. (1986). Phytoplankton bloom dynamics of the western Ross Sea ice edge—II. Mesoscale cycling of nitrogen and silicon. Deep Sea Res. Part I Oceanogr. Res. Pap. 33, 1389–1412. doi: 10.1016/0198-0149(86)90042-7
Neumann, A. C., and McGill, D. A. (1962). Circulation of the Red Sea in early summer. Deep Sea Res. 8, 223–235.
Olson, R. J., Chisholm, S. W., Zettler, E. R., and Armbrust, E. V. (1990). Pigments, size, and distributions of Synechococcus in the North Atlantic and Pacific Oceans. Limnol. Oceanogr. 35, 45–58. doi: 10.4319/lo.1990.35.1.0045
Ondrusek, M. E., Bidigare, R. R., Sweet, S. T., Defreitas, D. A., and Brooks, J. M. (1991). Distribution of phytoplankton pigments in the North Pacific Ocean in relation to physical and optical variability. Deep Sea Res. Part A Oceanogr. Res. Pap. 38, 243–266.
Partensky, F., Hess, W. R., and Vaulot, D. (1999). Prochlorococcus, a marine photosynthetic prokaryote of global significance. Microbiol. Mol. Biol. Rev. 63, 106–127.
Partensky, F., LaRoche, J., Wyman, K., and Falkowski, P. G. (1997). The divinyl-chlorophyll a/b-protein complexes of two strains of the oxyphototrophic marine prokaryote Prochlorococcus - Characterization and response to changes in growth irradiance. Photosynth. Res. 51, 209–222. doi: 10.1023/A:1005807408161
Patzert, W. C. (1974). Wind-induced reversal in Red Sea circulation. Deep Sea Res. 21, 109–121. doi: 10.1016/0011-7471(74)90068-0
Pearman, J. K., Kurten, S., Sarma, Y. V. B., Jones, B. H., and Carvalho, S. (2016). Biodiversity patterns of plankton assemblages at the extremes of the Red Sea. FEMS Microbiol. Ecol. 92:fiw002. doi: 10.1093/femsec/fiw002
Peinert, R., Vonbodungen, B., and Smetacek, V. S. (1989). “Food web structure and loss rate,” in Productivity of the Ocean: Present and Past, eds W. H. Berger, V. S. Smetacek, and G. Wefer (Chichester: Wiley), 35–48.
Penno, S., Lindell, D., and Post, A. F. (2006). Diversity of Synechococcus and Prochlorococcus populations determined from DNA sequences of the N-regulatory gene ntcA. Environ. Microbiol. 8, 1200–1211. doi: 10.1111/j.1462-2920.2006.01010.x
Powell, J. R., and Ohman, M. D. (2015). Covariability of zooplankton gradients with glider-detected density fronts in the Southern California current system. Deep Sea Research Part II: Top. Stud. Oceanogr. 112, 79–90. doi: 10.1016/j.dsr2.2014.04.002
Proulx, M., and Mazumder, A. (1998). Reversal of grazing impact on plant species richness in nutrient-poor vs. nutrient-rich ecosystems. Ecology 79, 2581–2592. doi: 10.1890/0012-9658(1998)079[2581:ROGIOP]2.0.CO;2
Racault, M.-F., Raitsos, D. E., Berumen, M. L., Brewin, R. J. W., Platt, T., Sathyendranath, S., et al. (2015). Phytoplankton phenology indices in coral reef ecosystems: application to ocean-color observations in the Red Sea. Remote Sens. Environ. 160, 222–234. doi: 10.1016/j.rse.2015.01.019
Raitsos, D. E., Hoteit, I., Prihartato, P. K., Chronis, T., Triantafyllou, G., and Abualnaja, Y. (2011). Abrupt warming of the Red Sea. Geophys. Res. Lett. 38:L14601 doi: 10.1029/2011GL047984
Raitsos, D. E., Pradhan, Y., Brewin, R. J. W., Stenchikov, G., and Hoteit, I. (2013). Remote sensing the phytoplankton seasonal succession of the Red Sea. Plos ONE 8:e64909. doi: 10.1371/journal.pone.0064909
Ras, J., Claustre, H., and Uitz, J. (2008). Spatial variability of phytoplankton pigment distributions in the Subtropical South Pacific Ocean: comparison between in situ and predicted data. Biogeosciences 5, 353–369. doi: 10.5194/bg-5-353-2008
Rii, Y. M., Brown, S. L., Nencioli, F., Kuwahara, V., Dickey, T., Karl, D. M., et al. (2008). The transient oasis: nutrient-phytoplankton dynamics and particle export in Hawaiian lee cyclones. Deep Sea Res. Part II-Top. Stud. Oceanogr. 55, 1275–1290. doi: 10.1016/j.dsr2.2008.01.013
Rocap, G., Distel, D. L., Waterbury, J. B., and Chisholm, S. W. (2002). Resolution of Prochlorococcus and Synechococcus ecotypes by using 16S-23S ribosomal DNA internal transcribed spacer sequences. Appl. Environ. Microbiol. 68, 1180–1191. doi: 10.1128/AEM.68.3.1180-1191.2002
Roy, S., Llewellyn, C. A., Egeland, E. S., and Johnsen, G. (2011). Phytoplankton Pigments: Characterization, Chemotaxonomy and Applications in Oceanography. Cambridge: Cambridge University Press.
Rusch, D. B., Martiny, A. C., Dupont, C. L., Halpern, A. L., and Venter, J. C. (2010). Characterization of Prochlorococcus clades from iron-depleted oceanic regions. Proc. Natl. Acad. Sci. U.S.A. 107, 16184–16189. doi: 10.1073/pnas.1009513107
Sawall, Y., Al-Sofyani, A., Banguera-Hinestroza, E., and Voolstra, C. R. (2014). Spatio-temporal analyses of Symbiodinium physiology of the coral Pocillopora verrucosa along large-scale nutrient and temperature gradients in the Red Sea. PloS ONE 9:e103179. doi: 10.1371/journal.pone.0103179
Scharf, F. S., Juanes, F., and Rountree, R. A. (2000). Predator size - prey size relationships of marine fish predators: interspecific variation and effects of ontogeny and body size on trophic-niche breadth. Mar. Ecol. Prog. Ser. 208, 229–248. doi: 10.3354/meps208229
Shaikh, E. A., Roff, J. C., and Dowidar, N. M. (1986). Phytoplankton ecology and production in the Red-Sea off Jiddah, Saudi-Arabia. Mar. Biol. 92, 405–416. doi: 10.1007/BF00392681
Shibl, A. A., Haroon, M. F., Ngugi, D. K., Thompson, L. R., and Stingl, U. (2016). Distribution of Prochlorococcus Ecotypes in the Red Sea Basin based on analyses of rpoC1 Sequences. Front. Mar. Sci. 3:12490. doi: 10.1111/1574-6968.12490
Shibl, A. A., Thompson, L. R., Ngugi, D. K., and Stingl, U. (2014). Distribution and diversity of Prochlorococcus ecotypes in the Red Sea. FEMS Microbiolo. Lett. 356, 118–126. doi: 10.1111/1574-6968.12490
Sofianos, S. S., and Johns, W. E. (2003). An Oceanic General Circulation Model (OGCM) investigation of the Red Sea circulation: 2. Three-dimensional circulation in the Red Sea. J. Geophys. Res. Oceans 108:3066 doi: 10.1029/2001JC001184
Sofianos, S. S., and Johns, W. E. (2007). Observations of the summer red sea circulation. J. Geophs. Res. Part C Oceans 112, 1–20. doi: 10.1029/2006JC003886
Sofianos, S. S., Johns, W. E., and Murray, S. P. (2002). Heat and freshwater budgets in the Red Sea from direct observations at Bab el Mandeb. Deep Sea Res. Part II 49, 1323–1340. doi: 10.1016/S0967-0645(01)00164-3
Sommer, U. (2000). Scarcity of medium-sized phytoplankton in the northern Red Sea explained by strong bottom-up and weak top-down control. Mar. Ecol. Prog. Ser. 197, 19–25. doi: 10.3354/meps197019
Sommer, U., Berninger, U. G., Böttger-Schnack, R., Cornils, S., Hagen, W., Hansen, T., et al. (2002). Grazing during early spring in the Gulf of Aqaba and the Northern Red Sea. Mar. Ecol. Prog. Ser. 239, 251–261. doi: 10.3354/meps239251
Sweeney, E. N., McGillicuddy, D. J. Jr., and Buesseler, K. O. (2003). Biogeochemical impacts due to mesoscale eddy activity in the Sargasso Sea as measured at the Bermuda Atlantic Time-series Study (BATS). Deep Sea Res. II Top. Stud. Oceanogr. 50, 3017–3039. doi: 10.1016/j.dsr2.2003.07.008
Taylor, A. G., Goericke, R., Landry, M. R., Selph, K. E., Wick, D. A., and Roadman, M. J. (2012). Sharp gradients in phytoplankton community structure across a frontal zone in the California Current Ecosystem. J. Plankton Res. 34, 778–789. doi: 10.1093/plankt/fbs036
Treusch, A. H., Demir-Hilton, E., Vergin, K. L., Worden, A. Z., Carlson, C. A., Donatz, M. G., et al. (2012). Phytoplankton distribution patterns in the northwestern Sargasso Sea revealed by small subunit rRNA genes from plastids. ISME J. 6, 481–492. doi: 10.1038/ismej.2011.117
Triantafyllou, G., Yao, F., Petihakis, G., Tsiaras, K. P., Raitsos, D. E., and Hoteit, I. (2014). Exploring the Red Sea seasonal ecosystem functioning using a three-dimensional biophysical model. J. Geophys. Res. Oceans 119, 1791–1811. doi: 10.1002/2013JC009641
Twardowski, M. S., Claustre, H., Freeman, S. S. D., and Huot, Y. (2007). Optical backscattering properties of the “clearest” natural waters. Biogeosciences 4, 2441–2491. doi: 10.5194/bgd-4-2441-2007
Uitz, J., Claustre, H., Gentili, B., and Stramski, D. (2010). Phytoplankton class-specific primary production in the world's oceans: Seasonal and interannual variability from satellite observations. Global Biogeochem. Cycles 24:GB3016. doi: 10.1029/2009GB003680
Uitz, J., Claustre, H., Morel, A., and Hooker, S. B. (2006). Vertical distribution of phytoplankton communities in open ocean: an assessment based on surface chlorophyll. J. Geophys. Res. Oceans 111:C08005. doi: 10.1029/2005JC003207
Uitz, J., Huot, Y., Bruyant, F., Babin, M., and Claustre, H. (2008). Relating phytoplankton photophysiological properties to community structure on large scales. Limnol. Oceanogr. 53, 614–630. doi: 10.4319/lo.2008.53.2.0614
Uitz, J., Stramski, D., Reynolds, R. A., and Dubranna, J. (2015). Assessing phytoplankton community composition from hyperspectral measurements of phytoplankton absorption coefficient and remote-sensing reflectance in open-ocean environments. Remote Sens. Environ. 171, 58–74. doi: 10.1016/j.rse.2015.09.027
Van den Meersche, K., Soetaert, K., and Middelburg, J. J. (2008). A Bayesian compositional estimator for microbial taxonomy based on biomarkers, Limnol. Oceanogr. Methods 6, 190–199. doi: 10.4319/lom.2008.6.190
Vaulot, D., and Partensky, F. (1992). Cell cycle distributions of prochlorophytes in the north western Mediterranean Sea. Deep Sea Res. Part A Oceanogr. Res. Pap. 39, 727–742.
Veldhuis, M. J. W., and Kraay, G. W. (1990). Vertical distribution and pigment composition of a picoplanktonic prochlorophyte in the subtropical North Atlantic:a combined study of HPLC-analysis of pigments and flow cytometry. Mar. Ecol. Prog. Ser. 68, 121–127.
Veldhuis, M. J. W., and Kraay, G. W. (1993). Cell abundance and fluorescence of picoplankton in relation to growth irradiance and nitrogen availability in the red sea. Neth. J. Sea Res. 31, 135–145. doi: 10.1016/0077-7579(93)90003-B
Veldhuis, M. J. W., Kraay, G. W., VanBleijswijk, J. D. L., and Baars, M. A. (1997). Seasonal and spatial variability in phytoplankton biomass, productivity and growth in the northwestern Indian Ocean: the southwest and northeast monsoon, 1992–1993. Deep Sea Res. Part I Oceanogr. Res. Pap. 44, 425–449. doi: 10.1016/S0967-0637(96)00116-1
Vidussi, F., Claustre, H., Manca, B. B., Luchetta, A., and Marty, J. C. (2001). Phytoplankton pigment distribution in relation to upper thermocline circulation in the eastern Mediterranean Sea during winter. J. Geophys. Res. Oceans 106, 19939–19956. doi: 10.1029/1999JC000308
Wafar, M., Ashraf, M., Manikandan, K. P., Qurban, M. A., and Kattan, Y. (2016). Propagation of Gulf of Aden Intermediate Water (GAIW) in the Red Sea during autumn and its importance to biological production. J. Mar. Syst. 154, 243–251. doi: 10.1016/j.jmarsys.2015.10.016
Weber, T. S., and Deutsch, C. (2010). Ocean nutrient ratios governed by plankton biogeography. Nature 467, 550–554. doi: 10.1038/nature09403
Weber, T., and Deutsch, C. (2012). Oceanic nitrogen reservoir regulated by plankton diversity and ocean circulation. Nature 489, 419–422. doi: 10.1038/nature09403
West, N. J., and Scanlan, D. J. (1999). Niche-partitioning of Prochlorococcus populations in a stratified water column in the eastern North Atlantic Ocean. Appl. Environ. Microbiol. 65, 2585–2591.
Worm, B., Lotze, H. K., Hillebrand, H., and Sommer, U. (2002). Consumer versus resource control of species diversity and ecosystem functioning. Nature 417, 848–851. doi: 10.1038/nature00830
Wright, S. W. R. L., van den Enden, P. I., Davidson, A. T., Scott, F. J., and Westwood, K. J. (2010). Phytoplankton community structure and stocks in the Southern Ocean (30–80°E) determined by CHEMTAX analysis of HPLC pigment signatures. Deep Sea Res. Part II-Top. Stud. Oceanogr. 57, 758–778. doi: 10.1016/j.dsr2.2009.06.015
Wright, S. W., and Jeffrey, S. W. (2006). Pigment markers for phytoplankton production. Mar. Organ. Mattter 2, 71–104. doi: 10.1007/698_2_003
Wright, S. W., Thomas, D. P., Marchant, H. J., Higgins, H. W., Mackey, M. D., and Mackey, D. J. (1996). Analysis of phytoplankton of the Australian sector of the Southern Ocean: comparisons of microscopy and size frequency data with interpretations of pigment HPLC data using the ‘CHEMTAX’ matrix factorisation program. Mar. Ecol. Prog. Ser. 144, 285–298. doi: 10.3354/meps144285
Yao, F., Hoteit, I., Pratt, L. J., Bower, A. S., Koehl, A., Gopalakrishnan, G., et al. (2014a). Seasonal overturning circulation in the Red Sea: 2. Winter circulation. J. Geophys. Res. Oceans 119, 2263–2289. doi: 10.1002/2013JC009331
Yao, F., Hoteit, I., Pratt, L. J., Bower, A. S., Zhai, P., Koehl, A., et al. (2014b), Seasonal overturning circulation in the Red Sea: 1. Model validation summer circulation. J. Geophys. Res. Oceans 119, 2238–2262. doi: 10.1002/2013JC009004.
Yoder, J. A., Ackleson, S. G., Barber, R. T., Flament, P., and Balch, W. M. (1994). A line in the sea. Nature 371, 689–692. doi: 10.1038/371689a0
Zhan, P., Subramanian, A. C., Yao, F., and Hoteit, I. (2014). Eddies in the Red Sea: a statistical and dynamical study. J. Geophys. Res. Oceans 119, 3909–3925. doi: 10.1002/2013JC009563
Zinser, E. R., Coe, A., Johnson, Z. I., Martiny, A. C., Fuller, N. J., Scanlan, D. J., et al. (2006). Prochlorococcus ecotype abundances in the North Atlantic Ocean as revealed by an improved quantitative PCR method. Appl. Environ. Microbiol. 72, 723–732. doi: 10.1128/AEM.72.1.723-732.2006
Zinser, E. R., Johnson, Z. I., Coe, A., Karaca, E., Veneziano, D., and Chisholm, S. W. (2007). Influence of light and temperature on Prochlorococcus ecotype distributions in the Atlantic Ocean. Limnol. Oceanogr. 52, 2205–2220. doi: 10.4319/lo.2007.52.5.2205
Zwirglmaier, K., Heywood, J. L., Chamberlain, K., Woodward, E. M. S., Zubkov, M. V., and Scanlan, D. J. (2007). Basin-scale distribution patterns lineages in the Atlantic Ocean. Environ. Microbiol. 9, 1278–1290. doi: 10.1111/j.1462-2920.2007.01246.x
Zwirglmaier, K., Jardillier, L., Ostrowski, M., Mazard, S., Garczarek, L., Vaulot, D., et al. (2008). Global phylogeography of marine Synechococcus and Prochlorococcus reveals a distinct partitioning of lineages among oceanic biomes. Environ. Microbiol. 10, 147–161. doi: 10.1111/j.1462-2920.2007.01440.x
Keywords: red sea, phytoplankton distribution, pigments, cyanobacteria, prymnesiophytes, diatoms, primary production
Citation: Kheireddine M, Ouhssain M, Claustre H, Uitz J, Gentili B and Jones BH (2017) Assessing Pigment-Based Phytoplankton Community Distributions in the Red Sea. Front. Mar. Sci. 4:132. doi: 10.3389/fmars.2017.00132
Received: 06 February 2017; Accepted: 20 April 2017;
Published: 10 May 2017.
Edited by:
Tilmann Harder, University of Bremen, GermanyReviewed by:
Bridget E. Cotti-Rausch, University of South Carolina, USAAlison Palmer Chase, University of Maine, USA
Copyright © 2017 Kheireddine, Ouhssain, Claustre, Uitz, Gentili and Jones. This is an open-access article distributed under the terms of the Creative Commons Attribution License (CC BY). The use, distribution or reproduction in other forums is permitted, provided the original author(s) or licensor are credited and that the original publication in this journal is cited, in accordance with accepted academic practice. No use, distribution or reproduction is permitted which does not comply with these terms.
*Correspondence: Malika Kheireddine, bWFsaWthLmtoZWlyZWRkaW5lQGthdXN0LmVkdS5zYQ==