 Eriko Hoshino
 Elizabeth I. van Putten
 Wardis Girsang
 Budy P. Resosudarmo
 Satoshi Yamazaki
- 1Oceans and Atmosphere (CSIRO), Hobart, TAS, Australia
- 2Tasmanian School of Business and Economics, University of Tasmania, Hobart, TAS, Australia
- 3Centre for Marine Socioecology, University of Tasmania, Hobart, TAS, Australia
- 4Faculty of Agriculture, University of Pattimura, Ambon, Indonesia
- 5Indonesia Project, Arndt-Corden Department of Economics, Crawford School of Public Policy, Australian National University, Canberra, ACT, Australia
Community-based resource management is a key approach to achieve successful small-scale fisheries and marine conservation. Many local management initiatives worldwide have been successfully managing aquatic resources and livelihoods of communities depending on them. Community-based management is particularly prevalent in small tropical islands where communities are frequently heavily dependent on coral reef ecosystems and small-scale reef fisheries for their livelihoods. Community-based management is, however, not always a panacea since there are inherit trade-offs among multiple objectives which are sometimes accentuated by community heterogeneity. It is well recognized that perceived and real evidence of community benefits are key to attributing success to local community-based management. However, broader understanding of community-based management objectives and how fishers' perceived personal objectives and characteristics affect management outcomes remains limited. We apply a non-linear Principle Component Analysis (PCA) to explore variations in personally held community-based management objectives, based on local surveys for fishing communities in the Kei Islands in Indonesia. We then examine whether these variations also explain their perceptions of environmental and economic outcomes that are achieved by this management systems. In this study important differences are found in the perceptions fishers have of the relative importance of different community management objectives. The value people attribute to aspects of community management can be related to their socio-demographic characteristics and experienced fishers tend to focus more on environmental objectives. Given that strong links were found between community management outcomes and terrestrially based activities there is an opportunity to link in the terrestrial and coastal systems management and achieve multiple objective outcomes.
Introduction
Community-based resource management is a key strategy for small-scale fisheries and marine conservation (Evans et al., 2011). Community-based management is particularly prevalent in the Pacific where communities rely heavily on small-scale fisheries, and vast coastlines and budget limitation make centralized management difficult (Govan, 2009). Despite difficulties, many local management initiatives have successfully managed aquatic resources and ensured the livelihoods of communities that depending on access to the marine environment (Gutierrez et al., 2011). Community-based management, however, is not a panacea for coastal and marine resource management everywhere and for everyone, since there are inherent trade-offs among multiple objectives (Berkes, 2007). It is well recognized that perceived or realized benefit to communities is the key to successful community-based management (Measham and Lumbasi, 2013). However, a broad understanding of variation in the management objectives held by local people, and more specifically by fishers, and how individually held objectives affect fishing behavior and management outcomes, remains limited.
The management objectives for community-based marine protected areas (MPAs) in the Pacific were identified by Jupiter et al. (2014) who highlighted the multiplicity of objectives and the trade-offs among them. A lack of consideration for meeting multiple social and biological objectives in the design of community-based MPAs in Southeast Asia has led to the expansion of conflict between stakeholders (Christie, 2004). A study of conflict over marine tenure in Eastern Indonesia found that discordance in the understanding and practice of traditional marine tenure between the village head and members of the community has created tension and conflict (Adhuri, 2013).
Our aim is to illustrate the relationship between fisher's perceptions of the relative importance of social, cultural, economic (fishery), and environmental objectives of community-based resource management. Using surveys in fishing communities in the Kei Islands, Indonesia where well-established traditional tenure systems are still present, variation and similarities in fisher objectives of community-based management are evaluated. We further explore how individuals' perceived objectives of community-based management shapes their perceptions of stock and habitat status and the economic performance of the fishery. Local fishers have first-hand knowledge of the environment that they exploit, including direct assessments of how marine stocks change over time (Aswani and Hamilton, 2004). The perceptions and knowledge of artisanal fishermen with regard to the abundance of marine stocks can help improve fisheries management and conservation (Johannes et al., 2000; Aswani and Hamilton, 2004; Begossi, 2008; Hallwass et al., 2013), for instance, because fishers' ecological knowledge provides a cost-effective way to monitor resource status in the absence of scientific or government collected monitoring data. The linkage between local ecological knowledge and the fishers perceived objectives of marine tenure systems, however, is under studied and this study can provide insights into their linkages.
Materials and Methods
Study Site
The study site is in the Kei Islands, a group of islands remotely situated in the southeast part of Maluku in the eastern part of Indonesia (Figure 1). In 2012, it was estimated that approximately 200,000 people live on the islands. The main sources of income and livelihood for the small islands communities is marine capture fisheries, and other marine based small-scale industries, such as seaweed and pearl cultivation. The study site has well-established tenure systems where coastal resources have been communally owned and managed by Sasi (Thorburn, 2001; Hoshino et al., 2016).
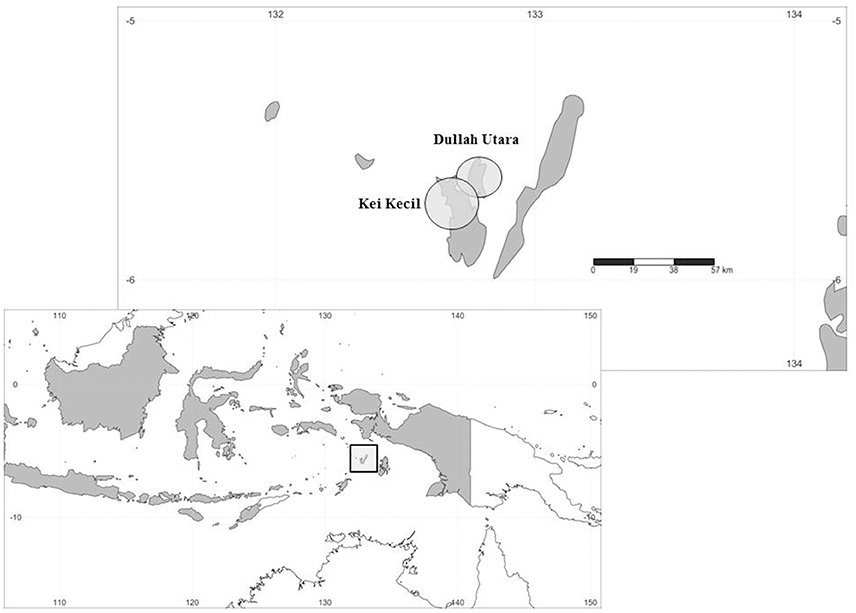
Figure 1. General location of the Kei Islands (main islands) and study sites at the subdistrict level. Source: Hoshino et al. (2016).
Sasi in Central Maluku is indigenous knowledge or local wisdom, which has been practiced by fishers for around four centuries and still exists today. Sasi in Kei islands is not only part of local wisdom, but it has become the integrated part of history and customary law of Larvul Ngabal that began in Kei Islands around the fourteenth century (Mosse et al., 2012). Sasi in Kei Islands is a customary law (or set of 7 rules) that prohibit taking or destroying certain high value natural resources at certain times of the year in order to protect and to ensure sustainability of the resources in the future. The time to open and close sasi rules is decided by head of village and staff as well as representative of village community, called saniri negeri. Kewang darat/laut is a the name of person or a group of people that have special task to control the implementation of land sasi and marine sasi. Sasi is practiced, for instance, to protect lompa fish (Trisina baelama) and sea cucumber in Central Maluku (Nikijuluw, 1995). While Sasi darat (land Sasi) controls and manages agro-forestry, particularly for coconut plantation, in Kei islands, sasi laut (marine Sasi) applies to the coastal areas, including Sasi meti, a customary law to harvest all kinds of fish in the intertidal zone at certain times of the year and day for food security and household income. Sasi laut is not at the individual or group level, but applies to village or communal ownership. Rules for Sasi laut differ in the various villages in the Kei Islands. Detail descriptions of Sasi rules are discussed elsewhere with examples of Sasi practices in the Kei Islands and Maluku Province found in Hoshino et al. (2016), Adhuri (2013), Novaczek et al. (2001), and Ruttan (1998).
The general goals of implementing Sasi in Kei are: (1) to manage harmonious social relationship, particularly between women and men; and (2) to manage natural resources and the environment (Hoshino et al., 2016). Even though these high level stated objectives exist, “perceived” objectives may vary among individuals, which is the subject of the current study.
Survey
A face-to-face randomized household survey was carried out in four fishery villages in two subdistricts (Kei Kecil and Dullah Utara) between November and December 2013 (See Hoshino et al., 2016 for more information about the survey). The data obtained in this survey was used to explore the relationship between the relative importance of different objectives of Sasi laut as perceived by local fishers, their socio-demographic factors, and their perceptions of the ecological and economic conditions of the marine environment in the Kei Islands.
The survey questions regarding the objectives of Sasi laut were organized into four broad groups: (A) environment, (B) economic/fishery, (C) social, and (D) cultural objectives (Table 1). The selection of objectives, and the statement included in the survey to test the importance of the different objectives, are based on literature reviews and consultation with local fisheries and Sasi experts, including key personnel at the local technical/research institution (Tual State Fisheries Polytechnic) and researchers at University of Pattimura in Ambon. The survey respondents were asked to rank different aspects of Sasi laut according to their relative importance for each group of objectives. For example, when rating the environmental objectives, respondents would allocate a score of 1 to the least important and score of 4 to the most important aspect, and allocate a score of 2 or 3 to those objectives where the relative importance was perceived to fall in between. This was repeated for all objective groups (1 to 4 for A-C, and 1 to 3 for group D shown in Table 1). The respondents were also asked to rank the overall importance across the four objective groups (A to D) using the same scale of 1 (least important) to 4 (most important). This was then used to calculate the overall score across the 4 objective groups ranging from 1 to 16. For instance, if a respondent stated that protecting coral reef was most important (4) in group A, and environmental objective (group A) were perceived as most important (4) among the four objective groups, the total respondent's score for protecting coral reef would be 16 (4 × 4)1. Two main reasons that we chose this approach were (1) our pilot survey in the field suggested that it was impractical to ask survey participants to rank all 15 objective options. Aside from the objectives that lay at the extremes of the scale (i.e., the generally easy choice for around four objectives that were either most or least important) respondents found it cognitively difficult to rank the large number of objective options, thereby reducing the usability of the overall rankings; (2) as our key interest was to identify the typology of fishers based on their perceived objective groups, the objectives were categorized into 4 groups so that the results could be easily interpreted.
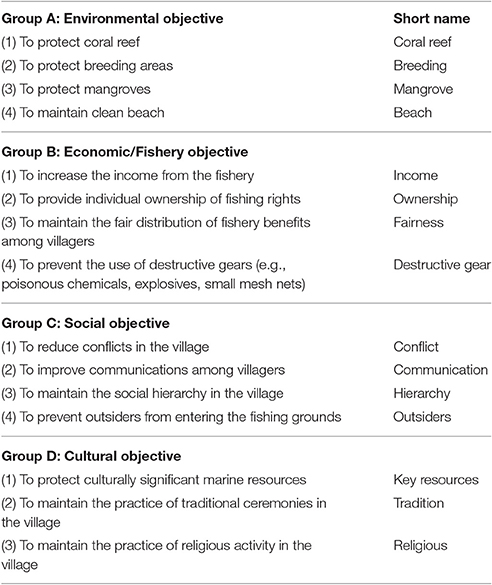
Table 1. Objectives of Sasi laut.
As the study contains face-to-face interviews involving fishers, ethical considerations were given in designing and conducting the survey. The ethical application was reviewed and approved by the Tasmania Social Sciences Human Research Ethical Committee in accordance with the requirements of the National Statement on Ethical Conduct in Human Research (National Statement) (NHMRC, 2007) prior to the commencement of the study. The survey interviews were undertaken by local researchers from the University of Pattimura, all of whom attended training and information sessions. The survey participants were provided with information sheets explaining voluntary nature of the study and verbal informed consents were obtained prior to the interview in accordance with the National Statement. The demographic information for the total number of survey respondents (53) is summarized in Table 2. Respondents are skewed in terms of gender, religion and ethnics due to the nature of the fishery sector in the region (e.g., men are involved with catching fish while women are involved with post-harvesting and marketing).
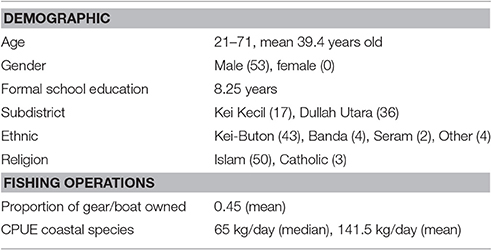
Table 2. Demographic summary of respondents.
Grouping Fishers with Similar Objectives
We use a Principal Component Analysis (PCA) to evaluate if there are groups of fishers who hold similar objectives for community-based management (Sasi laut) in their local area. PCA is a multivariate technique that produces a set of abstract variables (called principal components) which are weighted linear combinations of the original variables (James and McCulloch, 1990; Robertson et al., 2001). The components are constructed so as to maximize the variance explained by each component and in such a manner that they are uncorrelated (orthogonal). In ecology, the technique has been used primarily to display the relative positions of data points in fewer dimensions while retaining as much information as possible, and explore relationships between dependent variables (Syms, 2008).
In most socioeconomic studies measures of, for instance, resource users' beliefs, perceptions, and satisfaction levels are mostly not directly observable, and they usually have to be collected by survey questionnaires where respondents are asked to declare their perceptions and beliefs and their degree of satisfaction (e.g., Salini and Kenett, 2011). The information with regard to these measures is therefore usually collected by means of categorical variables that are measured on an ordinal-level scale.
Since our data on fishers' perceptions about social and ecological status are expressed in ordinal scale, we adopted a non-linear PCA. Unlike classical linear PCA, non-linear PCA does not require the adoption of an a priori difference between classification categories and does not presuppose a linear relationship among the observed variables (Ferrari and Barbiero, 2011). Despite its advantages, few empirical examples exist that have applied non-linear PCA to social and economic data (Vrooman, 2012). Non-linear PCA was conducted using the Gifi package which is the extension of the homals package (De Leeuw and Mair, 2009) in R. Fifteen variables related to Sasi laut objectives (Table 1) were used as input variables.
From a policy perspective, it is important to understand whether certain factors, such as demographic or other factors, have significant influence on how individuals perceive community-based management objectives. We selected three demographic factors (subdistrict, age, and fishing experience) to test whether the individual PCA scores for each component are different among different demographic groups using non-parametric Kruskal-Wallis rank sum tests. The null hypothesis is that there is no difference between mean PCA scores among different demographic groups. The continuous factors are discretized into 3 groups: age (20–35, 35–50, 50–71 years old); and fishing experiences (4–14, 14–24, 24–40 years) gaining segments of approximately equal size. Other demographic characteristics, such as ethnicity and religion, was not included as the majority of respondent (81.1 and 94%, respectively, for the two regions) identify as one ethnic group (Kei-Buton) and religion (Islam). Years of residence was also excluded as our preliminary analysis suggests that it was highly correlated with age (Pearson's correlation = 0.599)2.
Identifying the Relationship between Perceived Objectives and Socio-Ecological Status
We used Random Forests models to assess the influence of perceived management objectives and other predictors on the socio-ecological variables (response variables). The random forests (RF) method is a classification and regression tool that combines several decision trees, and an individual tree is fit using a random sample of observations. RF can cope with high dimensional data with highly correlated predictors and is able to rank candidate predictors through its inbuilt variable importance measures (Boulesteix et al., 2012; Janitza et al., 2016). The key advantages of RF compared to parametric methods such as generalized linear models includes the ability to account for non-linear relationships between a predictor and response variable. RF does not make any parametric assumptions about the distribution of a response variable and thus does not require normality assumptions for the data. Interactions among predictor variables are accounted for implicitly, RF can handle missing values of predictor variables, and RF share less susceptible to over-fitting (Melnychuk et al., 2013).
RF have been used increasingly in ecology and fisheries research (Cutler et al., 2007; Gutierrez et al., 2011; Sethi et al., 2012; Melnychuk et al., 2013, 2016). We selected 3 response variables that are indicative of management outcomes: perceived stock status, perceived habitat status, and catch per unit effort (CPUE) for coastal species. A RF model of 10,000 trees was used to estimate the relative importance of variables in predicting management outcomes for each of the three response variables. The model for each analysis, including all predictors, is listed in Table 3. The importance of the types of objectives held by the respondents was investigated by including the PCA scores (the Components) in the RF models. The analysis was conducted using the “party” package (Version 1.0-25 Hothorn et al., 2006a) in R. The party package enables calculation of conditional permutation importance measures when accounting for highly correlated predictors (Strobl et al., 2008).
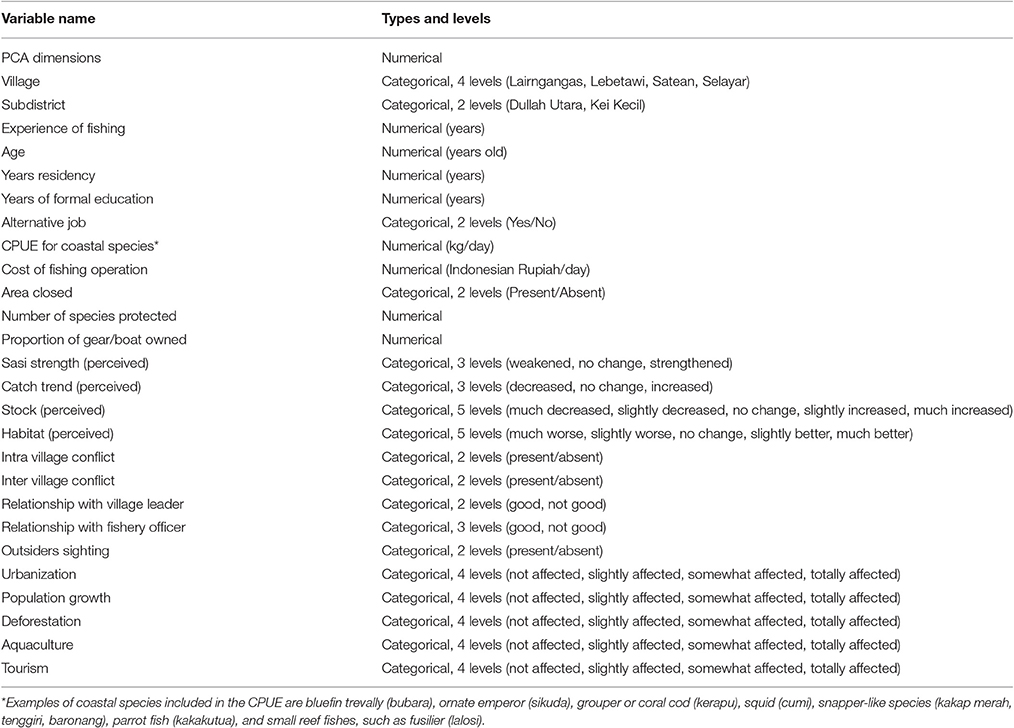
Table 3. Variables included in the random forest model.
The classical approach of measuring variable importance (Breiman, 2001) has a known drawback when data include categorical variables with different number of levels, as RF are biased in favor of those attributes with more levels (Hothorn et al., 2006b; Strobl et al., 2007). One solution is to use unbiased tree algorithms that do not artificially favor splits in variables with many categories or continuous variables. In R such an unbiased tree algorithm is available in the ctree and cforest function for conditional inference trees in the party package (Hothorn et al., 2006b). We applied two permutation variance importance measures (VIMs) based on mean absolute error (MAE) and ranked probability score (RPS) developed by Janitza et al. (2016) that take ordering information into account in constructing trees. With MAE a higher penalty is given to a classification into a class which is more distant from the true class (Janitza et al., 2016). The RPS has been shown to be particularly appropriate for the evaluation of probability forecasts of ordinal variables (Murphy, 1970). A comprehensive review of variable importance analysis is given by Wei et al. (2015). Since there was very little difference between the rankings of the two VIMs, only the result of MAE is reported here.
Results
Grouping Fishers with Similar Objectives
The scree plot (Figure 2) shows eigenvalues associated with each component. An eigenvalues ≥1 is commonly used as a default cut-off value when deciding the number of components to be retained. The cumulative variables accounted for (VAF in Table 4) suggests that four new variables (components) can explain 71.5% of the information in the original 15 variables (objectives), thus we selected the first 4 components to be included in the following analysis.
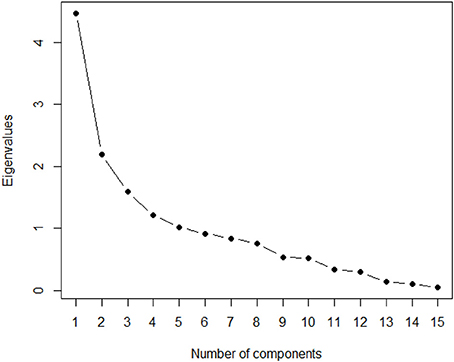
Figure 2. Scree plot showing eigenvalues and number of components.
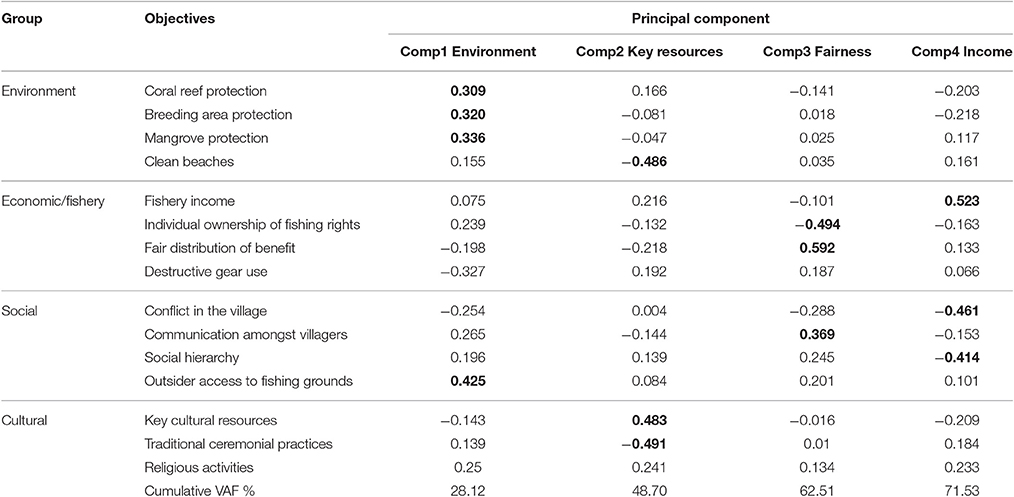
Table 4. Loadings for PCA.
Interpretation of the principal components is based on finding which objectives are most strongly correlated with each component, i.e., which of these numbers are large in magnitude, the farthest from zero in either positive or negative direction. Component loadings (analog to correlation coefficients) that are negative are of less importance (as the scoring of the original objectives was from 1 to 4, with 1 being not important). Here a correlation value above 0.3 is deemed important, and the correlations equal or larger than 0.3 are highlighted in bold in Table 4.
The first component (comp1) is strongly correlated with four of the original objectives, and positive sign indicating that protection of coral reef, breeding grounds and mangrove, as well as preventing outsiders from entering the fishing grounds were important objectives of Sasi laut. Preventing the use of destructive gears was considered less important objectives of Sasi laut as indicated by the negative sign. The respondents who fell into this first component focused more on protecting the environment and this dimension was therefore labeled “environment.”
The second component (comp2) is strongly correlated with three of the original objectives that fall in the cultural category. Here maintaining the traditional ceremony in the village is less important objectives of Sasi laut but protecting key cultural resources was considered important. Environmental issues, such as clean beach, was also considered of lesser importance. Respondents who fell in this group mostly focused on achieving the protection of culturally important marine resources within the communities and this component was labeled “key resources.”
Sasi laut objectives associated with the third component (comp 3) shows lesser importance attributed to individual ownership of fishing right, but more importance to fair distribution of benefit amongst villagers. This group also attributes more importance to improving communication between villagers. Respondents who fell into this group attributed importance to fair distribution of benefits amongst villagers which in their mind may also be associated with improving communication and this dimension was labeled “fairness.”
For the fourth component (comp 4) greater importance is attributed to income generation to meet Sasi laut objectives. Reducing levels of conflict in the village, and maintaining the social hierarchy in the village are considered of lesser importance. Respondents who fell into group four attributed importance to the economic (income) objective while attributing less importance to social aspects, this dimension was labeled “income.”
A biplot (Figure 3) represents the individual respondents' component scores (points) and the loadings (vectors, Table 4) that represent correlations of the original 15 objectives for the first two principal components (comp 1 and 2 where eigenvalues are highest). The length of the vectors (arrows) corresponds to the strength of the correlation (Table 4). It allows us to visualize the magnitude and sign of each objective's contribution to the first two components, and how each respondent is represented in terms of those components. A group of vectors pointing in the same direction corresponds to a group of individuals who have the same perceptions about the objectives of Sasi laut. For instance, individuals whose vectors point toward top left-hand side (with eigenvalues greater than 1) have the same general perceptions about the importance of Sasi's objectives, that is they value the protection of key cultural resources and prevention of destructive gear use.
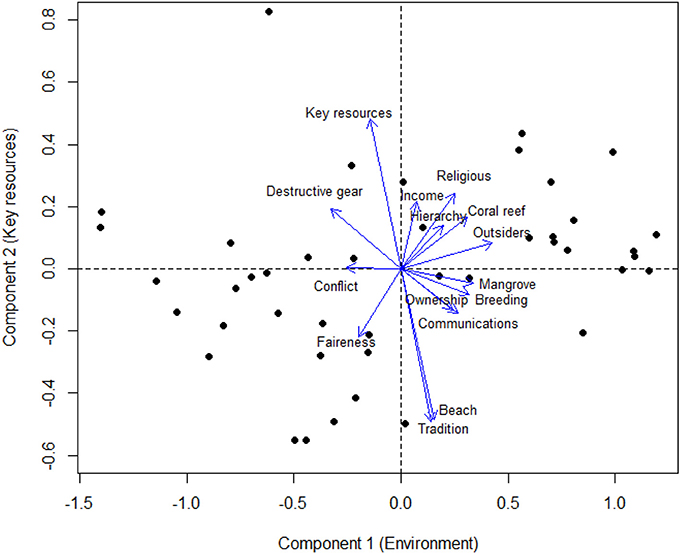
Figure 3. A biplot showing individual respondents' PCA scores (points) and loadings of the original 15 objectives (vectors) in the space of the first 2 components.
Figure 4 presents biplots for demographic variables (only the components of significant results are shown). Kruskal-Willis rank sum test results (Table 5) suggest that fishing experience differs significantly between individuals who value “environment,” and “fairness.” For example, individuals in the experienced age group (24–40 years) tend to have higher PCA scores for component 1 than those in less experienced groups (Figure 4ia), and therefore place higher value on protecting environment than the less experienced generation of fishers. Similarly, experienced individuals tend to have higher PCA scores for component 3 (Figure 4ib) indicating that experienced fishers tend to place higher values on fair distribution of benefits relative to inexperienced fishers. The respondents' subdistrict had a significant effect on all components (Table 5). Individuals in Dullah Utra tend to care more about protection of environment and key resources, and fair distribution of benefits than people in Kei Kecil, while caring less about income (Figures 4iia,b).
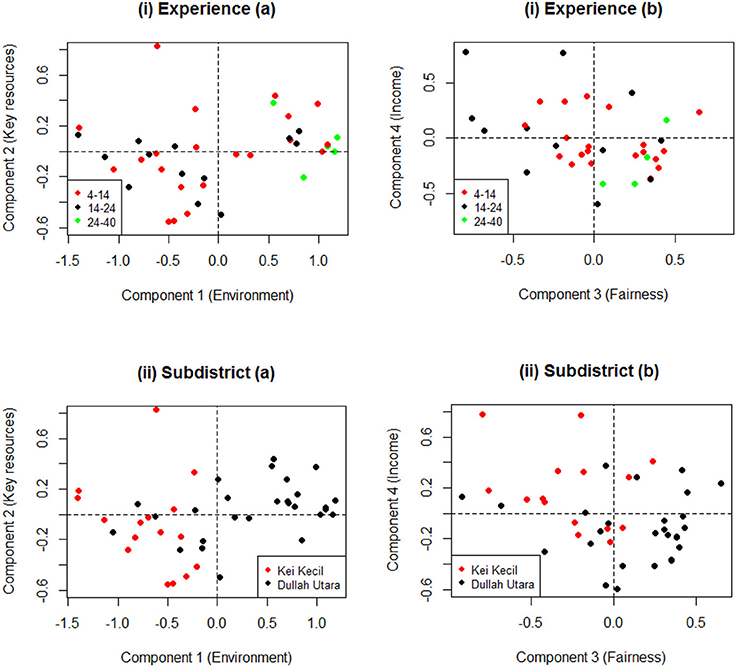
Figure 4. Biplots for individual PCA scores by demographic variables [by experience for (i), by subdistrict for (ii)].
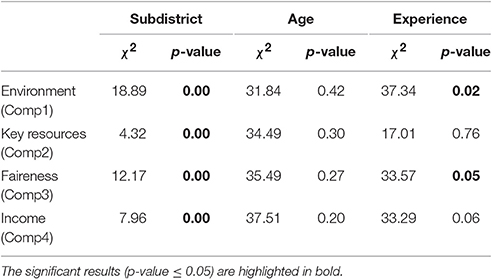
Table 5. Kruskal-Willis rank sum test results.
Identifying the Relationship between Perceived Objectives and Socio-Ecological Status
A figure showing variable importance (VI) ranking for three response variables (stock status, CPUE and habitat status) are given in Figure 5. The first response variable, perceived stock status, is most influenced by perceived habitat status, the level of deforestation, and whether “environment protection” is valued in community-based management (component 1 is ranked 3rd). Whether the person values “fairness” (component 2), or “income” (component 2) also had an impact, but were ranked lower in 6th and 7th place, respectively.
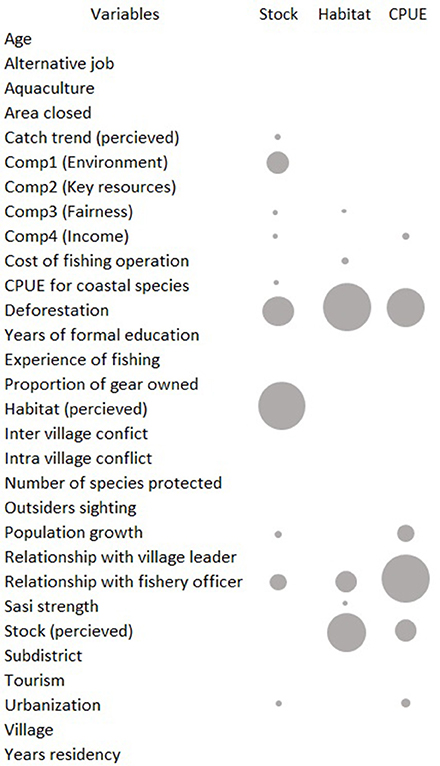
Figure 5. Ranking of variable importance for perceived stock status, perceived habitat status, and CPUE (rank proportional to circle size).
The three most important variables for perceived habitat status are deforestation, perceived stock status, and relationship with fishery officers. The perception of habitat status was to some degree explained by whether people valued “fairness” (component 3) but this was to a lesser extent (ranked 5th). In contrast, how the respondents valued different objectives of Sasi laut did not contribute much to explaining the CPUE, except for “income” (component 4 is ranked 5th). The variables that did explain CPUE were the relationship with fisheries officer, deforestation, population growth, perceived stock status, and urbanization and income (at 5th rank together with urbanization).
Discussion
The importance of community support has been highlighted in a number of studies in successful marine conservation and natural resource management (Pomeroy et al., 2011; Cinner et al., 2016). Common pool resource literature mostly focusses on identifying community-level conditions that facilitate successful management, with lesser emphasis on individual-level characteristics and perceptions that influences the behavior of participants in such a community-based resource management systems (Chaigneau and Daw, 2015).
The aim of this study in Kei, Indonesia, was to better understand objectives individual people hold with respect to their local community-based management system. In addition, the investigation provides insights into the link between personal perceptions and conservation and sustainability outcomes of coral reef fisheries managed under this community-based resource management system, using an example of traditional marine tenure referred to as Sasi laut. The traditional marine tenure system has been in place in the Kei Islands for decades and is well-embedded into community consciousness. Even though the community-based management system in Kei has been operating for an extended time period, heterogeneity in the fisher's objectives for the community managed marine system remains. The heterogeneity in the objectives people hold in Kei go hand in hand with fisher's perception that Sasi laut has disappeared (Hoshino et al., 2016) and is not achieving the stated and perceived aims. Conflicting objectives and moreover, perceptions that objectives are not being met can make socio-ecological systems more difficult to manage, thus requiring solutions to be found.
Our study suggests that there is considerable variability in individual fisher's perception of the importance of marine tenure objectives and that there are groups of fishers who mostly value either environment, key resources, fairness, or income. Demographic characteristics in terms of fishing experience significantly influence the different objectives that are held. For instance, more experienced fishers attribute greater value to environmental protection and equity aspects of Sasi laut whereas less experience fishers value income. The fact that experience affects the level of interest in environment and protection is observed globally in relation to many different aspects of natural resource management (Liere and Dunlap, 1980). Age often also explains interest in the environment, but this was not significant in this study. The importance of individual characteristics on predicting positive or negative attitudes toward marine management has also be found elsewhere, for instance with respect to MPAs in the Philippines (Chaigneau and Daw, 2015) although the focus of this study was not on individual variability in objectives per se. Moreover, our study provides evidence that the objectives individual people hold is linked to people's perceived and realized outcomes of community-based resource management in terms of the conservation of aquatic resources and economic returns from fisheries. Because support for the local community-based management system in Kei is under threat, engagement of fishers of all ages and backgrounds in a culturally appropriate process of understanding and deliberation of marine tenure systems will be crucial in order to stop further erosion of community support.
The objectives people held for Sasi laut also varied geographically. In the two subdistricts in this study people differed with respect to the value they attributed to the environment, key cultural resources, fairness, and income aspect of Sasi laut, with people in Kei Kecil tending to value income more than those in Dullah Utara. Many unobserved factors are likely to contribute to the geographic differences in objectives in the two subdistricts given that the average years of experience is similar (18.3, 17.0, respectively), but other factors such as social capital in the villagers' community, household income, knowledge about Sasi laut, or information availability for Sasi laut outcomes, are not included here but may contribute to explaining this difference.
Our case study also highlights the importance of land based activities in predicting people's perception of coastal resource management outcomes. People's perceptions of Sasi laut's outcomes are most affected by deforestation in the catchment. In addition, where CPUE is concerned two additional large scale factors, population growth and urbanization also play a role. This can be explained by the fact that fishers use timber harvested in the local forest area to make canoes and traditional lift nets (bagan). As the fishery's production increases, fishers require more timber to build these gears and vessels. As a result, there is feedback between deforestation and land development (i.e., population growth and urbanization) and fishery productivity.
Such an intimate feedback system between land activities and outcomes of traditional marine tenure system suggests that there may be a need to broaden the understanding of coastal-based community management objectives to be better integrated with whole of catchment management objectives. In Kei Islands, investigating the link between the implementation of Sasi darat and Sasi laut may be an important next step to take to ensure sustainable outcomes in the future. There is evidence from Maluku that connecting the terrestrial, coastal, and marine system is possible. Traditional agricultural practice called “Dusun” exist in small islands of Maluku as a traditional agroforestry systems to protect forestry resources and agricultural crops as the source of income and food security as well as to prevent erosions and environmental degradation. The practice is traditionally limited to land activities, but there has been a new paradigm shift to include coral reef, mangrove, and sea weed into Dusun as integrated agriforestry system (Wattimena, 2003). The basic principle is to protect marine by protecting forest and watershed in small islands. Another interesting research avenue would be to investigate whether such paradigm shift has occurred in other parts of the world in the community-based coastal resource management for small islands and to learn from their experience.
Conclusion
Community support for traditional marine tenure systems that are locally managed is essential for their continued existence and their success. The heterogeneity in individual fisher's perception of the relative importance of various community management objectives, as evident in this study, could explain the erosion of community support for traditional marine tenure in Kei. To develop a future management system that maintains the roles of traditional tenure systems, renewed effort is required to engage local communities in a culturally appropriate and sensitive manner and to gain a shared understanding of management's basic objectives. In addition, to ensure future marine management is not undermined by the impacts of land based activities, a coastal-based approach needs to be better integrated with whole of catchment management objectives. Only a shared and holistic understanding of the ultimate aim of local marine area management will be able to unite a heterogeneous group of people, who hold different priorities and objectives, and continue the traditional tenure approach.
Author Contributions
EH, Ev, WG, BP, and SY contributed to the design of the study, data collection, data analysis and the interpretation of the data analysis. EH, WG, BP, and SY contributed to field study and consultations with stakeholder groups. EH, Ev, WG, BP, and SY contributed to drafting and reviewing the content of the work.
Funding
The data collection in this study was funded by the Australia Indonesia Centre (AIC). Award reference number: 01ASP1ANUResoHAS009.
Conflict of Interest Statement
The authors declare that the research was conducted in the absence of any commercial or financial relationships that could be construed as a potential conflict of interest.
Footnotes
1. ^Since the cultural objective has only three attributes while other groups have four, weighting was given to the cultural objective ranking so that the maximum score is consistent (at 16) across all groups.
2. ^The correlation between all other variables was less than 0.250.
References
Adhuri, D. S. (2013). Selling the Sea, Fishing for Power: A Study of Conflict Over Marine Tenure in Kei Islands, eastern Indonesia. Canberra, ACT: Australian National University E Press.
Aswani, S., and Hamilton, R. J. (2004). Integrating indigenous ecological knowledge and customary sea tenure with marine and social science for conservation of bumphead parrotfish (Bolbometopon muricatum) in the Roviana Lagoon, Solomon Islands. Environ. Conserv. 31, 69–83. doi: 10.1017/S037689290400116X
Begossi, A. (2008). Local knowledge and training towards management. Environ. Dev. Sustain. 10:591. doi: 10.1007/s10668-008-9150-7
Berkes, F. (2007). Community-based conservation in a globalized world. Proc. Natl. Acad. Sci. U.S.A. 104, 15188–15193. doi: 10.1073/pnas.0702098104
Boulesteix, A.-L., Janitza, S., Kruppa, J., and König, I. R. (2012). Overview of random forest methodology and practical guidance with emphasis on computational biology and bioinformatics. Wiley Interdiscip. Rev. 2, 493–507. doi: 10.1002/widm.1072
Chaigneau, T., and Daw, T. M. (2015). Individual and village-level effects on community support for Marine Protected Areas (MPAs) in the Philippines. Mar. Policy 51, 499–506. doi: 10.1016/j.marpol.2014.08.007
Christie, P. (2004). “MPAs as biological successes and social failures in Southeast Asia,” in Aquatic Protected Areas as Fisheries Management Tools: Design, Use, and Evaluation of These Fully Protected Areas, ed J. B. Shipley (Bethesda: American Fisheries Society), 155–164.
Cinner, J. E., Huchery, C., Macneil, M. A., Graham, N. A. J., McClanahan, T. R., Maina, J., et al. (2016). Bright spots among the world's coral reefs. Nature 535, 416–419. doi: 10.1038/nature18607
Cutler, D. R., Edwards, T. C., Beard, K. H., Cutler, A., Hess, K. T., Gibson, J., et al. (2007). Random forests for classification in ecology. Ecology 88, 2783–2792. doi: 10.1890/07-0539.1
De Leeuw, J., and Mair, P. (2009). Gifi methods for optimal scaling in R: the package homals. J. Stat. Soft. 31, 1–21. doi: 10.18637/jss.v031.i04
Evans, L., Cherrett, N., and Pemsl, D. (2011). Assessing the impact of fisheries co-management interventions in developing countries: a meta-analysis. J. Environ. Manage. 92, 1938–1949. doi: 10.1016/j.jenvman.2011.03.010
Ferrari, P. A., and Barbiero, A. (2011). “Nonlinear principal component analysis,” in Modern Analysis of Customer Surveys, eds R. S. Kenett and S. Salini (Chichester: John Wiley and Sons, Ltd.), 333–356.
Govan, H. (2009). Achieving the potential of locally managed marine areas in the South Pacific. SPC Tradit. Mar. Resour. Manage. Knowl. Inf. Bull. 25, 16–25.
Gutierrez, N. L., Hilborn, R., and Defeo, O. (2011). Leadership, social capital and incentives promote successful fisheries. Nature 470, 386–389. doi: 10.1038/nature09689
Hallwass, G., Lopes, P. F., Juras, A. A., and Silvano, R. A. M. (2013). Fishers' knowledge identifies environmental changes and fish abundance trends in impounded tropical rivers. Ecol. Appl. 23, 392–407. doi: 10.1890/12-0429.1
Hoshino, E., Van Putten, I., Girsang, W., Resosudarmo, B. P., and Yamazaki, S. (2016). A Bayesian belief network model for community-based coastal resource management in the Kei Islands, Indonesia. Ecol. Soc. 21:16. doi: 10.5751/ES-08285-210216
Hothorn, T., Buehlmann, P., Dudoit, S., Molinaro, A., and Laan, M. V. D. (2006a). Survival ensembles. Biostatistics 7, 355–373. doi: 10.1093/biostatistics/kxj011
Hothorn, T., Hornik, K., and Zeileis, A. (2006b). Unbiased recursive partitioning: a conditional inference framework. J. Comput. Graph. Stat. 15, 651–674. doi: 10.1198/106186006X133933
James, F. C., and McCulloch, C. E. (1990). Multivariate-analysis in ecology and systematics; panacea or pandora box. Annu. Rev. Ecol. Syst. 21, 129–166. doi: 10.1146/annurev.es.21.110190.001021
Janitza, S., Tutz, G., and Boulesteix, A.-L. (2016). Random forest for ordinal responses: prediction and variable selection. Comput. Stat. Data Anal. 96, 57–73. doi: 10.1016/j.csda.2015.10.005
Johannes, R. E., Freeman, M. M. R., and Hamilton, R. J. (2000). Ignore fishers' knowledge and miss the boat. Fish Fish. 1, 257–271. doi: 10.1046/j.1467-2979.2000.00019.x
Jupiter, S. D., Cohen, P. J., Weeks, R., Tawake, A., and Govan, H. (2014). Locally-managed marine areas: multiple objectives and diverse strategies. Pac. Conserv. Biol. 20, 165–179. doi: 10.1071/PC140165
Liere, K. D. V., and Dunlap, R. E. (1980). The social bases of environmental concern: a review of hypotheses, explanations and empirical evidence. Public Opin. Q. 44, 181–197. doi: 10.1086/268583
Measham, T. G., and Lumbasi, J. A. (2013). Success factors for community-based natural resource management (CBNRM): Lessons from Kenya and Australia. Environ. Manage. 52, 649–659. doi: 10.1007/s00267-013-0114-9
Melnychuk, M. C., Banobi, J. A., and Hilborn, R. (2013). Effects of management tactics on meeting conservation objectives for Western North American groundfish fisheries. PLoS ONE 8:e56684. doi: 10.1371/journal.pone.0056684
Melnychuk, M. C., Essington, T. E., Branch, T. A., Heppell, S. S., Jensen, O. P., Link, J. S., et al. (2016). Which design elements of individual quota fisheries help to achieve management objectives? Fish Fish. 17, 126–142. doi: 10.1111/faf.12094
Mosse, J. W., Tetelepta, J. M. S., and Letsoin, F. X. V. R. (2012). Hawear di Kepulauan Kei (Hawear in Kei Islands). Ambon: Balai Pelestarian Nilai Budaya Ambon.
Murphy, A. H. (1970). The ranked probability score and the probability score: a comparison. Mon. Weather Rev. 98, 917–924. doi: 10.1175/1520-0493(1970)098<;0917:TRPSAT>2.3.CO;2
NHMRC (2007). National Statement on Ethical Conduct in Human Research. Canberra, ACT: National Health and Medical Research Council, Australian Goverment.
Nikijuluw, V. P. H. (1995). Community-based fishery management (Sasi) in Central Maluku. Indones. Agric. Res. Dev. J. 17, 33–39.
Novaczek, I., Harkes, H. T., Sopacua, J., and Tatuhey, M. D. D. (2001). An Institutional Analysis of Sasi Laut in Maluku, Indonesia. Penang: The WorldFish Center.
Pomeroy, R., Cinner, J., and Raakjaer Nielsen, J. (2011). “Conditions for successful co-management: lessons learned in Asia, Africa, the Pacific and the wider Caribbean,” in Small-Scale Fisheries Management: Frameworks and Approaches for the Developing World, eds R. S. Pomeroy and N. L. Andrew (Cambridge: CABI International), 115–131.
Robertson, M. P., Caithness, N., and Villet, M. H. (2001). A PCA-based modelling technique for predicting environmental suitability for organisms from presence records. Divers. Distrib. 7, 15–27. doi: 10.1046/j.1472-4642.2001.00094.x
Salini, S., and Kenett, R. S. (eds.). (2011). “Standards and classical techniques in data analysis of customer satisfaction surveys,” in Modern Analysis of Customer Surveys (Chichester: John Wiley and Sons, Ltd.), 1–18.
Sethi, S. A., Dalton, M., and Hilborn, R. (2012). Quantitative risk measures applied to Alaskan commercial fisheries. Can. J. Fish. Aquat. Sci. 69, 487–498. doi: 10.1139/f2011-170
Strobl, C., Boulesteix, A.-L., and Augustin, T. (2007). Unbiased split selection for classification trees based on the Gini Index. Comput. Stat. Data Anal. 52, 483–501. doi: 10.1016/j.csda.2006.12.030
Strobl, C., Boulesteix, A.-L., Kneib, T., Augustin, T., and Zeileis, A. (2008). Conditional variable importance for random forests. BMC Bioinform. 9:307. doi: 10.1186/1471-2105-9-307
Syms, C. (2008). “Principal components analysis A2 - Jørgensen, Sven Erik,” in Encyclopedia of Ecology, ed B. D. Fath (Oxford: Academic Press), 2940–2949.
Thorburn, C. (2001). The house that poison built: customary marine property rights and the live food fish trade in the Kei Islands, Southeast Maluku. Dev. Change 32, 151–180. doi: 10.1111/1467-7660.00200
Vrooman, J. C. (2012). Regimes and cultures of social security: comparing institutional models through nonlinear PCA. Int. J. Comp. Sociol. 53, 444–477. doi: 10.1177/0020715212469512
Wattimena, G. A. (2003). “Contoh-contoh agroforestry di maluku,” in Materi Pelatihan Agroforestry di Indonesia, eds H. S. Arifin, M. A. Sardjono, T. Jogo, L. Sundawati, G. A. Wattimena, and Widianto (Bogor: World Agroforestry Centre (ICRAF)), 3–11.
Keywords: common pool resources, fisheries, marine tenure, Sasi, small islands
Citation: Hoshino E, van Putten EI, Girsang W, Resosudarmo BP and Yamazaki S (2017) Fishers' Perceived Objectives of Community-Based Coastal Resource Management in the Kei Islands, Indonesia. Front. Mar. Sci. 4:141. doi: 10.3389/fmars.2017.00141
Received: 22 November 2016; Accepted: 26 April 2017;
Published: 17 May 2017.
Edited by:
Marc Kochzius, Vrije Universiteit Brussel, BelgiumReviewed by:
José Lino Vieira De Oliveira Costa, Universidade de Lisboa, PortugalUlisses Miranda Azeiteiro, University of Aveiro, Portugal
Copyright © 2017 Hoshino, van Putten, Girsang, Resosudarmo and Yamazaki. This is an open-access article distributed under the terms of the Creative Commons Attribution License (CC BY). The use, distribution or reproduction in other forums is permitted, provided the original author(s) or licensor are credited and that the original publication in this journal is cited, in accordance with accepted academic practice. No use, distribution or reproduction is permitted which does not comply with these terms.
*Correspondence: Eriko Hoshino, ZXJpa28uaG9zaGlub0Bjc2lyby5hdQ==