 Jason W. Peters
 David B. Eggleston
 Brandon J. Puckett
 Seth J. Theuerkauf
- 1Department of Marine, Earth and Atmospheric Sciences, Center for Marine Sciences and Technology, North Carolina State University, Morehead City, NC, United States
- 2North Carolina Division of Marine Fisheries, Morehead City, NC, United States
- 3North Carolina Coastal Reserve and National Estuarine Research Reserve, Beaufort, NC, United States
Fishery species that reside in no-take, marine reserves often show striking increases in size and abundance relative to harvested areas, with the potential for larval spillover to harvested populations. The benefits of spillover, however, may not be realized if the populations or habitats outside of reserves are too degraded. We quantified oyster population density and demographics such as recruitment, growth, mortality, and potential larval output as a function of two types of oyster management strategies in Pamlico Sound, North Carolina, USA: (1) natural reefs + harvested and (2) restored reefs + harvested. We compared these data to demographic data collected as a function of a third type of management strategy, (3) restored reefs + protected from harvest. Mean oyster recruitment was ~12 times higher in restored + harvested reefs than in natural + harvested reefs. Mean total oyster density was ~8- to 72-times higher in restored + protected reefs than in restored + harvested or natural + harvested reefs, respectively. Moreover, harvested reefs exhibited truncated size structure, and few or no individuals greater than legal size (75 mm), whereas protected reefs typically had a polymodal size structure, including many large individuals. We estimate that restored + protected reefs have ~4 to 700 times greater potential larval output m−2 than restored + harvested or natural + harvested reefs, respectively. After accounting for total sound-wide areal coverage of each reef type, total potential larval output from restored + protected reefs was ~6 times greater than that from natural + harvested and restored + harvested reefs. Marine reserves can potentially subsidize harvested populations via larval spillover, however, in the case of oyster reefs in Pamlico Sound, the relatively degraded conditions of natural reefs (e.g., low vertical relief, low shell volume per square meter) may not provide much in the way of suitable settlement substrate to realize the benefits of larval spillover from reserves. Restoration of oyster reefs, even with a thin veneer of substrate, may improve settlement substrate to increase the benefits of larval spillover from reserves.
Introduction
Marine protected areas (MPAs) and restoration are potentially powerful management tools for stemming declines in marine populations, loss of habitat, and degradation of marine ecosystems. Protection from harvest within MPAs (i.e., no-take reserves), especially in the case of sedentary species such as bivalves, can increase biomass, abundance, average size of individual species, as well as overall species diversity (Halpern, 2003; Lubchenco et al., 2003; Sobel and Dahlgren, 2004; Schulte et al., 2009; Christie et al., 2010; Ludford et al., 2012). In contrast, some studies indicate a decline or no apparent difference in these biological measures inside vs. outside of no-take reserves (Dufour et al., 1995; Valles et al., 2001; Tupper and Rudd, 2002). In cases where the abundance and size of individuals of a given species within reserves is greater and larger, respectively, than outside reserves, greater overall reproductive output can lead to a “spillover effect” of larvae and individuals from inside to outside the reserve (Sobel and Dahlgren, 2004; Christie et al., 2010). “Spill over” of larvae or individuals from reserves to exploited subpopulations is beneficial through supplementing exploited subpopulations via supplying recruits (Kellner et al., 2007; Ludford et al., 2012). Because marine reserves are generally not demographically closed (i.e., often connected via emigration/immigration with other subpopulations through larval dispersal), there is a high potential for exchange of larvae spawned within no-take reserves and harvested sites. It is important to recognize that for reef building organisms such as coral reefs and oysters, the quantity and quality of their habitat likely determines whether or not the benefits of enhanced larval spillover are realized (Harrison et al., 2012).
Demographic data on the relative reproductive output from harvested and protected populations is limited, despite its implications for “spillover” or “spill-in” of larvae to and from harvested populations (Botsford et al., 2001). For example, although density, size, and demographic rates (e.g., growth and survival) of species located within no-take reserves are often greater than those outside of reserves, the total area of reserves is often extremely small relative to harvested areas (Halpern, 2003; Baskett et al., 2007; Eggleston et al., 2009). The concept that harvested areas, with their greater areal cover relative to reserves, could provide a spill-in of larvae to reserves is similar to the concept of “effective juvenile habitat” (EJH, Dahlgren et al., 2006). The concept of EJH recognizes that relatively large habitat areas may not support high per capita demographic rates (e.g., the Nursery Role Hypothesis, Beck et al., 2001, 2003), yet nevertheless contribute significantly to the adult population due to large areal cover. In this study, we present population demographics (i.e., oyster population density, size structure, and recruitment) of natural, non-restored, and restored subtidal oyster reefs exposed to harvest and compare their relative reproductive output with estimates from restored subtidal oyster reefs protected from harvest (Mroch et al., 2012; Puckett and Eggleston, 2012).
Oyster restoration has become a global endeavor in response to ~85% declines in oyster reefs relative to historical levels (Beck et al., 2011). As oyster populations have declined, so too has the quality of the habitat for oyster larvae that rely on oyster shell and other hard substrate for settlement. Concomitant with declines in oyster populations and oyster reef habitat quality are the loss of many ecological and economic functions that oysters provide, such as water filtration, benthic-pelagic coupling, essential fish habitat, food for aquatic organisms, and commercial harvest (Coen et al., 2007; Mackenzie, 2007; Pierson and Eggleston, 2014). Overall decline in oyster habitat and biomass can be attributed largely to habitat destruction from intensive harvest pressure (Gross and Smyth, 1946; Rothschild et al., 1994; Kirby, 2004). To ameliorate the impacts of harvest, oyster restoration has taken many forms, and generally consists of strategies that replenish settlement substrate removed during harvest, protection of broodstock from harvest (e.g., no-take reserves), or a combination of both (Coen and Luckenbach, 2000; Powers et al., 2009; Schulte et al., 2009). For example, in North Carolina (location of this study) the North Carolina Division of Marine Fisheries (NCDMF) has used a combination of both approaches. The NCDMF restored reefs within 10 no-take oyster broodstock reserves in Pamlico Sound, NC (PS) between 1996 and 2008 in an effort to establish a self-sustaining network of reserves, and to provide spillover of larvae to harvested areas. Reefs within reserves are high-relief (~1–2 m) and generally constructed with limestone boulders or concrete pieces ~30–50 cm diameter. Previous research has quantified oyster demographics within this network of broodstock reserves, and found that some reserves serve as metapopulation sources and others as metapopulation sinks based on differences in larval production, larval connectivity, subsequent recruitment (Haase et al., 2012; Mroch et al., 2012; Puckett and Eggleston, 2012, 2016; Puckett et al., 2014). Oyster densities in 8 of 10 reserves increased ~400% between 2006 and 2008 (Puckett and Eggleston, 2012), however, larval connectivity among reserves does not appear sufficient for reserves (or the reserve network) to be self-sustaining (Haase et al., 2012; Puckett et al., 2014; Puckett and Eggleston, 2016). Biophysical modeling results suggest that observed density increases in the broodstock reserves are the result of larval spill-in from the harvested component of the oyster metapopulation in PS (Puckett and Eggleston, 2016).
In addition to restoring reefs within designated no-take reserves, NCDMF annually restores reefs to provide oyster settlement habitat suitable for the development of oyster populations that are subsequently open for harvest. These harvestable reefs are created using a variety of settlement materials collectively referred to as “cultch.” Cultch material typically consists of oyster shell, concrete, limestone marl (~5 cm diameter), or other shell types. Cultch-planted reefs are constructed by spreading a thin veneer of material on the bottom within pre-determined coordinates. As a condition of the United States Corps of Engineers Nationwide 27 construction permit, vertical relief of cultch-planted reefs does not exceed 18 inches (~45 cm) and reef size is a function of the amount of cultch material deposited (C. Caroon, NCDMF, pers. comm.). Although cultch-planted reefs are open to harvest immediately, they are typically not subject to harvest until oysters on the reef have reached a harvestable size (>75 mm shell height), which can occur within 2–3 years post-settlement. Subtidal oyster harvesting is primarily a commercial fishery which typically occurs between October and March via mechanical dredging and hand tonging. The fishery includes ~850–1,000 participants annually (NCDMF, 2016). In general, cultch-planted reefs persist for 5–7 years, but some can last for 20+ years (C. Caroon, NCDMF, pers. comm.).
To evaluate the demographic benefits of habitat restoration and harvest protection, this study sought to address three main objectives: (1) map and characterize the distribution and abundance of two types of harvested, subtidal oyster reefs in Pamlico Sound, North Carolina, (i) natural oyster reefs (herein referred to as “natural + harvested”), and (ii) cultch-planted reefs (herein referred to as “restored + harvested”), and (2) quantify oyster population density, recruitment, and potential larval output as a function of these two types of oyster management strategies. Objective 3 was to compare and contrast oyster demographics from natural + harvested and restored + harvested oyster reefs with similar demographic data from no-take restored reefs within PS (herein referred to as “restored + protected”) from a related study (Puckett and Eggleston, 2012), to assess the relative reproductive output of all three reef types as it relates to potential larval spill-in to reserves and larval spillover from reserves.
Materials and Methods
Study System
The Croatan-Albemarle-Pamlico Estuarine System (CAPES) in North Carolina is the second largest estuarine system in the United States, with a total area of ~6,600 km2 (Pietrafesa et al., 1986). It is a bar-built estuary, separated from the Atlantic Ocean by the Outer Banks barrier islands. The CAPES is characterized as a lagoonal estuarine system with three inlets regulating exchange of water with the Atlantic Ocean (Luettich et al., 2002; Lin et al., 2007). Pamlico Sound is the largest water body in the CAPES, covering an area of ~4,800 km2. The mean depth of this shallow estuarine system is 4.9 m, with maximum depths around 7.3 m (Epperly and Ross, 1986). The mean salinity in PS is 15 psu, with salinity ranges affected by freshwater inflow that occurs from the west (Tar-Pamlico and Neuse rivers) and the northwest (Albemarle Sound and tributaries) (Xie and Eggleston, 1999). Salinities in eastern PS are generally the highest, averaging about 25 psu, and lowest along western PS, averaging 14 psu (Xie and Eggleston, 1999; Durham, 2009). Both natural and restored subtidal oyster reefs exist in PS within a salinity range of about 10–26 psu, and are separated from each other by ~1–125 km. In Pamlico Sound, commercial oyster harvest is generally open annually from fall (mid-October) to spring (end of March).
Site Selection and Reef Mapping
Site Selection
To quantify oyster demographics in natural and cultch-planted oyster reefs, Pamlico Sound was first divided into two regions of relatively low-salinity sites (average 10–18 psu) along the western shore and relatively high-salinity sites (average 18–26 psu) along the eastern shore (Figure 1; Xie and Eggleston, 1999; Durham, 2009). Relatively high salinities (>18 psu) can be a major determinant of predation, disease, and parasites affecting oysters in PS and adjacent estuaries (Wells, 1961; Geraldi et al., 2013; Dunn et al., 2014). Blocking by salinity was intended to reduce variation in demographics among sites within a region. For example, several restored oyster reefs in Pamlico Sound have recently experienced rapid population declines, potentially caused, in part, by Clionid boring sponge infestation of the marl rock (a calcium carbonate-mud composite material) commonly used as a reef substrate and of the shells of oysters that colonize the marl reef foundation (Dunn et al., 2014). The composition and porosity of marl may make it vulnerable to infestation by carbonate bioeroders, particularly Clionid sponges (Dunn et al., 2014). Further blocking by other abiotic variables, such as sediment type, distance to river mouths, however, would have greatly reduced overall sample size within a given salinity regime. Moreover, the NCDMF standardizes the location of cultch sites to relatively shallow (~3 m) areas that contain a muddy sand bottom, and to areas that are relatively well-protected from high wind fetch (G. Wright, NCDMF, pers. comm).
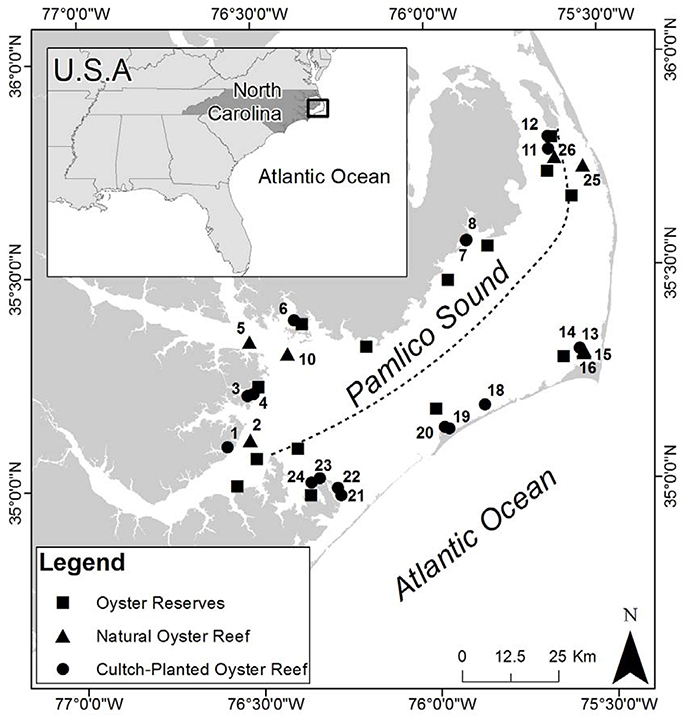
Figure 1. Study sites in Pamlico Sound (PS), North Carolina. Dashed line indicates East/West designation based on the dashed line drawn from the Neuse River northeastward to Roanoke Island to denote relatively low (10–18 psu) vs. high (18–26 psu) salinity areas in PS (Durham, 2009). Oyster reserves are identified by black squares, restored cultch-planted oyster reefs by black circles, natural oyster reefs by black triangles. Site numbers are adjacent to the symbol they represent.
Within each region, eight cultch-planted reefs and four naturally occurring reefs were randomly selected for study from a NCDMF benthic habitat mapping database (Figure 1; North Carolina Department of Environmental, Quality, Division of Marine Fisheries, 2013). Presence of these sites was verified through initial site reconnaissance (see section Reef Mapping). Field sampling in 2012 demonstrated that two natural reefs selected from the database did not harbor any oysters during three consecutive sampling events. Therefore, those two sites were omitted from the study and one natural reef in each region was added in August 2013 to improve estimates of demographics.
Reef Mapping
Site reconnaissance was conducted during April–May 2012 by on-site “tonging,” which was used to delineate site boundaries. This method involved vertically probing with a long PVC pole from the surface to distinguish shell vs. soft bottom substrate. Site boundary coordinates were imported into ArcGIS (ESRI, 2016) to calculate each site's areal extent, or “footprint.” Estimates of site area were used to (1) allocate sampling effort, and (2) allow us to scale-up demographics, such as potential larval output, from m−2 to total potential output for a given reef type (see below). The total area of natural + harvested oyster reefs in PS was estimated using existing NCDMF data on shell bottom (North Carolina Department of Environmental, Quality, Division of Marine Fisheries, 2013), multiplied by a corrective factor of 0.44 to account for missing or non-existent reefs based on our field reconnaissance (see section Results, Ground-Truthing and Reef Mapping; sensu Theuerkauf et al., 2017). The total area of cultch-planted reefs (restored + harvested) was estimated by multiplying the average mapped reef size by 137, which is the estimated total number of existing cultch-planted reefs at the time of our surveys.
Oyster Demographics in Harvested Populations
Oyster Density
Quadrat sample coordinates were randomly selected within the mapped boundaries of 24 reef sites (see section Site Selection and Reef Mapping). Sample data were collected from each of these sites during May, August, and October 2012 and June, August, and October 2013. For this study, each quadrat served as a replicate sample of oyster density within a given treatment (region, reef type, time; Table 1).
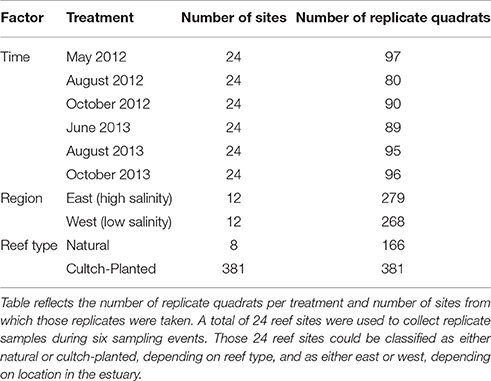
Table 1. Sampling effort.
Data were collected using a combination method of quadrat sampling and hand excavation to a depth of 15 cm by divers using SCUBA (Powers et al., 2009; Puckett and Eggleston, 2012). In 2012, oysters were sampled using a 0.25 m2 quadrat, while in 2013, a 1 m2 quadrat was used for oyster excavations to increase sample size at low oyster density sites. For quadrat samples with abundant oysters (>100 oysters m−2), a sub-sample quadrat (0.25 or 0.5 m2) was excavated. All excavated material was placed in mesh bags and brought to the surface for immediate processing. Processing included measuring the left valve length (LVL) of all oysters collected, from the umbo region to the outer edge of the shell. The number of excavated oysters were counted and scaled to oysters m−2 to account for sub-sampling. Replicate quadrat samples were separated into three size class densities: (1) recruits (LVL < 25 mm), (2) sub-legal (25 mm ≤ LVL < 75 mm), and (3) legal oysters (LVL ≥ 75 mm). At each site, water temperature, salinity, and dissolved oxygen were measured using a YSI 85 water quality instrument. We never recorded any instances of hypoxia (i.e., <4 mg l−1).
At conception, the experimental design for this study focused on sites as the experimental unit and quadrats as replicates. Mean oyster density was the mean of all quadrat samples at each site at a given sampling time. Given this design, we initially took a more traditional approach by using a repeated measures ANOVA model to test if oyster response variables such as mean density varied by reef type, region and time, however, homogeneity of variance tests (i.e., Levene's Test) indicated that transformed data for all oyster size classes failed to meet the assumption of homoscedasticity. Therefore, we elected to analyze these data using randomization tests which considered the randomly selected individual quadrat samples as the experimental unit.
Randomization tests do not carry any assumptions of ANOVA, other than independence of samples, therefore they serve as a more robust test of the null hypothesis (in this case, no difference in mean oyster densities). Compared to traditional non-parametric methods, randomization tests can be considered a more powerful alternative to minimize type I error rates when ANOVA assumptions are violated (Peres-Neto and Olden, 2001). Quadrat samples were randomly selected for each sampling event, thus they were deemed independent, despite being confined to the boundaries of 24 areas. In this case, time is no longer a repeated measure, rather simply Time was a factor since samples through time were deemed independent (i.e., the same m2 of oyster reef was not sampled more than once). We tested if a given response variable (mean oyster total density, legal density, sub-legal density, and recruit density) varied significantly according to Reef Type (natural or restored cultch-planted), Region (high salinity-eastern vs. low salinity-western region of PS), or Time (May'12, August'12, October'12, June'13, August'13, or October'13) with 12 separate randomization tests, evaluating reef type, region, and time as factors of variability within each size class (total, legal, sublegal, and recruit).
The randomization tests are applied to test whether the original distribution of densities among groups (reef type, region, or time) is significantly different; the test was applied separately for each size class. The test statistic evaluated was the F-statistic from a one-way ANOVA. The ANOVA is first applied to the original data and the F-statistic, FOrig, is calculated. The data are then pooled and randomized (9,999 times) among groups keeping the original numbers of values in each group the same. Resampling is without replacement. The F-statistic from each randomization is stored in a vector along with FOrig. The number of F-values in that vector that are greater than or equal to FOrig is computed and divided by 10,000 to give the p-value, the probability of obtaining a value like the observed test statistic. Results were considered statistically significant at alpha = 0.05. The randomization tests were performed using a custom function developed in R (D. C. Howell, personal communication; R Core Team, 2017).
Oyster Demographics in Harvested vs. Protected Populations
Estimates of oyster demographics in this study (density, recruitment, larval output m−2, and total potential larval output) were compared with similar data collected in restored + protected, oyster broodstock reserves in PS during 2006–2008 (Mroch et al., 2012; Puckett and Eggleston, 2012). As of 2011, a total of 10 broodstock reserves had been established in PS with areal cover ranging in size from 0.16 to 12.7 ha. Total area for all 10 reserves is ~57.1 ha.
Potential Larval Output
We estimated size-specific potential larval output from each harvested site (eggs m−2) in this study by integrating oyster length frequencies with spatially-explicit and size-specific per-capita fecundity from a related study in PS by Mroch et al. (2012). Mroch et al. (2012) quantified size-specific oyster fecundity among six reserves in PS, and across 2 months and 2 years. Potential larval output for oysters in PS peaks in May prior to the first spawning event of the season (Mroch et al., 2012). Therefore, we used oyster density and length frequency estimates from May'12 and June'13 to estimate potential larval output from harvested sites. Size-specific per capita fecundity at the harvested sites sampled in this study was interpolated using inverse distance weighting of per capita fecundity estimated by Mroch et al. (2012). Per capita fecundity estimates were adjusted for density-dependent fertilization success (FS) based on Levitan et al. (1992) as:
where D is total oyster density m−2. Fertilization success was capped at 100% in the event oyster densities were sufficiently high to generate fertilization success >100%. Site-specific estimates of larval output m−2 were first pooled to calculate a mean larval output m−2 by reef type. Total potential larval output for each reef type was then computed by multiplying larval outputs m−2 by their respective total areal coverage in PS. A range of total larval output for natural reefs was estimated based on NCDMF-reported natural reef areal extent and an adjusted areal extent from this study (see section Results, Ground-Truthing and Reef Mapping).
Results
Ground-Truthing and Reef Mapping
In general, western PS had a greater number of harvested subtidal oyster reefs than eastern PS, although field observations suggest reefs were generally smaller in size (J. Peters pers. obs. NCDMF unpub. data). We mapped and quantified oyster demographic parameters in a total of 13.30 ha of harvested oyster reefs, including both natural and restored cultch-planted types. A total of 10 of 18 natural + harvested reefs (56%) did not harbor oysters during three successive sampling dates. The eight natural + harvested reefs with oysters had a total area of 8.66 ha and ranged in size from 0.03 to 6.04 ha. Mean areal cover for natural + harvested reefs was 1.08 ha (σM = 0.7 ha). All NCDMF restored + harvested, cultch-planted reefs were present at the reported coordinates. A total of 16 restored + harvested reefs were mapped, with a total area of 4.64 ha. Restored + harvested sites in this study ranged in size from 0.02 to 1.1 ha and were, on average, considerably smaller than natural reefs (mean = 0.29 ha, σM = 0.07 ha).
According to the NCDMF's benthic habitat mapping database (North Carolina Department of Environmental, Quality, Division of Marine Fisheries, 2013), there are ~5,929 ha of subtidal, shell bottom in PS. Based on our field surveys of potential natural + harvested reefs from this NCDMF database, only 44% of locations with shell bottom contained extant oyster reefs. Therefore, we have adjusted the amount of shell bottom coverage to a total of 2,609 ha. The adjusted area of natural + harvested oyster reefs in this study (2,609 ha) may be considered a low-range estimate, whereas the NCDMF estimate of shell bottom (5,929 ha) may be considered a high-range estimate for existing natural reef area in PS (considering 4,046 ha of oyster reef were present in historical reports; Winslow, 1886).
Restored + harvested, cultch-planted reefs created prior to 2005 were considered non-existent due to fishing pressure, sedimentation and shell erosion, therefore only 137 reefs were considered to be in existence by 2011 (C. Caroon, NCDMF, pers. comm.). Based on our mapping of restored + harvested sites, which had an average areal cover of 0.29 ha, we estimate the overall areal cover of these reefs in PS to be 39.73 ha (137 cultch sites × 0.29 ha/reef). The areal cover of 10 restored + protected, broodstock reserves in PS, based on sanctuary boundaries, is 57.18 ha (NCDMF, unpub. data).
Oyster Demographics in Harvested Populations
A total of 102,634 oysters were counted from eight natural + harvested reefs and 16 restored + harvested, cultch-planted reefs in PS during our 2-year study from May 2012 to October 2013.
Reef Type Variation
For all size classes, restored + harvested reefs harbored significantly greater densities than natural + harvested reefs (all df = 1, 544, p < 0.01; Figures 2A–D). In total and for the sublegal size class, restored + harvested reefs contained ~8-times more oysters per square meter than natural + harvested reefs. Moreover, restored + harvested reefs contained ~4.5-times more legal sized oysters and ~12-times more recruit sized oysters per square meter than natural + harvested reefs.
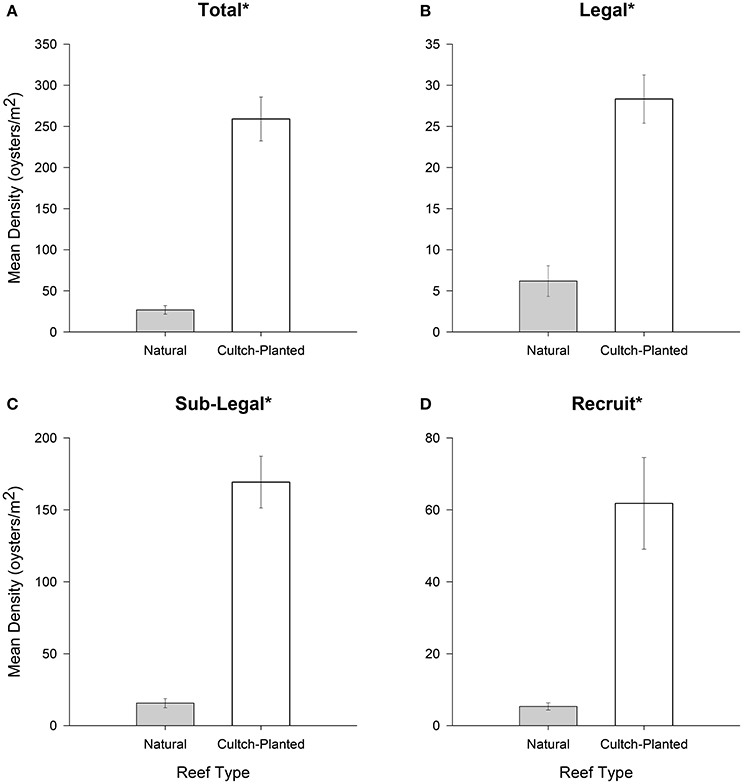
Figure 2. Mean oyster density (oysters m−2) for (A) total (all size-classes), (B) legal (LVL ≥ 75 mm), (C) sub-legal (25 mm ≤ LVL < 75 mm), and (D) recruit (LVL < 25 mm) size classes for Natural + Harvested vs. Restored + Harvested cultch-planted oyster reefs. Error bars designate standard error. Significant differences are denoted by an asterisk (*). See text for results of statistical rests.
Regional Variation
Significant regional differences in population density were observed for the sublegal size class (df = 1, 544, p < 0.01) and for the cumulative total of size classes (df = 1, 544, p < 0.01), but not for the legal (df = 1, 544, p = 0.18) and recruit (df = 1, 544, p = 0.19) size classes (Figures 3A–D). Mean total oyster density was ~2-times greater at sampling sites located in the western region of PS than the eastern region. Density of sublegal oysters was nearly four times higher at sites along the western shore of PS compared to the eastern shore.
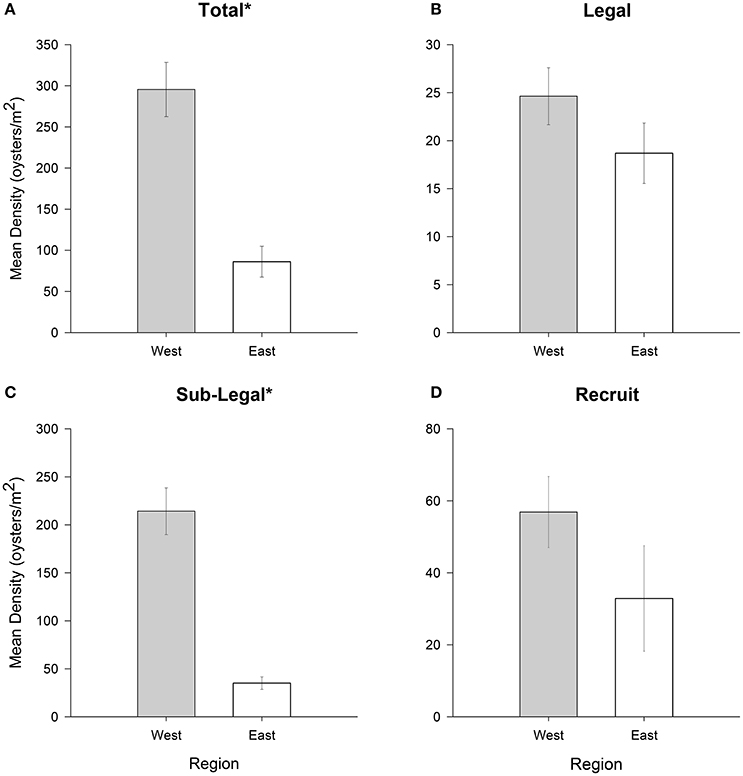
Figure 3. Mean oyster density (oysters m−2) for (A) total (all size-classes), (B) legal (LVL ≥ 75 mm), (C) sub-legal (25 mm ≤ LVL < 75 mm), and (D) recruit (LVL < 25 mm) size classes for oyster reefs in eastern (relatively high salinity) and western (relatively low salinity) PS. Error bars designate standard error. Significant differences are denoted by an asterisk (*). See text for results of statistical tests.
Temporal Variation
Over time, a significant and steady decline in oyster population density was observed for legal and sublegal size classes, as well as the total (all df = 5, 544, p < 0.01; Figures 4A–C). These size classes experienced a ~60 to ~80% loss from May 2012 to October 2013. Recruit density also varied significantly over time, though the trend oscillated (df = 5, 544, p < 0.02, Figure 4D). Peaks in recruit density were apparent in May and October 2012, with no marked increase during any sampling event in 2013.
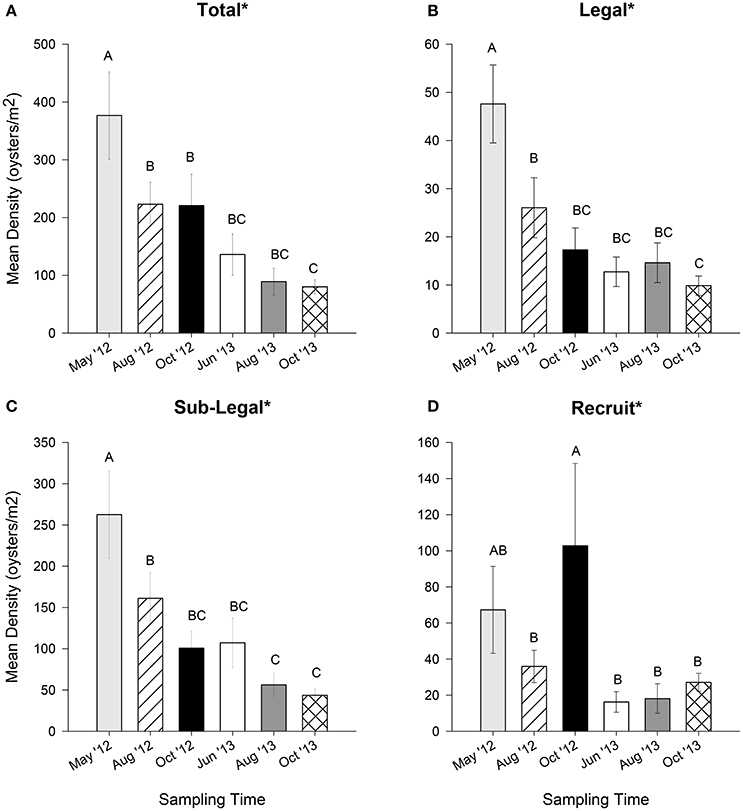
Figure 4. Mean oyster density (oysters m−2) for (A) total (all sizes), (B) legal (LVL ≥ 75 mm), (C) sub-legal (25 mm ≤ LVL < 75 mm), and (D) recruit (LVL < 25 mm) size classes for six sampling times during May, August, and October 2012 and June, August, and October 2013. Error bars designate standard error. A significant time effect is denoted by an asterisk (*). Different letters indicate significant differences between months as determined using Duncan's multiple range test. See text for results of statistical tests.
Oyster Demographics in Harvested vs. Protected Populations
Density
There was a striking decrease in oyster density going from no-take to harvested oyster reefs. For example, mean total oyster density was 72.2- and 7.5-times higher in restored + protected sites than natural + harvested and restored + harvested reefs, respectively (Figure 5A). Mean density of legal oysters was 27- and 6-times higher in restored + protected than in natural + harvested and restored + harvested reefs, respectively (Figure 5B). Similarly, mean density of sub-legal oysters was 52- and 5-times higher in restored + protected than natural + harvested and restored + harvested reefs, respectively (Figure 5C). Lastly, the mean density of recruits in restored + protected reefs was 178- and 15-times higher than natural + harvested and restored + harvested reefs, respectively (Figure 5D).
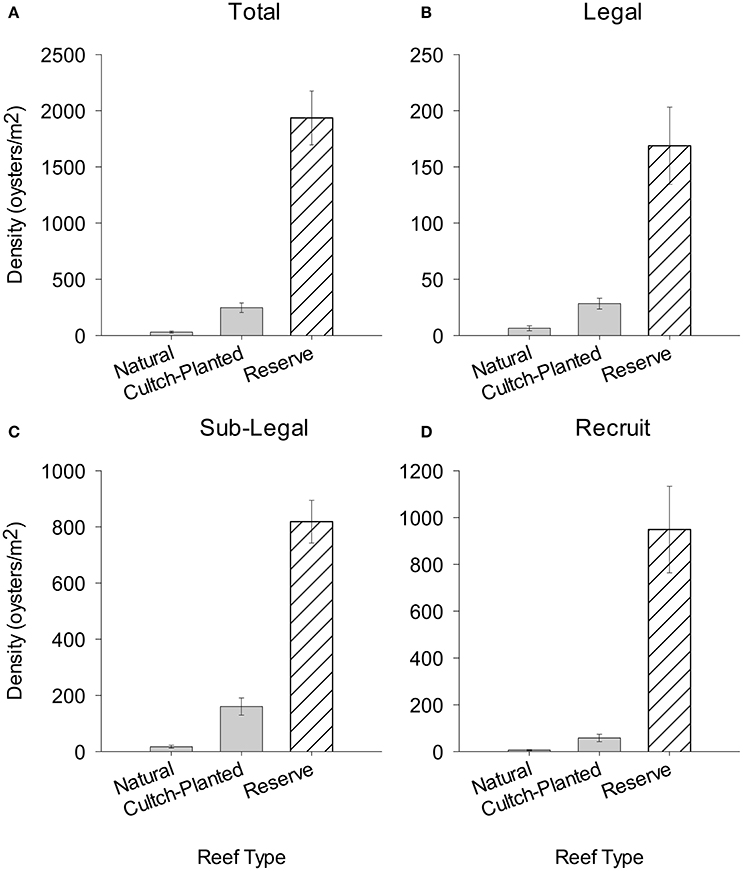
Figure 5. Mean population density (m−2) of (A) total, (B) legal, (C) sub-legal, and (D) recruit size class oysters on Natural + Harvested and Restored + Harvested cultch-planted reefs (this study) compared to Restored + Protected reserve sites (Puckett and Eggleston, 2012). Error bars represent standard error.
Size Structure
Striking differences in size structure were also observed between harvested and protected reefs. Natural + harvested reefs exhibited truncated size structure with few or zero individuals greater than legal size (76 mm; Figure 6A). The size structure of restored + harvested, cultch-planted reefs was generally uni- or bi-modal with very few legal sized individuals (Figure 6B). Restored + protected, high-relief reefs typically had a polymodal size structure, including many large individuals (Figure 6C). Relative size class abundance also varied between harvested and reserve oyster reefs. For example, recruits composed 62.8% of total individuals within restored + protected reefs vs. only 23.5% at harvested reefs. At harvested reefs, sub-legal sized oysters were generally most abundant, comprising more than half of the total density in protected reefs.
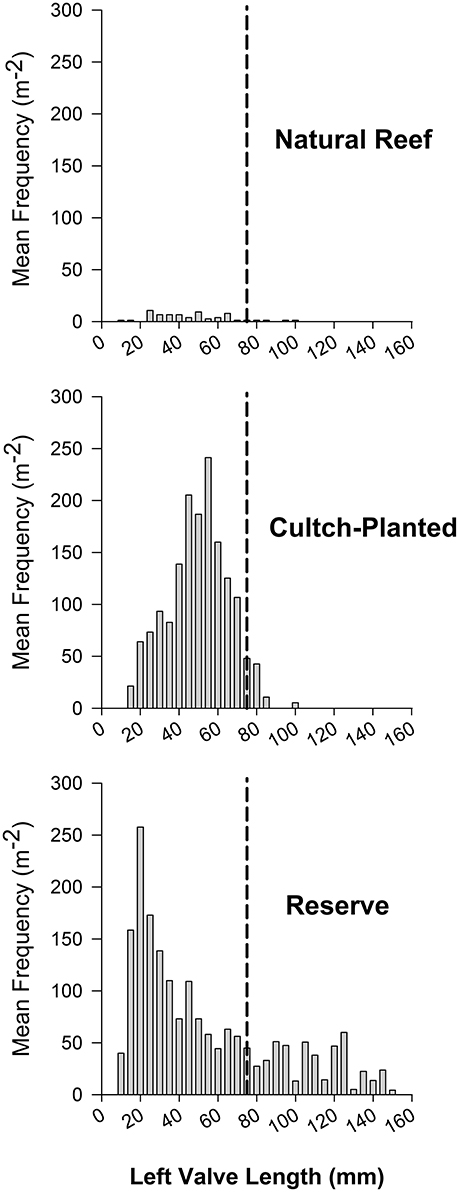
Figure 6. Example length-frequency distributions of (A) Natural + Harvested (site 2), (B) Restored + Harvested cultch-planted (site 11), and (C) Restored + Potected reserve (Ocracoke, Puckett and Eggleston, 2012) reef types during May 2012 (natural and cultch-planted) and June 2006 (reserve). Mean frequency is reported in oysters m−2 and size class designations are established at 5 mm. A vertical dotted line at 75 mm represents the minimum oyster size limit for commercial harvest in North Carolina.
Potential Larval Output
Integration of interpolated per-capita fecundity for a given oyster size-class from Mroch et al. (2012) with length frequency data from this study and those from Puckett and Eggleston (2012) suggests restored + protected reefs have ~4 to 700-times greater potential larval output m−2 than restored + harvested and natural + harvested oyster reefs, respectively (Figure 7A). Per square meter larval output was estimated at 0.02 × 10⁶ ± 0.01 × 10⁶ larvae m−2 for natural + harvested reefs and 2.9 × 10⁶ ± 0.9 × 10⁶ larvae m−2 for restored + harvest reefs, whereas per square meter larval output of restored + protected reefs was 12.7 × 10⁶ ± 2.4 × 10⁶ larvae m−2. Accounting for total sound-wide areal coverage of each reef type (see section Results, Ground-Truthing and Reef Mapping), adjusted total potential larval output from restored + protected reefs (7.3 × 10¹² larvae) was ~6 times greater than that from natural + harvest reefs (1.2 × 10¹² larvae) due to the ~two orders of magnitude greater areal cover of natural + harvest reefs (Figure 7B). The potential larval output from restored + harvest reefs (1.2 × 10¹² larvae) was also ~6 times less than that from restored + protected reefs.
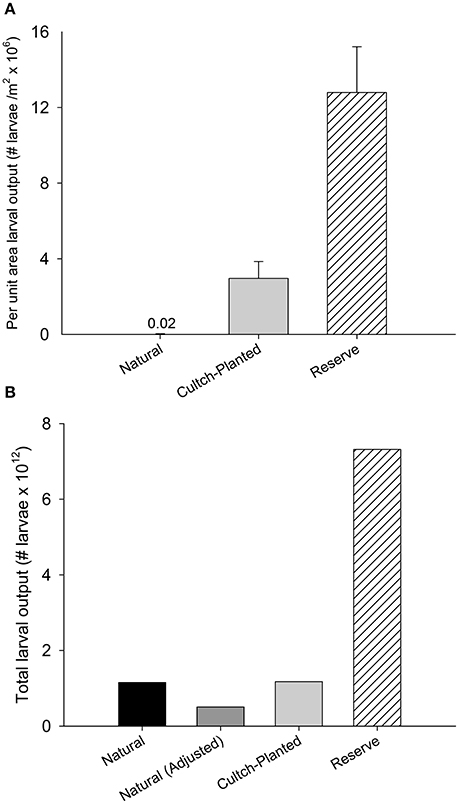
Figure 7. Mean larval output (±SE) by Natural + Harvested, Restored + Harvested cultch-planted, and Restored + Protected reserve reef types (A) per unit area and (B) scaled to areal coverage of each reef type. In (B), adjusted values for Natural + Harvested reefs represent modified output based on ground-truthed observations of existing natural reef (see section Results, Ground Truthing and Reef Mapping). Larval output per square meter is reported in millions of larvae and total larval output is reported in trillions of larvae.
Discussion
We compared oyster population demographics among three types of oyster management strategies: (1) natural + harvested, (2) restored + harvested, and (3) restored + protected. We found that restored + harvested cultch planted reefs yielded higher per unit area demographics (e.g., density and reproductive output) than natural + harvested oyster reefs, even though both reef types were exposed to harvest. The restored + protected oyster reefs yielded the highest per unit area density and reproductive output. Moreover, despite the smallest areal coverage of the three reef types, the restored + protected oyster reefs had the greatest relative reproductive output. These results suggest that the potential for larval spillover from reserves to harvested reefs may exceed the potential for larval spill-in to reserves from harvested reefs.
Marine reserves can potentially subsidize harvested populations via larval spillover in certain ecosystems (Roberts et al., 2001; Goni et al., 2008; Kellner et al., 2008), but not others (Buxton et al., 2014). In the case of oyster reefs in Pamlico Sound, however, the relatively degraded conditions of natural reefs (e.g., low vertical relief, low shell volume per square meter) may not provide much in the way of suitable settlement substrate to realize the benefits of larval spillover from reserves. The relatively degraded state of natural reefs in PS is likely to persist over time since these reefs are exposed to destructive forms of harvest through tonging and dredging. Moreover, the low vertical relief of harvested reefs predisposes them to burial by sediment and exposure to hypoxia or anoxia (Lenihan and Peterson, 1998; Lenihan, 1999). Restoration of oyster reefs, even a thin veneer of low-relief cultch-planting, may provide improved settlement substrate and partially mitigate burial by sediment as evidenced by increased recruitment in cultch-planted reefs when compared to natural oyster reefs.
Population Density and Recruitment
In many cases, population densities recorded in the present study are comparable with those measured in related studies. For instance, natural oyster reefs in PS (mean ≈ 27 oyster m−2) support similar densities to reefs in Galveston Bay, TX, where live oyster abundance ranged from 0 to 52 oysters m−2 (Soniat and Brody, 1998). On cultch-planted reefs in Indian River Bay, Delaware, mean oyster density was 245 oysters m−2 (Erbland and Ozbay, 2008), similar to oyster density on cultch-planted reefs in PS (mean ≈ 259 oysters m−2). In Chesapeake Bay, oyster densities at harvested reefs range from 300 to 500 oysters m−2 (Mann et al., 2009), which compares favorably with densities found at cultch-planted reefs in this study, but not densities at natural reefs. Restoration strategies that combine high-relief artificial reefs and protection from harvest can have a profound positive impact on oyster densities. For example, oyster density in PS no-take reserves averaged 1,936 oysters m−2 (Puckett and Eggleston, 2012), which is 1–2 orders of magnitude higher than harvested reefs in PS and Chesapeake Bay.
Most cultch-planting reefs sampled in this study were similar in age (post-construction) to reserves sampled in 2006–2008, which lends credence to the notion that oyster demographics can be reliably compared between restored, cultch-planted reefs and restored, protected reefs for this time period. Nevertheless, No-take reserves in PS contained high-relief (~1–2 m) artificial reefs for natural oyster settlement, whereas cultch-planted, harvested reefs had relatively low relief (<0.5 m, J. Peters, pers. obs.). By reducing the impacts of fishing, which can be significant when harvesting reef-building organisms, reserves may provide greater habitat complexity than harvested areas, thereby supporting more individuals per unit area (e.g., Duran and Castilla, 1989). It is difficult to disentangle the benefits of improved habitat due to restoration of high-relief reefs vs. protection from harvest within reserves. The benefits of both are well-documented (Lenihan, 1999; Schulte et al., 2009). For instance, Schulte et al. (2009) examined a no-harvest reef network composed of both low- and high-relief reefs in Chesapeake Bay and noted an increase in oyster density from 200 m−2 on low-relief reefs, to >1,000 m−2 on high-relief reefs. In a meta-analysis of 124 studies, for example, Lester et al. (2009) reported that density, biomass, and size of target species was significantly greater within reserves vs. outside of reserves.
Oyster recruit density is an important metric in determining the success and persistence of an oyster reef (Powers et al., 2009). Oyster recruitment on restored, cultch-planted and natural harvested reefs was highly variable in both space and time. Across harvested reefs, recruit density ranged from 0 to 3,856 oysters m−2, with an average and standard deviation of 44.58 ± 208.49 oysters m−2. This is much more extreme than recruitment variability observed in Chesapeake Bay (~45–175 m−2; Mann et al., 2009; Southworth et al., 2010). Conversely, in this study recruitment was generally higher on restored, cultch-planted reefs than natural reefs potentially due to slightly higher relief and settlement substrate available to potential settlers during restoration.
The only apparent regional difference in population density was observed among sublegal oysters, which was significantly higher in the lower salinity western portion of PS. Recruit and legal sized oyster densities did not vary from east to west. We speculate that differences in the density of sublegal sized oysters among regions may be the result of increased mortality due to increased predation of recruit and sublegal sized oysters in eastern PS where salinity is highest (Wells, 1961; Shumway, 1996; Villalba et al., 2004). Differences in sublegal sized oyster density from west to east were not manifest in legal size classes, which may be due to a combination of oysters reaching a size refuge from predation at legal sizes and increased fishing mortality in western portion of PS. Oyster harvesters may focus on areas in western PS vs. Eastern Pamlico Sound to produce a higher quality product (e.g., less fouling, single oysters vs. clustered, rounded shape), therefore fishing mortality may be higher in western PS.
Potential Larval Output from Harvested Reefs vs. Reserves
No-take reserves likely exchange larvae with harvested populations within an overall metapopulation, yet there is little information on the potential contribution of no-take vs. harvested populations to a metapopulation's larval pool (Botsford et al., 2009). In this study, no-take oyster reserves have ~4 to 700 times greater potential larval output m−2 than cultch and natural oyster reefs, respectively. After accounting for total sound-wide areal coverage of each reef type, total potential larval output from reserves was ~6 times greater than that from natural reefs due to the ~two orders of magnitude greater areal cover of natural reefs, and also ~6 times greater larval output than cultch reefs. The potential for reserves to produce greater larval output per unit area has also been well-documented for other species such as queen conch (Strombus gigas) and copper rockfish (Sebastes caurinus), where reserve outputs were 1–2 orders of magnitude higher than nearby harvested populations (Palsson and Pacunski, 1995; Stoner and Ray, 1996). We accounted for variable fertilization success by egg and sperm when estimating potential larval output at a given time and site, however, estimates of potential larval output per square meter could be further refined by considering other factors that can modify the production of larvae, such as the health of a given oyster (Levitan et al., 1992; Ringwood et al., 2004). For instance, oyster health may vary on small spatial scales as a function of water quality, thereby impacting reproductive potential by reducing offspring viability (Ringwood et al., 2004). Reef age may also be an important consideration for estimating larval output based on population density. For example, overall trends in the density of oysters in reserves in PS suggest that densities peak at 3–4 years post-restoration, and then decline over a period of 5–15 years post-restoration due to factors such as sedimentation, increased fouling of the oyster substrate, recruitment failure, and post-settlement mortality (Puckett et al., in review). Nevertheless, 15 years after restoration in Pamlico Sound, oyster reefs still harbor very high average densities ranging from 200 to 800 oysters/m2 (Puckett et al., in review). Reduced population density would likely reduce per-square meter larval output and subsequently total output estimates of larval output from reserves. Still, the six-fold higher larval output from reserves than both natural and cultch oyster reefs suggests that reserves have the potential to provide a net larval “spillover” to harvested oyster populations in PS. If subsidizing harvested reefs is a management priority for the reefs within reserves, siting reserves in the proper locations is critical because “where” larvae are spawned can have a much larger effect on larval dispersal, connectivity, and realized spillover than “how many” larvae are spawned (Puckett et al., 2014).
Marine protected areas (MPAs) and restoration, particularly when used in concert, offer clear demographic benefits to target oyster populations. The findings of this study suggest that restoring high-relief oyster reefs and protecting these reefs from harvest should be an important management goal, as these reefs have strong potential to harbor elevated densities of oyster broodstock when compared to harvested reefs (whether restored or not). Subsequently, within a relatively small amount of areal footprint, these reefs can contribute substantially to the larval supply of a metapopulation. However, enforcement of no-take rules and construction of high-relief reefs can come at a substantial cost (e.g., ~US$10,000 per ha per cm3 of reef in Chesapeake Bay; Theuerkauf et al., 2015). In cases where expensive restoration practices and protection from harvest are not possible or desired, relatively inexpensive, low-relief restoration of open-harvest areas can offer many demographic benefits over non-restored areas, though to a lesser degree than restoration and protection. Therefore, a greater footprint area of restored, yet harvested reefs may have a similar restorative impact on the metapopulation compared relatively small, yet no-harvest reserves. While the benefits of restoration and protection are clear, the historic footprint of high-relief oyster reefs prior to large-scale commercial harvest (i.e., de-facto MPA's) was more than double that of all extant reef types today (Winslow, 1886), suggesting that restoration and protection alone are insufficient in scale to reverse extensive historical declines in oyster populations.
Ethics Statement
This research was conducted with approval by the NC Division of Marine Fisheries, Scientific, Educational and Activity Permit Numbers 1012889 and 708396.
Author Contributions
All authors listed have made a substantial, direct and intellectual contribution to the work, and approved it for publication.
Funding
Funding for the project was provided by: NC Sea Grant (RMRD56/12-HCE-2), NSF (OCE-281155628), and the NC Fisheries Resource Grant Program (11EP06). Funding for completion of the manuscript was provided by: North Carolina Sea Grant (R12-HCE-2) and the National Science Foundation (OCE-1155609) to DE, as well as a National Defense Science and Engineering Graduate Fellowship (contract FA9550-11-C-0028 awarded by the Department of Defense, Air Force Office of Scientific Research, 32 CFR 168a), North Carolina Coastal Conservation Association Scholarship, and Beneath the Sea Foundation Scholarship to ST.
Conflict of Interest Statement
The authors declare that the research was conducted in the absence of any commercial or financial relationships that could be construed as a potential conflict of interest.
Acknowledgments
We thank J. Fodrie, G. Bell, and the two reviewers for comments on previous drafts of this manuscript. We thank the following for field assistance: A. Lillis, R. Dunn, L. Neal, H. Eggleston, B. Gericke, J. Byrum, D. McVeigh, and A. Perk. We thank L. Lee and K. Theuerkauf for assistance with statistical analyses and interpretation.
References
Baskett, M. L., Micheli, F., and Levin, S. A. (2007). Designing marine reserves for interacting species. Biol. Consv. 137, 163–179. doi: 10.1016/j.biocon.2007.02.013
Beck, M. W., Brumbaugh, R. D., Airoldi, L., Carranza, A., Coen, L. D., Crawford, C., et al. (2011). Oyster reefs at risk and recommendations for conservation, restoration, and management. BioScience 61, 107–116. doi: 10.1525/bio.2011.61.2.5
Beck, M. W., Heck, K. L. Jr., Able, K., Childers, D., Eggleston, D., Gillanders, B., et al. (2001). Towards better identification, conservation and management of estuarine and marine nurseries. BioScience 51, 633–641. doi: 10.1641/0006-3568(2001)051[0633:TICAMO]2.0.CO;2
Beck, M. W., Heck, K. L. Jr., Able, K., Childers, D., Eggleston, D., Gillanders, B., et al. (2003). The role of nearshore ecosystems as fish and shellfish nurseries. Issues Ecol. 11, 1–12.
Botsford, L. W., Hastings, A., and Gaines, S. (2001). Dependence of sustainability on the configuration of marine reserves and larval dispersal distance. Ecol. Lett. 4, 144–150. doi: 10.1046/j.1461-0248.2001.00208.x
Botsford, L. W., White, J. W., Coffroth, M. A., Paris, C. B., Planes, S., Shearer, T. L., et al. (2009). Connectivity and resilience of coral reef metapopulations in marine protected areas: matching empirical efforts to predictive needs. Coral Reefs 28, 327–337. doi: 10.1007/s00338-009-0466-z
Buxton, C. D., Hartman, K., Kearney, R., and Gardner, C. (2014). When is spillover from marine reserves likely to benefit fisheries? PLoS ONE 9:e107032. doi: 10.1371/journal.pone.0107032
Christie, M. R., Tissot, B. N., Albins, M. A., Beets, J. P., Jia, Y., Ortiz, D. M., et al. (2010). Larval connectivity in an effective network of marine protected areas. PLoS ONE 5:e15715. doi: 10.1371/journal.pone.0015715
Coen, L. D., Brumbaugh, R. D., Bushek, D., Grizzle, R., Luckenbach, M. W., Posey, M. H., et al. (2007). Ecosystem services related to oyster restoration. Mar. Ecol. Prog. Ser. 341, 303–307. doi: 10.3354/meps341303
Coen, L. D., and Luckenbach, M. W. (2000). Developing success criteria and goals for evaluating oyster reef restoration: ecological function or resource exploitation? Ecol. Eng. 15, 323–343. doi: 10.1016/S0925-8574(00)00084-7
Dahlgren, C. P., Kellison, G. T., Adams, A. J., Gillanders, B. M., Kendall, M. S., Layman, C. A., et al. (2006). Marine nurseries and effective juvenile habitats: concepts and applications. Mar. Ecol. Prog. Ser. 312, 291–295. doi: 10.3354/meps312291
Dufour, V., Jouvenel, J. Y., and Galzin, R. (1995). Study of a Mediterranean reef fish assemblage. Comparisons of population distributions between depths in protected and unprotected areas over one decade. Aquat. Liv. Res. 8, 17–25. doi: 10.1051/alr:1995002
Dunn, R. P., Eggleston, D. B., and Lindquist, N. (2014). Oyster-sponge interactions and bioerosion of reef-building substrate materials: implications for oyster restoration. J. Shellfish. Res. 33, 1–12. doi: 10.2983/035.033.0307
Duran, L. R., and Castilla, J. C. (1989). Variation and persistence of the middle rocky intertidal community of central Chile, with and without human harvesting. Mar. Biol. 103, 555–562. doi: 10.1007/BF00399588
Durham, C. L. (2009). Spatial Dynamics in an Estuarine System: Modeling Biophysical Components and Interactions to Advance Blue Crab Fishery Management. MS Thesis, North Carolina State University, Raleigh, NC.
Eggleston, D. B., Bell, G. W., and Searcy, S. P. (2009). Do Blue Crab Spawning Sanctuaries in North Carolina Protect the Spawning Stock? Trans. Amer. Fish. Soc. 138, 581–592. doi: 10.1577/T08-070.1
Epperly, S. P., and Ross, S. W. (1986). Characterization of the North Carolina Pamlico-Albemarle Estuarine Complex. Report No. NMFS-SEFC-175, National Oceanic and Atmospheric Administration, Beaufort, NC.
Erbland, P. J., and Ozbay, G. (2008). A comparison of the macrofaunal communities inhabiting a Crassostrea virginica oyster reef and oyster aquaculture gear in Indian River Bay, Delaware. J. Shellfish. Res. 27, 757–768. doi: 10.2983/0730-8000(2008)27[757:ACOTMC]2.0.CO;2
Geraldi, N. R., Simpson, M., Fegley, S. R., Holmlund, P., and Peterson, C. H. (2013). Addition of juvenile oysters fails to enhance oyster reef development in Pamlico Sound. Mar. Ecol. Prog. Ser. 480, 119–129. doi: 10.3354/meps10188
Goni, R., Adlerstein, S., Alvarez-Berastegui, D., Forcada, A., Renones, O., Criquet, G., et al. (2008). Spillover from six western Mediterranean marine protected areas: evidence from artisanal fisheries. Mar. Ecol. Prog. Ser. 366, 159–174. doi: 10.3354/meps07532
Gross, F., and Smyth, J. C. (1946). The decline of oyster populations. Nature 147, 540–542. doi: 10.1038/157540a0
Haase, A. T., Eggleston, D. B., Luettich, R. A., Weaver, R. J., and Puckett, B. J. (2012). Estuarine circulation and predicted oyster larval dispersal among a network of reserves. Est. Coast. Shelf Sci. 101, 33–43. doi: 10.1016/j.ecss.2012.02.011
Halpern, B. S. (2003). The impact of reserves: do reserves work and does reserve size matter? Ecol. Appl. 13, S117–S137. doi: 10.1890/1051-0761(2003)013[0117:TIOMRD]2.0.CO;2
Harrison, H. B., Williamson, D. H., Evans, R. D., Almany, G. R., Thorrold, S. R., Russ, G. R., et al. (2012). Larval export from marine reserves and the recruitment benefit for fish and fisheries. Curr. Biol. 22, 1023–1028. doi: 10.1016/j.cub.2012.04.008
Kellner, J. B., Nisbet, R. M., and Gaines, S. D. (2008). Spillover from marine reserves related to mechanisms of population regulation. Theor. Ecol. 1, 117–127. doi: 10.1007/s12080-008-0012-6
Kellner, J. B., Tetreault, I., Gaines, S. D., and Nisbet, R. M. (2007). Fishing the line near marine reserves in single and multispecies fisheries. Ecol. Appl. 17:1039–1054. doi: 10.1890/05-1845
Kirby, M. X. (2004). Fishing down the coast: historical expansion and collapse of oyster fisheries along continental margins. Proc. Nat. Acad. Sci. U.S.A. 101, 13096–13099. doi: 10.1073/pnas.0405150101
Lenihan, H. S. (1999). Physical-biological coupling on oyster reefs: how habitat form influences individual performance. Ecol. Monogr. 69, 251–275.
Lenihan, H. S., and Peterson, C. H. (1998). How habitat degradation through fishery disturbance enhances effects of hypoxia on oyster reefs. Ecol. Appl. 8, 128–140. doi: 10.1890/1051-0761(1998)008[0128:HHDTFD]2.0.CO;2
Lester, S. E., Halpern, B. S., Grorud-Colvert, K., Lubchenco, J., Ruttenberg, B. I., Gaines, S. D., et al. (2009). Biological effects within no-take marine reserves: a global synthesis. Mar. Ecol. Prog. Ser. 384, 33–46. doi: 10.3354/meps08029
Levitan, D. R., Sewell, M. A., and Chia, F. S. (1992). How distribution and abundance influence fertilization success in the sea urchin Strongylocentotus franciscanus. Ecology 73, 248–254. doi: 10.2307/1938736
Lin, J., Xie, L., Pietrafesa, L. J., Ramus, J. S., and Paerl, H. W. (2007). Water quality gradients across Albemarle-Pamlico estuarine system: seasonal variations and model applications. J. Coast. Res. 23, 213–229. doi: 10.2112/05-0507.1
Lubchenco, J., Palumbi, S. R., Gaines, S. D., and Andelman, S. (2003). Plugging a hole in the ocean: the emerging science of marine reserves. Ecol. Appl. 13, S3–S7. doi: 10.1890/1051-0761(2003)013[0003:PAHITO]2.0.CO;2
Ludford, A., Cole, V. J., Porri, F., McQuaid, C. D., Nakin, M. D., and Erlandsson, J. (2012). Testing source-sink theory: the spill-over of mussel recruits beyond marine protected areas. Landsc. Ecol. 27, 859–868. doi: 10.1007/s10980-012-9739-y
Luettich, R. A., Carr, S. D., Reynolds-Fleming, J. V., Fulcher, C. W., and McNinch, J. E. (2002). Semi-diurnal seiching in a shallow, micro-tidal lagoonal estuary. Cont. Shelf Res. 22, 1669–1681. doi: 10.1016/S0278-4343(02)00031-6
Mackenzie, C. L. (2007). Causes underlying the historical decline in eastern oyster (Crassostrea virginica Gmelin, 1791) landings. J. Shellfish. Res. 26, 927–938. doi: 10.2983/0730-8000(2007)26[927:CUTHDI]2.0.CO;2
Mann, R., Southworth, M., Harding, J. M., and Wesson, J. A. (2009). Population studies of the native eastern oyster, Crassostrea virginica, (Gmelin, 1791) in the James River, Virginia, USA. J. Shellfish. Res. 28, 193–220. doi: 10.2983/035.028.0203
Mroch, R. M., Eggleston, D. B., and Puckett, B. J. (2012). Spatiotemporal variation in oyster fecundity and reproductive output in a network of no-take reserves. J. Shellfish. Res. 31, 1091–1101. doi: 10.2983/035.031.0420
NCDMF (2016). North Carolina License and Statistics Section Summary Statistics of License and Permit Program, Commercial trip Ticket Program, NC Recreational Information Program, Striped Bass Creel Survey in the Central and Southern Management Area, NC Recreational Saltwater Activity Mail Survey, Fisheries Economics Program. North Carolina Department of Environmental Quality, Division of Marine Fisheries. Morehead City, NC.
North Carolina Department of Environmental, Quality, Division of Marine Fisheries (2013). Estuarine Benthic Habitat Mapping Program. Shapefile Dataset. Available online at: http://portal.ncdenr.org/web/mf/shellfish-habitat-mapping
Palsson, W. A., and Pacunski, R. E. (1995). The response of rocky reef fishes to harvest refugia in Puget Sound. Proceedings 1, 224–234.
Peres-Neto, P. R., and Olden, J. D. (2001). Assessing the robustness of randomization tests: examples from behavioural studies. Anim. Behav. 61, 79–86. doi: 10.1006/anbe.2000.1576
Pierson, K. J., and Eggleston, D. B. (2014). Response of estuarine fish to large-scale oyster reef restoration. Trans. Amer. Fish. Soc. 143, 273–288. doi: 10.1080/00028487.2013.847863
Pietrafesa, L. J., Janowitz, G. S., Chao, T.-Y., Weisberg, R. H., Askari, F., and Noble, E. (1986). The Physical Oceanography of Pamlico Sound. Report No. UNC-WP-86-5, NC Sea Grant, Raleigh, NC.
Powers, S. P., Peterson, C. H., Grabowski, J. H., and Lenihan, H. S. (2009). Success of constructed oyster reefs in no harvest sanctuaries: implications for restoration. Mar. Ecol. Prog. Ser. 389, 159–170. doi: 10.3354/meps08164
Puckett, B. J., and Eggleston, D. B. (2012). Oyster dynamics in a network of no-take reserves: recruitment, growth, survival, and density dependence. Mar. Coast. Fish.: Dyn. Manag. Ecosyst. Sci. 4, 605–627. doi: 10.1080/19425120.2012.713892
Puckett, B. J., and Eggleston, D. B. (2016). Metapopulation dynamics guide marine reserve design: importance of connectivity, demographics, and stock enhancement. Ecosphere 7:e01322. doi: 10.1002/ecs2.1322
Puckett, B. J., Eggleston, D. B., Kerr, P. C., and Luettich, R. (2014). Larval dispersal and population connectivity among a network of marine reserves. Fish. Oceanogr. 23, 342–361. doi: 10.1111/fog.12067
R Core Team (2017). R: A Language and Environment for Statistical Computing. Vienna: R Foundation for Statistical Computing. Available online at: https://www.R-project.org/
Ringwood, A. H., Hoguet, J., Keppler, C., and Gielazyn, M. (2004). Linkages between cellular biomarker responses and reproductive success in oysters. Mar. Environ. Res. 58, 152–155. doi: 10.1016/j.marenvres.2004.03.010
Roberts, C. M., Bohnsack, J. A., Gell, F., Hawkins, J. P., and Goodridge, R. (2001). Effects of marine reserves on adjacent fisheries. Science 294, 1920–1923. doi: 10.1126/science.294.5548.1920
Rothschild, B. J., Ault, J. S., Goulletquer, P., and Heral, M. (1994). Decline of the Chesapeake Bay oyster population: a century of habitat destruction and overfishing. Mar. Ecol. Prog. Ser. 111, 29–39. doi: 10.3354/meps111029
Schulte, D. M., Burke, R. P., and Lipcius, R. N. (2009). Unprecedented restoration of a native oyster metapopulation. Science 325, 1124–1128. doi: 10.1126/science.1176516
Shumway, S. E. (1996). “Natural environmental factors,” in The Eastern Oyster Crassostrea virginica, eds V. S. Kennedy, R. I. E. Newell, and A. F. Eble (College Park, MD: Maryland Sea Grant College), 467–503.
Sobel, J. A., and Dahlgren, C. P. (2004). Marine Reserves: Guide to Science, Design and Use. Washington, DC: Island Press.
Soniat, T. M., and Brody, M. S. (1998). Field validation of a habitat suitability index model for the American oyster. Estuaries 11, 87–95. doi: 10.2307/1351995
Southworth, M., Harding, J. M., Wesson, J. A., and Mann, R. (2010). Oyster (Crassostrea virginica, Gmelin 1791) population dynamics on public reefs in the Great Wicomico River, Virginia, USA. J. Shellfish. Res. 29, 271–290. doi: 10.2983/035.029.0202
Stoner, A. W., and Ray, M. (1996). Queen conch, Strombus gigas, in harvested and unharvestedlocations of the Bahamas: effects of a marine fishery reserve on adults, juveniles, and larval production. Fish. Bull. 94, 551–556.
Theuerkauf, S. J., Burke, R. P., and Lipcius, R. N. (2015). Settlement, growth, and survival of eastern oysters on alternative reef substrates. J. Shellfish. Res. 34, 241–250. doi: 10.2983/035.034.0205
Theuerkauf, S. J., Eggleston, D. B., Theuerkauf, K. W., and Puckett, B. J. (2017). Oyster density and demographic rates on natural intertidal reefs and hardened shoreline structures. J. Shellfish. Res. 36, 87–100. doi: 10.2983/035.036.0111
Tupper, M., and Rudd, M. A. (2002). Species-specific impacts of a small marine reserve on reef fish production and fishing productivity in the Turks & Caicos Islands. Environ. Conserv. 29, 2484–2492. doi: 10.1017/S0376892902000346
Valles, H., Sponaugle, S., and Oxenford, H. A. (2001). Larval supply to a marine reserve and adjacent fished area in the Soufriere Marine Management Area, St. Lucia, West Indies. J. Fish. Biol. 59, 152–177. doi: 10.1111/j.1095-8649.2001.tb01384.x
Villalba, A., Reece, K. S., Ordas, M. C., Casas, S. M., and Figueras, A. (2004). Perkinsosis in molluscs: a review. Aquat. Liv. Res. 17, 411–432. doi: 10.1051/alr:2004050
Wells, H. W. (1961). Fauna of oyster beds, with special reference to salinity factor. Ecol. Monogr. 31, 239–366. doi: 10.2307/1948554
Winslow, F. (1886). Report on the Waters of North Carolina, with Reference to their Possibilities for Oyster Culture; Together with the Results of the Surveys Directed by the Resolution of the General Assembly, Ratified March 11, 1885. Raleigh, NC: North Carolina State Printer and Binder. p. 151.
Keywords: marine protected areas, no-take reserves, oyster, reproductive potential, fisheries management
Citation: Peters JW, Eggleston DB, Puckett BJ and Theuerkauf SJ (2017) Oyster Demographics in Harvested Reefs vs. No-Take Reserves: Implications for Larval Spillover and Restoration Success. Front. Mar. Sci. 4:326. doi: 10.3389/fmars.2017.00326
Received: 14 June 2017; Accepted: 29 September 2017;
Published: 27 October 2017.
Edited by:
Trevor John Willis, University of Portsmouth, United KingdomReviewed by:
Hilmar Hinz, University of the Balearic Islands, SpainColin David Buxton, University of Tasmania, Australia
Copyright © 2017 Peters, Eggleston, Puckett and Theuerkauf. This is an open-access article distributed under the terms of the Creative Commons Attribution License (CC BY). The use, distribution or reproduction in other forums is permitted, provided the original author(s) or licensor are credited and that the original publication in this journal is cited, in accordance with accepted academic practice. No use, distribution or reproduction is permitted which does not comply with these terms.
*Correspondence: David B. Eggleston, ZWdnbGVzdG9uQG5jc3UuZWR1