 Kirsty C. Crocket1*
 Emily Hill1†
 Richard E. Abell1
 Clare Johnson1Stefan F. Gary1Tim Brand1
 Ed C. Hathorne2
- 1Scottish Association for Marine Science, Scottish Marine Institute, Oban, United Kingdom
- 2GEOMAR Helmholtz Centre for Ocean Research, Kiel, Germany
Seawater rare earth element (REE) concentrations are increasingly applied to reconstruct water mass histories by exploiting relative changes in the distinctive normalised patterns. However, the mechanisms by which water masses gain their patterns are yet to be fully explained. To examine this, we collected water samples along the Extended Ellett Line (EEL), an oceanographic transect between Iceland and Scotland, and measured dissolved REE by offline automated chromatography (SeaFAST) and ICP-MS. The proximity to two continental boundaries, the incipient spring bloom coincident with the timing of the cruise, and the importance of deep water circulation in this climatically sensitive gateway region make it an ideal location to investigate sources of REE to seawater and the effects of vertical cycling and lateral advection on their distribution. The deep waters have REE concentrations closest to typical North Atlantic seawater and are dominated by lateral advection. Comparison to published seawater REE concentrations of the same water masses in other locations provides a first measure of the temporal and spatial stability of the seawater REE signal. We demonstrate the REE pattern is replicated for Iceland-Scotland Overflow Water (ISOW) in the Iceland Basin from adjacent stations sampled 16 years previously. A recently published Labrador Sea Water (LSW) dissolved REE signal is reproduced in the Rockall Trough but shows greater light and mid REE alteration in the Iceland Basin, possibly due to the dominant effect of ISOW and/or continental inputs. An obvious concentration gradient from seafloor sediments to the overlying water column in the Rockall Trough, but not the Iceland Basin, highlights release of light and mid REE from resuspended sediments and pore waters, possibly a seasonal effect associated with the timing of the spring bloom in each basin. The EEL dissolved oxygen minimum at the permanent pycnocline corresponds to positive heavy REE enrichment, indicating maximum rates of organic matter remineralisation and associated REE release. We tentatively suggest a bacterial role to account for the observed heavy REE deviations. This study highlights the need for fully constrained REE sources and sinks, including the temporary nature of some sources, to achieve a balanced budget of seawater REE.
Introduction
The rare earth elements (REE) form a suite of 14 elements (i.e., the lanthanides) with chemical properties that vary systematically across the group. The interpretation of relative changes in REE concentrations makes them a powerful tool to investigate advection, cycling and inputs of trace metals in seawater. When normalised to the Post-Archaean Australian Shale (PAAS; Taylor and McLennan, 1985), the balance of supply/removal processes that fractionate seawater REE away from their lithogenic origins is highlighted (e.g., Elderfield and Greaves, 1982; Bertram and Elderfield, 1993). This fractionation is mainly attributed to the increasing strength of REE complexation to carbonate ions as mass number increases (Byrne and Kim, 1990), described by the lanthanide contraction effect (Zhang and Nozaki, 1996). While the heavy (H)REE are almost entirely bound by stable carbonate complexes, the light (L)REE are present with a greater proportion of free metal ions that makes them more susceptible to removal from solution through adsorption reactions (Cantrell and Byrne, 1987; Byrne and Kim, 1990; Sholkovitz et al., 1994). This results in the characteristic PAAS-normalised seawater REE pattern of HREE enrichment relative to LREE (e.g., Elderfield and Greaves, 1982; Bertram and Elderfield, 1993; Alibo and Nozaki, 1999). One exception to this is Ce, whose microbially mediated redox chemistry results in substantially lower relative concentrations to neighbouring REE (Moffett, 1990).
The relative changes in the distinctive pattern of dissolved seawater REE are increasingly applied to reconstruct water mass histories, e.g., provenance, continental inputs, intensity of biogeochemical cycling, and water mass isolation time (e.g., Zhang et al., 2008; Grenier et al., 2013, 2018; Garcia-Solsona et al., 2014; Haley et al., 2014; Molina-Kescher et al., 2014, 2018; Hathorne et al., 2015; Zheng et al., 2016; Grasse et al., 2017). Dominant processes controlling the distribution of open ocean REE are lateral advection by deep water masses (e.g., Hathorne et al., 2015; Zheng et al., 2016) and the effects of biogeochemical cycling (particle sorption/desorption, remineralisation) on vertical profiles of REE (e.g., Sholkovitz et al., 1994). Also important are the processes operating at the continent-ocean interface, that dictate sources and sinks of REE to seawater (e.g., Jeandel et al., 2011), and, gaining recognition, are the role of organics in altering the reactivity and therefore the fractionation of the REE (Schijf et al., 2015). Demonstrating and ultimately quantifying the impact of these mechanisms on seawater REE is essential for complete data interpretation. Resolving seawater REE behaviour will also contribute to constraining the marine Nd budget (i.e., the “Nd paradox”; Goldstein and Hemming, 2003), the isotope compositions of which are currently one of the most powerful chemical tracers of water masses in modern oceanography (e.g., Grenier et al., 2014; Lambelet et al., 2016) and palaeoceanographic reconstruction (e.g., Wilson et al., 2014).
Processes operating at continental margins and the seawater-sediment interface are amongst the least resolved. The emerging picture of REE cycling in the ocean is one of dominant removal (~70%) of riverine REE in estuaries (Goldstein and Jacobsen, 1988; Sholkovitz, 1993), ~20% (Nd) contribution from aeolian deposition (Tachikawa et al., 1999), negligible REE from hydrothermal venting (German et al., 1990), and variable contributions from sediments. This latter point includes diagenetic release of REE from pore waters (Abbott et al., 2015b; Haley et al., 2017), partial dissolution of particulates (Grenier et al., 2013; Pearce et al., 2013), and release from river-borne particulates in estuarine environments (Rousseau et al., 2015). These seawater-sediment interactions are described by “boundary exchange” and can result in release or scavenging of REE (Lacan and Jeandel, 2005b; Jeandel et al., 2007, 2011; Jeandel and Oelkers, 2015; Jeandel, 2016). This incomplete understanding of the marine REE budget is reflected most acutely by the input deficit in the marine Nd budget of ≤11,000 tons per year (Arsouze et al., 2009), and serves to highlight the importance of refining our knowledge of these seawater-sediment processes.
Organic complexation of seawater REE likely plays a role in the distribution of REE through their affinity for negatively charged sites on organic molecules (Byrne and Kim, 1990). However, it remains a relatively unconstrained quantity at present (e.g., Haley et al., 2014), with some identification of organic uptake associated with surface ocean productivity (Stichel et al., 2015; Grasse et al., 2017) but no complete explanation of the process. Work on organic complexation has identified strong HREE binding to bacterial phosphate functional groups (Ngwenya et al., 2010; Takahashi et al., 2010), and strong organic ligand complexation (Schijf et al., 2015). Uptake of REE by biogenic silica has also been proposed (Akagi, 2013). Where present in sufficient density, these functional groups may serve to further fractionate seawater REE and could represent one mechanism by which the nutrient-like vertical profiles of dissolved REE are attained (Schijf et al., 2015). As rather tenuous support of this, the often cited lack of a biological function for the REE is starting to be countered by evidence for an active role of the REE in bacterial processes (Lim and Franklin, 2004; Martinez-Gomez et al., 2016, and references therein).
Here we present the seawater REE concentrations collected on an annual oceanographic transect, the Extended Ellett Line (EEL), which runs between Scotland and Iceland (~60 °N, ~−20 °E) and occupies a climatically sensitive gateway region in the NE Atlantic. The EEL is ideally positioned to record the influx of North Atlantic upper waters into the Greenland-Iceland-Norwegian (GIN) Seas, the overflow of deep water masses exiting the GIN Seas across the Iceland-Scotland Ridge at depth, and their recirculation within the Rockall Trough and Iceland Basin. Samples collected at five open ocean stations provide full water column REE profiles, and contribute to the growing resolution of REE distributions in water masses in the NE Atlantic, previously sampled in the neighbouring Norwegian Sea (Lacan and Jeandel, 2004b), Irminger Basin (Lacan and Jeandel, 2004a), Iceland Basin (Lacan and Jeandel, 2005a), and Labrador Sea (Filippova et al., 2017). The comparison to data collected recently and ~16 years prior allows the first evaluation of the temporal and spatial stability of the dissolved REE signature as chemical water mass tracers. Samples were also collected from three coastal stations at the Icelandic and Scottish extremes of the EEL (Figure 1). The proximity of these two continental margins and the complex bathymetry crossed by the EEL make it an ideal location to investigate the impact of various REE sources on the seawater signatures of different water masses. In addition, the timing of the spring bloom, coincident with the EEL cruise, provides further insight into the effects of vertical biogeochemical cycling on REE distributions.
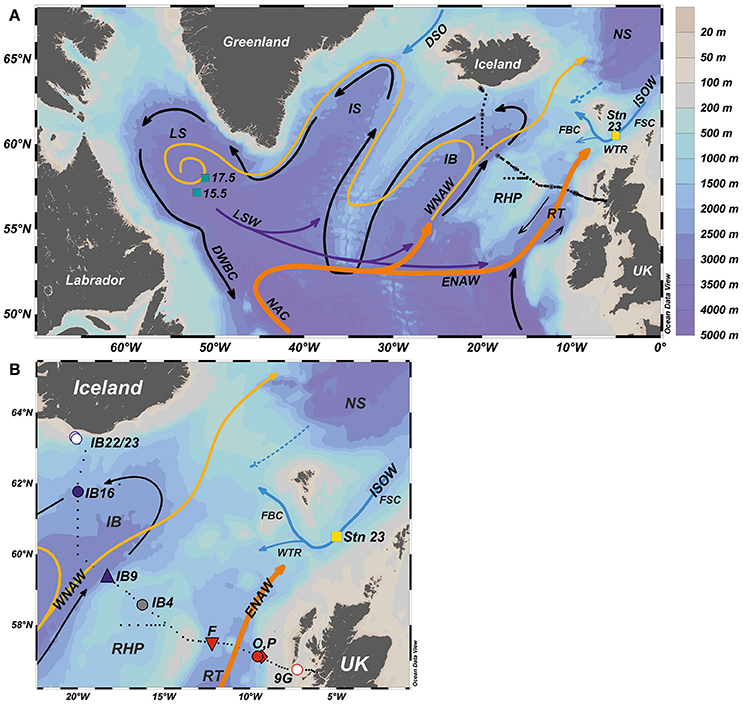
Figure 1. (A) Location map with the 2015 Extended Ellett Line (EEL) stations in black dots. Deep, ocean currents are indicated by black arrows (below the pycnocline). The cold overflow currents are shown by blue arrows. Dotted lines represent intermittent currents. Orange and yellow lines reflect the warm surface waters. The locations of the Faroe-Shetland Channel (FSC), Faroe Bank Channel (FBC) and Wyville Thomson Ridge (WTR) are shown. For reference in the discussion, also shown are the locations of Station 23 in the FSC (yellow square; Lacan and Jeandel, 2004b) and Stations 15.5 and 17.5 in the Labrador Sea (green squares; Filippova et al., 2017). (B) Detailed view of the 2015 EEL stations, with those sampled in this study highlighted by large labelled symbols (blue, red, grey). Water masses: DWBC, Deep Western Boundary Current; LSW, Labrador Sea Water; ISOW, Iceland-Scotland Overflow Water; DSO, Denmark Strait Overflow; NA, North Atlantic Current; WNAW, Western North Atlantic Water; ENAW, Eastern North Atlantic Water. Ocean basins: LS, Labrador Sea; IB, Iceland Basin; IS, Irminger Sea; RHP, Rockall-Hatton Plateau; RT, Rockall Trough; NS, Norwegian Sea. The figure was created using ODV software, available at https://odv.awi.de/ (Schlitzer, 2016). (For interpretation of the references to colour in this and other figures herein, the reader is referred to the electronic version of this article).
Materials and Methods
Hydrography
The EEL spans the Rockall Trough, the Rockall-Hatton Plateau and the Iceland Basin (Figure 1). The collection of oceanographic data on at least an annual basis since 1975 in the Rockall Trough and extended to the Iceland Basin from 1996 onwards makes the EEL an exceptional resource (Holliday and Cunningham, 2013), with many publications detailing the circulation of water masses and their hydrographic and chemical properties. The overall circulation along the EEL is one of warm and salty Atlantic upper waters flowing in a north-easterly direction into the Nordic Seas, underlain by a permanent thermocline that separates the surface from the generally cyclonic circulation of dense, cold waters at depth (Holliday et al., 2015; Figures 2, 3). Here, we summarise the salient points.
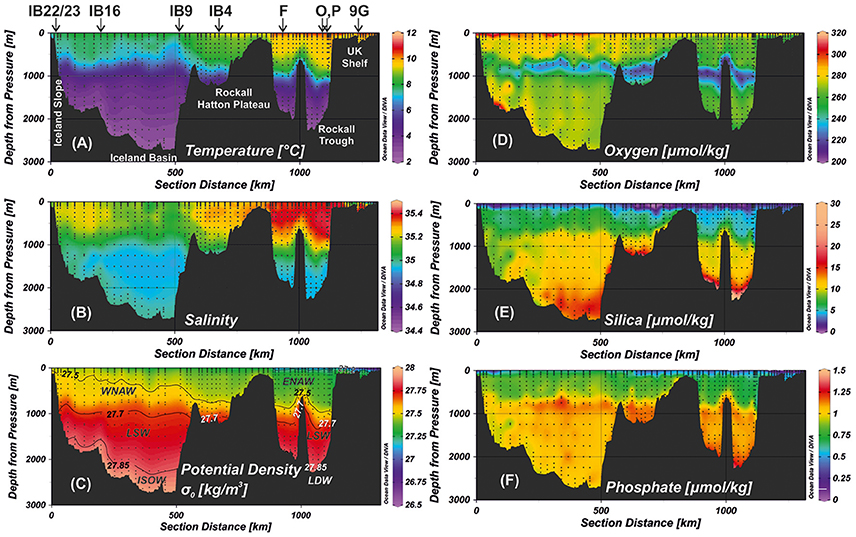
Figure 2. Sections of: (A) temperature (°C), (B) salinity, (C) potential density σθ (kg/m3), (D) dissolved oxygen (μmol/kg), (E) silica (μmol/kg), (F) phosphate (μmol/kg). The potential density section has contours delineating the ranges identified by Holliday et al. (2015) as representative of different water masses, with acronyms identifying the dominant water mass (see Figure 1 caption for acronyms). The data are from 920 bottle samples (black dots) collected from 85 stations over ~1,300 km of cruise track during the 2015 EEL campaign. The figure was created using ODV software, available at https://odv.awi.de/ (Schlitzer, 2016).
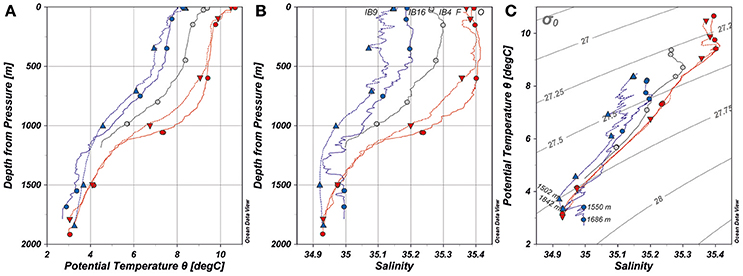
Figure 3. (A) Depth (m) vs. potential temperature (°C), (B) depth (m) vs. salinity, (C) potential temperature (°C) vs. salinity with the isopycnals defined by the grey lines, for the open ocean stations in this study during the 2015 EEL. The bottle data are indicated by symbols that correspond to those on the location map (Figure 1), superimposed on the CTD data. Small discrepancies between CTD and bottle data arise due to CTD data collection on the downcast and bottle data collection on the up-cast. The depths of the deepest samples at IB16 are indicated in (C) with reference to section Circulation Effects on REE Distribution. The figure was created using ODV software, available at https://odv.awi.de/ (Schlitzer, 2016).
The upper waters are dominated by the North Atlantic Current (NAC) that draws in subtropical Eastern North Atlantic Water (ENAW) and subpolar Western North Atlantic Water (WNAW). Upper waters in the Rockall Trough are warmer and saltier (>9.5°C, >35.4 salinity) compared to the Iceland Basin (>7.0°C, >35.10 salinity; Figure 3; Holliday et al., 2000; Johnson et al., 2013). These upper ocean waters have potential densities of 27.20–27.50 kg/m3, and are overlain by a shallow layer of seasonally affected surface waters (<27.20 kg/m3; Holliday et al., 2015), although in 2015 water with these densities was observed as a thin veneer over the surface of the Rockall Trough (<35 m deep) and did not extend into the Iceland Basin (Figure 2). Typically WNAW has higher concentrations of silica (≥7.3 μmol/kg), phosphate (1.0–1.1 μmol/kg) and nitrate (14.6–15.6 μmol/kg), whereas the ranges in ENAW tend to be lower (silica: 2.4–5.8 μmol/kg, phosphate: 0.6–1.0 μmol/kg, nitrate 10.0–12.2 μmol/kg; Fogelqvist et al., 2003; McGrath et al., 2012; Johnson et al., 2013). The values recorded during EEL 2015 cruise for both upper water masses fall at the lower end or just below these ranges (Table 1), highlighting broader climate-induced changes in ocean circulation that influence nutrient concentrations (Johnson et al., 2013).
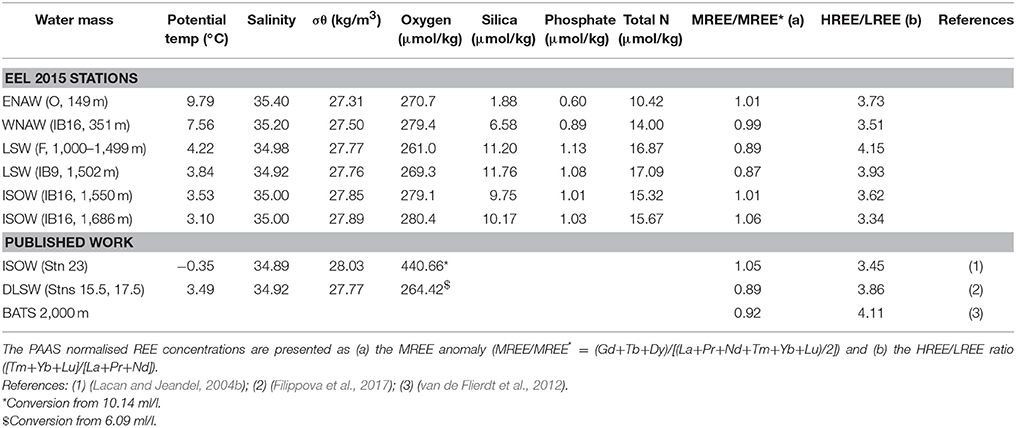
Table 1. Water mass properties of selected stations and depths along the EEL 2015 cruise, with comparison to end-member water masses in published work.
The permanent thermocline forms a coherent density layer (27.50–27.70 kg/m3) at ~900–1,400 dbar in the Rockall Trough, but becomes broader and less well defined in the Iceland Basin where it rises to ~400 dbar (Figure 2). The oxygen depletion zone (ODZ) and maximal nutrient concentrations are well defined in the Rockall Trough but more diffuse in the Iceland Basin. Minimum dissolved oxygen concentrations in the Rockall Trough during the 2015 EEL cruise were 209 μmol/kg, with concomitant peaks in nutrients in silica (9.8 μmol/kg), phosphate (1.17 μmol/kg) and total nitrogen (18.2 μmol/kg; Table 1).
Below the permanent pycnocline in both basins, circulation is dominated by Labrador Sea Water (LSW), present as a relatively homogenous body of water (3–4°C, 34.90–34.95 salinity, 27.70–27.85 kg/m3; Holliday et al., 2015). Long-term observations highlight the consistently fresher and colder properties of LSW in the Iceland Basin compared to its signature in the Rockall Trough (Holliday et al., 2015), reflecting greater mixing along its pathway to reach the northern Rockall Trough. Typical dissolved oxygen concentrations associated with LSW in the Rockall Trough are 260–270 μmol/kg, and relatively high concentrations of silica (10.7–14.7 μmol/kg), phosphate (1.0–1.2 μmol/kg) and nitrate (11.7–19 μmol/kg; Fogelqvist et al., 2003; McGrath et al., 2012; Johnson et al., 2013). During the 2015 EEL cruise, LSW identified in both the Rockall Trough and the Iceland Basin had dissolved oxygen and nutrient concentrations within these ranges (Table 1).
The deepest depths of the Iceland Basin are occupied by Iceland Scotland Overflow Water (ISOW; <3.0°C, >27.85 kg/m3) from the Nordic Seas that enters mostly via the Faroe Bank Channel and circulates along the western boundary of the Iceland Basin. Cyclonic recirculation results in a smaller flow of ISOW along the eastern side of the Basin (Kanzow and Zenk, 2014), likely mixed to varying extent with the overlying LSW (Holliday et al., 2015). ISOW is well ventilated (268–286 μmol/kg), with elevated concentrations of silica (9–12.6 μmol/kg) and nitrate (10–16 μmol/kg; Fogelqvist et al., 2003; McGrath et al., 2012). During the 2015 EEL cruise, ISOW had nutrient concentrations within range of typical values, although silica was low (9.8 μmol/kg) and total nitrogen was high (15.3 μmol/kg; Table 1). Table 1 also highlights comparison to published values of ISOW (Lacan and Jeandel, 2004b), collected in the Faroe Shetland Channel in 1999. Several differences to the properties of this ISOW (e.g., lower potential temperature and salinity, greater potential density and dissolved oxygen) can be ascribed to the effects of mixing and dilution as ISOW travels through the overflow channels and the shallower depths of the Iceland Basin, mixing with overlying NAC and LSW. This is discussed in more detail in section Circulation Effects on REE Distribution.
At the point the EEL crosses the Rockall Trough, water masses denser than LSW (>27.85 kg/m3) are not consistently observed. When present, Lower Deep Water (LDW; ~2.8°C, 34.95 salinity; Holliday et al., 2000) is a cold, dense water mass influenced by Antarctic Bottom Water (New and Smythe-Wright, 2001). In 2015, only the deep eastern side of the Rockall Trough carried water denser than LSW (not sampled in this study), which has typical characteristics of elevated silica (35.3 μmol/kg) and nitrate (20.4 μmol/kg; McGrath et al., 2013).
Methods
Samples were collected from nine stations during the EEL on the RRS Discovery between 29 May and 17 June 2015 (Figure 1). Of the open ocean stations, five have full profiles (6 depths sampled) and station P has two samples. Seawater was collected from Niskin bottles on a CTD rosette and immediately filtered through 0.4 μm polycarbonate Cyclopore filter membranes into LDPE bottles, followed by acidification, double bagging and refrigeration until analysis in the home laboratory. All equipment in contact with the sample seawater was rigorously acid cleaned prior to use (Buck and Paytan, 2012; Cutter et al., 2014). Station 9G and surface samples from Station O were not filtered.
The REE concentrations were determined on 20 ml seawater by ICP-MS (ThermoScientific Xseries 2) following off-line preconcentration and removal of the salt matrix using a SeaFAST system (ESI, USA), adapted from the on-line method of Hathorne et al. (2012). External standardisation was applied using a 6 point calibration, the solutions of which were processed through the SeaFAST in the same manner as the samples. Calibration standards, reference seawater aliquots, and samples were indium doped to monitor and correct for instrumental drift. Oxide formation and interferences on the HREE were minimised during tuning, and monitored by measurement of mass 156 (CeO). They were found to be <1% of the 140 Ce intensity for the majority of samples. The exceptions were two samples with a 156/140 ratio of ~3%. These have not been included in the dataset. Barium concentrations in the purified sample solutions were monitored for oxide interference on europium. 137Ba intensities were <20% of 153Eu, and would require >10% BaO formation to generate significant interferences on europium (i.e., >2%) and so are not considered to be significant. All data are presented in Table S1.
External reproducibility was determined by repeat measurement of the GEOTRACES intercalibration seawater from the Bermuda Atlantic Time Series (BATS 2,000 m) and NRC NASS-6 coastal water. Over the course of this study, values ranged from 6 to 16% (2RSD) for the BATS and 7–16% for the NASS-6 (Table 2). Comparison of the BATS 2,000 m concentrations to the consensus values (van de Flierdt et al., 2012) reveal deviations of <7%, with the exceptions of Ce and Sm (both 14%). We report the deviation to published values of NASS-6 (Wang et al., 2014) for information only as no certified values exist (Table 2). Duplicate samples (same Niskin vs. different Niskin/similar depth) have relative differences similar to the external reproducibility, and on a few occasions were larger. Total procedural blanks run through the preconcentration system were <1% of the average sample signal, with the exceptions of Ce and Sm that represented 17 and 10% respectively of the smallest sample signal.
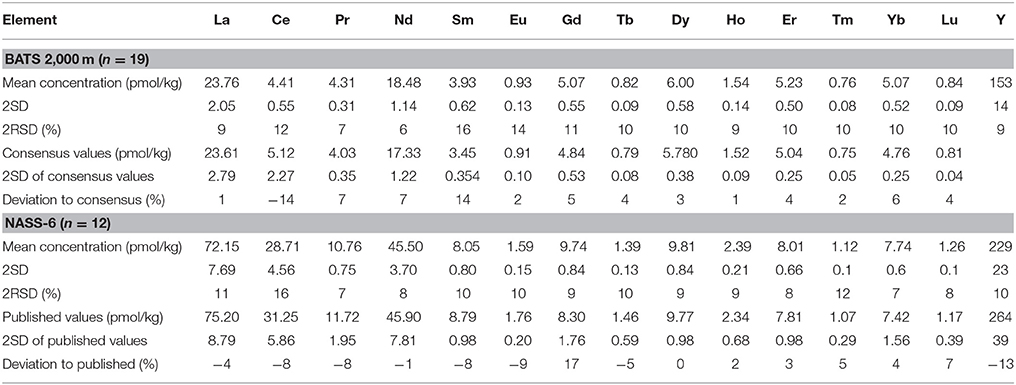
Table 2. Dissolved REE concentrations in reference samples measured during the course of this study: consensus values of the GEOTRACES intercalibration seawater from the Bermuda time series station (BATS) 2,000 m (van de Flierdt et al., 2012); published values of (Wang et al., 2014) for NASS-6 (National Research Council Canada) coastal seawater.
Results
The REE concentrations show relatively small increases with depth (Figure 4, Table S1) that are atypical of open ocean profiles (e.g., De Baar et al., 1985; Alibo and Nozaki, 1999; Hathorne et al., 2015). The absence of pronounced increases with depth most likely reflects the circulation of relatively young water masses, ISOW in the Iceland Basin, and LSW in both basins, and therefore the time limited accumulation of remineralised loads of dissolved REE. In addition, the relatively short water column depth (~2,000 m) of the sampled stations reduces the remineralisation time of particulates and therefore the release of REE into solution. At the stations in the Rockall Trough (F, O, P), excluding the deepest samples, a relatively small spread in REE concentrations is observed (e.g., 16.2–21.8 pmol/kg Nd). The Iceland Basin stations (IB16, IB9) have a greater spread in REE concentrations with higher concentrations below ~1,500 m (≤25.1 pmol/kg Nd) than in the surface waters. Station IB4 on the Rockall-Hatton Plateau has the reverse trend, with slightly lower concentrations at depth (~16 pmol/kg Nd) compared to the surface (~18 pmol/kg Nd). The variation in REE concentrations at each station is associated with clear changes in temperature, salinity, potential density, dissolved oxygen and nutrient concentrations (Table S2; see Discussion—Lateral advection).
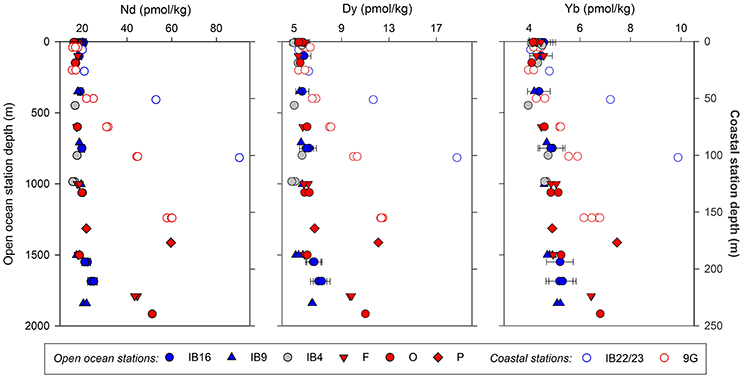
Figure 4. Concentration-depth profiles of selected REE to span the light (Nd), middle (Dy) and heavy (Yb) range. All concentrations are in pmol/kg. Error bars represent 2σ uncertainty from repeat measurement of the BATS 2000 m reference seawater during the study (Table 2). To note, surface waters from O and all 9G samples were not filtered.
The exceptions to this pattern are the samples in the deep Rockall Trough (F, O, P) with high REE concentrations (e.g., 43–60 pmol/kg Nd), where samples were collected close to the sediment surface (<40 m above seafloor), and the coastal stations (IB22/23, 9G) with exceptionally high REE concentrations (e.g., ≤90 pmol/kg). The coastal stations show a linear increase in REE concentration with depth that does not correspond to the variation in beam transmission intensity (Supplementary Figure 1). Furthermore, the deeper waters at 9G (unfiltered) have lower concentrations than comparable depths at IB22/23, which were filtered. Along this part of the UK shelf, open ocean North Atlantic water migrates onto the shelf at depth (Jones et al., 2018), supported by the high salinity (≥35.35), temperature (≥9.6°C) and density anomaly (≥27.27 kg/m3) at depths below ~75 m. The low REE concentrations in these open North Atlantic waters result in lower REE concentrations at depth at 9G compared to IB22/23. The productive shelf waters at 9G, collected in May/June, mean a component of planktonic organisms is likely included in the sample. This is reflected by the trend towards average marine biogenic carbonate REE in Figure 9C (see discussion in section Source of Elevated REE Concentrations in the Deep Rockall Trough Samples).
In contrast to the coastal stations, the REE increase at depth in the Rockall Trough appears abruptly in the deepest samples at each station and is associated with collection from water with a high particulate load as determined from the beam transmission data (Supplementary Figure 1). To note, IB4 has the strongest decrease in beam transmission but no sample was collected from within this layer. These samples with high REE concentrations are discussed in section Source of Elevated REE Concentrations in the Deep Rockall Trough Samples.
Normalisation to REE concentrations of Post-Archaean Australian Shale (PAAS) is used to demonstrate the extent of fractionation of seawater REE from REE in the typical continental source materials. Patterns of normalised seawater REE typically reveal HREE (e.g., Tm, Yb, Lu) enrichment and LREE (e.g., La, Pr, Nd) depletion, due to preferential LREE removal from solution onto particles relative to the greater stability of aqueous carbonate complexes of the HREE (Cantrell and Byrne, 1987; Byrne and Kim, 1990; Sholkovitz et al., 1994). We use the PAAS values in Taylor and McLennan (1985) to normalise the EEL data. This highlights: (i) reduced HREE enrichment in surface waters, (ii) enrichment of all REE in deeper water masses, and (iii) exceptional MREE (e.g., Gd, Tb, Dy) enrichment in sub-surface coastal waters (Figure 5). The lack of HREE enrichment in surface waters relative to thermocline waters is more pronounced in the Rockall Trough than the Iceland Basin, with the largest difference noted in the data of both the coastal stations (IB22/23, 9G). As noted above, all the REE show increases with depth (with the exception of IB4), although the greatest spread from surface to deep in LREE and MREE (excluding the large increases at depth at stations F, O, and P) is noted at station IB16. The coastal station data show the greatest increases in normalised REE profiles with depth (Figure 5). The Iceland Slope (IB22/23) data have a pronounced positive Eu anomaly in the deepest sample, reflecting the dominant mafic nature of Iceland's geology. Similar positive Eu anomalies were identified in seawater following sediment interaction experiments using Icelandic particulate material collected in rivers and estuaries (Pearce et al., 2013) and in seawater surrounding Tahiti (Molina-Kescher et al., 2018).
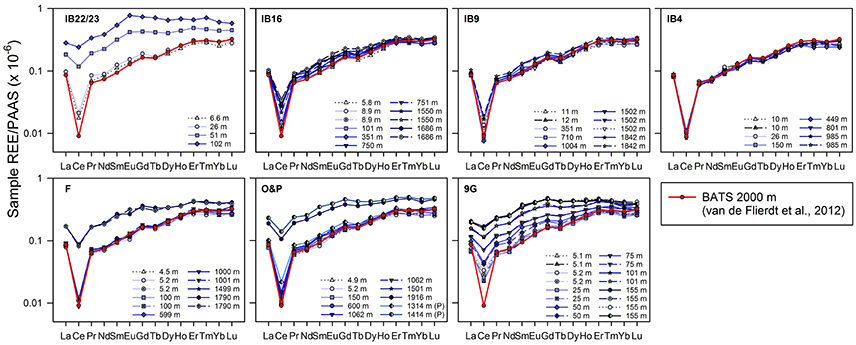
Figure 5. REE concentrations normalised to the Post-Archaean Australian Shale (PAAS) values of Taylor and McLennan (1985) as presented in Freslon et al. (2014). The BATS 2000 m pattern (van de Flierdt et al., 2012) is shown for comparison in each panel (bold red line). To note, surface waters from O and all 9G samples were not filtered.
Discussion
Circulation Effects on REE Distribution
Water masses along the EEL are to a certain extent related. However, the two most clearly differentiated by source region are LSW and ISOW, originating in the North Atlantic subpolar gyre and the Nordic Seas respectively. They are identified in the 2015 EEL data on the basis of their T/S, density anomalies and dissolved oxygen concentrations (Figure 2, Table S2). Here we evaluate the ability of the REE to fingerprint these water masses in the NE Atlantic and the stability of their REE signature over time and distance by comparing to (1) a proximal record of ISOW REE collected 16 years prior to this study (Lacan and Jeandel, 2004b), and (2) a distal record of deep Labrador Sea Water (DLSW) REE collected in 2013 at the site of formation in the Labrador Sea (Filippova et al., 2017).
The HREE are reported in the literature as better tracers of water masses than LREE (e.g., Zheng et al., 2016) within ocean basins due to their longer residence times arising from their stronger aqueous complexation and thus reduced particle reactivity compared to the LREE (Cantrell and Byrne, 1987; Byrne and Kim, 1990). However, the limited distances and correspondingly short timescales for the movement of these young water masses (ISOW and LSW) in the NE Atlantic in this study limits the extent to which particle reactivity would influence the distribution of the REE (with the exception of Ce). We therefore assume the REE behave conservatively and mainly reflect the lateral advection of the water mass, with alteration of the REE signature chiefly attributable to mixing with other water masses and extraneous inputs. In this section, we focus on the preformed nature of REE at depth in the water column (below the permanent pycnocline).
Temporal Record of ISOW
The ISOW data used for comparison to data in this study, expressed hereafter as pISOW, were collected from the Faroe-Shetland Channel (Stn 23 in Figure 1) in 1999 and represent a mean of REE concentrations in waters sampled at three depths (599, 800, 988 m; Lacan and Jeandel, 2004b). Based on potential density (Figures 2C, 3C), station IB16 “sees” ISOW at depths of ≥1,500 m, while along the eastern Iceland Basin the deepest sample at IB9 (1,842 m) is influenced by both ISOW and LSW (Figure 3C). Of the two, IB16 has the strongest, least dilute signal of ISOW because it lies immediately downstream of ISOW's passage through the Faroe Bank Channel, with a path length between Stn 23 and IB16 being relatively short at ~1,000 km. At IB9, ISOW lies at greater depth and the potential density gradient with the overlying LSW is shallower indicating more diffuse recirculation and some mixing with LSW. This is observable in Figure 3C by the greater deviation of the deep waters towards LSW compared to IB16.
To test the similarity between ISOW collected in 1999 and in 2015, we first normalise REE concentrations at IB16 (1,550 m), i.e., the sample with the strongest ISOW signal (i.e., σθ 27.85 kg/m3), by the pISOW REE concentrations. This is presented in Figures 6A,F (inverted light green triangles) with a combined 2σ external error envelope of the IB16 (1,550 m) and pISOW samples. The same data are also normalised to DLSW in Figures 6G–L for comparison. Presenting the data in this way emphasises similarities between samples that are potentially related to the origin of the water mass. The data match between IB16 (1,550 m) and pISOW is surprisingly good, reflected by most of the pISOW-normalised REE in the IB16 sample having a value close to unity.
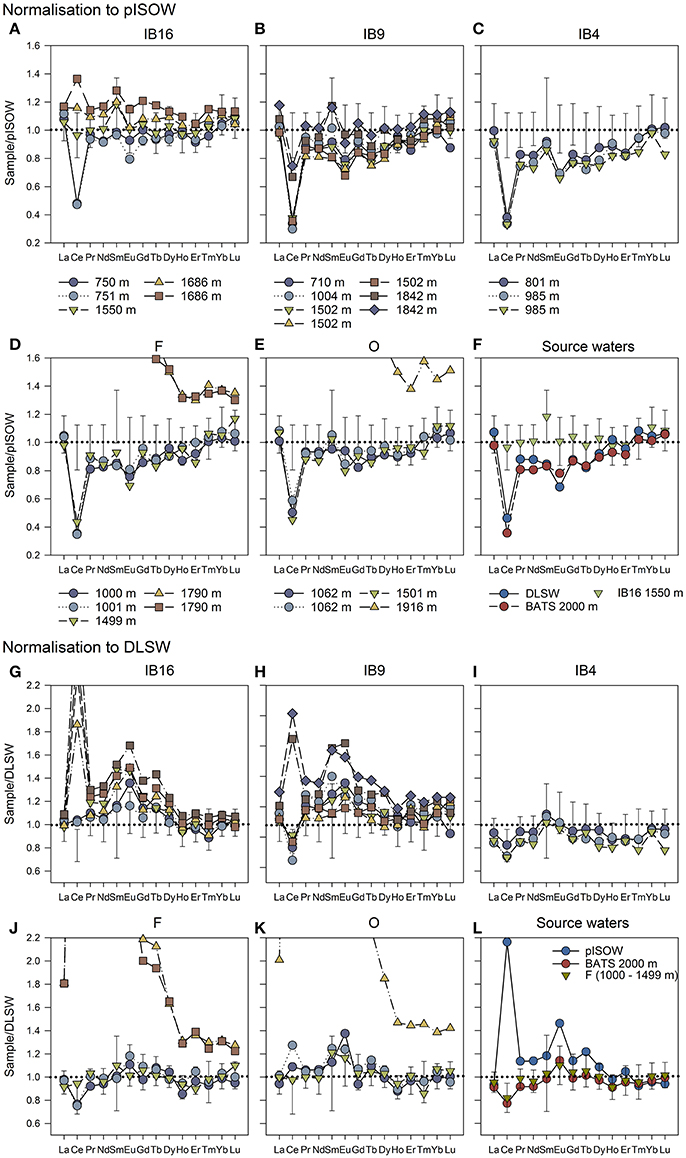
Figure 6. Normalisation by pISOW of (A–E) the 5 open ocean stations along the EEL and (F) DLSW and BATS 2000 m. Normalisation by DLSW of (G–K) the 5 open ocean EEL stations and (L) pISOW and BATS 2000 m. The error bars shown in (A–F) represent the combined 2SD from normalisation of IB16 (1550 m, shown in F) by pISOW, and in (G–L) are based on the combined 2SD from normalisation of F (1000-1499 m) by DSLW. The REE concentrations are from the literature: BATS 2000 m (van de Flierdt et al., 2012), pISOW (Lacan and Jeandel, 2004b), and deep (D)LSW (Filippova et al., 2017).
The similarity raises the question of how discriminatory the REE are at identifying ISOW along the EEL. For example, is the REE data match between IB16 and pISOW simply fortuitous? Normalisation of all intermediate and deep (>700 m) EEL station data by pISOW reveals clear differences between the Iceland Basin vs. the Rockall Trough and the Rockall-Hatton Plateau (Figures 6A–E). As a first broad appraisal, these differences are ascribed to the dominant presence of LSW in the Rockall Trough and both LSW and ISOW in the Iceland Basin.
A more detailed appraisal of the pISOW-normalised values within the Iceland Basin brings to attention sample depths that lie above (IB16 1,686 m) and below (IB9 1,502 m) the error envelope. The higher LREE and MREE concentrations observed in IB16 (1,686 m) suggest interaction with sediments (Pearce et al., 2013; Abbott et al., 2015b; Molina-Kescher et al., 2018), but this is not supported by the beam transmission data, which do not indicate significant suspended sediment (discussed in section Source of Elevated REE Concentrations in the Deep Rockall Trough Samples). Rather the excess dissolved LREE and MREE point to sediment interaction prior to arriving at IB16, possibly during overflow through the Faroe Shetland and Faroe Bank Channels. The sample that lies below the error envelope (IB9 1,502 m) shows greater similarity to LSW. This is expected since waters at this depth at IB9 are largely dominated by LSW (sample σθ of 27.76 kg/m3).
The shallower samples (e.g., IB16 750 m, IB9 1,004 m) in the Iceland Basin also fall within the pISOW error envelope, despite the unlikely presence of ISOW at these depths. Some of the LREE and MREE are on the lower edge of the error envelope or below it (Nd, Sm, Eu, Gd). However, the HREE show greater similarity to pISOW. These samples lie within the pycnocline, which is weaker in the Iceland Basin than elsewhere on the EEL (Figure 2C), and have properties that are intermediate between surface and deep currents (e.g., respectively σθ of 27.61 and 27.70 kg/m3, 6.4 and 4.7°C, 35.11 and 34.97 salinity). As the northeasterly flowing, shallower WNAW ultimately contributes to the return flow of underlying ISOW, we would expect similarity in the HREE but a reduced match in LREE and MREE since the higher concentrations of these in ISOW are postulated to be acquired through sediment interaction during its return transit at depth through the Faroe-Shetland and Faroe Bank Channels. The Iceland Basin is also an area of water recirculation and mixing, and these depths at IB16 and IB9 may reflect the mixing of WNAW with both LSW entering the Iceland Basin from the south and ISOW as it emerges through the Faroe Bank Channel at relatively shallow depths (sill depth of 840 m).
The similarity of the pISOW-normalised REE at IB9 (1,842 m) is problematic in that it shows values close to unity although the potential density of the sample (σθ 27.80 kg/m3) does not fall in the range normally occupied by ISOW (i.e., ≥27.85 kg/m3). This deepest IB9 sample also appears to lie within the potential temperature and salinity range of LSW (Figures 2, 3). We can use mixing proportions to identify the percentage contributions of each water mass in this sample, assuming two-component mixing. The LREE and MREE are the most discriminatory based on the pISOW-normalised deep DLSW of Filippova et al. (2017; Figures 6F,L; Table 1). The DLSW signature is based on a mean of REE concentrations at stations 15.5 (1,700 m) and 17.5 (2,000 m). Taking DLSW as unaltered LSW and IB16 (1,550 m) as representative of ISOW, an average contribution can be calculated of ~80% ISOW and ~20% DLSW in the LREE and MREE (Pr, Nd, Eu, Gd, Tb, Dy) in the deep IB9 sample. The calculation excludes La due to similarity in concentration between ISOW at IB16 and DLSW (see Figure 6L), and Ce because removal through oxidation makes it less reliable for this purpose. This ratio of ~80:20 ISOW:DLSW in the REE is at odds with the mixing ratio of ~20:80 ISOW:DLSW based on the more conservative properties of potential temperature and salinity. The disparity between the actual REE concentrations at IB9 (1,842 m) and the hypothetical concentrations based on a mixing ratio of ~20:80 ISOW:DLSW reveals the largest increases in Ce, Sm and Eu (25–28%), with lesser increases in the other LREE and MREE (≤11%), and HREE (≤4%). On the assumption that two-component ISOW:DLSW mixing is an accurate reflection of the waters at IB9 (1,842 m), this pattern of excess LREE and MREE points to input of a sedimentary or pore water source to the overlying water column, discussed in more detail in section Source of Elevated REE Concentrations in the Deep Rockall Trough Samples. The beam transmission data (Supplementary Figure 1) also show evidence of suspended sediments over the bottom ~14 m. Another mechanism to increase the REE at IB9 (1,842 m), which is ~36 m above the sediment surface, is through particulate desorption of REE in the low beam transmission zone and upward mixing. The impact of external inputs on the distribution of seawater REE concentrations is discussed in more detail in section Source of Elevated REE Concentrations in the Deep Rockall Trough Samples.
Distal Record of LSW
More generally the pISOW-normalised LREE of intermediate and deep EEL station samples lie below the 2σ error envelope (Figures 6A–E), except the deepest sample at each of IB16, IB9, F and O. The trend for the MREE is similar, with an additional prominent Eu depletion relative to pISOW. Based on comparison of characteristic water mass properties (Table 1), these intermediate to deep depths at all stations are dominated by LSW, and therefore the REE patterns would not be expected to show similarity to pISOW if they are indeed discriminatory of different water masses. This is further reinforced when the REE concentrations in DLSW collected at source (Filippova et al., 2017) are normalized by pISOW REE (stations 15.5 and 17.5 in Figures 1A, 6F). Both this DLSW and the LSW observed along the EEL have shared features relative to pISOW of ~15% lower LREE concentrations (with the exception of La, which is similar in pISOW, DSLW and BATS 2,000 m), fairly prominent depletions of 50% in Ce and 30% in Eu, and steadily rising MREE to HREE concentrations between Tb and Lu.
In Figures 6G–K, we normalise the deep EEL data to DLSW to provide a comparison to the other dominant deep water mass encountered in the Iceland Basin and the Rockall Trough. The error envelope in this case represents the combined external error of deep waters at station F (1,000–1,499 m) and DSLW (stations 15.5 and 17.5). There are clear differences between the two basins. Stations F and O have normalised values close to unity (with the exceptions of the deepest samples), indicating similarity to DLSW, and mostly fall within the error envelope (Figures 6F,K). Similarities to DLSW are also observed at IB4. At this station, the circulation pattern and origin of the deeper waters (>800 m) are not well constrained, with possible inflow across the Rockall-Hatton Plateau from either the NE Atlantic or from overflow across the Wyville Thomson Ridge (WTR; Figure 1). The data presented here strongly suggest an origin in the NE Atlantic and entry via the southern end of the Rockall-Hatton Plateau. If the waters on the Rockall-Hatton Plateau were sourced from ISOW, the LREE and MREE would be expected to have significantly higher concentrations than observed. The strong similarity between the average deep water at station F (1,000–1,499 m) and BATS 2,000 m (Figure 6L) suggests a common origin through mixing in the sub-polar gyre before divergence to the Rockall Trough and the subtropical gyre respectively.
The clearest differences in DLSW relative to pISOW are the lower LREE and MREE concentrations, defined by the depletions in Ce and Eu, in DLSW (Figures 6F,L). We can explain these differences by examining the origin of the water masses and their pathways to the point of sampling. From the location of formation in the Labrador Sea, LSW circulates in the NE Atlantic and has less contact than ISOW with continental margins, therefore with the marine sediments and pore waters that carry elevated LREE and MREE in contrast to seawater REE (Abbott et al., 2015b), before arriving in the Rockall Trough. The pISOW on the other hand, travels through narrow channels such as the Faroe-Shetland and Faroe Bank Channels. This provides the opportunity to raise the LREE and MREE concentrations through contact with sedimentary sources (Zhang et al., 2008; Pearce et al., 2013; Abbott et al., 2015b), characterised by the higher Ce concentrations and also the distinctly higher Eu from the regional mafic geology (i.e., Faroe Islands, Iceland).
Source of Elevated REE Concentrations in the Deep Rockall Trough Samples
The REE concentrations at depth in the coastal stations (IB22/23, 9G) and the Rockall Trough (stations F, O, P) are high (Figures 4, 5). These latter open ocean samples also diverge the most from pISOW and DLSW (Figures 6D,E,J,K), supporting an extraneous REE contribution. No such anomaly is observed in the Iceland Basin (IB9, IB16) or the Rockall Hatton Plateau (IB4, although no samples were collected from within the zone of low beam transmission). The discussion in the literature on sources of REE to the deep marine water column describes vertical scavenging by particulate REE capture in surface waters and release at depth (e.g., Tachikawa et al., 1999; Siddall et al., 2008). A benthic flux from pore waters to the overlying water column may also be important for the overall marine REE budget (Elderfield and Sholkovitz, 1987; Haley et al., 2004, 2017; Lacan and Jeandel, 2005b; Abbott et al., 2015a,b), where vertical scavenging alone cannot account for deep water REE concentrations (Elderfield and Greaves, 1982). Similar to the benthic flux are REE released into solution during sediment resuspension, through processes of fine particle dissolution, dissolution of labile phases adhered to the particles, and pore water release through disturbance of the sediment (Jeandel et al., 1998; Zhang and Nozaki, 1998; Lacan and Jeandel, 2005b; Arsouze et al., 2009; Pearce et al., 2013; Stichel et al., 2015; Grenier et al., 2018).
The abrupt nature of the concentration change in the deep Rockall Trough points to an upward flux rather than REE desorption from sinking particulates, which generally shows a steadier increase with depth (e.g., Hathorne et al., 2015). In addition the main deep water masses (LSW, ISOW) are young and the water column is not especially deep at the selected stations (<2,000 m), reducing the influence of dissolved REE (and nutrient) accumulation through remineralisation. While advective transport is the dominant process controlling REE concentrations in the intermediate and deep ocean (Elderfield, 1988; Lambelet et al., 2016; Zheng et al., 2016), the restricted nature of the Rockall Trough and its proximal location to the UK shelf mean other processes are likely to dominate (Jeandel, 2016).
To highlight both the abrupt nature of the concentration change in the deep Rockall Trough and the influence of young water masses circulating in a relatively shallow water column (e.g., <2,300 m) in the northern Rockall Trough, the ratio of increases at depth relative to surface water Nd concentrations ([Nd]depthx/[Nd]surface) from stations along the EEL are compared to Southern Ocean data in Hathorne et al. (2015; Figure 7). This reveals a divergence in trends below ~1,000 m depth, with low relative increases with depth at the EEL stations and larger relative increases in the Southern Ocean. The exceptions are the deepest samples in the Rockall Trough that show a steep concentration gradient and an increase in Nd concentration relative to the surface waters that is similar to those observed in the Southern Ocean at ~4,500 m depth.
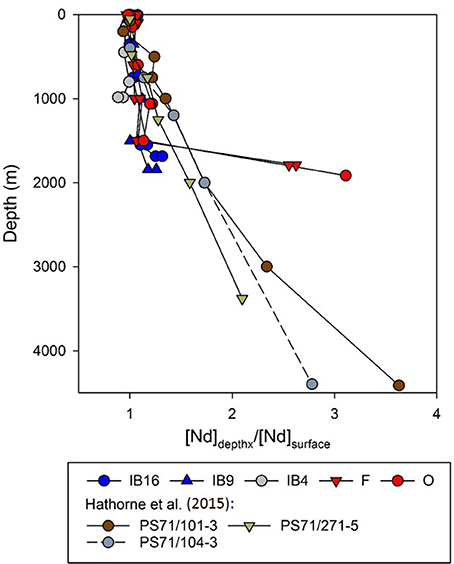
Figure 7. The water column increase of Nd concentrations at depth relative to the surface ocean ([Nd]depthx/[Nd]surface) for the 5 open ocean stations, with comparison to selected stations in the Southern Ocean in Hathorne et al. (2015).
The most obvious reason for the elevated REE concentrations is sample collection from depths where beam transmission is reduced (Supplementary Figure 1), inferring the presence of a benthic nepheloid layer and high particulate concentrations. Based on beam attenuation data, this occurs as a layer ~50 m thick above the sediment surface along UK slope (stations O and P), decreasing to <14 m in mid-Rockall Trough (F), Rockall-Hatton Plateau (IB4) and Iceland Basin (IB9), before disappearing completely in the NW Iceland Basin (IB16). Similarly elevated REE concentrations have been noted at depth in the Sagami Trough, Japan (Zhang and Nozaki, 1998), and on the Mauritanian slope (Stichel et al., 2015), and attributed to REE release from resuspended slope sediments. Resuspension of sediments by currents has been noted in the Rockall Trough, where currents are strong to moderate and flow parallel to bathymetric contours (Lonsdale and Hollister, 1979).
Zhang and Nozaki (1998) postulated that if the REE are chemical analogues to actinium, then the observed release (rather than scavenging) of actinium from slope sediments (Nozaki and Yang, 1987) may also operate for the REE. In this study, the decreased beam transmission close to the seafloor confirms sediment suspension, probably driven by current action that would encourage desorption from resuspended sediments and release of associated pore waters into the overlying water column. The typically higher LREE and MREE concentrations in pore waters, relative to seawater (Abbott et al., 2015b), would drive those deep waters adjacent to the seafloor to acquire REE profiles with higher LREE and MREE concentrations that deviate from typical seawater values. Release of REE from suspended particulates as the source of elevated LREE and MREE, rather than pore waters, is also possible. Here we investigate the potential of pore waters and sediment resuspension to act as a benthic source of dissolved REE to the overlying water column and evaluate the impact on seawater REE distribution.
Potential Sources
We use the relative differences in PAAS-normalised REE concentrations (see caption to Figure 8) and their concentrations to constrain the potential sources (Figure 8). Each of the REE sources in Figure 8 represents an average for clarity, and hides the range of MREE/MREE* and HREE/LREE associated with specific phases. Both desorption from sediments and pore water release are potential candidates for the elevated REE concentrations observed in the deep water column samples. An indirect analogy is the observation of nutrient release during sediment resuspension experiments, which identified the requirement of both desorption processes and pore water release to account for the observed nutrient increases (Couceiro et al., 2013). The deepest samples with high REE concentrations show greatest similarity in the MREE/MREE* to labile Fe phases and pore waters (Figure 8B). The relationship is less clear cut with the HREE/LREE ratio because the REE sources (labile Fe phases, sedimentary organic matter, Icelandic ash) are less well differentiated by this ratio (Figure 8C), although the data are clearly closer to the composition of these sources than typical seawater (represented by BATS 2,000 m and 15 m).
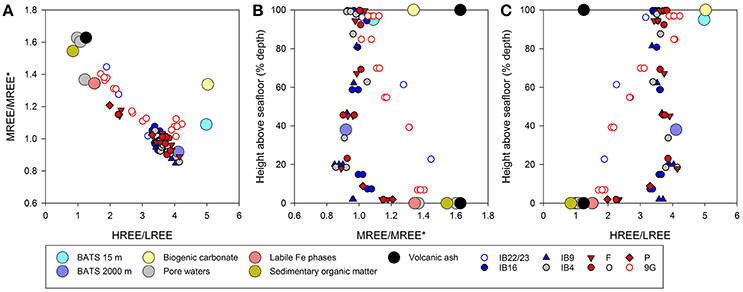
Figure 8. (A) The PAAS normalised REE concentrations presented as the MREE anomaly (MREE/MREE* = (Gd+Tb+Dy)/[(La+Pr+Nd+Tm+Yb+Lu)/2]) vs. the HREE/LREE ratio ([Tm+Yb+Lu]/[La+Pr+Nd]). Sample depth presented as height above seafloor as a % of the water column depth vs. (B) MREE/MREE* and (C) HREE/LREE. The REE source data (large circles) are collated REE concentrations representing different potential sources of REE in the marine environment, both solid and aqueous phases: Bermuda Atlantic Time Series (BATS) reference seawater from 15 m and 2000 m water depths (van de Flierdt et al., 2012), biogenic carbonate from warm water corals in the North Atlantic (Sholkovitz and Shen, 1995), marine sedimentary pore waters collected in the Northeast Pacific along the Oregon margin, from cores in a depth transect (Abbott et al., 2015b), labile Fe phases (Bayon et al., 2004; Gutjahr et al., 2007; Du et al., 2016), sedimentary organic matter (Freslon et al., 2014), Icelandic ash (Tepe and Bau, 2014). Details of average values used in this study are in Table S3. The pore water data (Abbott et al., 2015b) represent the average REE concentrations in pore waters of the top 5 cm of sediment from cores HH200, HH500, HH1200, and HH3000, corresponding to water column depths of 202, 500, 1,216, and 3,060 m respectively. The depth-related differences in pore water MREE/MREE* and HREE/LREE are more clearly seen in Figure 10. To note, surface waters from O and all 9G samples were not filtered.
Both the MREE/MREE* and HREE/LREE (Figure 8) show a prominent kink in the trend at ~20% height above seafloor (we present relative depth in this figure to make the coastal station data legible). This represents an artefact of the sampling depths and not the depth to which the benthic nepheloid layer influences the dissolved REE. The thickness of the decreased transmission layer (≤~50 m) is significantly less than ~20% height above seafloor (i.e., ~290–390 m at F, O, P). Station IB4 has the greatest decrease in beam transmission (80%) of all the stations, but no apparent influence on the REE concentrations of the deepest sample (985 m) that is located above the decreased transmission layer (top of layer is at ~1,190 m). As a general observation, this suggests that the high REE concentrations observed in benthic nepheloid layers do not “leak” significant REE into the overlying water column. We observe no correlation between the thickness of the benthic nepheloid layer (or low beam transmission) and the REE concentrations of those samples collected within the layer. However, there is a correlation between the extent of beam attenuation and REE concentrations (Supplementary Figure 2). More detailed sampling is necessary to constrain the full extent of influence of the turbid layer on dissolved REE concentrations.
On the basis that the pattern of PAAS-normalised REE concentrations is indicative of the phase or source, the “excess” REE component in the deepest samples can be isolated through subtraction of the overlying water sample to reaffirm the origin of the elevated deep water concentrations (Figure 9). The Iceland Basin and Rockall-Hatton Plateau samples show no significant increase, with flat profiles and values close to zero, implying no extraneous inputs of REE at these depths and locations. The Rockall Trough and both coastal stations have positive MREE anomalies, including a prominent positive Eu anomaly for IB22/23 derived from the predominantly volcanic origin of the sediments. The “excess” component in the deep Rockall Trough and coastal samples has concentrations not dissimilar to seawater but the source of the excess REE is not discernible because the potential sources examined here have very similar PAAS normalised profiles (Figure 9B). Examination of the Y/Ho ratio (not shown) did not clarify the identification of the contributory phases. However, on the basis that pore waters are derived from a combination of Fe-rich phases, dissolution of volcanic ash, and diagenesis of organic matter, we attribute the excess REE to pore water inputs for the purposes of establishing mixing proportions.
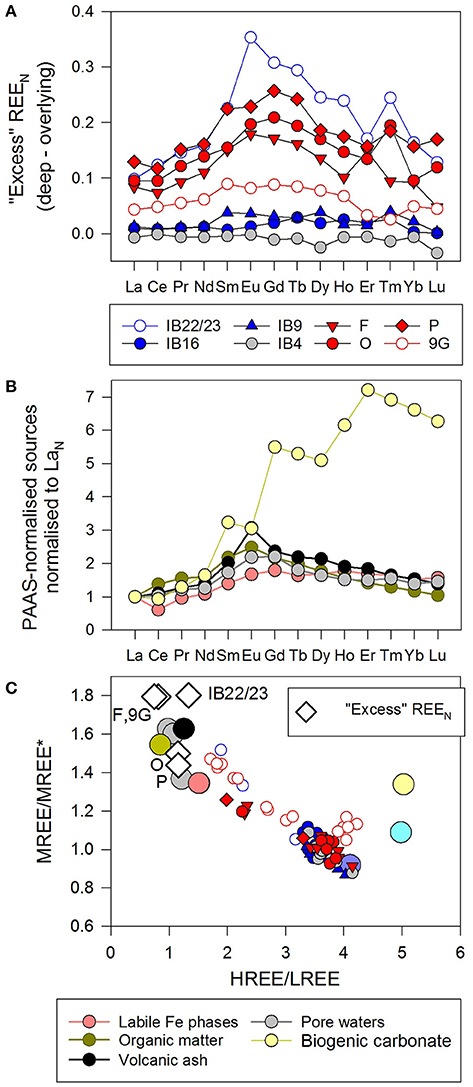
Figure 9. (A) “Excess” REEN in the deepest seawater samples to identify the phase contributing excess REE concentrations to the water column, calculated by subtracting the PAAS normalised REE in the overlying sample from the deepest sample at each of the EEL stations (REEN deepest sample—REEN overlying sample). (B) Potential sources of REE to seawater. (C) The same as Figure 8, with the addition of the REE composition (MREE/MREE* vs. HREE/LREE) of the “excess” REE at stations F, O, P, 9G, IB22/23. References listed in caption of Figure 8. To note, surface waters from O and all 9G samples were not filtered.
Mixing Proportions
Considering pore waters as the source of excess REE in the deepest water column samples, the REE composition (MREE/MREE* and HREE/LREE) can be combined with concentration data to determine the proportional input of pore waters (Figure 10). Pore water concentrations can be highly variable, but are generally at least one order of magnitude greater than seawater REE concentrations (Elderfield and Sholkovitz, 1987). In the absence of pore water REE data specific to sediments in the NE Atlantic at the time of sampling, we use the pore water concentrations from Abbott et al. (2015b), which are from a similar shelf to open ocean setting (Oregon margin, eastern North Pacific). Mixing trends are calculated between pore waters from shelf and deep ocean sediment samples, and BATS 15 and 2,000 m seawater respectively, representative of seawater that is unaffected by pore water contributions in both coastal and open ocean water columns. The data are clearly differentiated between the coastal station and deep Rockall Trough samples with high concentrations, and the rest that have little apparent contribution of pore water REE (e.g., ~ ≤2% HREE from pore waters; Figure 10). In this instance a pore water contribution of the order of ~10% for both LREE and MREE is required, relative to the BATS seawater, to account for the observed increase in the deep Rockall Trough (F, O, P) and up to 25% at the coastal stations (IB22/23, 9G), with the caveat that actual pore water REE concentrations from the sediments below the EEL may diverge from those of Abbott et al. (2015b). The higher contributions to coastal station water columns are discussed below.
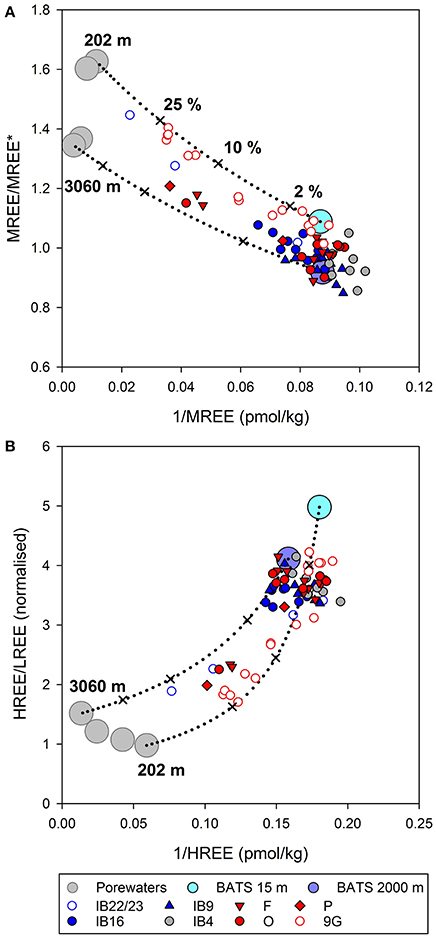
Figure 10. Mixing plots of (A) MREE/MREE* vs. 1/MREE, and (B) HREE/LREE vs. 1/HREE, to highlight the combined effects of REE composition and concentration. The MREE/MREE* and HREE/LREE are calculated using PAAS normalised data, and the non-normalised concentrations are used for 1/MREE and 1/HREE (pmol/kg). Data for BATS seawater (15 and 2,000 m) are from van de Flierdt et al. (2012). The pore water data are from Abbott et al. (2015b) and represent the average REE concentrations in pore waters of the top 5 cm of sediment from cores HH200, HH500, HH1200, and HH3000, corresponding to water column depths of 202, 500, 1,216, and 3,060 m respectively. The shallowest and deepest cores are labelled in the figures, with the intervening cores between these in depth order. Mixing lines are represented by dotted lines between BATS 15 m and pore waters at 202 m depth, and BATS 2000 m and pore waters at 3,060 m depth. The crosses on the mixing lines represent pore water REE contributions of 2, 10, and 25% to BATS 15 m (HH200) and BATS 2000 m (HH3000). The % contributions are labelled for mixing between BATS 15 m and HH200 in the top panel only for clarity. To note, surface waters from O and all 9G samples were not filtered.
The four water column depths represented by the pore water data of Abbott et al. (2015b) are 202, 500, 1,216, 3,060 m, and they display a depth-related range of REE compositions most clearly seen in Figure 10B. The data from the deepest sites (F 1,825 m, O 1,953 m) form a trend defined by mixing between the deeper pore waters and BATS 2,000 m seawater, and not surface ocean water (BATS 15 m) and the shallowest pore water (202 m). This trend towards the deep data supports the observed variation in pore water composition reported by Abbott et al. (2015b) and suggests similar depth-related differences in pore water composition and concentration are also present in the NE Atlantic. The reasons for REE compositional gradients in pore waters are likely associated with sediment composition, reflecting the input of both different particle types and different amounts and reactivities of organic matter to the seafloor to drive diagenetic reactions, as well as current action and benthic activity that determines irrigation of the sediments and therefore contributes to the redox status of the pore waters.
When estimating the sedimentary REE contribution to the water column, the effect of the spring bloom on the seafloor needs to be considered. The samples in this study were collected in late May/early June during the spring bloom. This represents a period of increased transfer of organic matter to the seafloor and heightened benthic activity (e.g., Honjo and Manganini, 1993; Lochte et al., 1993; Pfannkuche, 1993; Rice et al., 1994; Hughes and Gage, 2004). This in itself could increase the rate of transfer of REE from sediment sources to the overlying water column through bioturbation and bioirrigation. The start of the spring bloom in 2015, defined here as the time at which chlorophyll-α concentrations first exceed 0.5 mg/m3, is identified as late April at stations F and O. This is based on satellite-reported chlorophyll-a concentrations (http://hermes.acri.fr/) over the period January to July 2015, and by using mean Chl-α at the pixel closest to the station plus the five surrounding pixels on each side (±0.05 latitude, ±0.075 longitude). Particulate fluxes associated with the spring bloom are pulsed and rapid, with observed particle flux transit rates of the order of 4-6 weeks (Lochte et al., 1993). The sampling of stations F and O in June 2015 may therefore have allowed sufficient time for material to reach the seafloor from a bloom initiated in late April 2015. Therefore the REE concentrations in the deep Rockall Trough observed in this study may represent a temporary or seasonal shift.
A further consideration, as mentioned above, is the resuspension of sediments by currents, which occurs along the slopes of the Rockall Trough (Lonsdale and Hollister, 1979). Sediment resuspension experiments noted significant increases in nutrient release, especially silica, attributable to pore waters, desorption and potentially microbial activity on particle surfaces (Couceiro et al., 2013). These features are notable in the silica concentrations in the deep Rockall Trough, and to a lesser extent in phosphate (Figure 11). They are possibly linked to the silica biogeochemical cycle dominated by remineralisation of diatom frustules that are hypothesised to have high REE contents (Akagi, 2013). Taken together, diffusion, benthic activity and sediment resuspension may result in enhanced sedimentary REE fluxes to the water column. The seasonal aspect of the sedimentary source of REE to seawater, as a response to the spring bloom, cannot be evaluated in this study and requires further sampling either side of the spring bloom, when the diffusive flux and sediment resuspension are likely to dominate.
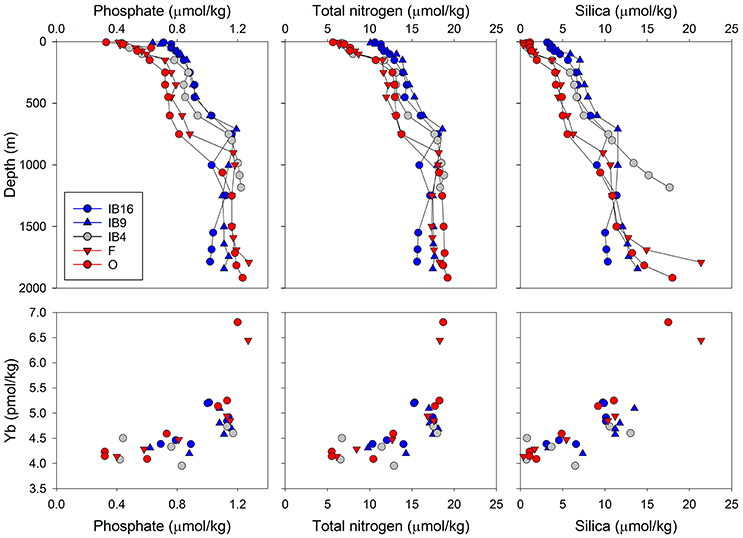
Figure 11. Depth variation of the nutrient concentrations (μmol/kg) at the 5 open ocean stations in this study. The lower panels show variation in Yb concentration (pmol/kg) vs. each of the three nutrients (phosphate, total nitrogen, silica).
The conspicuous differences between the water column profiles of REE concentrations at the two coastal stations and the five open ocean stations can be partly attributed to effects related to water depth, e.g., <200 m vs. ~1,900 m, with the caveat for station 9G samples that were not filtered. The drivers of diagenesis in the sediments are likely to be more intense on the shelf, for example the reactivity and quantity of organic matter input, the intensity of benthic activity, which shows an inverse relationship with water depth (Henderson et al., 1999), and sediment resuspension due to currents and benthic activity. To establish a quantitative evaluation of the benthic flux (i.e., the cumulative effects of diffusion, benthic activity, sediment resuspension), combined Nd isotope and REE concentration measurements are required under different seasonal conditions.
Implications for Water Mass Identification
One last point to mention, based on inference from the REE concentrations, is alteration of other deep water characteristics when located in the benthic nepheloid layer (or decreased beam transmission) and/or during heightened benthic activity associated with the spring bloom. The REE concentrations in those samples that lie within nepheloid layers demonstrate the influence of pore water release and/or release from suspended particulates on elevated LREE and MREE concentrations in particular. What of the other measured characteristics, e.g., nutrient and dissolved oxygen concentrations, that may also be present in different concentrations in pore waters compared to seawater? The deep Rockall Trough REE data demonstrate up to ~10% contribution to the seawater REE load. This implies other chemical characteristics of waters in the nepheloid layer may also be shifted to higher or lower values, depending on their concentrations in pore waters, with no significant alteration in the defining properties of a water mass (i.e., temperature, salinity, potential density). All measured nutrients are present in higher concentrations in the very deepest parts of the eastern Rockall Trough, especially silica (Figures 2, 11). More detailed sampling of the lower water column and direct sampling and analysis of sediment pore waters is needed to identify the influence of these on deep water characteristics.
Biogeochemical Cycling of REE
Haley et al. (2014) identified a “bio-reactive pool” of REE present in the surface ocean, characterized by noticeably lower HREE concentrations. They attributed this to the indirect effects of microbial cycling of iron, possibly as a consequence of the affinity of dissolved REE for organic molecules and ligands associated with iron reduction (Christenson and Schijf, 2011). The presence of a “bio-reactive pool” goes some way to accounting for the frequently observed absence of HREE enrichment that is typical of surface ocean REE profiles (e.g., as observed in the tropical South Atlantic; Zheng et al., 2016), when the expectation is the opposite; i.e., that LREE are preferentially removed from solution, compared to the HREE, due to the their greater particle reactivity and also the relatively stronger solution complexation of the HREE (Cantrell and Byrne, 1987; Byrne and Kim, 1990; Sholkovitz et al., 1994). In this section, we examine the data to determine how the pronounced decrease in dissolved oxygen across the EEL relates to vertical cycling of dissolved REE between the surface ocean and the permanent pycnocline, and if this can elucidate on the “bio-reactive pool” of REE identified by Haley et al. (2014).
Oxygen Depletion Zone (ODZ)
The Northeast Atlantic has an exceptionally productive annual spring bloom that results in Fe limitation by the summer months (Nielsdottir et al., 2009). The impact of the spring bloom on the water column can be observed in the distribution of dissolved oxygen concentrations, with a minimum at the permanent pycnocline (Figures 2, 12). This ODZ is caused by particles rich in organic matter from the surface ocean that linger and decay during their downward transit to the seafloor. In the Rockall Trough, the ODZ is further enhanced by winter mixing that typically reaches depths of 600 m, and therefore not as deep as the ODZ (i.e., ~800–1,200 m in the Rockall Trough), although it may reach ~1,000 m in severe winters (Meincke, 1986). Lateral advection at these depths in the Rockall Trough is low (Holliday et al., 2000), implying a minimal inherited component of dissolved REE but also a longer residence time of the water that equates to greater potential to accumulate REE compared to elsewhere in the water column. This is not the case in the Iceland Basin, where the ODZ is shallower and more diffuse, and hence more susceptible to obliteration by annual winter mixing and by lateral advection. Also, at the time of sampling the spring bloom was not as well developed in the Iceland Basin, with productivity at least ~4 times lower than in the Rockall Trough (details below).
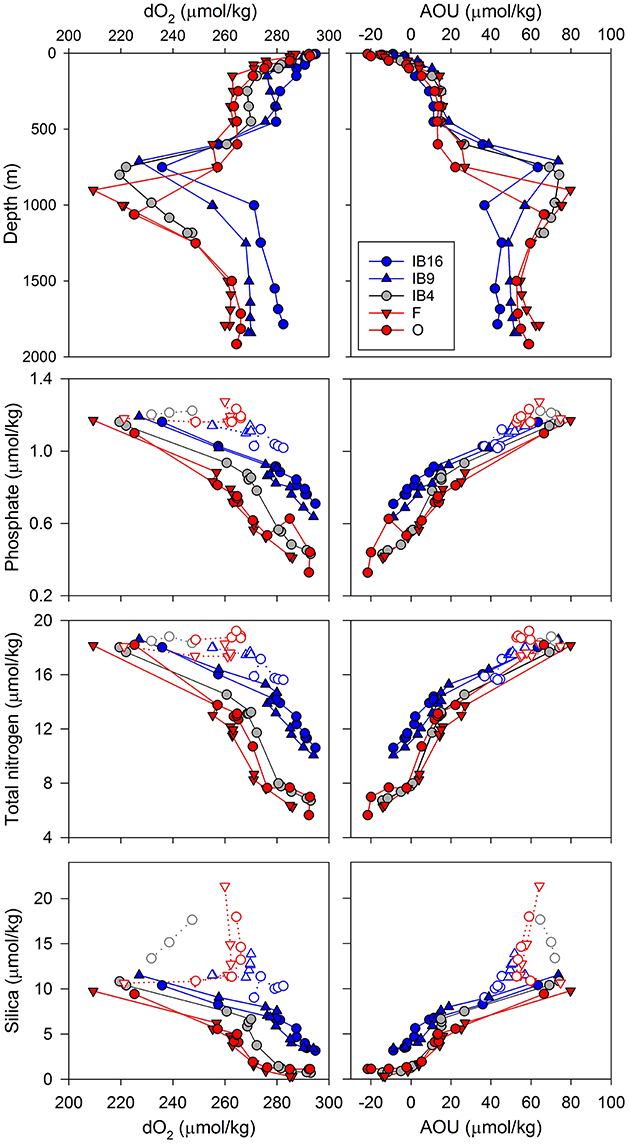
Figure 12. Depth variation of dissolved oxygen concentrations (μmol/kg) at the 5 open ocean stations in this study (left column). The apparent oxygen utilisation (AOU; μmol/kg) is also shown for comparison (right column). Lower panels show nutrient concentrations (phosphate, total nitrogen, silica) vs. dissolved oxygen and AOU (μmol/kg) at the same stations. The open symbols represent waters below the permanent pycnocline.
The combined effects in the Rockall Trough of remineralisation of organic matter from the annual spring bloom, restricted winter mixing depths (≤~600 m), and minimal lateral advection, likely explain most of the marked depletion of oxygen and/or maximal apparent oxygen utilisation (AOU) values (Figure 12) and the local maxima of nutrient concentrations (Figure 11). These have possibly accumulated over several years until obliterated by mixing during the less frequent severe winters. These effects are not observed in the Iceland Basin because the ODZ is shallower and within the depth range of annual winter mixing. While the dissolved oxygen concentrations in the ODZ are not particularly low (minimum value of ~209 μmol/kg), they are superimposed on a background of much younger, well ventilated deep waters (ISOW, LSW with >260 μmol/kg) and the well mixed upper water column. These features highlight the cycling of nutrients along the EEL, with removal from the surface ocean during the spring bloom and focused remineralisation of organic matter at the permanent pycnocline, possibly with limited annual return of the remineralised products to the surface ocean. The influence of these processes on dissolved REE in the Rockall Trough between the surface ocean and the permanent pycnocline is therefore dominated by biogeochemical cycling, rather than advection or extraneous inputs.
Differences in REE Between the Surface Ocean and the Permanent Pycnocline—Concentrations and Normalised Distribution Patterns
At each of the five open ocean stations, we took the REE sample with the lowest oxygen concentration in the profile and subtracted the surface water REE to highlight inputs or accumulations of REE due to remineralisation at the permanent pycnocline. The PAAS-normalised REE concentrations in the surface and ODZ samples at stations F and O are shown in Figure 13C. To note, the surface samples at O were not filtered. The surface water REE are the very shallowest samples in the dataset, i.e., within 12 m of the surface. In the Rockall Trough, these correspond to the thin veneer (<35 m) of seasonally affected waters (≥10.5 °C, σθ <27.16 kg/m3), whereas in the Iceland Basin colder and denser waters outcropped at the surface (8.3 °C, σθ 27.34–27.38 kg/m3) at the time of sampling.
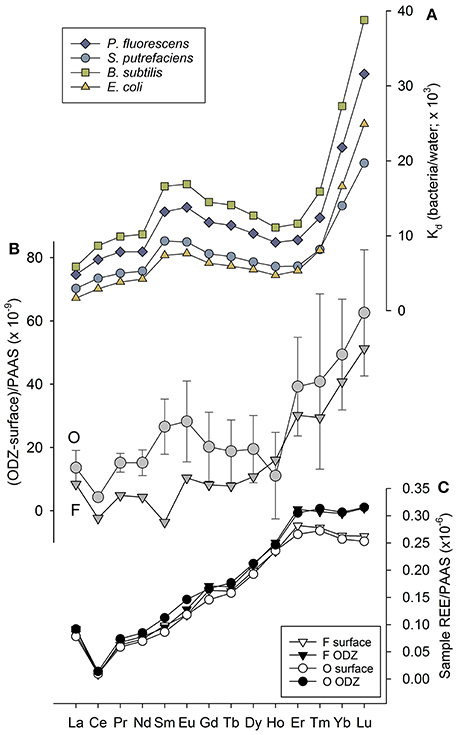
Figure 13. Comparison of (A) the REE partitioning behaviour from water to bacteria, with (B) the PAAS-normalised difference between ODZ and surface REE concentrations. For clarity, the 1SD propagated errors are shown for station O data only. (C) The PAAS-normalised distribution profiles of F and O showing only the surface and ODZ data to highlight the lower REE concentrations in the surface waters. The REE partitioning data in (A) are from Takahashi et al. (2005) and Takahashi et al. (2007), from experiments carried out at pH 4 and I = 0.01 M NaCl. To note, surface samples from O were not filtered.
We restrict this comparison to stations F and O, because the Iceland Basin and Rockall-Hatton Plateau did not demonstrate any significant trends. The (ODZ-surface) REE signal of these stations show a depletion in Ce and fairly flat normalised profiles, with up to ~10% higher REE concentrations at the ODZ than the surface ocean. The absence of a strong remineralisation signal is attributed to the shallower depth of the ODZ in the Iceland Basin and Rockall-Hatton Plateau and the greater frequency with which winter mixing obliterates the annual accumulation of remineralised products. The accumulation of REE, therefore, is less pronounced than in the Rockall Trough.
Biogeochemical Cycling of HREE in the Rockall Trough
The key feature of the (ODZ-surface) data at stations F and O is the nuanced increase in the HREE concentrations at the ODZ relative to the surface ocean (Figure 13B). The depletion in surface ocean HREE and the gain in HREE at the permanent pycnocline requires a mechanism that specifically targets surface water HREE complexation and removal to the pycnocline. An increasing body of work has identified the external complexation of HREE by functional groups on bacterial cell walls (e.g., Takahashi et al., 2005, 2007, 2010; Ngwenya et al., 2009, 2010), the partitioning behaviour of which is illustrated in Figure 13A. The HREE enrichment observed on bacteria cell walls is due to the strong binding by multiple phosphate sites (Takahashi et al., 2010), which is not as marked in the other REE. The relative increase in partitioning with increasing atomic mass can be interpreted as an indicator of bacterial activity. In this case, the (ODZ-surface) data and the bacteria/water partition coefficients have striking similarities (Figure 13), and suggest biogeochemical cycling of HREE by bacteria in the water column.
It is noted that fish milt accomplishes a very similar effect by an almost identical mechanism to bacteria, with preferential HREE complexation to external phosphate functional groups confirmed in salmon milt (Takahashi et al., 2014). Fish milt is also likely to be present in the pelagic waters of the Rockall Trough (e.g., blue whiting are known to spawn in this region, Hátún et al., 2009). We cannot differentiate between these two possible agents of HREE depletion, but the end result is likely to be the same with either process, i.e., the preferential complexation and removal from solution of dissolved HREE. Fish milt, if not converted into fish spawn, is likely consumed, excreted and exported out of the surface waters. Overall, the greater body of evidence for the rapid increases in the bacterial population during the spring bloom (discussed below) and the similarities in ODZ HREE enrichment to seawater/bacteria REE partitioning behaviour suggest bacterial cycling may be a significant process.
In support of a bacterioplanktonic origin of the relative HREE enrichment at the ODZ, previous studies of the North Atlantic spring bloom have identified a significant and highly variable population of bacteria associated with the development of the bloom (Ducklow et al., 1993), showing a five-fold increase after initiation of the bloom that constitutes 20–30% of the particulate organic carbon in the surface waters (<50 m). We tentatively propose that the (ODZ-surface) HREE signature observed in this study reflects external sorption of HREE on bacteria in the surface waters, removal of the bacteria to depth by sinking organic matter, and the release of the HREE at the ODZ due to decay of the bacteria. The presence of ODZ bacteria would result in further HREE sorption at these depths. However, in this case, the bacteria would need to be smaller than the filter membrane pore size (0.4 μm) in order for the signal to be captured in the measured filtrate.
In summary, the (ODZ-surface) HREE signal is visible in the Rockall Trough by virtue of a combination of factors. The intensity of the spring bloom provides the organic matter that drives the increase in both the surface water and pycnocline bacterial populations. Satellite-reported chlorophyll-a concentrations (http://hermes.acri.fr/) in May 2015 demonstrate the difference in productivity between the two basins, with higher concentrations in the surface of the Rockall Trough (2.4 and 1.5 mg/m3 at stations F and O) than on the Rockall-Hatton Plateau (1.0 mg/m3 at IB4) or in the Iceland Basin (0.4 and 0.2 mg/m3 at stations IB9 and IB16). The spring bloom also provides the source of respirable material for oxygen consumption at the pycnocline, resulting in a well-defined ODZ and nutrient maximum. Added to these features, the restricted winter mixing and minimal lateral advection at the depths of the ODZ in the Rockall Trough (described above) mean vertical cycling results in a “distillation” effect, preserving the signal of remineralisation of the REE in the waters of the pycnocline.
The importance of bacteria as a proportion of total biomass in the Rockall Trough during the spring bloom supports the potential extent of this process in productive surface waters. However, this needs further targeted investigation to conclusively demonstrate the role that bacterial activity plays in REE cycling, and if preferential bacterial HREE uptake/release can account for the proportionally greater increase in dissolved HREE accumulation with depth than the LREE, and ultimately the convex shape of that increase (Schijf et al., 2015).
As an addendum to this section about the biological effects on dissolved REE fractionation, we mention the growing evidence for REE involvement in bacterial processes (Martinez-Gomez et al., 2016, and references therein) and the recent observations of seawater LREE depletion associated with methanotrophy following the Deepwater Horizon incident (Shiller et al., 2017). The role of LREE (particularly La) in these biological processes is an active one, rather than the apparently more passive complexation of HREE by phosphate functional groups on bacterial cell or fish milt surfaces (e.g., Takahashi et al., 2010, 2014). Thus far, LREE depletions have been identified in bacteria associated with methanotrophy, and appear to be essential or superior to Ca in the catalysis of enzymes in methanotrophs (Pol et al., 2014). These and similar processes, while not significant in the surface ocean along the EEL, may potentially be relevant in the interpretation of REE variations in other locations that experience more extreme oxygen depletion or where methanotrophs and similar bacteria are abundant (Pol et al., 2014).
Conclusions
The two main deep water masses along the EEL, i.e., LSW and ISOW, are readily identifiable and differentiated through their LREE and MREE concentrations. The HREE are not discriminatory in this instance. The REE profile of ISOW at IB16 is remarkably similar to that of pISOW measured 16 years prior, although the physical properties of the water mass are slightly different. The REE profile of LSW across the EEL was identifiable, relative to ISOW, by its characteristically lower LREE and MREE concentrations, e.g., ~15% lower LREE, prominent depletion of Ce (50%) and Eu (30%). These discrepancies in LREE and MREE concentrations most likely reflect their different trajectories to arrive in the Iceland Basin and the Rockall Trough, with circulation of LSW in the North Atlantic relatively free of contact with continental margin sediments. By comparison ISOW experiences channelling through the Faroe-Shetland and Faroe-Bank Channels that brings it into contact with continental margin sediments and other terrigenous inputs.
The elevated REE concentrations observed in the deep Rockall Trough (but not the Iceland Basin) are attributed to desorption from resuspended sediments and pore water release to the overlying water column. This is based on the similarity in REE composition between the “excess” component identified in the deep samples and typical compositions of pore water REE. In addition, the base of the water column at these stations is characterised by decreased beam transmission, typically associated with suspended particulates in benthic nepheloid layers. The high REE concentrations are also possibly a temporary feature as a result of enhanced bioirrigation and bioturbation in response to the heightened flux of organic matter from the surface ocean during the NE Atlantic spring bloom, already underway by the time of the cruise. An estimated ~ ≤10% contribution from pore waters to the overlying water column is based on mixing between typical pore water and open ocean REE compositions (MREE/MREE* vs. HREE/LREE). The presence of high dissolved REE concentrations in regions near the seafloor in association with high suspended contents raises the question of how reliably these water masses can be characterised and identified by these, or other, (geo)properties.
A role for the vertical bacterial cycling of HREE is tentatively proposed based on clear similarities between the (ODZ-surface) data and seawater/bacteria partitioning behaviour. The multiple phosphate binding sites on bacterial cell walls preferentially take up dissolved HREE from the surface ocean and release the HREE into solution during focused remineralisation at the permanent pycnocline. This accounts for the HREE depletion in the highly productive surface waters of the Rockall Trough that, at the time of sampling, were experiencing the spring bloom, and also the relative increase in HREE at the permanent pycnocline. We recognise that the conditions in the Rockall Trough allow for a “distillation” effect to be preserved in the waters of the pycnocline, which may not be present elsewhere.
Author Contributions
All authors contributed to the design of the research and the preparation and revising of the manuscript. All authors approved the final version. EH collected and processed the samples as part of her final year bachelor research project.
Funding
This work was supported by the Scottish Association for Marine Science (SAMS). NERC National Capability Funding for the Extended Ellett Line (R8-H12-85) supported the participation of EH, TB, and SG on the cruise. We acknowledge the MASTS Visiting Fellowship (VF41) received from the Marine Alliance for Science and Technology for Scotland (MASTS) that funded ECH's visit to SAMS and collaboration with KCC in summer 2014 to set up the techniques for the measurement of seawater REE. CJ and SG received funding from the European Union's Horizon 2020 research and innovation programme under grant agreement No 678760 (ATLAS). This output reflects only the authors' views and the European Union cannot be held responsible for any use that may be made of the information contained therein.
Conflict of Interest Statement
The authors declare that the research was conducted in the absence of any commercial or financial relationships that could be construed as a potential conflict of interest.
The reviewer MG and handling Editor declared their shared affiliation.
Acknowledgments
We thank Dr. Tina van de Flierdt, Imperial College London, for providing the GEOTRACES reference seawater BATS 2,000 m for use in this study, and Catherine Jeandel for her editorial handling of the manuscript. We also thank the reviewers for their helpful and insightful comments. Notably we appreciate the assiduity of Reviewer 1 whose comments and observations contributed to greatly clarifying and improving the manuscript.
Supplementary Material
The Supplementary Material for this article can be found online at: https://www.frontiersin.org/articles/10.3389/fmars.2018.00147/full#supplementary-material
References
Abbott, A. N., Haley, B. A., and McManus, J. (2015a). Bottoms up: sedimentary control of the deep North Pacific Ocean's εNd signature. Geology 43:1035. doi: 10.1130/G37114.1
Abbott, A. N., Haley, B. A., McManus, J., and Reimers, C. E. (2015b). The sedimentary flux of dissolved rare earth elements to the ocean. Geochim. Cosmochim. Acta 154, 186–200. doi: 10.1016/j.gca.2015.01.010
Akagi, T. (2013). Rare earth element (REE)-silicic acid complexes in seawater to explain the incorporation of REEs in opal and the “leftover” REEs in surface water: new interpretation of dissolved REE distribution profiles. Geochim. Cosmochim. Acta 113, 174–192. doi: 10.1016/j.gca.2013.03.014
Alibo, D. S., and Nozaki, Y. (1999). Rare earth elements in seawater: particle association, shale-normalization, and Ce oxidation. Geochim. Cosmochim. Acta 63, 363–372. doi: 10.1016/s0016-7037(98)00279-8
Arsouze, T., Dutay, J. C., Lacan, F., and Jeandel, C. (2009). Reconstructing the Nd oceanic cycle using a coupled dynamical – biogeochemical model. Biogeosciences 6, 2829–2846. doi: 10.5194/bg-6-2829-2009
Bayon, G., German, C. R., Burton, K. W., Nesbitt, R. W., and Rogers, N. (2004). Sedimentary Fe-Mn oxyhydroxides as paleoceanographic archives and the role of aeolian flux in regulating oceanic dissolved REE. Earth Planet. Sci. Lett. 224, 477–492. doi: 10.1016/j.epsl.2004.05.033
Bertram, C. J., and Elderfield, H. (1993). The geochemical balance of the rare-earth elements and neodymium isotopes in the oceans. Geochim. Cosmochim. Acta 57, 1957–1986. doi: 10.1016/0016-7037(93)90087-d
Buck, C. S., and Paytan, A. (2012). Evaluation of commonly used filter substrates for the measurement of aerosol trace element solubility. Limnol. Oceanogr. Methods 10, 790–806. doi: 10.4319/lom.2012.10.790
Byrne, R. H., and Kim, K. H. (1990). Rare-earth element scavenging in seawater. Geochim. Cosmochim. Acta 54, 2645–2656. doi: 10.1016/0016-7037(90)90002-3
Cantrell, K. J., and Byrne, R. H. (1987). Rare-earth element complexation by carbonate and oxalate ions. Geochim. Cosmochim. Acta 51, 597–605. doi: 10.1016/0016-7037(87)90072-x
Christenson, E. A., and Schijf, J. (2011). Stability of YREE complexes with the trihydroxamate siderophore desferrioxamine B at seawater ionic strength. Geochim. Cosmochim. Acta 75, 7047–7062. doi: 10.1016/j.gca.2011.09.022
Couceiro, F., Fones, G. R., Thompson, C. E. L., Statham, P. J., Sivyer, D. B., Amos, C. L., et al. (2013). Impact of resuspension of cohesive sediments at the Oyster Grounds (North Sea) on nutrient exchange across the sediment-water interface. Biogeochemistry 113, 37–52. doi: 10.1007/s10533-012-9710-7
Cutter, G., Andersson, P., Codispoti, L. A., Croot, P., Francois, R., and van der Loeff, M. (2014). “Sampling and Sample-handling Protocols for GEOTRACES Cruises (Version 2.0).” 2015. Available online at: http://www.geotraces.org/images/stories/documents/intercalibration/Cookbook.pdf
De Baar, H. J. W., Bacon, M. P., Brewer, P. G., and Bruland, K. W. (1985). Rare-earth elements in the Pacific and Atlantic Oceans. Geochim. Cosmochim. Acta 49, 1943–1959. doi: 10.1016/0016-7037(85)90089-4
Du, J., Haley, B. A., and Mix, A. C. (2016). Neodymium isotopes in authigenic phases, bottom waters and detrital sediments in the Gulf of Alaska and their implications for paleo-circulation reconstruction. Geochim. Cosmochim. Acta 193, 14–35. doi: 10.1016/j.gca.2016.08.005
Ducklow, H. W., Kirchman, D. L., Quinby, H. L., Carlson, C. A., and Dam, H. G. (1993). Stocks and dynamics of bacterioplankton carbon during the spring bloom in the eastern North Atlantic Ocean. Deep Sea Res. II Top. Stud. Oceanogr. 40, 245–263. doi: 10.1016/0967-0645(93)90016-G
Elderfield, H. (1988). The oceanic chemistry of the rare-earth elements. Philos. Trans. R. Soc. Math. Phys. Eng. Sci. 325, 105–126. doi: 10.1098/rsta.1988.0046
Elderfield, H., and Greaves, M. J. (1982). The rare-earth elements in sea-water. Nature 296, 214–219. doi: 10.1038/296214a0
Elderfield, H., and Sholkovitz, E. R. (1987). Rare-earth elements in the pore waters of reducing nearshore sediments. Earth Planet. Sci. Lett. 82, 280–288. doi: 10.1016/0012-821X(87)90202-0
Filippova, A., Frank, M., Kienast, M., Rickli, J., Hathorne, E., Yashayaev, I. M., et al. (2017). Water mass circulation and weathering inputs in the Labrador Sea based on coupled Hf–Nd isotope compositions and rare earth element distributions. Geochim. Cosmochim. Acta 199, 164–184. doi: 10.1016/j.gca.2016.11.024.
Fogelqvist, E., Blindheim, J., Tanhua, T., Osterhus, S., Buch, E., and Rey, F. (2003). Greenland-Scotland overflow studied by hydro-chemical multivariate analysis. Deep-Sea Res. I Oceanogr. Res. Papers 50, 73–102. doi: 10.1016/s0967-0637(02)00131-0
Freslon, N., Bayon, G., Toucanne, S., Bermell, S., Bollinger, C., Cheron, S., et al. (2014). Rare earth elements and neodymium isotopes in sedimentary organic matter. Geochim. Cosmochim. Acta 140, 177–198. doi: 10.1016/j.gca.2014.05.016
Garcia-Solsona, E., Jeandel, C., Labatut, M., Lacan, F., Vance, D., Chavagnac, V., et al. (2014). Rare earth elements and Nd isotopes tracing water mass mixing and particle-seawater interactions in the SE Atlantic. Geochim. Cosmochim. Acta 125, 351–372. doi: 10.1016/j.gca.2013.10.009
German, C. R., Klinkhammer, G. P., Edmond, J. M., Mitra, A., and Elderfield, H. (1990). Hydrothermal scavenging of rare-earth elements in the ocean. Nature 345, 516–518. doi: 10.1038/345516a0
Goldstein, S. L., and Hemming, S. (2003). Long-lived isotopic tracers in oceanography. Treatise Geochem. 6, 453–489. doi: 10.1016/B0-08-043751-6/06179-X
Goldstein, S. J., and Jacobsen, S. B. (1988). REE in the great-whale river estuary, Northwest Quebec. Earth Planet. Sci. Lett. 88, 241–252. doi: 10.1016/0012-821x(88)90081-7
Grasse, P., Bosse, L., Hathorne, E. C., Böning, P., Pahnke, K., and Frank, M. (2017). Short-term variability of dissolved rare earth elements and neodymium isotopes in the entire water column of the Panama Basin. Earth Planet. Sci. Lett. 475(Suppl. C), 242–253. doi: 10.1016/j.epsl.2017.07.022
Grenier, M., Garcia-Solsona, E., Lemaitre, N., Trull, T. W., Bouvier, V., and Jeandel, C. (2018). Differentiating lithogenic supplies, water mass transport and biological processes on and off the Kerguelen Plateau using rare earth element concentrations and neodymium isotopic compositions. Front. Mar. Sci. 5.
Grenier, M., Jeandel, C., and Cravatte, S. (2014). From the subtropics to the equator in the Southwest Pacific: continental material fluxes quantified using neodymium data along modeled thermocline water pathways. J. Geophys. Res. Oceans 119, 3948–3966. doi: 10.1002/2013jc009670
Grenier, M., Jeandel, C., Lacan, F., Vance, D., Venchiarutti, C., Cros, A., et al. (2013). From the subtropics to the central equatorial Pacific Ocean: neodymium isotopic composition and rare earth element concentration variations. J. Geophys. Res. Oceans 118, 592–618. doi: 10.1029/2012jc008239
Gutjahr, M., Frank, M., Stirling, C. H., Klemm, V., van de Flierdt, T., and Halliday, A. N. (2007). Reliable extraction of a deepwater trace metal isotope signal from Fe–Mn oxyhydroxide coatings of marine sediments. Chem. Geol. 242, 351–370. doi: 10.1016/j.chemgeo.2007.03.021
Haley, B. A., Frank, M., Hathorne, E., and Pisias, N. (2014). Biogeochemical implications from dissolved rare earth element and Nd isotope distributions in the Gulf of Alaska. Geochim. Cosmochim. Acta 126, 455–474. doi: 10.1016/j.gca.2013.11.012
Haley, B. A., Klinkhammer, G. P., and McManus, J. (2004). Rare earth elements in pore waters of marine sediments. Geochim. Cosmochim. Acta 68, 1265–1279. doi: 10.1016/j.gca.2003.09.012
Haley, B., Du, J., Abbott, A. N., and McManus, J. (2017). The impact of benthic processes on rare earth element and neodymium isotope distributions in the oceans. Front. Marine Sci. 4:426. doi: 10.3389/fmars.2017.00426
Hathorne, E. C., Haley, B., Stichel, T., Grasse, P., Zieringer, M., and Frank, M. (2012). Online preconcentration ICP-MS analysis of rare earth elements in seawater. Geochem. Geophy. Geosyst. 13:Q01020. doi: 10.1029/2011gc003907
Hathorne, E. C., Stichel, T., Brück, B., and Frank, M. (2015). Rare earth element distribution in the Atlantic sector of the Southern Ocean: the balance between particle scavenging and vertical supply. Mar. Chem. 177, 157–171. doi: 10.1016/j.marchem.2015.03.011
Hátún, H., Payne, M. R., and Jacobsen, J. A. (2009). The North Atlantic subpolar gyre regulates the spawning distribution of blue whiting (Micromesistius poutassou). Can. J. fish. Aquat. Sci. 66, 759–770. doi: 10.1139/F09-037
Henderson, G. M., Lindsay, F. N., and Slowey, N. C. (1999). Variation in bioturbation with water depth on marine slopes: a study on the Little Bahamas Bank. Mar. Geol. 160, 105–118. doi: 10.1016/S0025-3227(99)00018-3
Holliday, N. P., and Cunningham, S. A. (2013). The extended ellett line: discoveries from 65 years of marine observations west of the UK. Oceanography 26, 156–163. doi: 10.5670/oceanog.2013.17
Holliday, N. P., Cunningham, S. A., Johnson, C., Gary, S. F., Griffiths, C., Sherwin, T., et al. (2015). Multidecadal variability of potential temperature, salinity, and transport in the eastern subpolar North Atlantic. J. Geophys. Res. Oceans 120, 5945–5967. doi: 10.1002/2015JC010762
Holliday, N. P., Pollard, R. T., Read, J. F., and Leach, H. (2000). Water mass properties and fluxes in the Rockall Trough, 1975-1998. Deep-Sea Res. I Oceanogr. Res. Papers 47, 1303–1332. doi: 10.1016/S0967-0637(99)00109-0
Honjo, S., and Manganini, S. J. (1993). Annual biogenic particle fluxes to the interior of the North Atlantic Ocean; studied at 34°N 21°W and 48°N 21°W. Deep Sea Res. II Top. Stud. Oceanogr. 40, 587–607. doi: 10.1016/0967-0645(93)90034-K
Hughes, D. J., and Gage, J. D. (2004). Benthic metazoan biomass, community structure and bioturbation at three contrasting deep-water sites on the northwest European continental margin. Prog. Oceanogr. 63, 29–55. doi: 10.1016/j.pocean.2004.09.002
Jeandel, C. (2016). Overview of the mechanisms that could explain the ‘Boundary Exchange’ at the land–ocean contact. Philos. Trans. R. Soc. A Math. Phys. Eng. Sci. 374:20150287. doi: 10.1098/rsta.2015.0287
Jeandel, C., Arsouze, T., Lacan, F., Techine, P., and Dutay, J. C. (2007). Isotopic Nd compositions and concentrations of the lithogenic inputs into the ocean: a compilation, with an emphasis on the margins. Chem. Geol. 239, 156–164. doi: 10.1016/j.chemgeo.2006.11.013
Jeandel, C., and Oelkers, E. H. (2015). The influence of terrigenous particulate material dissolution on ocean chemistry and global element cycles. Chem. Geol. 395, 50–66. doi: 10.1016/j.chemgeo.2014.12.001
Jeandel, C., Peucker-Ehrenbrink, B., Jones, M. T., Pearce, C. R., Oelkers, E. H., Arsouze, T., et al. (2011). Ocean margins: the missing term in oceanic element budgets? Eos Trans. Am. Geophys. Union 92, 217–218. doi: 10.1029/2011EO260001
Jeandel, C., Thouron, D., and Fieux, M. (1998). Concentrations and isotopic compositions of neodymium in the eastern Indian Ocean and Indonesian straits. Geochim. Cosmochim. Acta 62, 2597–2607. doi: 10.1016/s0016-7037(98)00169-0
Johnson, C., Inall, M., and Haekkinen, S. (2013). Declining nutrient concentrations in the northeast Atlantic as a result of a weakening Subpolar Gyre. Deep Sea Res. I Oceanogr. Res. Papers 82, 95–107. doi: 10.1016/j.dsr.2013.08.007
Jones, S. M., Cottier, F. R., Inall, M., and Griffiths, C. (2018). Decadal variability on the Northwest European continental shelf. Prog. Oceanogr. 161, 131–151. doi: 10.1016/j.pocean.2018.01.012
Kanzow, T., and Zenk, W. (2014). Structure and transport of the Iceland Scotland Overflow plume along the Reykjanes Ridge in the Iceland Basin. Deep-Sea Res. I Oceanogr. Res. Papers 86, 82–93. doi: 10.1016/j.dsr.2013.11.003
Lacan, F., and Jeandel, C. (2004a). Denmark Strait water circulation traced by heterogeneity in neodymium isotopic compositions. Deep Sea Res. I Oceanogr. Res. Papers 51, 71–82. doi: 10.1016/j.dsr.2003.09.006
Lacan, F., and Jeandel, C. (2004b). Neodymium isotopic composition and rare earth element concentrations in the deep and intermediate Nordic Seas: constraints on the Iceland Scotland Overflow Water signature. Geochem. Geophys. Geosyst. 5:Q11006. doi: 10.1029/2004GC000742
Lacan, F., and Jeandel, C. (2005a). Acquisition of the neodymium isotopic composition of the North Atlantic Deep Water. Geochemistry Geophysics Geosystems 6:Q12008. doi: 10.1029/2005GC000956
Lacan, F., and Jeandel, C. (2005b). Neodymium isotopes as a new tool for quantifying exchange fluxes at the continent-ocean interface. Earth Planet. Sci. Lett. 232, 245–257. doi: 10.1016/j.epsl.2005.01.004
Lambelet, M., van de Flierdt, T., Crocket, K., Rehkämper, M., Kreissig, K., Coles, B., Steinfeldt, R., et al. (2016). Neodymium isotopic composition and concentration in the western North Atlantic Ocean: results from the GEOTRACES GA02 section. Geochim. Cosmochim. Acta 177, 1–29. doi: 10.1016/j.gca.2015.12.019
Lim, S., and Franklin, S. J. (2004). Lanthanide-binding peptides and the enzymes that Might Have Been. Cell. Mol. Life Sci. 61, 2184–2188. doi: 10.1007/s00018-004-4156-2
Lochte, K., Ducklow, H. W., Fasham, M. J. R., and Stienen, C. (1993). Plankton succession and carbon cycling at 47°N 20°W during the JGOFS North Atlantic Bloom Experiment. Deep Sea Res. II Top. Stud. Oceanogr. 40, 91–114. doi: 10.1016/0967-0645(93)90008-B
Lonsdale, P., and Hollister, C. D. (1979). A near-bottom traverse of Rockall Trough: hydrographic and geologic inferences. Oceanol. Acta 2, 91–105.
Martinez-Gomez, N. C., Vu, H. N., and Skovran, E. (2016). Lanthanide chemistry: from coordination in chemical complexes shaping our technology to coordination in enzymes shaping bacterial metabolism. Inorg. Chem. 55, 10083–10089. doi: 10.1021/acs.inorgchem.6b00919
McGrath, T., Kivimae, C., McGovern, E., Cave, R. R., and Joyce, E. (2013). Winter measurements of oceanic biogeochemical parameters in the Rockall Trough (2009-2012). Earth Syst. Sci. Data 5, 375–383. doi: 10.5194/essd-5-375-2013
McGrath, T., Nolan, G., and McGovern, E. (2012). Chemical characteristics of water masses in the Rockall Trough. Deep Sea Res. I Oceanogr. Res. Papers 61, 57–73. doi: 10.1016/j.dsr.2011.11.007
Meincke, J. (1986). Convection in the oceanic waters west of Britain. Proc. R. Soc. Edinb. Sec. B Biol. Sci. 88, 127–139. doi: 10.1017/S0269727000004504
Moffett, J. W. (1990). Microbially mediated cerium oxidation in sea-water. Nature 345, 421–423. doi: 10.1038/345421a0
Molina-Kescher, M., Frank, M., and Hathorne, E. (2014). South Pacific dissolved Nd isotope compositions and rare earth element distributions: water mass mixing versus biogeochemical cycling. Geochim. Cosmochim. Acta 127, 171–189. doi: 10.1016/j.gca.2013.11.038
Molina-Kescher, M., Hathorne, E. C., Osborne, A., Behrens, M. K., Kölling, M., Pahnke, K., et al. (2018). The influence of basaltic islands on the oceanic REE distribution: a case study from the Tropical South Pacific. Front. Mar. Sci. 5:50. doi: 10.3389/fmars.2018.00050
New, A. L., and Smythe-Wright, D. (2001). Aspects of the circulation in the Rockall Trough. Cont. Shelf Res. 21, 777–810. doi: 10.1016/S0278-4343(00)00113-8
Ngwenya, B. T., Magennis, M., Olive, V., Mosselmans, J. F. W., and Ellam, R. M. (2010). Discrete site surface complexation constants for lanthanide adsorption to bacteria as determined by experiments and linear free energy relationships. Environ. Sci. Technol. 44, 650–656. doi: 10.1021/es9014234
Ngwenya, B. T., Mosselmans, J. F. W., Magennis, M., Atkinson, K. D., Tourney, J., Ellam, R. M., et al. (2009). Macroscopic and spectroscopic analysis of lanthanide adsorption to bacterial cells. Geochim. Cosmochim. Acta 73, 3134–3147. doi: 10.1016/j.gca.2009.03.018
Nielsdottir, M. C., Moore, C. M., Sanders, R., Hinz, D. J., and Achterberg, E. P. (2009). Iron limitation of the postbloom phytoplankton communities in the Iceland Basin. Global Biogeochem. Cycles 23:GB3001. doi: 10.1029/2008gb003410
Nozaki, Y., and Yang, H.-S. (1987). Th and Pa isotopes in the waters of the western margin of the pacific near Japan: evidence for release of228Ra and227Ac from slope sediments. J. Oceanogr. Soc. Japan 43, 217–227. doi: 10.1007/bf02109817
Pearce, C. R., Jones, M. T., Oelkers, E. H., Pradoux, C., and Jeandel, C. (2013). The effect of particulate dissolution on the neodymium (Nd) isotope and Rare Earth Element (REE) composition of seawater. Earth Planet. Sci. Lett. 369–370, 138–147. doi: 10.1016/j.epsl.2013.03.023
Pfannkuche, O. (1993). Benthic response to the sedimentation of particulate organic matter at the BIOTRANS station, 47°N, 20°W. Deep Sea Res. II Top. Stud. Oceanogr. 40, 135–149. doi: 10.1016/0967-0645(93)90010-K
Pol, A., Barends, T. R., Dietl, A., Khadem, A. F., Eygensteyn, J., Jetten, M. S., et al. (2014). Rare earth metals are essential for methanotrophic life in volcanic mudpots. Environ. Microbiol. 16, 255–265. doi: 10.1111/1462-2920.12249
Rice, A. L., Thurston, M. H., and Bett, B. J. (1994). The IOSDL Deep Seas Program - Introduction and photographic evidence for the presence and absence fo a seasonal input of phytodetritus at contrasting abyssal sites in the Northeastern Atlantic. Deep-Sea Res. I Oceanogr. Res. Papers 41, 1305–1320. doi: 10.1016/0967-0637(94)90099-x
Rousseau, T. C., Sonke, J. E., Chmeleff, J., van Beek, P., Souhaut, M., Jeandel, C., et al. (2015). Rapid neodymium release to marine waters from lithogenic sediments in the Amazon estuary. Nat. Commun. 6:7592. doi: 10.1038/ncomms8592
Schijf, J., Christenson, E. A., and Byrne, R. H. (2015). YREE scavenging in seawater: a new look at an old model. Mar. Chem. 177(Pt 3), 460–471. doi: 10.1016/j.marchem.2015.06.010
Shiller, A. M., Chan, E. W., Joung, D. J., Redmond, M. C., and Kessler, J. D. (2017). Light rare earth element depletion during Deepwater Horizon blowout methanotrophy. Sci. Rep. 7:10389. doi: 10.1038/s41598-017-11060-z
Sholkovitz, E. R. (1993). The geochemistry of rare-earth elements in the Amazon River Estuary. Geochim. Cosmochim. Acta 57, 2181–2190. doi: 10.1016/0016-7037(93)90559-f
Sholkovitz, E. R., Landing, W. M., and Lewis, B. L. (1994). Ocean particle chemistry - the fractionation of rare-earth elements between suspended particles and seawater. Geochim. Cosmochim. Acta 58, 1567–1579. doi: 10.1016/0016-7037(94)90559-2
Sholkovitz, E., and Shen, G. T. (1995). The incorporation of rare earth elements in modern coral. Geochim. Cosmochim. Acta 59, 2749–2756. doi: 10.1016/0016-7037(95)00170-5
Siddall, M., Khatiwala, S., van de Flierdt, T., Jones, K., Goldstein, S. L., Anderson, R. F., et al. (2008). Towards explaining the Nd paradox using reversible scavenging in an ocean general circulation model. Earth Planet. Sci. Lett. 274, 448–461. doi: 10.1016/j.epsl.2008.07.044
Stichel, T., Hartman, A. E., Duggan, B., Goldstein, S. L., Scher, H., and Pahnke, K. (2015). Separating biogeochemical cycling of neodymium from water mass mixing in the Eastern North Atlantic. Earth Planet. Sci. Lett. 412, 245–260. doi: 10.1016/j.epsl.2014.12.008
Tachikawa, K., Jeandel, C., and Roy-Barman, M. (1999). A new approach to the Nd residence time in the ocean: the role of atmospheric inputs. Earth Planet. Sci. Lett. 170, 433–446. doi: 10.1016/S0012-821X(99)00127-2
Takahashi, Y., Aondo, K., Miyaji, A., Watanabe, Y., Fan, Q., Honma, T., et al. (2014). Recovery and separation of rare earth elements using salmon milt. PLoS ONE 9:e114848. doi: 10.1371/journal.pone.0114858
Takahashi, Y., Chatellier, X., Hattori, K. H., Kato, K., and Fortin, D. (2005). Adsorption of rare earth elements onto bacterial cell walls and its implication for REE sorption onto natural microbial mats. Chem. Geol. 219, 53–67. doi: 10.1016/j.chemgeo.2005.02.009
Takahashi, Y., Hirata, T., Shimizu, H., Ozaki, T., and Fortin, D. (2007). A rare earth element signature of bacteria in natural waters? Chem. Geol. 244, 569–583. doi: 10.1016/j.chemgeo.2007.07.005
Takahashi, Y., Yamamoto, M., Yamamoto, Y., and Tanaka, K. (2010). EXAFS study on the cause of enrichment of heavy REEs on bacterial cell surfaces. Geochim. Cosmochim. Acta 74, 5443–5462. doi: 10.1016/j.gca.2010.07.001
Taylor, S. R., and McLennan, S. M. (1985). The Continental Crust: Its Composition and Evolution. Oxford: Blackwell Scientific Publishers.
Tepe, N., and Bau, M. (2014). Importance of nanoparticles and colloids from volcanic ash for riverine transport of trace elements to the ocean: evidence from glacial-fed rivers after the 2010 eruption of Eyjafjallajokull Volcano, Iceland. Sci. Total Environ. 488, 243–251. doi: 10.1016/j.scitotenv2014.04.083
van de Flierdt, T., Pahnke, K., Amakawa, H., Andersson, P., Basak, C., Coles, B., et al. (2012). GEOTRACES intercalibration of neodymium isotopes and rare earth element concentrations in seawater and suspended particles. Part 1: reproducibility of results for the international intercomparison. Limnol. Oceanogr. Methods 10, 234–251. doi: 10.4319/lom.2012.10.234
Wang, B.-S., Lee, C.-P., and Ho, T.-Y. (2014). Trace metal determination in natural waters by automated solid phase extraction system and ICP-MS: the influence of low level Mg and Ca. Talanta 128, 337–344. doi: 10.1016/j.talanta.2014.04.077
Wilson, D. J., Crocket, K. C., van de Flierdt, T., Robinson, L. F., and Adkins, J. F. (2014). Dynamic intermediate ocean circulation in the North Atlantic during Heinrich Stadial 1: a radiocarbon and neodymium isotope perspective. Paleoceanography 29, 1072–1093. doi: 10.1002/2014PA002674
Zhang, J., and Nozaki, Y. (1996). Rare earth elements and yttrium in seawater: ICP-MS determinations in the East Caroline, Coral Sea, and South Fiji basins of the western South Pacific Ocean. Geochim. Cosmochim. Acta 60, 4631–4644. doi: 10.1016/S0016-7037(96)00276-1
Zhang, J., and Nozaki, Y. (1998). Behavior of rare earth elements in seawater at the ocean margin: a study along the slopes of the Sagami and Nankai troughs near Japan. Geochim. Cosmochim. Acta 62, 1307–1317. doi: 10.1016/s0016-7037(98)00073-8
Zhang, Y., Lacan, F., and Jeandel, C. (2008). Dissolved rare earth elements tracing lithogenic inputs over the Kerguelen Plateau (Southern Ocean). Deep Sea Res. II Top. Stud. Oceanogr. 55, 638–652. doi: 10.1016/j.dsr2.2007.12.029
Keywords: rare earths, biogeochemical cycle, ocean circulation, Northeast Atlantic, water mass tracer, chemical tracer, Extended Ellett Line, Iceland-Scotland Overflow Water
Citation: Crocket KC, Hill E, Abell RE, Johnson C, Gary SF, Brand T and Hathorne EC (2018) Rare Earth Element Distribution in the NE Atlantic: Evidence for Benthic Sources, Longevity of the Seawater Signal, and Biogeochemical Cycling. Front. Mar. Sci. 5:147. doi: 10.3389/fmars.2018.00147
Received: 23 November 2017; Accepted: 10 April 2018;
Published: 30 April 2018.
Edited by:
Catherine Jeandel, UMR5566 Laboratoire d'Études en Géophysique et Océanographie Spatiales (LEGOS), FranceReviewed by:
Melanie Grenier, UMR5566 Laboratoire d'Études en Géophysique et Océanographie Spatiales (LEGOS), FranceAlan M Shiller, University of Southern Mississippi, United States
Copyright © 2018 Crocket, Hill, Abell, Johnson, Gary, Brand and Hathorne. This is an open-access article distributed under the terms of the Creative Commons Attribution License (CC BY). The use, distribution or reproduction in other forums is permitted, provided the original author(s) and the copyright owner are credited and that the original publication in this journal is cited, in accordance with accepted academic practice. No use, distribution or reproduction is permitted which does not comply with these terms.
*Correspondence: Kirsty C. Crocket, Y3JvY2traUBnbWFpbC5jb20=
†Present Address: Emily Hill, Department of Biology, Norwegian University of Science and Technology, Trondheim, Norway