 Christina A. Fox
 Hussain A. Abdulla
 David J. Burdige
 James P. Lewicki
 Tomoko Komada
- 1Estuary & Ocean Science Center, San Francisco State University, Tiburon, CA, United States
- 2Department of Physical and Environmental Sciences, Texas A&M University-Corpus Christi, Corpus Christi, TX, United States
- 3Department of Ocean, Earth & Atmospheric Sciences, Old Dominion University, Norfolk, VA, United States
- 4Materials Science Division, Lawrence Livermore National Laboratory, Livermore, CA, United States
Marine sediments are globally significant sources of dissolved organic matter (DOM) to the oceans, but the biogeochemical role of pore-water DOM in the benthic and marine carbon cycles remains unclear due to a lack of understanding about the molecular composition of DOM. To help fill this knowledge gap, we used 1H nuclear magnetic resonance (NMR) spectroscopy to examine depth variability in the composition of pore-water DOM in anoxic sediments of Santa Barbara Basin, California Borderland. Proton detected spectra were acquired on whole samples without pre-concentration to avoid preclusion of any DOM components from the analytical window. Broad unresolved resonance (operationally assigned to carboxyl-rich alicyclic molecules, or CRAM) dominated all spectra. Most of the relatively well-resolved peaks (attributed to biomolecules or their derivatives) appeared at chemical shifts similar to those previously reported for marine DOM in the literature, but at different relative intensities. DOM composition changed significantly within the top 50 cm of the sediment column, where the relative intensity of CRAM increased, and the relative intensity of resolved resonances decreased. The composition of CRAM itself also changed throughout the entire length of the 4.5-m profile, as CRAM protons became increasingly aliphatic at the expense of functionalized protons. Given that pore-water DOM is generated from sedimentary organic matter that includes pre-aged and degraded material, and that DOM is theoretically subject to microbial reworking in the pore waters for centuries to millennia, these data suggest that marine sediments may be sources of CRAM that are compositionally unique from CRAM generated in the upper ocean.
Introduction
Dissolved organic matter is produced as an intermediate in the mineralization of sedimentary organic matter (Burdige and Komada, 2015). This in turn supports a net efflux of dissolved organic carbon (DOC) out of the sediments to the oceans that rivals global riverine DOC export from land (Burdige et al., 1999). Previous studies that examined the composition and reactivity of pore-water DOM have highlighted the heterogeneity of this pool and the complexity of its dynamics within the sediment column (e.g., Henrichs and Farrington, 1979; Sansone and Martens, 1982; Alperin et al., 1994; Burdige and Zheng, 1998; Burdige, 2001; Hee et al., 2001; Komada et al., 2013; Burdige et al., 2016). While these studies have contributed significantly to our understanding of DOM cycling in sediments (see review by Burdige and Komada, 2015), the sheer molecular complexity of natural organic matter (Hedges et al., 2000; Hertkorn et al., 2007; Dittmar, 2015) poses a challenge toward addressing some basic questions, such as the role pore-water DOM plays in the degradation and preservation of sedimentary organic matter, and the biogeochemical significance of benthic DOM fluxes in the marine DOM cycle.
To help address these knowledge gaps, we used 1H NMR spectroscopy to examine the chemical composition of pore-water DOM in anoxic sediments of Santa Barbara Basin (SBB), California Borderland. While NMR has been widely used to investigate the composition and dynamics of seawater DOM (Minor et al., 2014; Repeta, 2015 and references within), application to marine pore-water DOM has been limited in number and scope. To the best of the authors' knowledge, only two studies in the literature report NMR spectra of pore-water DOM from marine sediments (Orem and Hatcher, 1987; Repeta et al., 2002). Orem and Hatcher (1987) used solid-state 13C NMR to examine the composition of high-molecular-weight (HMW) pore-water DOM collected from two nearshore marine and estuarine locations, along with samples from a number of freshwater peats, and a coastal saline lake. Repeta et al. (2002) used solution-state 1H NMR to examine the chemical composition HMW pore-water DOM collected from two nearshore marine locations, and a continental shelf site. The primary focus of these pioneering studies was to compare and contrast NMR spectra across contrasting depositional environments (Orem and Hatcher, 1987), or between HMW-DOM in pore waters and the water column (Repeta et al., 2002); no effort was made to examine the cycling of pore-water DOM in the sediments. Orem et al. (1986) studied solid-state 13C NMR spectra of pore-water DOM in Mangrove Lake (a coastal saline lake) as a function of sediment depth, but the depth resolution was extremely low (three samples collected from intervals as thick as ~1.9 m over a total depth range of 5.5 m), and these authors did not detect any depth variability in their spectra.
To explore the linkages between pore-water DOM transformations and sediment organic matter degradation, we acquired 1H NMR spectra of pore-water DOM as function of depth in the top 4.5 m of the sediment column in the center of SBB. With the exception of a handful of cases that applied NMR spectroscopy to whole marine DOM samples (Lam and Simpson, 2008; Zheng and Price, 2012), NMR has primarily been used to examine marine DOM isolated by ultrafiltration (HMW-DOM), by solid-phase extraction (SPE-DOM), or by coupled reverse osmosis/electrodialysis (RO/ED-DOM). Neither ultrafiltration nor SPE recover 100% of the DOM pool, nor are they free of selective bias (Mopper et al., 2007; Minor et al., 2014; Repeta, 2015). HMW-DOM is rich in a class of semi-labile polysaccharides [acyl heteropolysaccharides (APS) or heteropolysaccharides (HPS); (Aluwihare et al., 2005; Hertkorn et al., 2006; Repeta and Aluwihare, 2006)], and overall HMW-DOM represents the relatively reactive fraction of the whole DOM pool in seawater (Benner and Amon, 2015; Walker et al., 2016a,b). This characterization also appears to hold for the HMW-DOM extracted from sediment pore waters (Repeta et al., 2002). SPE-DOM, when collected using PPL (a styrene divinylbenzene sorbent), concentrates DOM primarily based upon polarity (Dittmar et al., 2008), and is relatively rich in low-molecular-weight compounds and in carboxyl rich alicyclic molecules (CRAM) that are thought to represent a refractory component of marine DOM (Hertkorn et al., 2006; Dittmar and Stubbins, 2014; Repeta, 2015). Differences in the molecular composition of HMW-DOM and SPE-DOM are clearly reflected in 1H NMR spectra of these components extracted from the surface ocean, where HMW-DOM shows clear enrichment in APS/HPS relative to SPE-DOM (Hertkorn et al., 2006, 2013). Differences between HMW- and SPE-DOM are less obvious for deep-sea DOM (Hertkorn et al., 2006, 2013), consistent with the semi-labile nature of APS/HPS. Relative to ultrafiltration and SPE, RO/ED has been reported to recover a larger and more representative fraction of total DOM (Vetter et al., 2007; Gurtler et al., 2008; Koprivnjak et al., 2009; Green et al., 2014; Helms et al., 2015), but the large sample volume requirement makes RO/ED unsuitable for the study of DOM in pore waters. A mini-electrodialysis system designed to handle small-volume samples has been developed, but appears to cause considerable DOC contamination (Chen et al., 2011).
To better understand the chemical composition of pore-water DOM, we applied 1H NMR to whole pore-water DOM without any isolation or pre-concentration steps. High ionic strengths reduce the signal-to-noise-ratio in NMR, but this was overcome by DOC concentrations in sediment pore waters that are typically much higher than in seawater. By circumventing the physical and chemical separation of DOM from the sample matrix, we aimed to capture the depth dependent variability of the chemical composition of pore-water DOM without precluding any of the DOM components from the analytical window. However, it should be noted that our samples contain dissolved metals (including paramagnetic species such as iron) which can affect NMR relaxation, and hence peak width (Satterlee, 1990). The concentration and composition of such metals may also have varied with sediment depth (e.g., Shaw et al., 1990; Severmann et al., 2006). Furthermore, suppression of the water signal can attenuate the resonances in the regions attributed to carbohydrates and olefins (Lam and Simpson, 2008). We therefore used the data primarily to examine relative changes in DOM composition within our dataset, and secondarily to compare to published 1H NMR spectra of HMW-, SPE-, or RO/ED-DOM extracted from seawater.
The main objective of this study was to use 1H NMR to examine the variability in pore water DOM composition as function of depth in SBB sediments. We further used our findings to evaluate the reactivity of pore water DOM at this site.
Materials and Methods
Sampling Site and Sample Collection
Sediment cores were collected from the center of Santa Barbara Basin (SBB) in the California Borderland (34.223°N, 119.983°W) at a water depth of 590 m in August 2012 aboard the R/V Robert Gordon Sproul, and August 2013 aboard the R/V New Horizon. Bottom-water dissolved oxygen concentrations at this site are low (<2 μM), and the fine-grained sediments are anoxic and free of bioturbation (Hülsemann and Emery, 1961; Sholkovitz and Gieskes, 1971; Soutar and Crill, 1977). Details about sediment coring and pore water sampling can be found in Komada et al. (2016). Briefly, cores penetrating as deep as ~450 cm below the sediment-water interface were collected by gravity- and multi-coring, and sectioned within 2–9 h of recovery to collect pore water. Samples for NMR analysis were passed through disposable 0.2-μm nylon filters (Whatman 6870-2502; pre-cleaned with 100 mL of UV-irradiated deionized water), collected into pre-combusted glass ampules, headspace purged with ultra-high purity N2, and then flame sealed and refrigerated until further processing. Pore-water DOC data obtained from these cores (along with other geochemical data such as porosity, sedimentary particulate organic carbon content, and inorganic pore-water solutes) have been presented and discussed in detail elsewhere (Burdige et al., 2016; Komada et al., 2016); the DOC data are reproduced here in Figure 1. A total of 37 samples that spanned the entire length of this DOC profile were analyzed in the present study by 1H NMR (Figure 1).
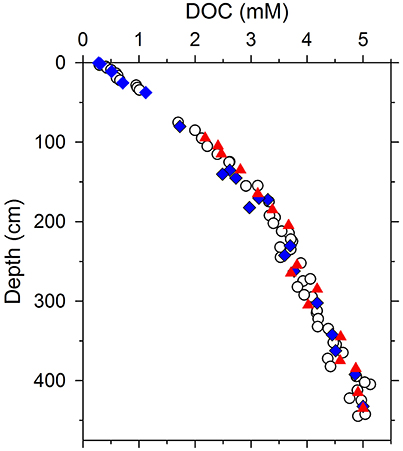
Figure 1. Pore water DOC concentration profile from Santa Barbara Basin sediments showing data from one multicore (0–50 cm; core 43,1) and three gravity cores (>50 cm; G15, BB26, BB35; Burdige et al., 2016; Komada et al., 2016). All of the data shown were obtained by high-temperature combustion (Burdige and Gardner, 1998). Core G15 was collected in 2012; all others were collected in 2013. Circles represent samples analyzed for DOC concentration only. Blue diamonds and red triangles represent samples whose compositions were analyzed by 1H NMR using a 400 MHz and 600 MHz spectrometer, respectively. One additional sample from 110 cm was analyzed using the 400 MHz instrument, but not plotted here, because DOC concentration is not available.
1H NMR Analysis
Proton detected spectra were acquired on two Bruker Avance III spectrometers: one operating at 400 MHz at the College of Sciences Major Instrumentation Cluster, Old Dominion University, and another operating at 600 MHz at Lawrence Livermore National Laboratory, both using Bruker 5 mm BBO broadband—1H/X z-gradient probes, and TopSpin 3.0 software. For analysis on the 400 MHz spectrometer, 0.4-mL pore-water aliquots were added to 0.04 mL D2O and 3 μL tetramethylsilane (TMS) in 5-mm glass NMR tubes (Wilmad Glass Co., NJ), and analyzed within 30 min of preparation. For analysis on the 600 MHz spectrometer, samples were prepared similarly, but placed in high-resolution, 5.0-mm Norell tubes, back-filled with argon gas, flame sealed, and refrigerated at 4°C for up to 1week prior to analysis. Of the 37 samples collected, 21 (from 0.5 to 432 cm) were analyzed on the 400 MHz NMR instrument, and the remaining 16 samples (from 95 to 435 cm) were analyzed on the 600 MHz NMR instrument (Figure 1). Tetramethylsilane was used as an NMR chemical shift reference. 1H NMR spectra were collected with solvent suppression using a modified version of the WATERGATE-W5 suppression sequence described by Lam and Simpson (2008). The total acquisition time was 15 h 2 s, with a 2 s relaxation delay at ~ 11,000 scans and 4 Hz exponential line broadening.
Data Processing
All 1H NMR spectra were first normalized by total area under the spectra, then specific area integrals were taken using two approaches. First, relative abundances of major 1H types were determined by integrating the areas in chemical shift (δH) ranges defined by Hertkorn et al. (2013; Table 1). Second, specific regions of the spectra whose relative intensity varied significantly with depth (p ≤ 0.05) were objectively identified by 2D correlation using sediment depth as the perturbation variable (Abdulla et al., 2010, 2013b). In this 2D correlation approach, the area under the broad unresolved band between 0.91 and 3.15 ppm was operationally assigned to CRAM (Hertkorn et al., 2006), and areas of peaks that appear atop this broad band were determined after subtracting the CRAM signal from the total area. In all integrations, area under any given portion of the spectrum was calculated by trapezoidal approximation with chemical shift increments of 0.0055 ppm. Peaks were deemed absent when they amounted to < 0.2% of the total area.
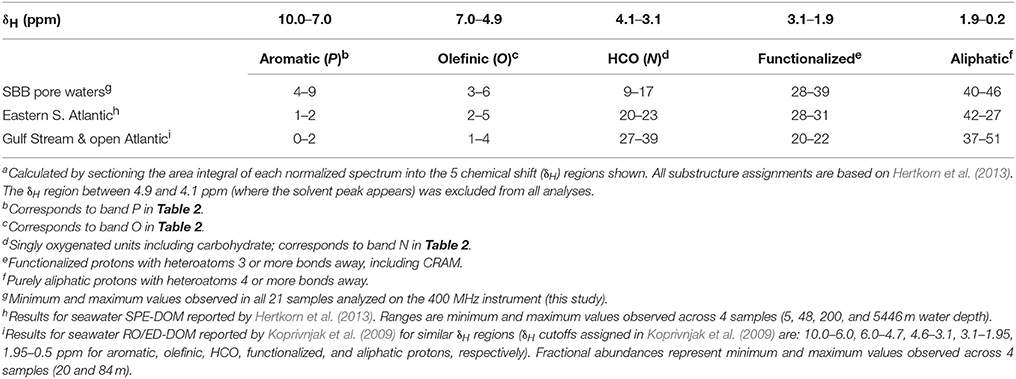
Table 1. Fractional abundances (%) of major 1H typesa.
Protons corresponding to individual peaks identified by 2D correlation were classified according to literature data, and tentatively assigned to major compound classes (Table 2). Abundances of these compound classes were further expressed in DOC units by assigning H/C ratios to each compound class (Table 2, Supplementary Material). Exchangeable protons in imino, amino, carboxyl, and hydroxyl protons are not observed by solvent-suppression 1H NMR due to the fast exchange rate of these protons with deuterium (from D2O).
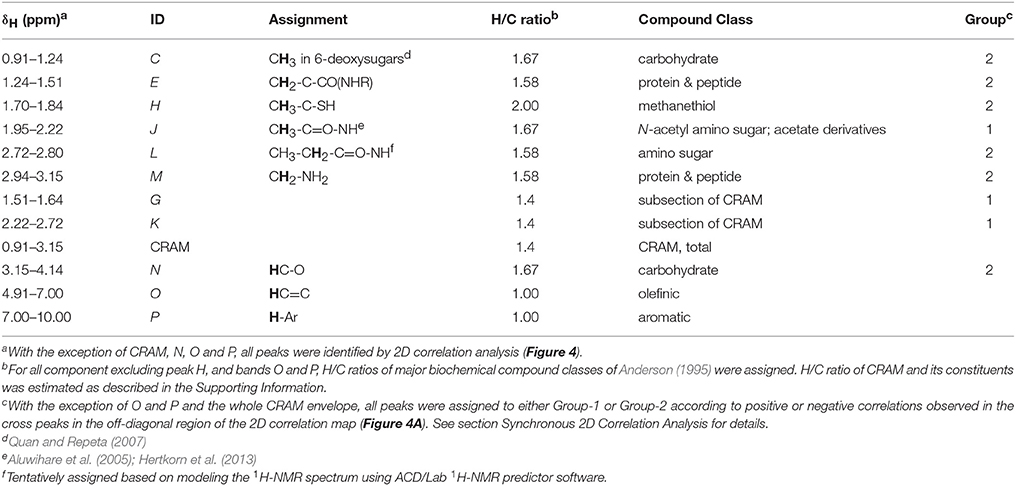
Table 2. 1H NMR peaks identified by 2D correlation analysis.
Results
Comparison of Spectra Obtained at Different Field Strengths
Common resonances were present in the spectra acquired using the 400- and 600-MHz spectrometers, but with two key differences. First, there was a clear resolution advantage in the higher field magnet (Figure 2, Supplementary Figure 1). Second, relative intensities of singly-oxygenated units including carbohydrate (HCO, 3.1–4.1 ppm) and olefinic proton (4.9–7.0 ppm) regions were higher in the spectra obtained on the 600 MHz instrument (Figure 2), possibly due to suppression of the water peak that was broadened from radiation damping. Radiation damping perturbs relaxation times of protons in the solvent (in the this case, water) which are present in extreme excess over protons in the analyte (in this case, DOM; Krishnan and Murali, 2013). Radiation dampening results in spectral artifacts including line broadening and the amplitude of this effect is dependent on field strengths and pulse power (Krishnan and Murali, 2013). Thus, when the broader water peak from the 600 MHz instrument was suppressed, it resulted in intensification of the carbohydrate-like and olefinic regions on either side of the suppressed water peak relative to the signal acquired on the 400 MHz instrument, precluding direct comparisons of data obtained on the two instruments (Figure 2). However, when the spectra are normalized only between δH 0.2–3.1 ppm (aliphatic and functionalized protons only), there is good agreement between the data sets (Supplementary Figure 1). Quantitative analyses were done using only spectra obtained on the 400 MHz instrument, because they covered a greater depth range than those from the 600 MHz instrument (Figure 1). Spectra from the 600 MHz instrument are presented for qualitative purposes only, although the two data sets did display similar depth trends.
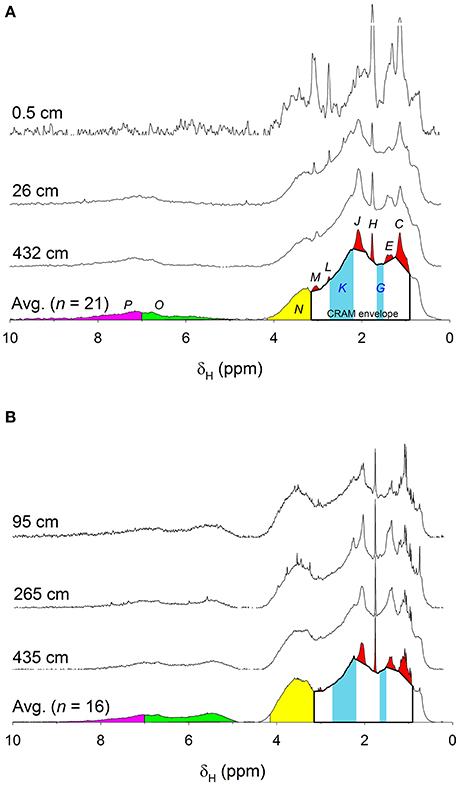
Figure 2. Area-normalized 1H NMR spectra acquired on a spectrometer operating at (A) 400 MHz (n = 21), and (B) 600 MHz (n = 16). Three example spectra (from shallowest, intermediate, and deepest depth intervals) are shown along with the average of all n samples. Labels C-P indicate peak/band assignments (Table 2). Area under the unresolved envelope between δH 0.9–3.2 ppm has been assigned to CRAM. CRAM constituents G and K are shown as solid blue sections. δH 4.1–4.9 ppm (where the water peak appears) was excluded from all analyses.
1H NMR Spectra of Whole Pore-Water DOM
1H NMR spectra of whole pore-water DOM featured general characteristics that are common to spectra reported for SPE-, HMW-, and RO/ED-DOM extracted from seawater (e.g., Hertkorn et al., 2006, 2013; Dittmar et al., 2008; Koprivnjak et al., 2009; Abdulla et al., 2013a; Repeta, 2015). All spectra obtained here showed broad, unresolved resonances attributed to aliphatics (~0–1.9 ppm), functionalized protons including CRAM (~2–3 ppm), singly-oxygenated units including carbohydrate (~3–4 ppm), and to a lesser extent olefinic and aromatic protons (~5–10 ppm; Figure 2). Broadness of these peaks reflects significant signal overlap of many protons of similar resonance frequencies, consistent with a complex, heterogeneous mixture of molecules. Atop the broad envelope were relatively well-resolved peaks (or clusters of peaks) that have been observed in SPE-DOM (e.g., Dittmar et al., 2008; Hertkorn et al., 2013), HMW-DOM (e.g., Hertkorn et al., 2006; Abdulla et al., 2013a; Repeta, 2015), and RO/ED-DOM (Koprivnjak et al., 2009) albeit at different relative intensities: (1) at ~1.2 ppm (attributed to methyl proton in 6-deoxysugar; Quan and Repeta, 2007); and (2) at ~2.1 ppm (attributed to acetate derivatives). The latter peak is particularly prominent in HMW-DOM in surface seawater and in semi-labile polysaccharides (e.g., Hertkorn et al., 2006; Abdulla et al., 2013a; Repeta, 2015).
Examined more closely, 1H NMR spectra obtained here exhibited several peaks within the aliphatic range (0–1.9 ppm) that were previously observed in RO/ED-DOM spectra, but not in SPE- and HMW-DOM spectra (this is particularly evident in the spectra acquired on the 600 MHz spectrometer shown in Figure 2B). First, in addition to the ~1.2 ppm peak that typically dominates this range of the SPE- and HMW-DOM 1H NMR spectra (Aluwihare et al., 2002; Repeta et al., 2002; Abdulla et al., 2013a; Hertkorn et al., 2013), a small, but distinct shoulder centered around 0.7 ppm was present. Second, an apparent cluster of peaks was present at ~1.5 ppm (tentatively assigned as protein/peptide). Third, a very sharp and prominent peak occurred at 1.75 ppm in all samples (tentatively assigned as a methanethiol functional group). While none of these features are readily apparent in the published 1H NMR spectra of SPE- and HMW-DOM, they are all visible in the 1H NMR spectra of RO/ED-DOM extracted from surface waters of the western Atlantic (Koprivnjak et al., 2009).
To determine the relative abundances of major 1H types, area integrals of each normalized spectrum was sectioned into 5 chemical shift regions following Hertkorn et al. (2013; Table 1). In this simple categorization, relative abundances of 1H types varied in the order: aliphatic (40–46%) > functionalized (28–39%) >> HCO (9–17%) > aromatic (4–9%) > olefinic (3–6%) protons. These relative abundances were comparable to those observed for seawater SPE-DOM collected from 5 to 5446 m water depth in the eastern S. Atlantic Ocean (Hertkorn et al., 2013), and to RO/ED-DOM collected from the surface waters of the western Atlantic Ocean (Koprivnjak et al., 2009; Table 1). When plotted as function of sediment depth, relative abundance of functionalized protons increased by ~35% in the top 50 cm of the sediment column, and this was loosely mirrored by ~40% loss in relative abundance of HCO (Figure 3). Olefinic protons also decreased with depth by 30-50%. These depth trends in compositional variability in SBB sediment pore waters agreed with water column depth trends for SPE-DOM in the eastern S. Atlantic Ocean (Hertkorn et al., 2013). Relative abundances of aliphatic and aromatic protons fluctuated in the top ~100 cm of SBB sediment pore waters, but overall showed little depth variability.
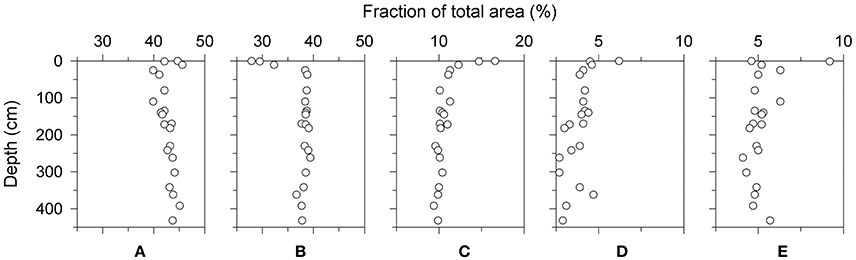
Figure 3. Depth variability in the fraction of total area attributed to major 1H types: (A) aliphatic, 0.2–1.9 ppm; (B) functionalized, 1.9–3.1 ppm; (C) HCO (band N in Table 2), 3.1–4.1 ppm; (D) olefinic (band O in Table 2), 4.9–7.0 ppm; (E) aromatic, (band P in Table 2), 7.0–10.0 ppm. Total area under each section of the spectrum is shown (sum of peaks and area under unresolved envelope). Substructure assignments are based on Hertkorn et al. (2013) and shown in Table 1. δH 4.1–4.9 ppm (where the solvent peak appears) was excluded. Only the data obtained on the 400 MHz spectrometer are shown.
Synchronous 2D Correlation Analysis
To further investigate the depth variability in the 1H NMR spectra of pore-water DOM, we used 2D correlation to objectively identify chemical shift ranges whose relative intensities changed significantly with depth (p ≤ 0.05). All but one of the distinct features in the 0.2–3.1 ppm range of these spectra appeared as an auto-correlation peak (autopeak) along the diagonal of the 2D correlation map, indicating that their intensities changed significantly with depth (Figure 4). The exception was the shoulder centered around 0.7 ppm, whose absence along the diagonal indicated that its depth variability was not significant. Autopeaks along the diagonal were arbitrarily labeled C-M (Table 2). Two of these autopeaks (broad bands G and K centered around 1.6 and 2.5 ppm, respectively) fell in regions of the spectra that featured only unresolved resonance without a clear peak (Figure 2). These were therefore considered subsections of the broad CRAM envelope, and from hereon, are referred to as “bands” instead of “peaks.” Accordingly, areas of bands G and K were determined by calculating the total area under the spectrum over the corresponding δH ranges. The autopeak centered at around 3.6 ppm was not handled as an individual peak, but instead considered part of the broad band representing HCO (band N in Table 1). No autopeaks were detected downfield of 4.0 ppm.
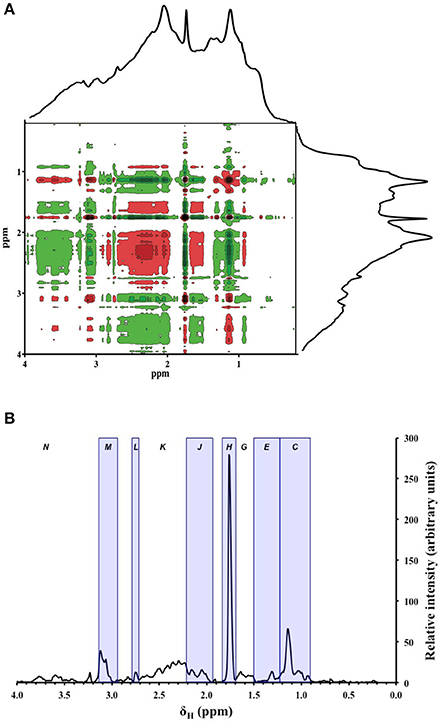
Figure 4. (A) Synchronous 2D correlation map generated from all of the 1H NMR spectra (n = 21) obtained on the 400 MHz instrument. Peaks that appear along the dashed diagonal line (auto-correlation peaks, or autopeaks) indicate chemical shift regions whose intensities changed significantly with depth (p ≤ 0.05). Peaks that appear in the off-diagonal (cross peaks) indicate positive (red) and negative (green) correlations among different parts of the spectrum (p ≤ 0.05). Stronger color intensity represents stronger correlation. The average 1H NMR spectrum is shown at the top and to the right of each plot. Letters indicate peak/band assignments given in Table 2. (B) Relative intensities of autopeaks that appear along the diagonal in panel (A). Letters indicate peak and band assignments. Peaks are encased in blue boxes.
Cross peaks that appear in the off-diagonal in the 2D correlation map allowed gross separation of peaks/bands into two groups: Group-1, which consisted of peak J, band G, and band K; and Group-2, which consisted of peaks C, E, H, L, and M, and band N (Figure 4). Major positive cross peaks (red) were observed among Group-1 resonances, indicating that these peaks/bands co-varied with depth. Cross peaks within Group-2 were also positive, but the correlation was not as strong as compared to Group-1 resonances. Cross peaks between Groups 1 and 2 were negative (green).
Peak Integration and Depth Profiles
To better visualize variability in DOM composition, areas under peaks C-M were integrated and plotted against sediment depth. The area corresponding to CRAM protons was also calculated by summing the areas under the unresolved envelope (Figure 5, Supplementary Figure 2). The majority of compositional variation occurred within the top 50 cm, where relative intensities of Group-1 resonances (J, G, K) and CRAM increased, and relative intensities of Group-2 resonances (C, E, H, L, M, N) decreased (Figures 3, 5). Band O declined with depth, similar to Group-2 resonances (Figure 3). Peak L was absent below 150 cm as was peak M in two deep samples. Other than variability near the surface, band P showed no clear depth trend (Figure 3).
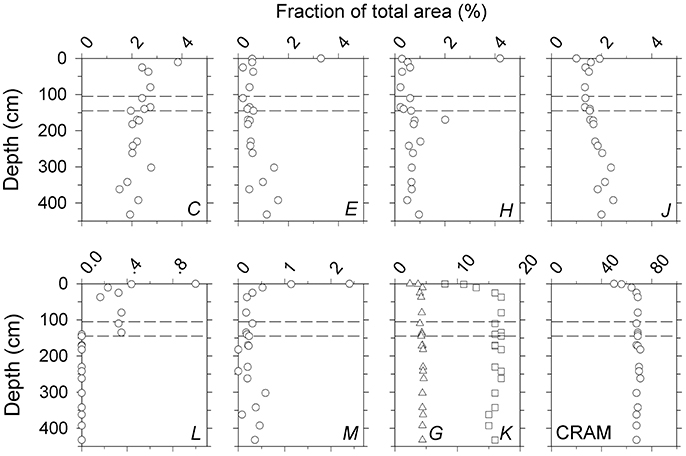
Figure 5. Depth variability in the fraction of total area attributed to peaks (C–M) and CRAM obtained on the 400 MHz spectrometer. Bands G and K were considered to be components of CRAM. Depth profiles of bands N, O, and P are given in Figure 3. Analogous profiles obtained on the 600 MHz spectrometer are shown in Supplementary Figure 2. Dashed lines indicate the upper and lower boundaries of the sulfate-methane transition zone (SMTZ, 125 ± 10 cm; see section Group-2 Resonances).
Protons assigned to CRAM dominated throughout the profile, accounting for 50% of the total integral in the uppermost sample to 70% at depth (Table 3; Figure 5). Bands G and K amounted to 5–7 and 15–25% of CRAM, respectively. While the relative abundance of CRAM protons increased with depth by ~30%, areas of bands G and K doubled, suggesting that these are more reactive regions of the CRAM envelope. The next most prominent resonances after CRAM were bands N and P, which accounted for 9–15 and 4–9% of the total integral, respectively (Table 3).

Table 3. Relative peak intensities observed in spectra acquired on the 400 MHz instrument.
Upon conversion of relative proton abundance to DOC concentration (Supplementary Material), all peaks/bands showed a general increasing trend with depth (Figure 6; Supplementary Figure 3), reflecting the fact that DOC increased steadily with depth (Figure 1). Group-1 resonances (J, G, K; Table 2), CRAM, and band P increased smoothly with depth, suggesting steady net production of these substructures in the sediment column. In contrast, Group-2 resonances (Table 2) showed greater depth variability. Peaks E, H, L, and M showed clear enrichment in the uppermost sample, possibly due to high rates of production near the sediment-water interface. Peak H showed an acute drop immediately below the core top, and then a step-like increase at ~150 cm near the base of the sulfate-methane transition zone, a major redox-cline.
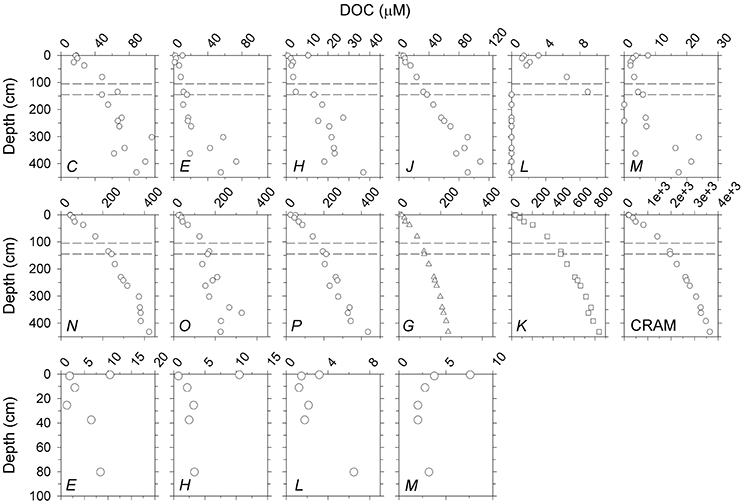
Figure 6. Top two rows: DOC concentrations (μM) attributed to peaks (C–M), bands (N-P, G, K) and CRAM. Bands G and K are considered parts of CRAM. Third row: Close-ups of top 100 cm of the profiles of E, H, L, and M showing local enrichment of these moieties at the sediment-water interface. DOC values were calculated from peak areas in the normalized spectra obtained on the 400 MHz instrument (Supplementary Material). Analogous profiles using data obtained on the 600 MHz instrument are shown in Supplementary Figure 3. Dashed lines indicate the upper and lower boundaries of the sulfate-methane transition zone (SMTZ, 125±10 cm; see section Group-2 Resonances).
Relative abundances of these peaks/bands expressed in DOC units were similar to those calculated using proton resonance intensities, except for a small boost in olefins and aromatics due to their low assigned H/C ratios (Table 3). When binned into major compound classes, CRAM accounted for 53–75% of total DOC, followed by carbohydrate (11–21%; C, J, L, N), aromatics (6–14%; P), olefins (4–9%; O), and protein/peptide (1–5%; E, M). This dominance of CRAM (~50–70% of protons and DOC) is comparable to, or higher than, what has been reported for HMW-DOM in surface and deep seawater (23% and 50% of 13C NMR signal, respectively; Hertkorn et al., 2006), SPE-DOM in freshwater (~62% of 1H NMR signal in Lake Ontario surface water; Lam et al., 2007), and SPE-DOM in surface and deep seawater (50 and 56% of 13C NMR signal, respectively; Hertkorn et al., 2013).
Discussion
Composition and Inferred Reactivity of Pore-Water DOM in SBB
The chemical composition of pore-water DOM clearly varied with depth (Figure 4), with the greatest change occurring in the top ~50 cm (Figures 3, 5). This variability can be broadly characterized as a relative increase in the unresolved CRAM envelope, that was counterbalanced by relative decreases in Group-2 resonances (peaks C, E, H, L, M, band N) and band O. Band P (aromatic protons) showed little depth variability in relative intensity. Regardless of the sources and identities of the compounds that give rise to Group-2 resonances and band O, their declining relative intensities and the increasing dominance of the unresolved CRAM envelope is consistent with an overall increase in molecular diversity with depth in the sediment column, and therefore, with increasing microbial organic matter degradation during early diagenesis.
Group-2 Resonances
Group-2 resonances identified by 2D correlation analysis (Figure 4) included a number of peaks (C, E, H, L, M; Table 2). Peaks are expected to arise from specific substructures, making it possible to link them to particular biomolecules or their derivatives. Bands N and O have also been characterized to arise from biomolecules (carbohydrate-like structures, and linear terpenoids and unsaturated alicyclics, respectively; e.g., Hertkorn et al., 2013). Relative intensities of all Group-2 resonances and band O declined sharply in the top ~50 cm of the sediment column (Figures 3, 5), suggesting that these substructures are associated with labile compounds that undergo rapid turnover near the sediment surface. However, with the exception of peak L which was not readily discerned below 135 cm, all of these resonances persisted throughout the profile. This then means that Group-2 resonances and band O are not only associated with labile compounds that occur only near the sediment-water interface, but also components of more stable molecules that accumulate with depth in the sediment column. This overall pattern is also evident upon conversion of relative intensities to absolute DOC concentrations (Figure 6). All Group-2 units and band O increased with depth in the sediment column, consistent with net accumulation of semi-refractory to refractory DOM constituents (Hansell, 2013; Burdige et al., 2016). In addition to net accumulation with depth, DOC concentrations corresponding to peaks E, H, L, and M were highest at the sediment surface (0.5 cm), and reached low (and in some cases near-constant) values within the top 50 cm (Figure 6). This type of enrichment at the sediment-water interface has been observed for highly labile DOM such as dissolved free amino acids (Henrichs and Farrington, 1987; Burdige and Martens, 1990) and is predicted by diagenetic model calculations (Burdige, 2002; Burdige et al., 2016). The depth distribution of Group-2 resonances described here also appears consistent with net accumulation of carbohydrates directly determined in sediment pore waters (Burdige and Komada, 2015).
Peak L (tentatively assigned to amino sugar; Table 2) was prominent in samples at depths ≤ 135 cm, but was largely non-detectable in deeper horizons (c.f., Figure 2; Supplementary Figure 2). The depth at which peak L was no longer observed roughly coincides with the base of the sulfate-methane transition zone (SMTZ) in SBB sediments (125 ± 10 cm; Komada et al., 2016) that demarcates the sulfate-reducing zone above and methanogenic sediments below. SMTZs in diffusion-dominated sediments are characterized as regions of high rates of microbial activity including anaerobic methane oxidation, and with microbial assemblages that are unique compared to adjacent sulfate-reducing and methanogenic sediments (Parkes et al., 2005; Biddle et al., 2006; Harrison et al., 2009). The near-absence of peak L below the SMTZ suggests that this peak is associated with molecules that are either produced only within the sulfate-reducing zone, or that its rate of loss exceeds the rate of production within the methanogenic zone.
Relative intensity of peak H (tentatively assigned to methanethiol functional group) also showed a break in distribution across the SMTZ (Figure 5); it was higher by a factor of two in the methanogenic zone (≥145 cm) than in the SMTZ and the sulfate-reducing zone (p < 0.01; the top sample at 0.5 cm was excluded from this comparison). This subsequently resulted in a step-like increase in the absolute concentration of peak H in DOC units across the SMTZ (Figure 6). Peak H was the best resolved of all resonances detected in this study and was observed in all samples (c.f., Figure 2). This peak is also clearly visible in the 1H NMR spectra of RO/ED-DOM extracted from the surface waters of the western Atlantic ocean (Koprivnjak et al., 2009). However, to the best of the authors' knowledge, this peak has not been identified in the literature, nor has it been reported in 1H NMR spectra of SPE- or HMW-DOM. More work is needed to evaluate the identity and biogeochemical significance of the compound(s) associated with this peak.
Resonances Attributed to Carbohydrates (C, J, N)
Polysaccharides make up a major component of marine and freshwater HMW- and SPE-DOM (Hertkorn et al., 2006; Lam et al., 2007; Repeta, 2015), and sediment pore-water DOM (Burdige and Komada, 2015). A considerable fraction of this compound class has been hypothesized to occur in the form of N-acetyl amino polysaccharides, or acyl heteropolysaccharides (APS; Aluwihare et al., 1997, 2005). The widespread occurrence of APS in DOM is supported by the uniformity in the hydrolysable neutral monosaccharide composition, and by the recurring features in 1H and 13C NMR spectra obtained from HMW-DOM collected from a wide range of environments including freshwaters and sediment pore waters (Repeta et al., 2002; Repeta, 2015). As expected, the spectra obtained here consistently show resonances centered around δH 1.2 ppm (peak C), 2.1 ppm (peak J), and between 3 and 4 ppm (band N), assigned here to methyl group of deoxysugars, methyl group of N-acetyl amino sugars, and singly oxygenated units including carbohydrates, respectively (Table 2; Figure 2). Combined, these peaks account for 10–20% of bulk DOC (Table 3), similar to the relative abundances reported previously for lakes and rivers (Repeta et al., 2002). The relative abundances of these substructures in our whole pore-water samples in DOC units (C: J: N = ~1:1:6; Table 3) are also similar to the ratio reported for seawater and marine pore-water HMW-DOM (~1:1:8; Aluwihare et al., 1997; Repeta et al., 2002).
In SBB pore-water DOM, it is however unlikely that C, J, and N resonances belong to a common macromolecule as hypothesized in the past (Aluwihare et al., 1997, 2005), because their relative intensities showed distinct depth variability. 2D correlation analysis shows that the relative intensities of C and N declined with depth, while J increased with depth (Figure 4A; also see Figures 3, 5). The relative increase in peak J with depth suggests comparatively greater stability of N-acylated moieties relative to their non-acylated counterparts. This finding supports the work of Abdulla et al. (2010) who used 2D correlation to analyze 13C NMR and FTIR spectra of HMW DOM collected across an estuarine salinity gradient. They found polysaccharides to be split into two groups: an acylated component (APS), and a non-acylated component (heteropolysaccharides, or HPS). Furthermore, they found relative abundance of HPS to vary with salinity, while the relative abundance of APS remained largely invariant, leading them to hypothesize that HPS is more dynamic than APS.
CRAM
CRAM increased with sediment depth in terms of both relative proton abundances (Figure 5) and in absolute amount as DOC (Figure 6). This increase was also associated with changes in composition, as evidenced by the fact that the relative intensities of CRAM constituents G and K doubled, while the relative intensity of CRAM resonance as a whole increased by only ~30% over the length of the profile (Figure 5). To more closely examine how CRAM composition varied with depth, the CRAM envelope (Figure 2) was sectioned into the δH intervals corresponding to peaks C, E, H, J, L, and M in addition to bands G and K. Area integrals of these sections were expressed as fractions of total CRAM area and plotted as function of depth (Figure 7; the sum of these sections accounted for ~94% of the total CRAM envelope). The topmost 3 samples of the profile (from 0.5 to 11 cm) were excluded from this analysis, because they exhibited large fluctuations likely due to low signal-to-noise ratio resulting from the low DOC concentration near the sediment surface (e.g., Figures 1, 2).
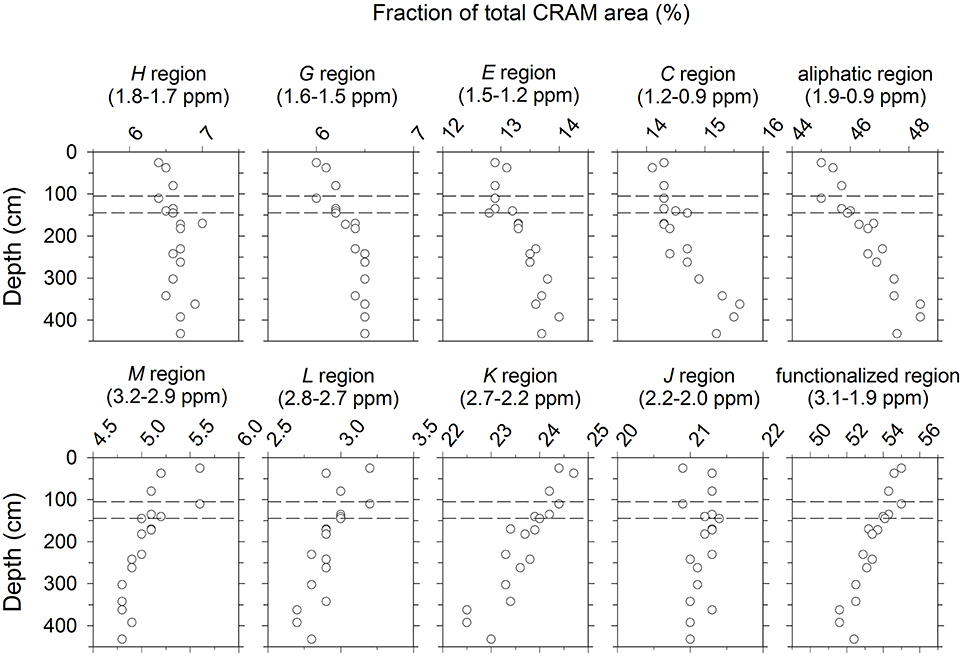
Figure 7. (Left) 4 columns (8 panels): Fraction of CRAM protons that resonated in δH ranges corresponding to peaks and bands defined in Table 2. The sum of these sections accounted for ~94% of the total CRAM envelope (see section CRAM). Far (Right) column (2 panels): Fraction of CRAM protons that resonated in the aliphatic and functionalized δH ranges as defined in Table 1.
The fraction of CRAM protons resonating in the aliphatic δH ranges (corresponding to peaks C and E, and band G) increased significantly with depth (p < 0.05), while protons resonating in functionalized δH ranges (corresponding to peaks K and L, and band M) decreased significantly with depth (p < 0.05; Figure 7). Overall, slightly over half of the CRAM protons fell in the functionalized category, but this dominance declined as the relative abundance of aliphatic protons increased with depth (Figure 7). CRAM protons that resonated near the boundary between aliphatic and functionalized δH ranges (corresponding to peaks H and J) did not change significantly with depth (p < 0.05), and accounted for a ~constant fraction of the total CRAM envelope.
These results clearly indicate that CRAM (operationally defined here as the broad envelope in the chemical shift region 0.91–3.15 ppm) is dynamic not only in terms of its total concentration, but also in its molecular composition. While functionalized protons dominated the total CRAM envelope throughout the profile, their decline relative to aliphatic protons suggest that CRAM that are rich in aliphatic protons may contain more stable molecules than CRAM rich in functionalized protons.
Bulk Chemical Composition of SBB Pore-Water DOM Relative to Seawater DOM
NMR studies of seawater DOM have shown widespread occurrences of two major DOM components: APS/HPS, the semi-labile component; and CRAM (Repeta, 2015). The relative contributions of these two components vary with water depth, and by the method used to extract DOM from seawater (Benner et al., 1992; Aluwihare et al., 2002; Hertkorn et al., 2006; Koprivnjak et al., 2009; Broek et al., 2017). However, both the molecular composition of APS/HPS (Aluwihare et al., 1997), and the shape of the broad CRAM envelope (e.g., Hertkorn et al., 2006; Lam et al., 2007; Lam and Simpson, 2008) show close agreement across marine and some freshwater environments. Therefore, 1H NMR spectra of HMW-DOM and SPE-DOM commonly show strong similarity within each group (e.g., Hertkorn et al., 2013; Repeta, 2015).
1H NMR spectra of pore-water DOM from SBB sediments reported here showed key differences compared to spectra of HMW-, SPE-, and RO/ED-DOM in the literature listed above. Possible explanations for this observation are: (1) SBB pore-water samples were analyzed as whole, whereas HMW-, SPE-, and RO/ED-DOM were subject to fractionation during isolation and concentration prior to NMR analysis; (2) SPE- and RO/ED-DOM were subject to chemical alteration during sampling, but SBB pore-water DOM was not; (3) SBB pore-water DOM is compositionally different from seawater DOM; or (4) SBB pore-water DOM spectra are influenced by the occurrence of dissolved metals (Satterlee, 1990) and by suppression of the water signal (Lam and Simpson, 2008), while other are not. These four factors are not mutually exclusive.
Despite these differences, SBB pore-water DOM and seawater DOM clearly have common constituents. First, SBB pore-water DOM displayed resonances that are also ubiquitous in marine DOM (peaks C, J, and band N). Second, the relative abundances of major 1H types observed in SBB pore-water DOM are similar to those reported for seawater SPE-DOM in the eastern Atlantic Ocean (Hertkorn et al., 2013; Table 1). Third, the overall decline in relative abundance of functionalized protons, and relative increases in HCO and olefinic protons with increasing depth in the sediment column (Figure 3) are similar to depth trends reported for the eastern Atlantic Ocean SPE-DOM (Hertkorn et al., 2013), implying overall similarity in relative reactivity across different 1H types in the water column and sediments.
Net Production of CRAM and the Reactivity of Pore-Water DOM in Santa Barbara Basin Sediments
The majority of the compositional change we detected by 1H NMR occurred within the top 50 cm of the sediment column (Figure 5) with a key characteristic being an increase in relative abundance of CRAM, and decrease in relatively well-resolved peaks. The dramatic increase in CRAM resonance in the top 50 cm of the sediment column where remineralization rates are high (Burdige et al., 2016) strongly indicates net production of CRAM by the microbial community during sedimentary organic matter degradation. This corroborates the findings from laboratory experiments (Koch et al., 2005, 2014; Rossel et al., 2013; Lechtenfeld et al., 2015) and field observations (Schmidt et al., 2017) showing the importance of microbial activity in the generation of CRAM-like formulas from known biomolecules.
At depths > ~50 cm, there was comparatively less variability in DOM composition (Figure 5). A simple and plausible explanation for this muted variability in bulk composition is that the substructures detected at depth are largely associated with molecules having limited reactivity. This suggestion agrees with recent modeling work (Burdige et al., 2016) that found labile DOC and dissolved organic nitrogen (with first-order degradation rate constant k = 30 to >200 yr−1) to disappear within the top ~60 cm, and a refractory component (k = ~2 × 10⁻⁴ yr−1) to continuously accumulate throughout the depth interval examined. At any given depth, the refractory component dominated the DOC standing stock (70–80% in the top 10 cm, and >99% below the SMTZ). Given the fact that CRAM likely consists of a highly diverse set of molecules (Hertkorn et al., 2006), limited compositional change in CRAM-dominated pore-water DOM at depth is also consistent with the molecular diversity hypothesis for DOM stability (Dittmar, 2015).
The microbial pump has been put forward as the mechanism for production of refractory DOM in the ocean (Jiao et al., 2010). While a number of studies indeed demonstrate microbial conversion of labile monomers and fresh biomass into more stable compounds that resemble CRAM (Gruber et al., 2006; Rossel et al., 2013; Lechtenfeld et al., 2015), more recent studies suggest that actual production of refractory DOM found in the deep sea may require more than a few months to years of microbial processing (Koch et al., 2014; Osterholz et al., 2015). The work presented here shows that there is net production of CRAM (Figure 6), and compositional change in CRAM within the sediment column (Figure 7). If this compositional change is a result of CRAM transformation occurring within the pore water, then the time scale for this process over the 4.5-m length profile could be on the order of 2 kyr (DOM diffusional time scale calculated from the Einstein-Smoluchowski relation assuming that the whole sediment diffusion coefficient for DOM is 50 cm2 yr−1; Boudreau, 1997). Furthermore, pore-water DOM is generated during degradation of sedimentary organic matter with a wide range of reactivities including microbially reworked and pre-aged components (Ohkouchi et al., 2002; Blair and Aller, 2012; Komada et al., 2013; Burdige et al., 2016). In sum, marine sediments might be sources of CRAM that are compositionally unique from CRAM generated in the upper ocean.
SBB sediments are clearly sources of DOM to the overlying water column (Figure 1), including CRAM (Figure 6). If a major fraction of DOM accumulating in these pore waters—and hence supporting the benthic DOM flux—is indeed refractory, one might then conclude that these sediments are sources of refractory DOM to the water column (also see discussions in Burdige et al., 1999, 2016). However, this would depend on the extent to which DOM that exhibits limited reactivity in anoxic sediments also shows limited reactivity in the water column. For example, the presence of molecular oxygen in the water column may speed up the degradation of some compounds (e.g., Hulthe et al., 1998; Sun et al., 2002; Reimers et al., 2013). On the contrary, differences in microbial enzymatic capabilities (Arnosti, 2000, 2008; Teske et al., 2011; Cardman et al., 2014), or the effect of dilution (Arrieta et al., 2015) could render some compounds less susceptible to degradation upon export into the water column. Rigorous assessment of the role of sedimentary DOM in the marine DOM cycle will require structural characterization of DOM molecules allowing for cross-identification in sediments and in the water column.
Author Contributions
HA, CF, and JL: generated the NMR data, and HA conducted the 2D correlation analysis; DB and TK: coordinated the project and collected the samples; CF and TK: wrote the paper with intellectual feedback from all authors.
Funding
This material is based upon work supported by the National Science Foundation under Grant Numbers OCE-1155764, OCE-1155562, and OCE-1155320. Portions of this work were performed at Lawrence Livermore National Laboratory under the auspices of the Department of Energy under contract DE-AC52-07NA27344.
Conflict of Interest Statement
The authors declare that the research was conducted in the absence of any commercial or financial relationships that could be construed as a potential conflict of interest.
Acknowledgments
We thank Dale Hubbard and the OSU Coring Facility, Meghan Donohue, captain and crew of R/V New Horizon, Jeff Chanton, Cedric Magen, Abraham King Cada, Joy Li, Adrian Gerretson, Ashley Grose, Jeremy Bleakney, Patrick Tennis, Bryce Riegel. André Simpson is gratefully acknowledged for his assistance with the modified WATERGATE-W5 solvent suppression sequence. We also thank the reviewers for their comments that helped improve the quality of this manuscript.
Supplementary Material
The Supplementary Material for this article can be found online at: https://www.frontiersin.org/articles/10.3389/fmars.2018.00172/full#supplementary-material
References
Abdulla, H. A. N., Minor, E. C., Dias, R. F., and Hatcher, P. G. (2013a). Transformations of the chemical compositions of high molecular weight DOM Along a salinity transect: using two dimensional correlation spectroscopy and principal component analysis approaches. Geochim. Cosmochim. Acta 118, 231–246. doi: 10.1016/j.gca.2013.03.036
Abdulla, H. A. N., Minor, E. C., and Hatcher, P. G. (2010). Using two-dimensional correlations of 13C NMR and FTIR to investigate changes in the chemical composition of dissolved organic matter along an estuarine transect. Environ. Sci. Technol. 44, 8044–8049. doi: 10.1021/es100898x
Abdulla, H. A., Sleighter, R. L., and Hatcher, P. G. (2013b). Two dimensional correlation analysis of fourier transform ion cyclotron resonance mass spectra of dissolved organic matter: a new graphical analysis of trends. Anal. Chem. 85, 3895–3902. doi: 10.1021/ac303221j
Alperin, M. J., Albert, D. B., and Martens, C. S. (1994). Seasonal variations in production and consumption rates of dissolved organic carbon in an organic-rich coastal sediment. Geochim. Cosmochim. Acta 58, 4909–4930. doi: 10.1016/0016-7037(94)90221-6
Aluwihare, L. I., Repeta, D. J., and Chen, R. F. (1997). A major biopolymeric component to dissolved organic carbon in surface sea water. Nature 387, 166–169. doi: 10.1038/387166a0
Aluwihare, L. I., Repeta, D. J., and Chen, R. F. (2002). Chemical composition and cycling of dissolved organic matter in the Mid-Atlantic Bight. Deep Sea Res. Part II Top. Stud. Oceanogr. 49, 4421–4437. doi: 10.1016/S0967-0645(02)00124-8
Aluwihare, L. I., Repeta, D. J., Pantoja, S., and Johnson, C. G. (2005). Two chemically distinct pools of organic nitrogen accumulate in the ocean. Science 308, 1007–1010. doi: 10.1126/science.1108925
Anderson, L. A. (1995). On the hydrogen and oxygen content of marine phytoplankton. Deep Sea Res. Part I Oceanogr. Res. Pap. 42, 1675–1680. doi: 10.1016/0967-0637(95)00072-E
Arnosti, C. (2000). Substrate specificity in polysaccharide hydrolysis: contrasts between bottom water and sediments. Limnol. Oceanogr. 45, 1112–1119. doi: 10.4319/lo.2000.45.5.1112
Arnosti, C. (2008). Functional differences between Arctic seawater and sedimentary microbial communities: contrasts in microbial hydrolysis of complex substrates. FEMS Microbiol. Ecol. 66, 343–351. doi: 10.1111/j.1574-6941.2008.00587.x
Arrieta, J. M., Mayol, E., Hansman, R. L., Herndl, G. J., Dittmar, T., and Duarte, C. M. (2015). Dilution limits dissolved organic carbon utilization in the deep ocean. Science 348, 331–333. doi: 10.1126/science.1258955
Benner, R., and Amon, R. M. W. (2015). The size-reactivity continuum of major bioelements in the ocean. Ann. Rev. Mar. Sci. 7, 185–205. doi: 10.1146/annurev-marine-010213-135126
Benner, R., Pakulski, J. D., McCarthy, M., Hedges, J. I., and Hatcher, P. G. (1992). Bulk chemical characteristics of dissolved organic matter in the ocean. Science 255, 1561–1564. doi: 10.1126/science.255.5051.1561
Biddle, J. F., Lipp, J. S., Lever, M. A., Lloyd, K. G., Sørensen, K. B., Anderson, R., et al. (2006). Heterotrophic Archaea dominate sedimentary subsurface ecosystems off Peru. Proc. Natl. Acad. Sci. U.S.A. 103, 3846–3851. doi: 10.1073/pnas.0600035103
Blair, N. E., and Aller, R. C. (2012). The fate of terrestrial organic carbon in the marine environment. Ann. Rev. Mar. Sci. 4, 401–423. doi: 10.1146/annurev-marine-120709-142717
Boudreau, B. P. (1997). Diagenetic Models and Their Implementation: Modelling Transport and Reactions in Aquatic Sediments. Berlin: Springer.
Broek, T. A. B., Walker, B. D., Guilderson, T. P., and McCarthy, M. D. (2017). Coupled ultrafiltration and solid phase extraction approach for the targeted study of semi-labile high molecular weight and refractory low molecular weight dissolved organic matter. Mar. Chem. 194, 146–157. doi: 10.1016/j.marchem.2017.06.007
Burdige, D. J. (2001). Dissolved organic matter in Chesapeake Bay sediment pore waters. Org. Geochem. 32, 487–505. doi: 10.1016/S0146-6380(00)00191-1
Burdige, D. J. (2002). “Sediment Pore Waters,” in Biogeochemistry of Marine Dissolved Organic Matter, eds D. A. Hansell and C. A. Carlson (San Diego, CA: Academic Press), 611–663.
Burdige, D. J., Berelson, W. M., Coale, K. H., McManus, J., and Johnson, K. S. (1999). Fluxes of dissolved organic carbon from California continental margin sediments. Geochim. Cosmochim. Acta 63, 1507–1515. doi: 10.1016/S0016-7037(99)00066-6
Burdige, D. J., and Gardner, K. G. (1998). Molecular weight distribution of dissolved organic carbon in marine sediment pore waters. Mar. Chem. 62, 45–64. doi: 10.1016/S0304-4203(98)00035-8
Burdige, D. J., and Komada, T. (2015). “Sediment Pore Waters,” in Biogeochemistry of Marine Dissolved Organic Matter, eds D. A. Hansell and C. A. Carlson (London: Academic Press), 535–577.
Burdige, D. J., Komada, T., Magen, C., and Chanton, J. P. (2016). Modeling studies of dissolved organic matter cycling in Santa Barbara Basin (CA, USA) sediments. Geochim. Cosmochim. Acta 195, 100–119. doi: 10.1016/j.gca.2016.09.007
Burdige, D. J., and Martens, C. S. (1990). Biogeochemical cycling in an organic-rich coastal marine basin: 11. The sedimentary cycling of dissolved, free amino acids. Geochim. Cosmochim. Acta 54, 3033–3052. doi: 10.1016/0016-7037(90)90120-A
Burdige, D. J., and Zheng, S. L. (1998). The biogeochemical cycling of dissolved organic nitrogen in estuarine sediments. Limnol. Oceanogr. 43, 1796–1813. doi: 10.4319/lo.1998.43.8.1796
Cardman, Z., Arnosti, C., Durbin, A., Ziervogel, K., Cox, C., Steen, A. D., et al. (2014). Verrucomicrobia are candidates for polysaccharide-degrading bacterioplankton in an arctic fjord of svalbard. Appl. Environ. Microbiol. 80, 3749–3756. doi: 10.1128/AEM.00899-14
Chen, H. M., Stubbins, A., and Hatcher, P. G. (2011). A mini-electrodialysis system for desalting small volume saline samples for Fourier transform ion cyclotron resonance mass spectrometry. Limnol. Oceanogr. 9, 582–592. doi: 10.4319/lom.2011.9.582
Dittmar, T. (2015). “Reasons behind the long-term stability of dissolved organic matter,” in Biogeochemistry of Marine Dissolved Organic Matter, eds D. A. Hansell and C. A. Carlson (London: Academic Press), 369–388.
Dittmar, T., Koch, B., Hertkorn, N., and Kattner, G. (2008). A simple and efficient method for the solid-phase extraction of dissolved organic matter (SPE-DOM) from seawater. Limnol. Oceanogr. Methods 6, 230–235. doi: 10.4319/lom.2008.6.230
Dittmar, T., and Stubbins, A. (2014). “Dissolved Organic Matter in Aquatic Systems,” in Treatise on Geochemistry, eds H. D. Holland and K. K. Turekian (Amsterdam: Elsevier), 125–156.
Green, N. W., Perdue, E. M., Aiken, G. R., Butler, K. D., Chen, H., Dittmar, T., et al. (2014). An intercomparison of three methods for the large-scale isolation of oceanic dissolved organic matter. Mar. Chem. 161, 14–19. doi: 10.1016/j.marchem.2014.01.012
Gruber, D. F., Simjouw, J.-P., Seitzinger, S. P., and Taghon, G. L. (2006). Dynamics and characterization of refractory dissolved organic matter produced by a pure bacterial culture in an experimental predator-prey system. Appl. Environ. Microbiol. 72, 4184–4191. doi: 10.1128/AEM.02882-05
Gurtler, B. K., Vetter, T. A., Perdue, E. M., Ingall, E., Koprivnjak, J. F., and Pfromm, P. H. (2008). Combining reverse osmosis and pulsed electrical current electrodialysis for improved recovery of dissolved organic matter from seawater. J. Memb. Sci. 323, 328–336. doi: 10.1016/j.memsci.2008.06.025
Hansell, D. A. (2013). Recalcitrant dissolved organic carbon fractions. Ann. Rev. Mar. Sci. 5, 421–445. doi: 10.1146/annurev-marine-120710-100757
Harrison, B. K., Zhang, H., Berelson, W., and Orphan, V. J. (2009). Variations in archaeal and bacterial diversity associated with the sulfate-methane transition zone in continental margin sediments (Santa Barbara Basin, California). Appl. Environ. Microbiol. 75, 1487–1499. doi: 10.1128/AEM.01812-08
Hedges, J. I., Eglinton, G., Hatcher, P. G., Kirchman, D. L., Arnosti, C., Derenne, S., et al. (2000). The molecularly-uncharacterized component of nonliving organic matter in natural environments. Org. Geochem. 31, 945–958. doi: 10.1016/S0146-6380(00)00096-6
Hee, C. A., Pease, T. K., Alperin, M. J., and Martens, C. S. (2001). Dissolved organic carbon production and consumption in anoxic marine sediments: a pulsed-tracer experiment. Limnol. Oceanogr. 46, 1908–1920. doi: 10.4319/lo.2001.46.8.1908
Helms, J. R., Mao, J., Chen, H., Perdue, E. M., Green, N. W., Hatcher, P. G., et al. (2015). Spectroscopic characterization of oceanic dissolved organic matter isolated by reverse osmosis coupled with electrodialysis. Mar. Chem. 177, 278–287. doi: 10.1016/j.marchem.2015.07.007
Henrichs, S. M., and Farrington, J. W. (1979). Amino acids in interstitial waters of marine sediments. Nature 279, 319–322. doi: 10.1038/279319a0
Henrichs, S. M., and Farrington, J. W. (1987). Early diagenesis of amino acids and organic matter in two coastal marine sediments. Geochim. Cosmochim. Acta 51, 1–15. doi: 10.1016/0016-7037(87)90002-0
Hertkorn, N., Benner, R., Frommberger, M., Schmitt-Kopplin, P., Witt, M., Kaiser, K., et al. (2006). Characterization of a major refractory component of marine dissolved organic matter. Geochim. Cosmochim. Acta 70, 2990–3010. doi: 10.1016/j.gca.2006.03.021
Hertkorn, N., Harir, M., Koch, B., Michalke, B., and Schmitt-Kopplin, P. (2013). High-field NMR spectroscopy and FTICR mass spectrometry: powerful discovery tools for the molecular level characterization of marine dissolved organic matter. Biogeosciences 10, 1583–1624. doi: 10.5194/bg-10-1583-2013
Hertkorn, N., Ruecker, C., Meringer, M., Gugisch, R., Frommberger, M., Perdue, E. M., et al. (2007). High-precision frequency measurements: indispensable tools at the core of the molecular-level analysis of complex systems. Anal. Bioanal. Chem. 389, 1311–1327. doi: 10.1007/s00216-007-1577-4
Hülsemann, J., and Emery, K. O. (1961). Stratification in recent sediments of Santa Barbara Basin as controlled by organisms and water character. J. Geol. 69, 279–290. doi: 10.1086/626742
Hulthe, G., Hulth, S., and Hall, P. O. J. (1998). Effect of oxygen on degradation rate of refractory and labile organic matter in continental margin sediments. Geochim. Cosmochim. Acta 62, 1319–1328. doi: 10.1016/S0016-7037(98)00044-1
Jiao, N., Herndl, G. J., Hansell, D. A., Benner, R., Kattner, G., Wilhelm, S. W., et al. (2010). Microbial production of recalcitrant dissolved organic matter: long-term carbon storage in the global ocean. Nat. Rev. Microbiol. 8, 593–599. doi: 10.1038/nrmicro2386
Koch, B. P., Kattner, G., Witt, M., and Passow, U. (2014). Molecular insights into the microbial formation of marine dissolved organic matter: recalcitrant or labile? Biogeosciences 11, 4173–4190. doi: 10.5194/bg-11-4173-2014
Koch, B. P., Witt, M., Engbrodt, R., Dittmar, T., and Kattner, G. (2005). Molecular formulae of marine and terrigenous dissolved organic matter detected by electrospray ionization Fourier transform ion cyclotron resonance mass spectrometry. Geochim. Cosmochim. Acta 69, 3299–3308. doi: 10.1016/j.gca.2005.02.027
Komada, T., Burdige, D. J., Crispo, S. M., Druffel, E. R. M., Griffin, S., Johnson, L., et al. (2013). Dissolved organic carbon dynamics in anaerobic sediments of the Santa Monica Basin. Geochim. Cosmochim. Acta 110, 253–273. doi: 10.1016/j.gca.2013.02.017
Komada, T., Burdige, D. J., Li, H. L., Magen, C., Chanton, J. P., and Cada, A. K. (2016). Organic matter cycling across the sulfate-methane transition zone of the Santa Barbara Basin, California Borderland. Geochim. Cosmochim. Acta 176, 259–278. doi: 10.1016/j.gca.2015.12.022
Koprivnjak, J. F., Pfromm, P. H., Ingall, E., Vetter, T. A., Schmitt-Kopplin, P., Hertkorn, N., et al. (2009). Chemical and spectroscopic characterization of marine dissolved organic matter isolated using coupled reverse osmosis–electrodialysis. Geochim. Cosmochim. Acta 73, 4215–4231. doi: 10.1016/j.gca.2009.04.010
Krishnan, V. V., and Murali, N. (2013). Radiation damping in modern NMR experiments: progress and challenges. Prog. Nucl. Magn. Reson. Spectrosc. 68, 41–57. doi: 10.1016/j.pnmrs.2012.06.001
Lam, B., Baer, A., Alaee, M., Lefebvre, B., Moser, A., Williams, A., et al. (2007). Major structural components in freshwater dissolved organic matter. Environ. Sci. Technol. 41, 8240–8247. doi: 10.1021/es0713072
Lam, B., and Simpson, A. J. (2008). Direct 1H NMR spectroscopy of dissolved organic matter in natural waters. Analyst 133:263. doi: 10.1039/B713457F
Lechtenfeld, O. J., Hertkorn, N., Shen, Y., Witt, M., and Benner, R. (2015). Marine sequestration of carbon in bacterial metabolites. Nat. Commun. 6:6711. doi: 10.1038/ncomms7711
Minor, E. C., Swenson, M. M., Mattson, B. M., and Oyler, A. R. (2014). Structural characterization of dissolved organic matter: a review of current techniques for isolation and analysis. Environ. Sci. Process. Impacts 16, 2064–2079. doi: 10.1039/C4EM00062E
Mopper, K., Stubbins, A., Ritchie, J. D., Bialk, H. M., and Hatcher, P. G. (2007). Advanced instrumental approaches for characterization of marine dissolved organic matter: extraction techniques, mass spectrometry, and nuclear magnetic resonance spectroscopy. Chem. Rev. 107, 419–442. doi: 10.1021/cr050359b
Ohkouchi, N., Eglinton, T. I., Keigwin, L. D., and Hayes, J. M. (2002). Spatial and temporal offsets between proxy records in a sediment drift. Science 298, 1224–1227. doi: 10.1126/science.1075287
Orem, W. H., and Hatcher, P. G. (1987). Solid-state 13C NMR studies of dissolved organic matter in pore waters from different depositional environments. Org. Geochem. 11, 73–82. doi: 10.1016/0146-6380(87)90029-5
Orem, W. H., Hatcher, P. G., Spiker, E. C., Szeverenyi, N. M., and Maciel, G. E. (1986). Dissolved organic matter in anoxic pore waters from Mangrove Lake, Bermuda. Geochim. Cosmochim. Acta 50, 609–618. doi: 10.1016/0016-7037(86)90109-2
Osterholz, H., Niggemann, J., Giebel, H.-A., Simon, M., and Dittmar, T. (2015). Inefficient microbial production of refractory dissolved organic matter in the ocean. Nat. Commun. 6:7422. doi: 10.1038/ncomms8422
Parkes, R. J., Webster, G., Cragg, B. A., Weightman, A. J., Newberry, C. J., Ferdelman, T. G., et al. (2005). Deep sub-seafloor prokaryotes stimulated at interfaces over geological time. Nature 436, 390–394. doi: 10.1038/nature03796
Quan, T. M., and Repeta, D. J. (2007). Periodate oxidation of marine high molecular weight dissolved organic matter: evidence for a major contribution from 6-deoxy- and methyl sugars. Mar. Chem. 105, 183–193. doi: 10.1016/j.marchem.2007.01.012
Reimers, C. E., Alleau, Y., Bauer, J. E., Delaney, J., Girguis, P. R., Schrader, P. S., et al. (2013). Redox effects on the microbial degradation of refractory organic matter in marine sediments. Geochim. Cosmochim. Acta 121, 582–598. doi: 10.1016/j.gca.2013.08.004
Repeta, D. J. (2015). “Chemical characterization and cycling of dissolved organic matter,” in Biogeochemistry of Marine Dissolved Organic Matter, eds D. A. Hansell and C. A. Carlson (San Diego, CA: Elsevier), 21–63.
Repeta, D. J., and Aluwihare, L. I. (2006). Radiocarbon analysis of neutral sugars in high-molecular-weight dissolved organic carbon: implications for organic carbon cycling. Limnol. Oceanogr. 51, 1045–1053. doi: 10.4319/lo.2006.51.2.1045
Repeta, D. J., Quan, T. M., Aluwihare, L. I., and Accardi, A. (2002). Chemical characterization of high molecular weight dissolved organic matter in fresh and marine waters. Geochim. Cosmochim. Acta 66, 955–962. doi: 10.1016/S0016-7037(01)00830-4
Rossel, P. E., Vähätalo, A. V., Witt, M., and Dittmar, T. (2013). Molecular composition of dissolved organic matter from a wetland plant (Juncus effusus) after photochemical and microbial decomposition (1.25 yr): common features with deep sea dissolved organic matter. Org. Geochem. 60, 62–71. doi: 10.1016/j.orggeochem.2013.04.013
Sansone, F. J., and Martens, C. S. (1982). Volatile fatty acid cycling in organic-rich marine sediments. Geochim. Cosmochim. Acta 46, 1575–1590. doi: 10.1016/0016-7037(82)90315-5
Satterlee, J. D. (1990). Fundamental concepts of NMR in paramagnetic systems. Part II: Relaxation effects. Concepts Magn. Reson. 2, 119–129. doi: 10.1002/cmr.1820020302
Schmidt, F., Koch, B. P., Goldhammer, T., Elvert, M., Witt, M., Lin, Y.-S., et al. (2017). Unraveling signatures of biogeochemical processes and the depositional setting in the molecular composition of pore water DOM across different marine environments. Geochim. Cosmochim. Acta 207, 57–80. doi: 10.1016/j.gca.2017.03.005
Severmann, S., Johnson, C. M., Beard, B. L., and McManus, J. (2006). The effect of early diagenesis on the Fe isotope compositions of porewaters and authigenic minerals in continental margin sediments. Geochim. Cosmochim. Acta 70, 2006–2022. doi: 10.1016/j.gca.2006.01.007
Shaw, T. J., Gieskes, J. M., and Jahnke, R. A. (1990). Early diagenesis in differing depositional environments: the response of transition metals in pore water. Geochim. Cosmochim. Acta 54, 1233–1246. doi: 10.1016/0016-7037(90)90149-F
Sholkovitz, E. R., and Gieskes, J. M. (1971). A physical-chemical study of the flushing of the Santa Barbara Basin. Limnol. Oceanogr. 16, 479–489. doi: 10.4319/lo.1971.16.3.0479
Soutar, A., and Crill, P. A. (1977). Sedimentation and climatic patterns in the Santa Barbara Basin during the 19th and 20th centuries. Geol. Soc. Am. Bull. 88, 1161–1172. doi: 10.1130/0016-7606(1977)88<1161:SACPIT>2.0.CO;2
Sun, M.-Y., Aller, R. C., Lee, C., and Wakeham, S. G. (2002). Effects of oxygen and redox oscillation on degradation of cell-associated lipids in surficial marine sediments. Geochim. Cosmochim. Acta 66, 2003–2012. doi: 10.1016/S0016-7037(02)00830-X
Teske, A., Durbin, A., Ziervogel, K., Cox, C., and Arnosti, C. (2011). Microbial community composition and function in permanently cold seawater and sediments from an Arctic Fjord of Svalbard. Appl. Environ. Microbiol. 77, 2008–2018. doi: 10.1128/AEM.01507-10
Vetter, T. A., Perdue, E. M., Ingall, E., Koprivnjak, J.-F., and Pfromm, P. H. (2007). Combining reverse osmosis and electrodialysis for more complete recovery of dissolved organic matter from seawater. Sep. Purif. Technol. 56, 383–387. doi: 10.1016/j.seppur.2007.04.012
Walker, B. D., Beaupré, S. R., Guilderson, T. P., McCarthy, M. D., and Druffel, E. R. M. (2016a). Pacific carbon cycling constrained by organic matter size, age and composition relationships. Nat. Geosci. 9, 888–891. doi: 10.1038/ngeo2830
Walker, B. D., Primeau, F. W., Beaupré, S. R., Guilderson, T. P., Druffel, E. R. M., and McCarthy, M. D. (2016b). Linked changes in marine dissolved organic carbon molecular size and radiocarbon age. Geophys. Res. Lett. 43, 10385–10393. doi: 10.1002/2016GL070359
Keywords: pore water, DOM, carbon, NMR, sediment, anoxic, marine, Santa Barbara Basin
Citation: Fox CA, Abdulla HA, Burdige DJ, Lewicki JP and Komada T (2018) Composition of Dissolved Organic Matter in Pore Waters of Anoxic Marine Sediments Analyzed by 1H Nuclear Magnetic Resonance Spectroscopy. Front. Mar. Sci. 5:172. doi: 10.3389/fmars.2018.00172
Received: 11 January 2018; Accepted: 30 April 2018;
Published: 25 May 2018.
Edited by:
Jiasong Fang, Hawaii Pacific University, United StatesReviewed by:
Yuan-Pin Chang, National Sun Yat-sen University, TaiwanJun-Jian Wang, Southern University of Science and Technology, China
Yunping Xu, Shanghai Ocean University, China
Copyright © 2018 Fox, Abdulla, Burdige, Lewicki and Komada. This is an open-access article distributed under the terms of the Creative Commons Attribution License (CC BY). The use, distribution or reproduction in other forums is permitted, provided the original author(s) and the copyright owner are credited and that the original publication in this journal is cited, in accordance with accepted academic practice. No use, distribution or reproduction is permitted which does not comply with these terms.
*Correspondence: Tomoko Komada, dGtvbWFkYUBzZnN1LmVkdQ==
†Present Address: Christina A. Fox, Materials Science Division, Lawrence Livermore National Laboratory, Livermore, CA, United States