 Marcelo H. Gutiérrez1,2*
 Diego Narváez1,2,3
 Giovanni Daneri2,4Paulina Montero2,4
 Iván Pérez-Santos2,5
 Silvio Pantoja1,2
- 1Departamento de Oceanografía, Universidad de Concepción, Concepción, Chile
- 2COPAS Sur-Austral, Universidad de Concepción, Concepción, Chile
- 3Centro para el Estudio de Forzantes Múltiples sobre Sistemas Socio-Ecológicos Marinos (MUSELS), Concepción, Chile
- 4Centro de Investigación en Ecosistemas de la Patagonia, Coyhaique, Chile
- 5Centro i~mar, Universidad de Los Lagos, Puerto Montt, Chile
Since microorganisms play a major role in the biogeochemistry of the ocean, understanding structure and dynamics of natural microbial communities is crucial in assessing the impact of environmental changes on marine ecosystems. In order to identify key environmental drivers of microbial community structure in Chilean Patagonian fjords, we analyzed composition of the prokaryotic community over an annual cycle at a single sampling site in Puyuhuapi Fjord. Distinctive communities represented mainly by Actinomycetales, Rhodobacteraceae, Cryomorphaceae, and Flavobacteriaceae were associated with Estuarine Fresh Waters, whereas Cenarchaeaceae and Oceanospirillales were representative of Modified Sub Antarctic Waters present in the fjord. Salinity and oxygen were first-order factors explaining segregation of microbial communities in these contrasting water masses. Positive correlations of members of Flavobacteriaceae, Alteromonadales, and Verrucomicrobiales with diatoms in subsurface waters and of Flavobacteriales (Cryomorphaceae and Flavobacteriaceae), Rhodobacteraceae, and Pelagibacteraceae with dinoflagellates in surface waters suggest that phytoplankton composition could define specific niches for microorganisms in Puyuhuapi fjord waters. A dramatic reduction of richness and individual abundances within Flavobacteriaceae, Rhodobacteraceae, and Cenarchaeaceae families was principally explained by seasonal increase of surface water temperature, with major reduction associated with changes in temperature during winter conditions. Taxa that are sensitive to increased temperature are key components of organic matter and element cycling, and we therefore suggest that potential decrease in diversity associated with rising of surface water temperature could impact current biogeochemical status of Patagonian fjord ecosystems.
Introduction
Since their transitional position between terrestrial environment and the open ocean, coastal ecosystems play a major role in biogeochemical cycles of elements and organic matter (Gattuso et al., 1998). Natural and human-induced climate change and human activity influence both the physics and chemistry of the coastal ocean, with consequences for the physiology and behavior of organisms, and the structure and functioning of ecosystems (e.g., Diaz and Rosenberg, 2008; Doney, 2010; Tyrrell, 2011). Microorganisms have rapid turnover times and play a major role in biogeochemical cycling of elements in the ocean (e.g., Azam, 1998; Arrigo, 2005; Falkowski et al., 2008), therefore community responses of microbes to climate variability could result in consequential effects on the biogeochemistry of the ocean.
The structure of microbial communities in the ocean displays vertical and horizontal patterns associated with variations in physicochemical and biological conditions (Giovannoni and Stingl, 2005; Zinger et al., 2011; Walsh et al., 2015) that can be modified by variations in environmental factors over a range of time scales (Fuhrman et al., 2006, 2015; Smith et al., 2010; Giovannoni and Vergin, 2012; Ottesen et al., 2012). At seasonal scale, marine microorganisms display recurrent patterns of diversity driven by abiotic and biotic factors depending on specific environments (Fuhrman et al., 2006, 2015; Bryant et al., 2016; Bunse and Pinhassi, 2017). In coastal ecotones, spatial variability of prokaryotic diversity can be driven by salinity variations (Herlemann et al., 2011; Campbell and Kirchman, 2013; Fortunato and Crump, 2015), whereas temporal variations in community structure appear to be related to seasonal changes of temperature, day length, nutrient concentrations, and river flow (Andersson et al., 2010; Gilbert et al., 2012; Fortunato et al., 2013; El-Swais et al., 2015). In addition, phytoplankton dynamics can also be an important factor explaining seasonal variability of prokaryotic communities (Pinhassi and Hagström, 2000; Gilbert et al., 2012; Chow et al., 2013; El-Swais et al., 2015). In fjord waters, spatial (across channel) and seasonal variations in microbial community composition have been linked to availability of nutrients (Storesund et al., 2015) and, in glacial fjords to variation in melt water discharge (Piquet et al., 2010; Zeng et al., 2013; Gutiérrez et al., 2015).
The Patagonian fjord ecosystem is one of the world's largest estuarine environments. This ecosystem is greatly influenced by rivers and the Patagonian Ice Fields (Pickard, 1971) and supports high rates of biological productivity and vertical export fluxes of carbon (Pantoja et al., 2005; González et al., 2010, 2011, 2013; Montero et al., 2011, 2017a,b). The Patagonian fjord ecosystem as a whole is considered to represent a net sink of CO2 (Torres et al., 2011; González et al., 2013) and of enhanced sedimentary burial of organic carbon (Sepúlveda et al., 2011; Smith et al., 2015). Previous studies within this coastal ecosystem have highlighted the role of winds, low-pressure systems, and freshwater discharge in driving cycles of biological productivity and composition of the phytoplankton community at seasonal and shorter time scales (Montero et al., 2011, 2017a,b). Changes in the composition of microbial communities have also been related to seasonal variations in glacial melting (Gutiérrez et al., 2015). Over longer time scales, there is a challenge to connect variability in microbial community structure to climatic variability, such as the trends already detected in Patagonia in precipitation (Quintana and Aceituno, 2012), drying (Garreaud et al., 2013), fresh water discharge (Iriarte et al., 2016), and sea surface temperature (Lara et al., 2016).
Here we studied potential environmental drivers of microbial community structure by investigating temporal variability in diversity of prokaryotes in relation to physical and chemical properties of waters of the Puyuhuapi Fjord. Our results bring valuable information on key-modulating environmental factors of the structure of microbial communities, their utility as predictors of microbial diversity and the potential effect on functioning of fjord ecosystems under climatic changes expected for Chilean Patagonia.
Materials and Methods
Study Area and Sampling
Sampling was carried out in the central-northern section of the Puyuhuapi Fjord (Figure 1A), at a single sampling site where an oceanographic buoy equipped with a YSI 6600 V2-4 multiparameter probe has been continuously recording meteorological and hydrographic data since 20101 Puyuhuapi Fjord is ca. 90 km in length, situated between 44° 19′ and 44° 57′ S in Chilean Patagonia, and connected with the coastal ocean through the Jacaf and Moraleda channels to the north and south respectively (Figure 1A). The fjord is characterized by a complex bathymetry, with maximum depths of ca. 400 m and the presence of several sills that restrict the exchange of waters between inner basins and adjacent channels (Figure 1A). Puyuhuapi Fjord receives freshwater from the discharges of the Cisnes and Ventisquero rivers (annual average of 218 and 40 m−3 s−1, respectively; Calvete and Sobarzo, 2011), combined with direct precipitation (≥2,000 mm per year), runoff, ice, and snow melting and input of minor rivers and streams. The water column of Puyuhuapi Fjord shows a seasonal stratification/mixing cycle varying from highly stratified during spring and summer to partially mixed in winter (Schneider et al., 2014).
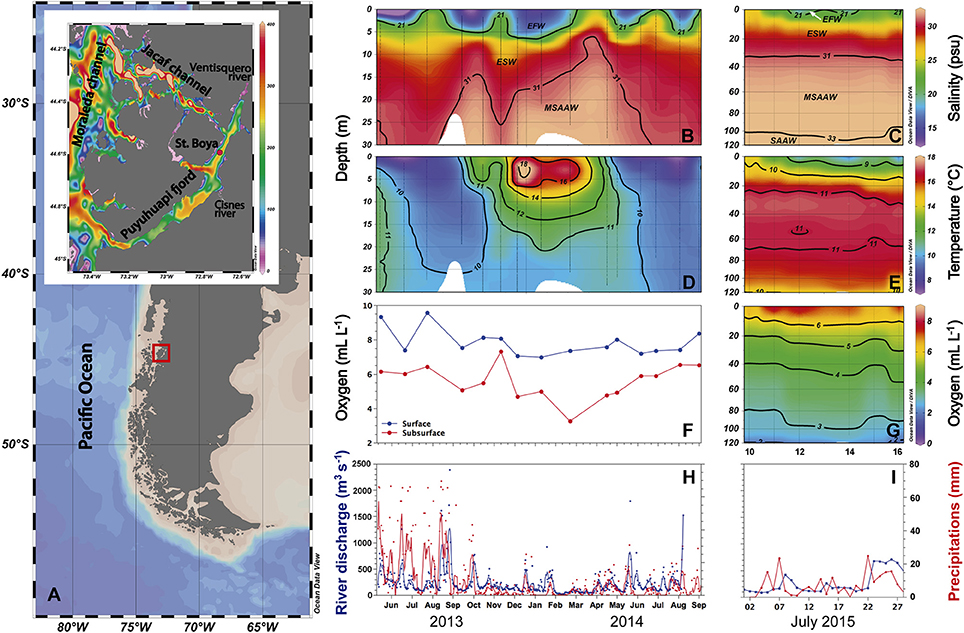
Figure 1. General study area and site of the Boya Puyuhuapi time series sampling station (St. Boya) in Puyuhuapi Fjord (A). The color scale represents bathymetry in meters. Temporal variability in salinity (B,C) and temperature (D,E) through the upper 30 m of the water column between June 2013 and September 2014, and between the surface and 120 m depth during July 2015. Dissolved oxygen is shown for the same period at surface (2 m) and subsurface (20 m) depths in the 2013-2014 time series and between surface and 120 m depth during July 2015 (F,G). (H,I) show variability of Cisnes River discharge (blue) and precipitation (red), lines represent daily averages of hourly measurements. Vertical sections of salinity (B,C) show distribution of water masses in the fjord: EFW (Estuarine Fresh water), ESW (Estuarine Salty Water), MSAAW (Modified Subantarctic Water), and SAAW (Subantarctic Water) according to the criteria proposed by Sievers and Silva (2008).
Water samples were collected monthly from June 2013 to September 2014 using Niskin bottles deployed from a boat, both from near surface water (2 m) and from 20 m depth (Table 1). Additionally, in July 2015 the water column was sampled every second day over 7 days at 5 standard depths between 1 and 100 m (Table 1). Water samples were stored in the dark at in situ temperature in acid-cleaned containers prior to processing. Hydrographic data were recorded during the 2013-2014 period using a CTD Ocean Seven 304 (IDRONAUT, Italy) and in winter 2015 using a CTD SeaBird 25. Oxygen concentrations in surface and subsurface waters were determined using the Winkler method (Strickland and Parsons, 1972).
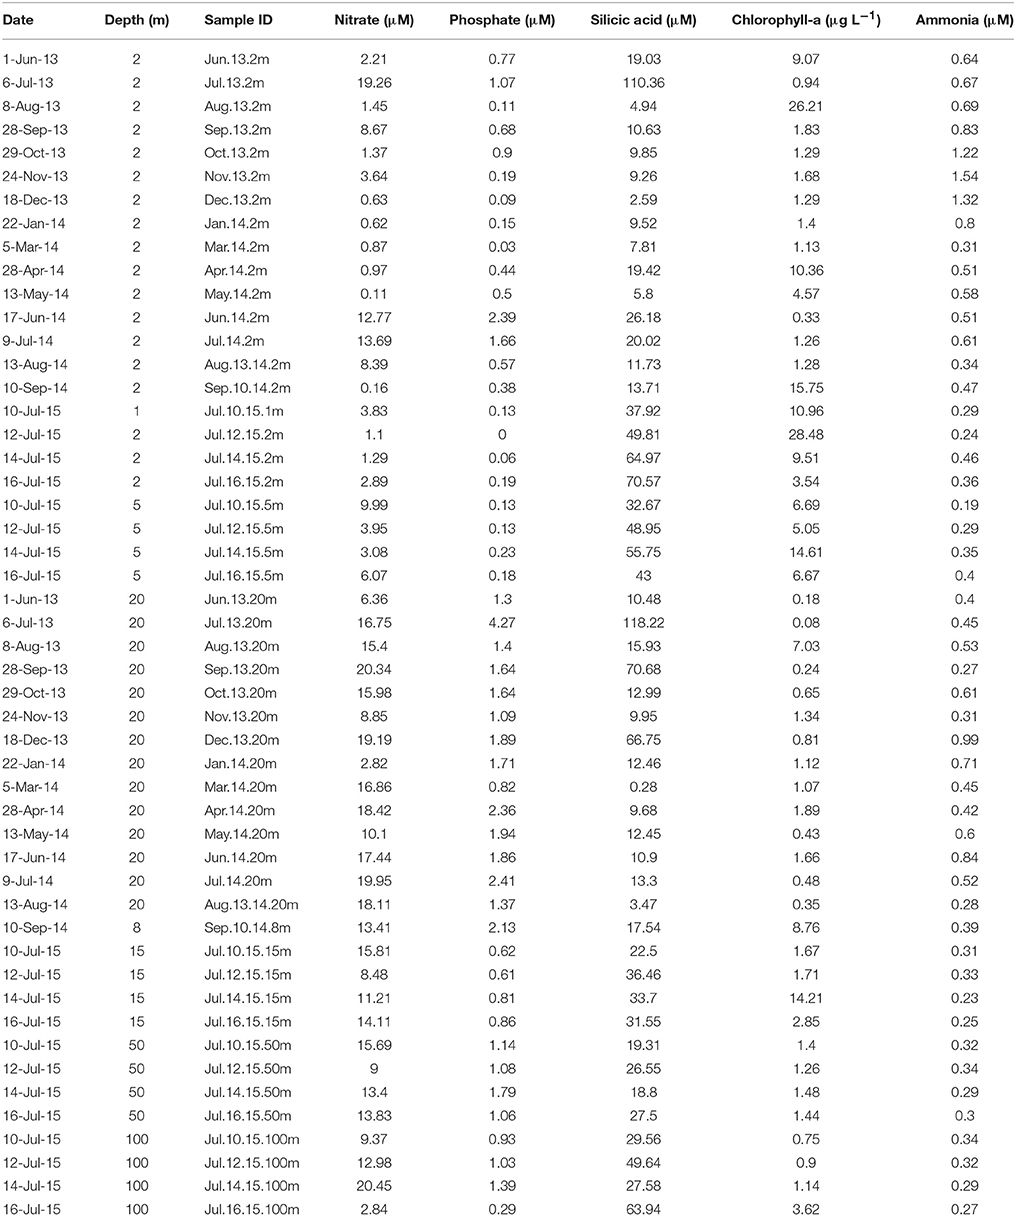
Table 1. Sample ID and chemical and biological characteristics of the waters sampled between June 2013 and September 2014, and during July 2015, at the Boya Puyuhuapi site in Puyuhuapi Fjord.
Within 4 h after collection, 1 L aliquots of water samples from the Niskin bottles were filtered through 0.22 μm sterile membrane filters (Millipore) and stored at −20°C prior to processing for DNA analysis. Samples for determination of chlorophyll-a and inorganic nutrients were collected by filtration of 1 L seawater through pre-combusted (4 h at 450°C) 0.7 μm glass fiber filters (Whatman GF/F). Chlorophyll-a was analyzed using the fluorometric method of Parsons et al. (1984), and inorganic nutrients by spectrophotometry (Solorzano, 1969; Strickland and Parsons, 1972).
DNA Extraction and Sequencing
DNA on filters was extracted using a PowerWater® DNA Isolation Kit and cleaned using a Power Clean® DNA Clean-up Kit (MOBIO Laboratories). Prokaryotic (Bacteria plus Archaea) 16S rRNA genes were amplified using primer set 515F (5′-GTGCCAGCMGCCGCGGTAA-3′) and 806R (5′-GGACTACHVGGGTWTCTAAT-3′). Amplification and sequencing on an Illumina MiSeq platform were conducted in a commercial laboratory (Research and Testing Laboratory, Lubbock, TX, USA).
Sequence Data Processing
The full MiqSeq data set is available at the National Center for Biotechnology Information Sequence Read Archive under the accession numbers SRR5155509 to SRR5155558. Paired Illumina reads were processed using QIIME software package version 1.9.1 (Caporaso et al., 2010). Default QIIME parameters (r = 3, p = 0.75, q = 3, n = 0) were adopted for quality filtration as recommended by Bokulich et al. (2013). Removal of potential chimeras was carried out using VSEARCH software version 1.10.2 (VSEARCH GitHub repository) and Uclust was used to cluster Operational Taxonomic Units (OTUs) at a 97% similarity threshold. Representative sequences from each OTU were classified by comparison with the Greengenes database (DeSantis et al., 2006).
Analysis of beta and alpha diversity (Chao1) was carried out after removal of sequences identified as Chloroplast and after resampling with the rarefaction method using the minimum number of sequences per sample (13036). Similarity was estimated at the OTU level based on the Bray-Curtis distance matrix index and then used as input to carry out Non-Metric Multidimensional Scaling (NMDS) ordination analysis in R version 3.1.2 using the package vegan (Oksanen et al., 2013). Environmental variables were fitted onto NMDS plot using the function envifit of the package vegan. Statistical differences in the community composition between water masses were tested by PERMANOVA analysis in R. OTU heatmaps were produced using filtered OTU table to identify the contribution of the main representative individual OTUs (representative OTUs defined as those containing more than 1,000 sequences) to the overall community composition of each sample. Rarefaction curves for each prokaryotic community were generated from the means of 10 randomized data sets in Qiime. The Mann-Whitney non-parametric U-test was applied to test for statistical differences among depths (surface: 1–5 m n = 22, subsurface: 8–20 m n = 19 and deep: >50 m n = 7) for environmental variables and community diversity, and the Kruskal-Wallis non-parametric test for differences in OTU abundance among water masses, between cold (June-September, n = 19) and warm (October-May, n = 7) periods, and differences in winter temperatures between 2010 and 2016. The Spearman correlation index was calculated to analyze associations between abundance of representative OTUs and environmental variables.
Results
Environmental Variability
Vertical sections of salinity in the water column (Figures 1B,C) showed variable contributions of Estuarine Fresh Water (EFW, 11–21 psu) and Estuarine-Salty Water (ESW, 21–31 psu) within the top 5 m. Between 5 and 30 m depth, ESW dominated during winter, whereas the influence of Modified Sub-Antarctic Waters (MSAAW, 31–33 psu) increased from austral spring 2013 and autumn 2014 (Figure 1B). In July 2015 (austral winter), MSAAW was distributed from ~30 to ~100 m depth and Sub-Antarctic Water (SAAW, >33 psu) was present in waters below 100 m (Figure 1C). Temperature distribution in the top 30 m was characterized by a strong seasonality (Figures 1E,D), with cold waters (<10°C) in surface and subsurface layers during austral winter followed by an increase in temperature (>15°C) in the top 10 m during austral summer (December 2013–March 2014; Figure 1D). In austral winter, low temperatures coincided with periods of increased river discharge and precipitation (Figures 1D,H). Oxygen concentration was higher in surface (ca. 7 to 10 mL L−1) than subsurface waters (3 to 7 mL L−1, Figure 1F), where oxygen concentrations lower than 5 mL L−1 were observed between December 2013 and April 2014 coinciding with the presence of higher salinity MSAAW (Figure 1F). During July 2015, the presence of hypoxic waters (<2 mL L−1) was observed below 120 m (Figure 1G).
Nitrate (1 to ~20 μM) and phosphate (~0 to 4.3 μM) concentrations were lower in surface (1–5 m) than subsurface and deeper waters during most of the study period (Table 1). Silicic acid concentrations were highly variable (<1 to >100 μM) with maximum values detected in austral winter in surface waters, and during winter and spring in subsurface waters (Table 1). Ammonia concentration ranged from 0.2 to 1.5 μM with maximum values in spring and summer (October–December; Table 1). Chlorophyll-a concentrations varied from ~1 to >25 μg L−1 in surface waters, with maximal values observed in autumn, winter and spring (Table 1). There were significant differences in nitrate, phosphate and chlorophyll-a concentrations between surface and subsurface waters, and in nitrate, phosphate, and ammonia between surface and deep waters (Table 2).
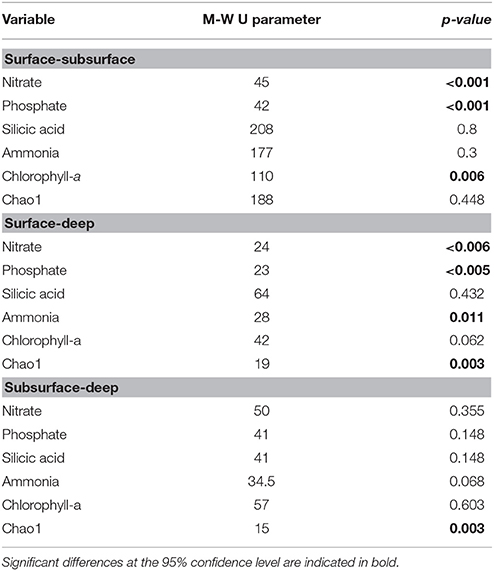
Table 2. Statistical differences between surface and subsurface waters for environmental variables and prokaryotic richness based on the Mann-Whitney non-parametric U-test.
Prokaryotic Community Diversity
Prokaryotic diversity was examined by comparing the distribution of 3250730 16S rRNA gene sequences of Bacteria and Archaea (Table 3), which corresponded to 13807 OTUs assigned to Bacteria and 413 to Archaea after removal of chimera and chloroplast sequences. Rarefaction curves (Supplementary Figure 1) showed that all samples had reached the curvilinear phase of sampling effort, and that most had started to plateau. Of a total of 9376 different OTUs identified after resampling, 11% of these were common to surface, subsurface and deep waters, with the highest percentage of shared OTUs (28%) common to surface and subsurface waters (Figure 2). OTU richness estimated by Chao1 ranged from 623 to 2,914 in surface waters, between 962 and 1,798 in subsurface waters and from 481 to 1,270 in deep waters (Figure 3). Chao1 values estimated for surface and subsurface waters were significantly different to those estimated for deep waters (Table 2). The highest values of Chao1 (>2,000) in surface waters were observed during winter 2013, 2014, and 2015, whereas the lowest values of OTU richness were found in summer 2014 coinciding with the seasonal increase in surface water temperature (Figure 3A). Significant differences (Mann-Whitney U = 23, p = 0.03) were observed for Chao1 values for surface waters between cold (June-September) and warm (October-May) periods (duration of cold and warm periods was defined according to short-term monthly average temperature reported by Schneider et al., 2014). In subsurface waters, values of Chao1 were less variable, with lower values (<1,500) found in summer and coinciding with increases in salinity and temperature and a decrease in oxygen concentration (Figures 1, 3B). In July 2015, with the exception of July 14 when extremely low values were observed in the top 5 m, vertical distribution of Chao1 was characterized by high values in surface waters and a decrease with depth (Figures 3C–F). Chao1 was negatively correlated with temperature (Spearman R = −0.53, p < 0.001), positively correlated with oxygen (Spearman R = 0.40, p = 0.005) and showed a weak correlation with ammonia concentration (Spearman R = 0.30, p = 0.035; Table 4).
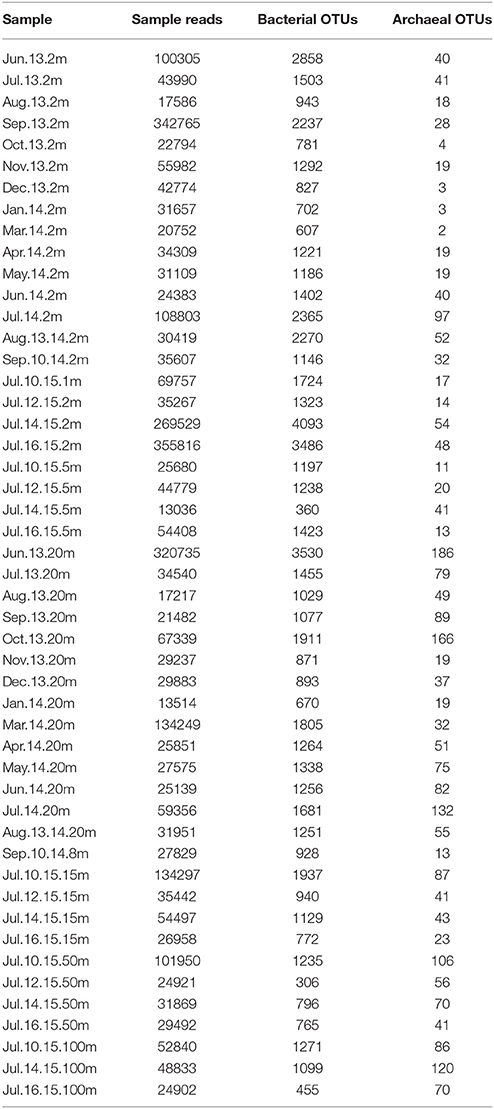
Table 3. Number of sequences and OTU abundance (after resampling) detected for prokaryotic assemblages in water samples from Puyuhuapi Fjord.
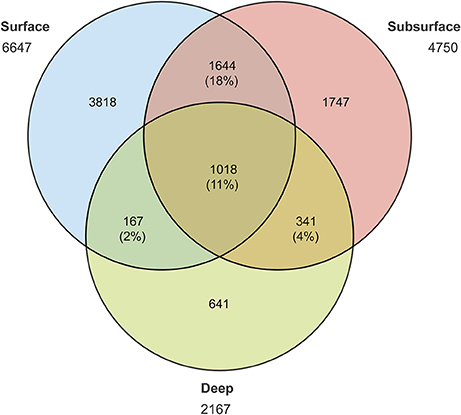
Figure 2. Venn diagram comparing the number of prokaryotic OTUs found in surface (1–5 m), subsurface (8–20 m), and deep (>50 m) waters of Puyuhuapi Fjord. Abundance and percentage of shared OTUs are also indicated.
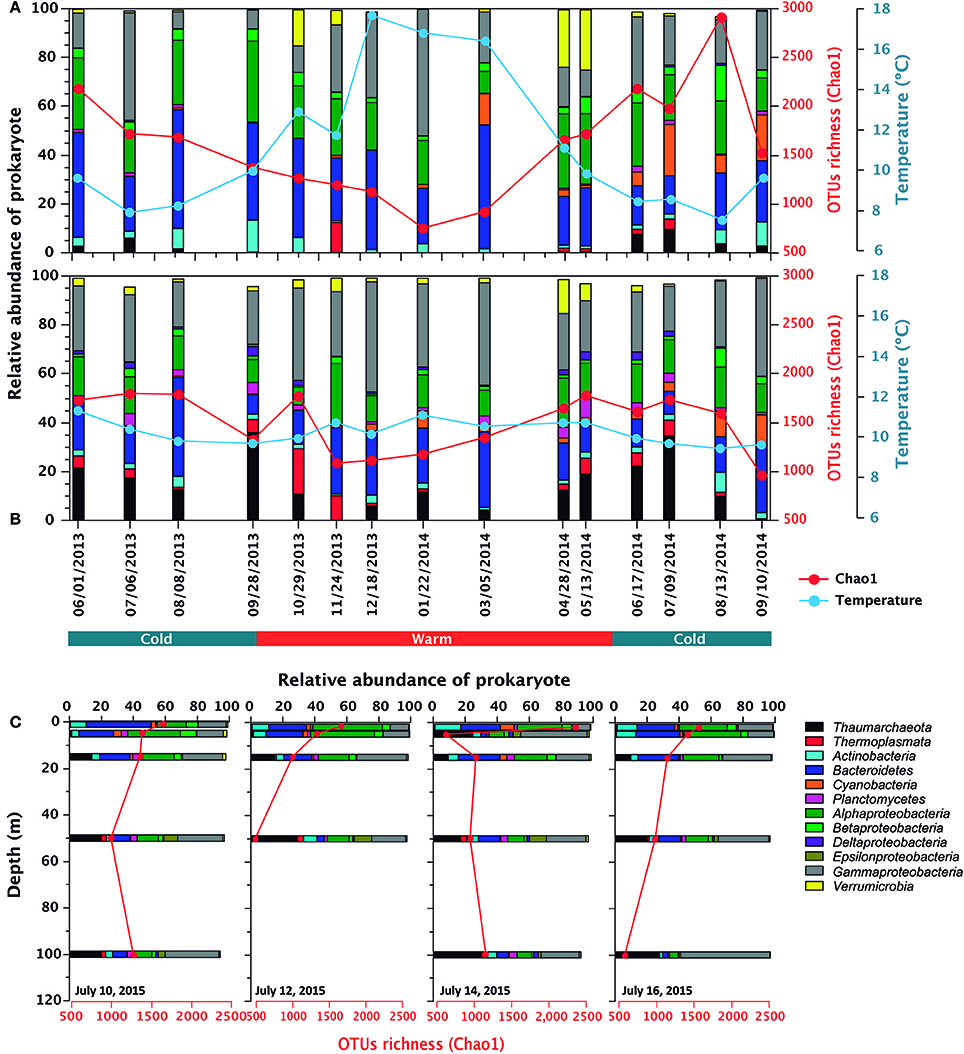
Figure 3. Temporal variability in relative abundance (percentage of total sequences) of higher level taxa (phylum and classes) of prokaryotes, OTU richness (Chao1, red line) and temperature (blue line) in surface (A) and subsurface (B) waters (2 and 20 m, respectively) between June 2013 and September 2014 at the Boya station in Puyuhuapi Fjord. Vertical profiles of richness and relative abundance (C) are also shown from 10 July to 16 July 2015. Variation in vertical distribution of OTU richness and composition observed in July 14 was related to a strong mixing event resulting from the passage of a low-pressure system (Montero et al., 2017b).
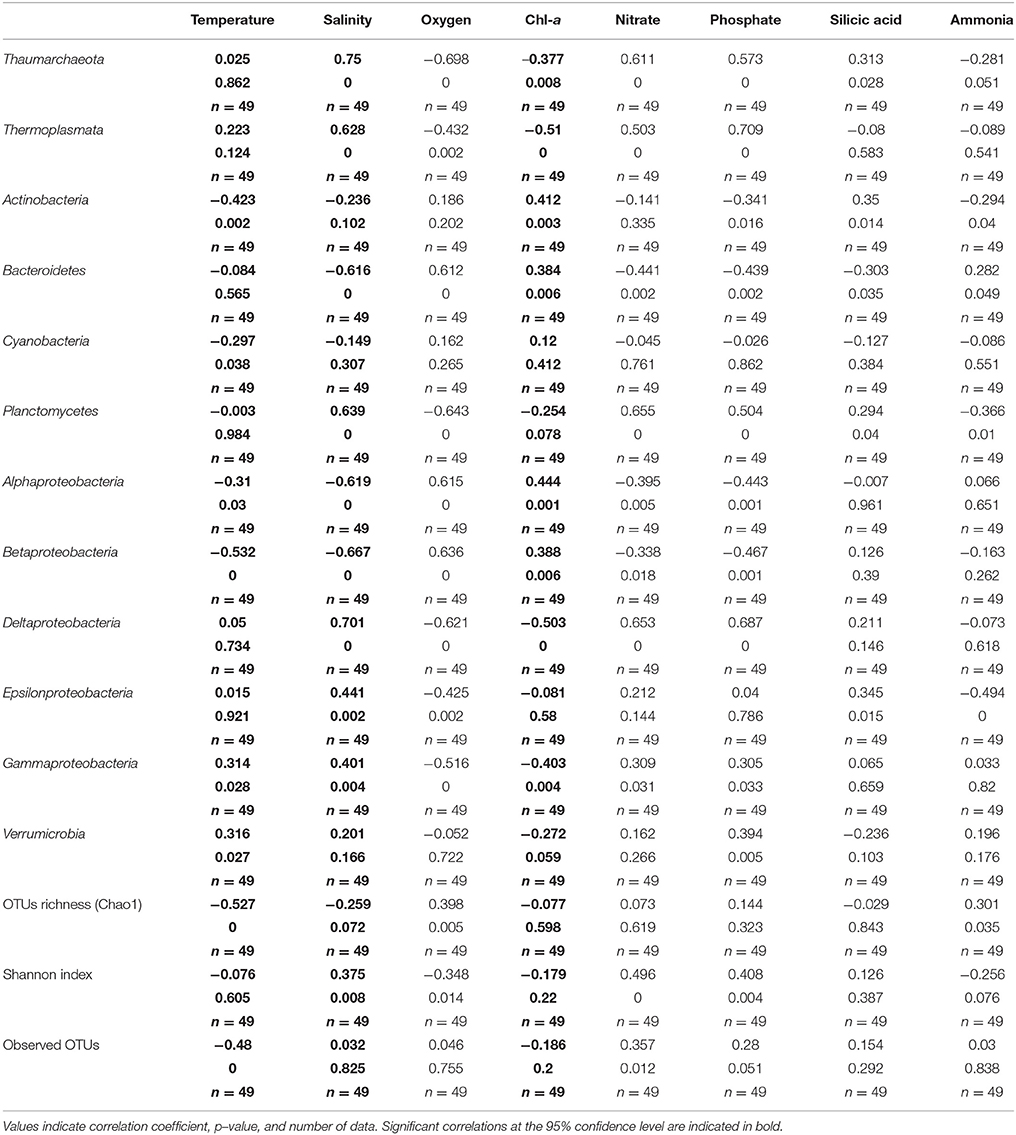
Table 4. Spearman correlation coefficients between major taxonomic groups and OTUs richness, and diversity, and environmental and biological parameters of waters of Puyuhuapi Fjord.
Prokaryotic Community Composition
At phylum and class levels, the composition of prokaryotic assemblages in surface waters was characterized by predominance of classes Flavobacteriales (Bacteroidetes) and Alpha- and Gammaproteobacteria, which together accounted for up to 90% of total sequences during Austral summer (Figure 3A). Subsurface waters were characterized by Thaumarchaeota which accounted for 5 to 40% of prokaryotic sequences, and by Gammaproteobacteria and Bacteroidetes which accounted for 18 to ~45% and up to 30% of total sequences, respectively (Figure 3B). With a relatively low proportion of total sequences, Verrumicrobia, Cyanobacteria (mostly picocyanobacteria of order Synechococcales), Actinobacteria, and Betaproteobacteria were more abundant in surface than in subsurface waters, whereas Planctomycetes and Deltaproteobacteria were more frequently detected in subsurface waters (Figures 3A,B). In July 2015, with the exception of July 14, prokaryotic composition in the top 20 m was similar to that observed in the 2013-2014 time series, whereas in deep waters OTUs of Thaumarchaeota and Gammaproteobacteria predominated and sequences of Epsilonproteobacteria increased their relative abundance (Figure 3C). Relative abundances of Thaumarchaeota, Thermoplasmata, Planctomycetes, and Deltaproteobacteria were significantly and positively correlated with salinity, nitrate and phosphate, and Bacteroidetes and Alpha- and Betaproteobacteria positively correlated with oxygen concentration (Table 4). On the contrary, significant negative correlations were observed for relative abundance of Thaumarchaeota, Planctomycetes, and Delta- and Gammaproteobacteria with oxygen, Bacteroidetes, Alpha- and Betaproteobacteria with salinity, and Thermoplasmata and Deltaproteobacteria with chlorophyll-a (Table 4).
At the OTU level, non-metric multidimensional scaling (NMDS, based on Bray–Curtis distance matrix) evidenced variations in composition of prokaryotic communities among water masses, with distinguishable patterns of distribution for samples from EFW and MSAAW, whilst communities from ESW overlapped those from EFW and MSAAW (Figure 4). Segregation of prokaryotic communities amongst these waters masses was mostly explained by variations in salinity and oxygen concentration, whilst temperature and ammonia concentration were likely responsible for variations of composition between cold and warmer periods, particularly in EFW (Figure 4). PERMANOVA analysis showed significant differences between compositions of prokaryotic communities among water masses (p-value < 0.001, Pseudo-F = 5.73) and cold and warm periods (p-value < 0.001, Pseudo-F = 5.71). Among OTUs with more than 1000 counts (Figure 5, Table 5), 62% showed significant differences in their abundance (Kruskal-Wallis, p < 0.05) between EFW and MSAAW, 47% between ESW and MSAAW, 42% between EFW and ESW, and ~33% between EFW, ESW and MSAAW. Based upon the distribution of OTU abundances among samples, and upon correlations with principal explanatory environmental variables, we identified taxa that were representative of the two water masses (Figure 5, Table 5).
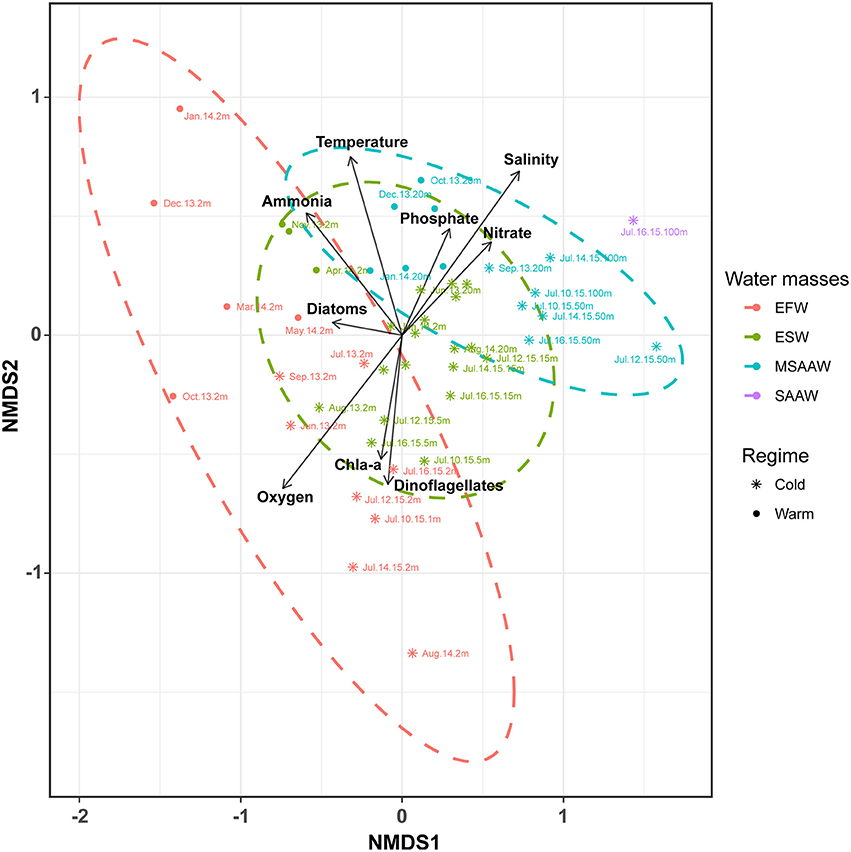
Figure 4. Non-Metric Multidimensional Scaling ordination (NMDS) based on Bray-Curtis similarity analysis of prokaryotic communities identified in waters of the Puyuhuapi Fjord. Stress = 0.13. Colors represent predominant water masses and the ellipse shows the limits (at 95% confidence) of each water mass in the ordination space. Different symbols indicate samples collected during cold (June-September) and warm periods (October-May), and arrows represent environmental variables significantly correlated (p < 0.05) to the ordination axis. Arrows point the direction of the higher gradient (most rapid change) and their lengths are proportional to the degree of correlation with ordination.
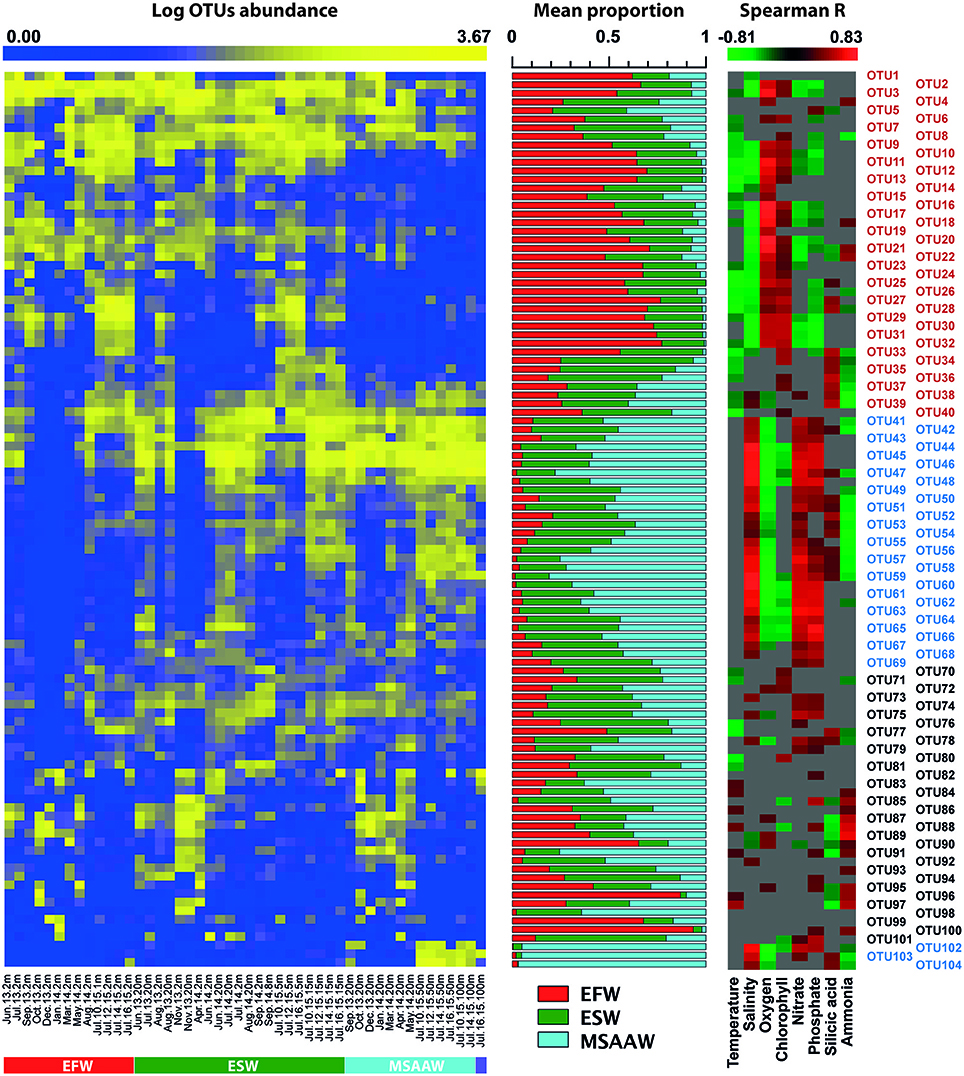
Figure 5. Heatmap displaying the abundance of representative OTUs in water samples collected in Puyuhuapi Fjord (samples were sorted according to their distribution among water masses, left panel). Mean relative contribution of representative OTUs to microbial communities present in predominant water masses (middle panel) and heatmap showing significant (p < 0.05) correlation coefficients between OTUs and environmental factors (right panel). Colors in the text of the right panel indicate OTUs considered representative of EFW (red) and MSAAW (blue). Gray color in right panel indicates no significant correlation. Representative OTUs account for over 70% of total counts in rarefied OTU table and included OTUs with more than 1,000 counts.
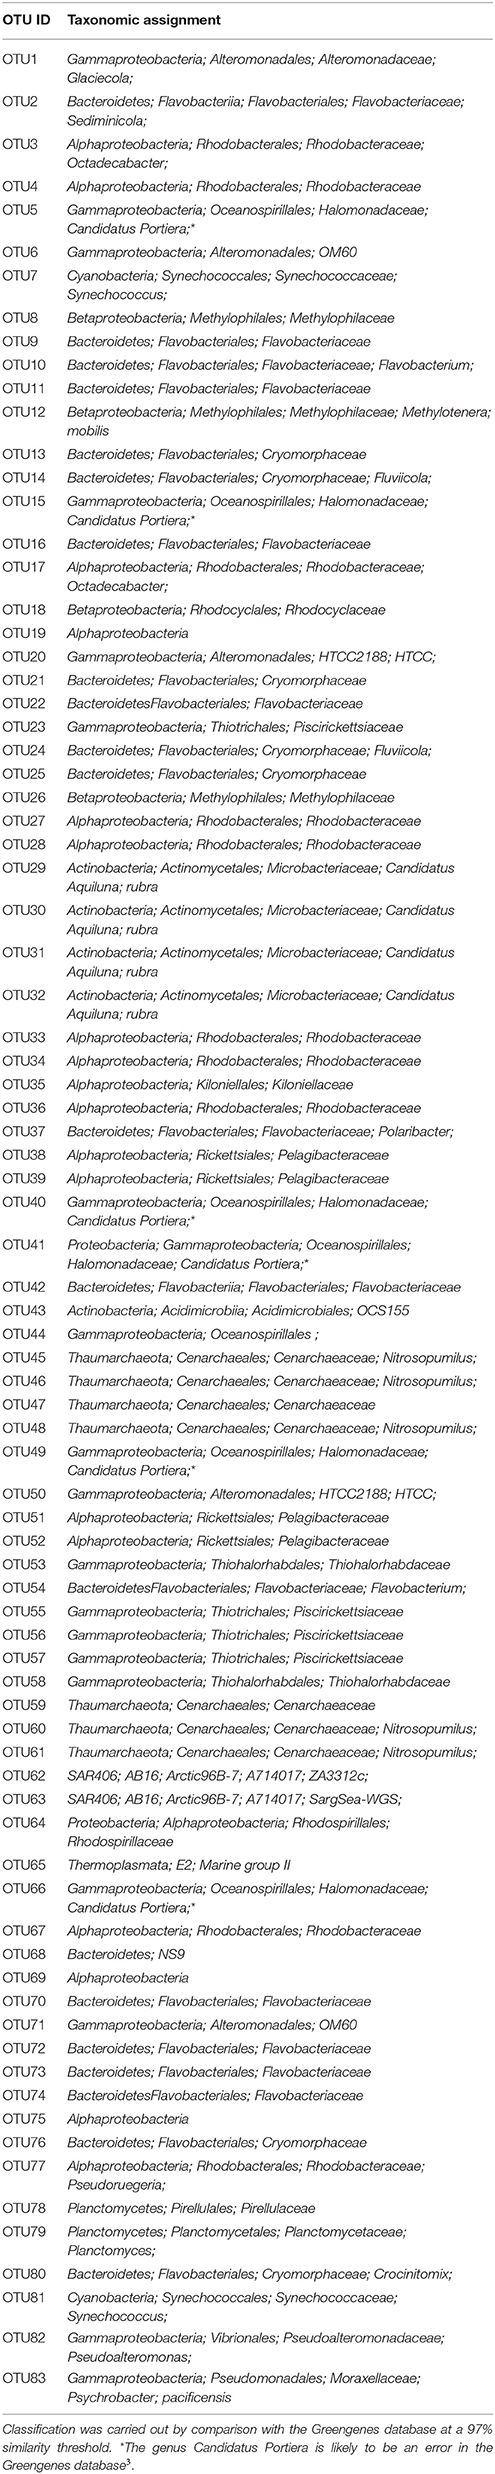
Table 5. Taxonomic assignment for main representative OTUs (OTUs containing more than 1000 sequences) identified in waters of Puyuhuapi Fjord.
Temporal Variability of Prokaryotic Community
At higher taxonomic levels, temporal variability of community composition in surface waters was mostly characterized by opposing changes in the relative abundance of Bacteroidetes and Gammaproteobacteria (Figure 3A). These changes coincided with an increase in temperature between late austral winter 2013 (September) and summer 2014 (March) and a decrease in OTU richness (Figure 3A). Additionally, sequences of Cyanobacteria were more abundant during winter and spring 2014 and Verrumicrobia increased sharply during spring 2013 and autumn 2014 (Figure 3A). In subsurface waters, the proportion of Archaea increased sharply in spring 2013, and between autumn and winter 2014 (Figure 3B), coinciding with increases in salinity (Figure 1B).
At the OTU level, temporal variations were evidenced by loss of richness and decreased abundance in more than 65% of the representative OTUs of surface waters during austral summer (December 2013-March 2014; Figure 6, Table 5). Compared to surface waters, a low proportion of representative OTUs varied throughout the year in subsurface waters (Figure 7). The majority of OTUs that exhibited temporal changes were negatively correlated with temperature and ammonia concentration and positively with silicic acid concentration (Figure 6). Significant correlations were also detected between OTUs showing seasonal variability and abundance of diatoms and dinoflagellates (Supplementary Table 1) in surface and subsurface waters (Figures 6, 7). Significant differences (p < 0.05) were observed for OTU abundances between cold (June-September) and warm periods (October-May) in ~50% of representative OTUs of surface waters (Figure 6).
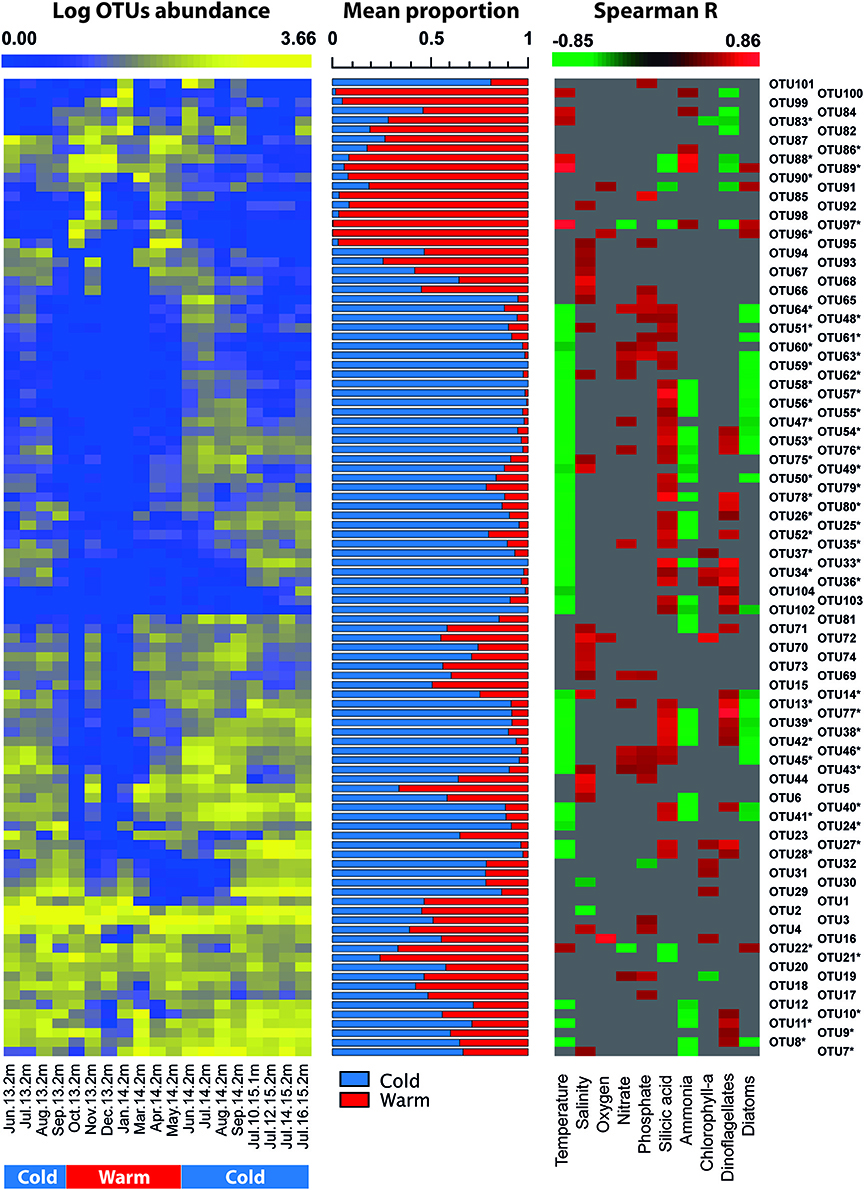
Figure 6. Heatmap displaying the time series of abundance of representative OTUs in surface waters of Puyuhuapi Fjord (left panel). Middle panel shows the mean relative contribution of representative OTUs to microbial communities detected during cold and warm periods. Right panel shows heatmap of significant (p < 0.05) correlation coefficients between OTU abundance and environmental factors. OTUs marked with * indicate those taxa that showed significant differences (p < 0.05) between cold and warm periods.
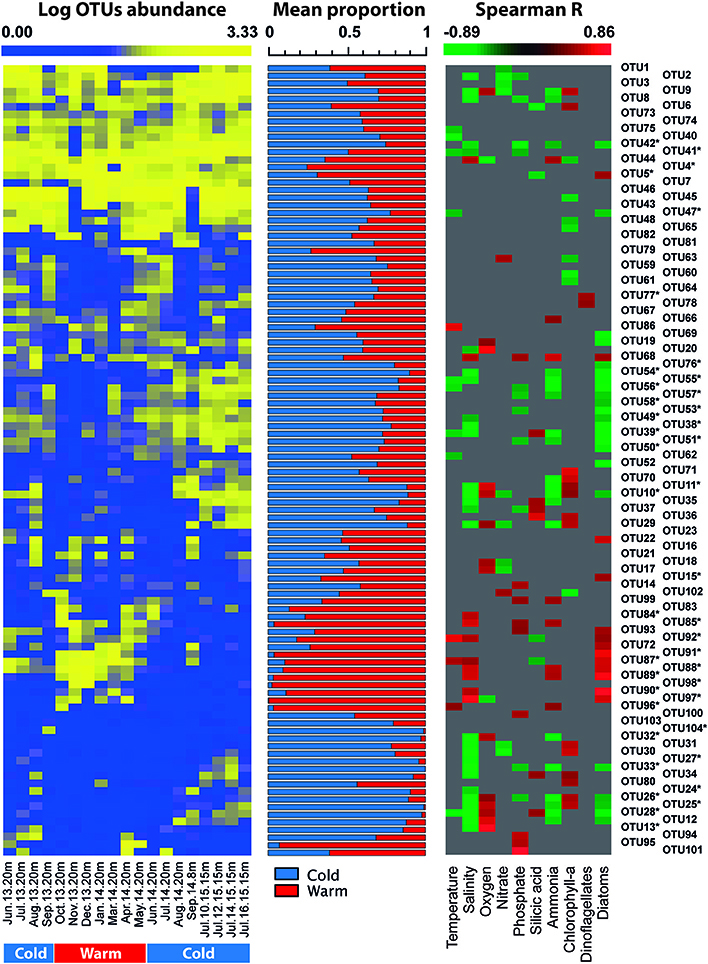
Figure 7. Heatmap displaying the time series of abundance of representative OTUs in subsurface waters of Puyuhuapi Fjord (left panel). Middle panel show the relative contribution of representative OTUs to microbial communities detected during cold and warm periods. Right panel shows heatmap of significant (p < 0.05) correlation coefficients between OTU abundance and environmental factors. OTUs marked with * indicate those taxa that showed significant differences (p < 0.05) between cold and warm periods.
Discussion
Vertical and temporal changes of the microbial community at a single sampling site within waters of Puyuhuapi Fjord were assayed by analyzing variability in the composition of prokaryotic assemblages in a monthly time series. Our data demonstrated distinctive prokaryotic assemblages in predominant waters masses in the fjord, with salinity and dissolved oxygen concentration explaining most of variability of these assemblages between waters masses. A dramatic reduction of OTU richness and abundance of representative taxa was observed in surface waters during austral summer associated with the seasonal increase of surface water temperature. Considering that microbial diversity is assumed to be directly linked to functioning of ecosystems (Bernhard and Kelly, 2016), we analyzed the potential implications of our observations for biogeochemical cycling in Patagonian fjords.
Community Composition of Prokaryotes in Water Masses of Puyuhuapi Fjord
The hydrographic structure of the water column observed during the study period was consistent with the estuarine circulation and water mass distribution previously described for Patagonian fjords generally (Silva et al., 1998; Sievers and Silva, 2008), and more specifically for Puyuhuapi Fjord (Schneider et al., 2014). Saline stratification of the water column of Puyuhuapi Fjord resulted in a vertical segregation of dissolved inorganic nutrients and chlorophyll-a concentrations, consistent with previous observations for a variety of biogeochemical parameters in other Patagonian fjords (González et al., 2013; Silva and Vargas, 2014; Gutiérrez et al., 2015; Ríos et al., 2016).
Consistent with this stratification of the water column, the composition of the prokaryotic community showed a discernible pattern of vertical zonation at higher taxonomic levels, with members of Bacteroidetes and Alpha- and Gammaproteobacteria dominating surface waters, and the presence of abundant sequences of Archaea in subsurface and deep marine waters (Figure 3). Our observations are consistent with reports showing predominance of the same taxa of bacteria in large brackish environments (Riemann et al., 2008), in estuaries and coastal saline gradients (Campbell et al., 2011; Herlemann et al., 2011; Fortunato et al., 2012; Fortunato and Crump, 2015), and in polar surface waters (Zeng et al., 2009; Teske et al., 2011; Prasad et al., 2014; Signori et al., 2014; Piquet et al., 2015) and Patagonian glacial fjords (Gutiérrez et al., 2015). For archaeal OTUs, predominance of members of the phylum Thaumarchaeota (including Marine group I Archaea) is consistent with this group being a major contributor to microbial diversity in estuarine waters and sediments (Webster et al., 2015; Xia et al., 2015), in polar waters (Bano et al., 2004; Galand et al., 2008, 2009a,b), in sea ice (Collins et al., 2010; Cowie et al., 2011) and in fjord environments (Zaikova et al., 2010; Gutiérrez et al., 2015). Regarding Thermoplasmata, most sequences were affiliated to the uncultured Marine group II, which represents a significant fraction of the archaeal community in estuarine waters (Xia et al., 2015) and coastal waters of the Arctic Ocean (Galand et al., 2008, 2009a), but in fjords appear to be poorly represented (Zaikova et al., 2010). The current understanding on Marine group II is rather limited compared with information presently available on Thaumarchaeota (Zhang et al., 2015), and our study presents valuable new information on distribution of this group in fjord environments where few data are available. Among other taxa, presence of Actinobacteria and Verrumicrobia is consistent with their significant contribution to microbial communities in estuarine environments (Riemann et al., 2008; Campbell and Kirchman, 2013; Fortunato et al., 2013; Fortunato and Crump, 2015). The observation of elevated abundance of picocyanobacteria is also consistent with their contribution to microbial diversity, phytoplankton biomass and primary productivity in estuarine and fjord environments (Stal et al., 1999; Hajdu et al., 2007; Piquet et al., 2014; Xia et al., 2015), including Patagonian fjords (Gutiérrez et al., 2015). Members of the phylum Planctomycetes and the classes Delta- and Epsilonproteobacteria were poorly represented and mainly restricted to more saline waters. Although these taxa make a low contribution to overall bacterial abundance (Zinger et al., 2011; Yilmaz et al., 2016), they do appear to be ubiquitous in marine environments and can play important roles in biogeochemical cycles of carbon, nitrogen and sulfur (Campbell et al., 2006; Fuerst and Sagulenko, 2011; Yilmaz et al., 2016).
Salinity and oxygen concentration exerted major controls on prokaryotic community composition among the contrasting water masses identified during the present study in Puyuhuapi Fjord (Figure 4). Salinity is known to be a major factor influencing global biogeography of microorganisms (Lozupone and Knight, 2007; Auguet et al., 2012) and the spatial variability of microbial communities along coastal ecotones (Herlemann et al., 2011; Campbell and Kirchman, 2013; Fortunato and Crump, 2015), including polar and fjord waters (Signori et al., 2014; Gutiérrez et al., 2015). Dissolved oxygen is also known to have a major influence on microbial diversity and activity in marine environments exhibiting strong vertical oxygen gradients (Stevens and Ulloa, 2008; Wright et al., 2012). In some brackish environments, where bottom topography can restrict water circulation and lead to hypoxia in deep waters, as suggested for Puyuhuapi Fjord (Schneider et al., 2014; Silva and Vargas, 2014), oxygen can represent a major factor in the structuring of microbial communities (Zaikova et al., 2010). Segregation of microbial communities among water masses in Puyuhuapi Fjord is consistent with studies showing identifiable microbial signatures in water masses of the North Atlantic (Teira et al., 2006; Varela et al., 2008), Arctic Ocean (Galand et al., 2009a,b, 2010; Hamdan et al., 2013), and in proglacial fjords of Patagonia (Gutiérrez et al., 2015). An exception to this pattern of distribution was the microbial community associated with Estuarine Saline Waters (ESW), which consisted of a combination of OTUs representative of Estuarine Fresh Waters (EFW) and Modified Sub Antarctic Waters (MSAAW). Since the microbial community within ESW did not show a distinctive microbial signature, we hypothesize that this community is composed of cosmopolitan prokaryotes adapted to a wide range of salinity and oxygen concentrations found in EFW and MSAAW.
The prokaryotic community identified in EFW (Figure 5, Table 5) was characterized by predominance of OTUs matching Candidatus Aquilina sp. (Actinomycetales) and members of the families Rhodobacteraceae, Cryomorphaceae (Alphaproteobacteria), and Flavobacteriaceae (Bacteroidetes). We suggest that the predominant physicochemical conditions of surface waters of Puyuhuapi fjord, driven mainly by riverine input and meltwater discharges, confer a distinctive microbial signature to EFW. This suggestion is supported by negative correlations between the abundance of representative taxa of EFW, and salinity, temperature, nitrate and phosphate, and positive correlations with concentrations of oxygen and silicic acid (Figure 5). Moreover, some of the representative OTUs of EFW, such as Fluviicola sp. and Candidatus Aquiluna sp., corresponded to taxa considered to be characteristic of freshwater, and of coastal environments strongly influenced by freshwater, including polar fjords (O'Sullivan et al., 2005; Kang et al., 2012). Our results for the microbial community within EFW also showed that OTUs of Rhodobacteraceae and Flavobacteriales were positively correlated with chlorophyll-a concentration. This is consistent with these taxa being considered to be specialized degraders of photosynthetic organic matter (e g., Roseobacter sp.; Buchan et al., 2014).
In saline and less oxygenated MSAAW the most abundant taxa (Figure 5, Table 5) corresponded to OTUs identified as Nitrosopumilus sp. (Cenarchaeaceae; ~21% of representative OTUs), the order Oceanospirillales (~16%) and the families Flavobariaceae and Piscirickettsiaceaea (~9% each). The order Nitrosopumilales corresponds to a group of ammonia-oxidizing Archaea widely distributed in the ocean, and playing an important role in nitrogen cycling (Offre et al., 2013), including the potential for production of the greenhouse gas nitrous oxide (Löscher et al., 2012). The high abundance of Nitrosopumilus sp. (up to 30% of total sequences in subsurface waters), suggests that microorganisms present in MSAAW contribute significantly to nitrification and nitrogen cycling in Puyuhuapi Fjord. Among other representative taxa, members of Oceanospirillales appear to play a role in degradation of hydrocarbons (Mason et al., 2012; Lamendella et al., 2014), Flavobacteriales are considered important degraders of phytoplankton detritus (Buchan et al., 2014) and Piscirickettsiaceaea include members recognized as fish pathogens and responsible for major losses in salmon farming industry (Rozas and Enríquez, 2014). The presence of this family is an important observation in the context of Puyuhuapi Fjord having a significant fraction of salmon farms in the Chilean Patagonia. The majority of representative taxa of MSAAW were significantly and positively correlated with salinity, dissolved inorganic nitrate and phosphate, and negatively correlated with dissolved oxygen. These observations are consistent with a marine source for microbial communities present in deeper layers of Puyuhuapi Fjord.
We recognize limitations of our study in terms of whether a single point sampling site is representative of the fjord as a whole. However, our data clearly demonstrate the association between distinct prokaryotic OTUs and predominant water masses, which support that our sampling strategy (two-layer sampling during 2013-2014 together with a high frequency vertical profiling in winter 2015) was able to capture most of variability of microbial communities present in waters of the fjord. These water masses have been described as representative of the majority of the Patagonian fjords (e g., Sievers and Silva, 2008; Pérez-Santos et al., 2014) and Puyuhuapi fjord particularly (Schneider et al., 2014). Considering that a parcel of water is supposed to have a relatively stable microbial composition under consistent conditions in the surrounding environment (Fuhrman et al., 2015), we argue that our observations on microbial diversity at the single station are at least highly representative of the Puyuhuapi fjord.
Main Drivers of Temporal Variability of Microbial Community in Puyuhuapi Fjord
Increase in temperature of surface waters during austral summer resulted in a dramatic reduction of Chao1 and in the abundance of more than 65% of the representative OTUs (Figures 3, 6). This relationship was further supported by a strong and significant negative correlation between OTU richness and temperature in surface waters (Spearman R = −0.71, p < 0.001). Temperature is one of the major drivers of microbial diversity along latitudinal gradients in the oceans (Fuhrman et al., 2008) and can be responsible for spatial and temporal variations of community structure in estuarine (Campbell et al., 2009; Fortunato and Crump, 2011) and in large brackish environments (Andersson et al., 2010; Herlemann et al., 2016). Phytoplankton community composition also appears to influence composition and succession of microorganisms in Puyuhuapi Fjord, which is evidenced by positive correlations of abundance of specific members of Flavobacteriaceae, Alteromonadales, and Verrucomicrobiales with diatoms in subsurface waters and of Flavobacteriales (Cryomorphaceae and Flavobacteriaceae), Rhodobacteraceae, and Pelagibacteraceae with dinoflagellates in surface waters (Figures 6, 7). We suggest that phytoplankton composition could define specific niches for microorganisms in Puyuhuapi fjord waters. The role of phytoplankton bloom dynamics on the composition of prokaryotic community has been previously described (Pinhassi and Hagström, 2000; Dang and Lovell, 2016) with particular reference to specialized taxa that can efficiently degrade phytoplankton detritus (Teeling et al., 2012; Buchan et al., 2014; Dang and Lovell, 2016). Our observations support previous findings in coastal environments where certain bacterial assemblages have been associated with spring diatom blooms and others with autumn blooms dominated by dinoflagellates (El-Swais et al., 2015). Diatoms and dinoflagellates are the major primary producers in Puyuhuapi Fjord (Montero et al., 2017a,b), and specific interactions between prokaryotes and phytoplankton and their role in carbon fluxes certainly merits further analysis.
Several environmental parameters can influence marine microbial diversity on seasonal scales (Fuhrman et al., 2006, 2015; Andersson et al., 2010; Gilbert et al., 2012; Fortunato et al., 2013; El-Swais et al., 2015; Bryant et al., 2016; Bunse and Pinhassi, 2017) and in Puyuhuapi Fjord, temperature and salinity do show a strong seasonal variability (Schneider et al., 2014). Whereas, no significant association was observed between salinity and OTU richness (Spearman R = 0.25, p = 0.29) in the present study, temperature was show to be the main factor explaining variations of microbial richness in surface waters of Puyuhuapi Fjord. The negative relationship between OTUs richness and temperature was described by a power model that explained 70% of variability of Chao1 as function of temperature and showed a major reduction associated with changes in temperature during the cold period in austral winter (Figure 8). The continuous record of surface water temperature within Puyuhuapi Fjord has shown a significant successive increase in average winter temperatures for the last 6 years (Supplementary Figure 2), suggesting a potential effect for future temperature increases on cold-adapted microbes of Patagonian fjords. Among the taxa shown to be more sensitive to increased temperature were members of the bacterial families Flavobacteriaceae and Rhodobacteraceae, and Archaea of the family Cenarchaeaceae (Figure 6, Table 5). Although richness (and composition) recovered after the warm period in our time series (Figures 3A, 6), suggesting a certain degree of resilience, we hypothesize that the disturbance associated with increasing winter temperatures could potentially result in net loss of microbial diversity in the fjord.
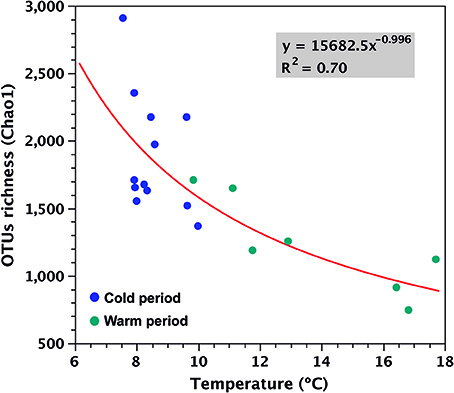
Figure 8. Power model explaining 70% of variability of OTU diversity (Chao1) as a function of temperature (p < 0.005) for data collected from surface waters during the study period in Puyuhuapi Fjord.
In aquatic environments, microbial activity and diversity are considered to be closely linked to overall ecosystem function (Finlay et al., 1997), and changes in diversity have been positively associated with organic matter availability and heterotrophic activity (Landa et al., 2016). Our data indicate a minor proportion of OTUs might be replaced during warm periods, and so we need to look into potential loss of functions in surface water microbial communities with temperature increase. The influence of long-term changes in temperature on the diversity of microbial communities is one of the possible responses of fjord ecosystems to climate variability, although the mechanism behind this is not presently understood. At the regional scale, similar trends in winter temperatures in recent years have been observed in satellite-derived sea surface temperature (off Chiloé Island, ca. 150 km north of our study area; Narváez, unpublished data). These trends coincide with a positive Pacific Decadal Oscillation (PDO3) phase, and a strong El Niño event in 20154. This suggests that the warming winter trend observed in Puyuhuapi Fjord could be driven by large-scale forcing, thus supporting the notion of synchrony between open ocean and coastal-fjords environments, and the potential remote connection between climatic and oceanographic processes and fjord microbes.
Conclusions
We conclude that contrasting water masses of Puyuhuapi Fjord have distinctive microbial compositions, with salinity and oxygen being the first-order factors driving vertical segregation. Major intra-annual variations of microbial diversity in surface waters could be attributable to a seasonal increase of water temperature, producing a dramatic reduction of OTUs richness and individual abundance within the families Flavobacteriaceae, Rhodobacteraceae, and Cenarchaeaceae. Abundance of diatoms and dinoflagellates appears to influence abundance of specific taxa of microorganisms in Puyuhuapi Fjord waters, suggesting a high level of microbial specialization related to predominant phytoplankton populations. A conceptual model summarizing the main environmental forcing that controls microbial composition and diversity at intra- and inter-annual scale is hypothesized for the fjord (Figure 9). Changes in diversity can impact microbial activity and ecosystem function, and therefore biogeochemical cycling of the Patagonian fjord ecosystem, currently considered a net sink of CO2 in the eastern South Pacific Ocean (Torres et al., 2011). In this context, the challenge is to unveil metabolic changes concurrent with loss of sensitive microbial taxa in order to infer variations in the current biogeochemical status of Patagonian fjords.
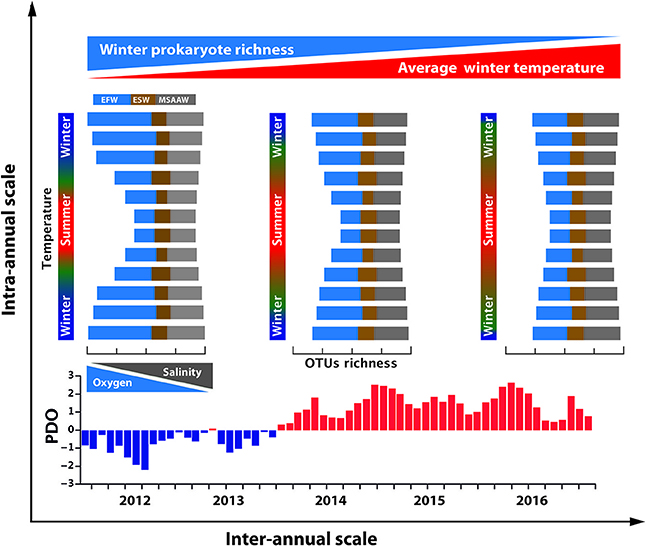
Figure 9. Conceptual model representing major changes in community structure of prokaryotes at intra- and inter-annual scales in waters of Puyuhuapi Fjord. At seasonal and shorter temporal scales, composition of microbial communities among predominant water masses is principally controlled by vertical changes in salinity and oxygen concentration. Taxa representative of Estuarine Fresh Water (EFW) occupy surface waters with low salinity and high oxygen concentration and taxa representative of MSAAW occupy more saline and less oxygenated deeper waters. Seasonal rise of temperature results in a conspicuous fall in OTU richness in surface water during summer. At the inter-annual scale, a trend of increasing average surface water temperature in winter is consistent with positive anomalies in the Pacific Decadal Oscillation (PDO).
Author Contributions
MG study design, data collection, analysis of sequences and interpretation of results, manuscript leader. DN analysis of temperature time series. GD study design, environmental data analysis and manuscript revision. PM study design, sample collection and analysis of environmental data. IP-S collection and analysis of physical data. SP critical revision and edition of final version of the manuscript. All authors contributed to the writing of the manuscript.
Funding
This research was funded by CONICYT-Chile through Fondecyt grant 1131063, PAI grant 791220026 and COPAS Sur-Austral CONICYT PIA APOYO CCTE AFB170006. IP-S acknowledges funding from Fondecyt grant 11140161. DN acknowledges funding from Fondecyt grant 11161091.
Conflict of Interest Statement
The authors declare that the research was conducted in the absence of any commercial or financial relationships that could be construed as a potential conflict of interest.
Acknowledgments
The authors thank the Marine Organic Geochemistry laboratory team at UDEC and technical staff of Centro de Investigación en Ecosistemas de la Patagonia for support during fieldwork.
Supplementary Material
The Supplementary Material for this article can be found online at: https://www.frontiersin.org/articles/10.3389/fmars.2018.00277/full#supplementary-material
Footnotes
2. ^McDonald, D., Hugenholtz, P. (2014). “Pelagibacteraceae” (and SAR86 clade) [Online forum comment]. Available at https://groups.google.com/forum/#!msg/qiime-forum/8QfE3ta_NiE/Npwf6xJUFzgJ.
3. ^http://research.jisao.washington.edu/pdo/
4. ^http://origin.cpc.ncep.noaa.gov/products/precip/CWlink/MJO/enso.shtml
References
Andersson, A. F., Riemann, L., and Bertilsson, S. (2010). Pyrosequencing reveals contrasting seasonal dynamics of taxa within Baltic Sea bacterioplankton communities. ISME J. 4, 171–181. doi: 10.1038/ismej.2009.108
Arrigo, K. R. (2005). Marine microorganisms and global nutrient cycles. Nature 437, 349–355. doi: 10.1038/nature04159
Auguet, J. C., Barberan, A., and Casamayor, E. O. (2012). Global ecological patterns in uncultured Archaea. ISME J. 4, 182–190. doi: 10.1038/ismej.2009.109
Azam, F. (1998). Microbial control of oceanic carbon flux: the plot thickens. Science 280, 694–696. doi: 10.1126/science.280.5364.694
Bano, N., Ruffin, S., Ranson, B., and Hollibaugh, J. T. (2004). Phylogenetic composition of Arctic Ocean archaeal assemblages and comparison with Antarctic assemblages. Appl. Environ. Microbiol. 70, 781–789. doi: 10.1128/AEM.70.2.781-789.2004
Bernhard, A. E., and Kelly, J. J. (2016). Editorial: linking ecosystem function to microbial diversity. Front. Microbiol. 7:1041. doi: 10.3389/fmicb.2016.01041
Bokulich, N. A., Subramanian, S., Faith, J. J., Gevers, D., Gordon, J. I., Knight, R., et al. (2013). Quality-filtering vastly improves diversity estimates from illumina amplicon sequencing. Nat. Methods 10, 57–59. doi: 10.1038/nmeth.2276
Bryant, J. A., Aylward, F. O., Eppley, J. M., Karl, D. M., Church, M. J., and DeLong, E. F. (2016). Wind and sunlight shape microbial diversity in surface waters of the North Pacific Subtropical Gyre. ISME J. 10, 1308–1322. doi: 10.1038/ismej.2015.221
Buchan, A., LeCleir, G. R., Gulvik, C. A., and González, J. M. (2014). Master recyclers: features and functions of bacteria associated with phytoplankton blooms. Nat. Rev. Microbiol. 12, 686–698. doi: 10.1038/nrmicro3326
Bunse, C., and Pinhassi, J. (2017). Marine bacterioplankton seasonal succession dynamics. Trends Microbiol. 25, 494–505. doi: 10.1016/j.tim.2016.12.013
Calvete, C., and Sobarzo, M. (2011). Quantification of the surface brackish water layer and frontal zones in southern Chile an fjords between Boca del Guafo (43°30'S) and Estero Elefantes (46°30'S). Cont. Shelf Res. 3, 162–171. doi: 10.1016/j.csr.2010.09.013
Campbell, B. J., Engel, A. S., Porter, M. L., and Takai, K. (2006). The versatile E-proteobacteria: key players in sulphidic habitats. Nat. Rev. Microbiol. 4, 458–468. doi: 10.1038/nrmicro1414
Campbell, B. J., and Kirchman, D. L. (2013). Bacterial diversity, community structure and potential growth rates along an estuarine salinity gradient. ISME J. 7, 210–220. doi: 10.1038/ismej.2012.93
Campbell, B. J., Yu, L., and Kirchman, D. L. (2011). Activity of abundant and rare bacteria in a coastal ocean. Proc. Natl. Acad. Sci. U.S.A. 108, 12776–12781. doi: 10.1073/pnas.1101405108
Campbell, B. J., Yu, L., Straza, T. R. A., and Kirchman, D. L. (2009). Temporal changes in bacterial rRNA and rRNA genes in Delaware (USA) coastal waters. Aquat. Microb. Ecol. 57, 123–135. doi: 10.3354/ame01335
Caporaso, J. G., Kuczynski, J., Stombaugh, J., Bittinger, K., Bushman, F. D., Costello, E. K., et al. (2010). QIIME allows analysis of high-throughput community sequencing data. Nat. Methods 7, 335–336. doi: 10.1038/nmeth.f.303
Chow, C. E. T., Sachdeva, R., Cram, J. A., Steele, J. A., Needham, D. M., Patel, A., et al. (2013). Temporal variability and coherence of euphotic zone bacterial communities over a decade in the Southern California Bight. ISME J. 7, 2259–2273. doi: 10.1038/ismej.2013.122
Collins, R. E., Rocap, G., and Deming, J. W. (2010). Persistence of bacterial and archaeal communities in sea ice through an Arctic winter. Environ. Microbiol. 12, 1828–1841. doi: 10.1111/j.1462-2920.2010.02179.x
Cowie, R. O. M., Maas, E. W., and Ryan, K. G. (2011). Archaeal diversity revealed in Antarctic sea ice. Antarct. Sci. 23, 531–536. doi: 10.1017/S0954102011000368
Dang, H., and Lovell, C. R. (2016). Microbial surface colonization and biofilm development in marine environments. Microbiol. Mol. Biol. Rev. 80, 91–138. doi: 10.1128/MMBR.00037-15
DeSantis, T. Z., Hugenholtz, P., Larsen, N., Rojas, M. E., Brodie, L., Keller, K., et al. (2006). Greengenes, a chimera-checked 16S rRNA gene database and workbench compatible with ARB. Appl. Environ. Microbiol. 72, 5069–5072. doi: 10.1128/AEM.03006-05
Diaz, R. J., and Rosenberg, R. (2008). Spreading dead zones and consequences for marine ecosystems. Science 321, 926–929. doi: 10.1126/science.1156401
Doney, S. C. (2010). The growing human footprint on coastal and open-ocean biogeochemistry. Science 328, 1512–1516. doi: 10.1126/science.1185198
El-Swais, H., Dunn, K. A., Bielawski, J. P., Li, W. K., and Walsh, D. A. (2015). Seasonal assemblages and short-lived blooms in coastal north-west Atlantic Ocean bacterioplankton. Environ. Microbiol. 17, 3642–3661. doi: 10.1111/1462-2920.12629
Falkowski, P. G., Fenchel, T., and Delong, E. F. (2008). The microbial engines that drive earth's biogeochemical cycles. Science 320, 1034–1039. doi: 10.1126/science.1153213
Finlay, B. J., Maberly, S. C., and Cooper, J. I. (1997). Microbial diversity and ecosystem function. Oikos 80, 209–213. doi: 10.2307/3546587
Fortunato, C. S., and Crump, B. C. (2011). Bacterioplankton community variation across river to ocean environmental gradients. Microb. Ecol. 62, 374–382. doi: 10.1007/s00248-011-9805-z
Fortunato, C. S., and Crump, B. C. (2015). Microbial gene abundance and expression patterns across a river to ocean salinity gradient PLoS ONE 10:e0140578. doi: 10.1371/journal.pone.0140578
Fortunato, C. S., Eiler, A., Herfort, L., Needoba, J. A., Peterson, T. D., and Crump, B. C. (2013). Determining indicator taxa across spatial and seasonal gradients in the Columbia River coastal margin. ISME J. 7, 1899–1911. doi: 10.1038/ismej.2013.79
Fortunato, C. S., Herfort, L., Zuber, P., Baptista, A. M., and Crump, B. C. (2012). Spatial variability overhelms seasonal patterns in bacterioplankton communities across a river to ocean gradient. ISME J. 6, 554–563. doi: 10.1038/ismej.2011.135
Fuerst, J. A., and Sagulenko, E. (2011). Beyond the bacterium: planctomycetes challenge our concepts of microbial structure and function. Nat. Rev. Microbiol. 9, 403–413. doi: 10.1038/nrmicro2578
Fuhrman, J. A., Cram, J. A., and Needham, D. M. (2015). Marine microbial community dynamics and their ecological interpretation. Nat. Rev. Microbiol. 13, 133–146. doi: 10.1038/nrmicro3417
Fuhrman, J. A., Hewson, I., Schwalbach, M. S., Steele, J. A., Brown, M. V., and Naeem, S. (2006). Annually reoccurring bacterial communities are predictable from ocean conditions. Proc. Natl. Acad. Sci. U.S.A. 103, 13104–13109. doi: 10.1073/pnas.0602399103
Fuhrman, J. A., Steele, J. A., Hewson, I., Schwalbach, M. S., Brown, M. V., Green, J. L., et al. (2008). A latitudinal diversity gradient in planktonic marine bacteria. Proc. Natl. Acad. Sci. U.S.A. 105, 7774–7778. doi: 10.1073/pnas.0803070105
Galand, P. E., Casamayor, E. O., Kirchman, D. L., Potvin, M., and Lovejoy, C. (2009a). Unique archaeal assemblages in the Arctic Ocean unveiled by massively parallel tag sequencing. ISME J. 3, 860–869. doi: 10.1038/ismej.2009.23
Galand, P. E., Lovejoy, C., Hamilton, A. K., Ingram, R. G., Pedneault, E., and Carmack, E. C. (2009b). Archaeal diversity and a gene for ammonia oxidation are coupled to oceanic circulation. Environ. Microbiol. 11, 971–980. doi: 10.1111/j.1462-2920.2008.01822.x
Galand, P. E., Lovejoy, C., Pouliot, J., and Vincent, W. F. (2008). Heterogeneous archaeal communities in the particle-rich environment of an arctic shelf ecosystem. J. Mar. Syst. 74, 774–782. doi: 10.1016/j.jmarsys.2007.12.001
Galand, P. E., Potvin, M., Casamayor, E. O., and Lovejoy, C. (2010). Hydrography shapes bacterial biogeography of the deep Arctic Ocean. ISME J. 4, 564–576. doi: 10.1038/ismej.2009.134
Garreaud, R., Lopez, P., Minvielle, M., and Rojas, M. (2013). Large-scale control on the patagonian climate. J. Climate 26, 215–230. doi: 10.1175/JCLI-D-12-00001.1
Gattuso, J. P., Farnkignoulle, M., and Wollast, R. (1998). Carbon and carbonate metabolisms in coastal aquatic ecosystems. Annu. Rev. Ecol. Syst. 29, 405–434. doi: 10.1146/annurev.ecolsys.29.1.405
Gilbert, J. A., Steele, J. A., Caporaso, J. G., Steinbrück, L., Reeder, J., Temperton, B., et al. (2012). Defining seasonal marine microbial community dynamics. ISME J. 6, 298–308. doi: 10.1038/ismej.2011.107
Giovannoni, S. J., and Stingl, U. (2005). Molecular diversity and ecology of microbial plankton. Nature 437, 343–348. doi: 10.1038/nature04158
Giovannoni, S. J., and Vergin, K. L. (2012). Seasonality in ocean microbial communities. Science 335, 671–676. doi: 10.1126/science.1198078
González, H. E., Calderón, M. J., Castro, L., Clement, A., Cuevas, L. A., Daneri, G., et al. (2010). Primary production and its fate in the pelagic food web of the Reloncaví Fjord and plankton dynamics of the Interior Sea of Chiloé, Northern Patagonia, Chile. Mar. Ecol. Prog. Ser. 402, 13–30. doi: 10.3354/meps08360
González, H. E., Castro, L., Daneri, G., Iriarte, J. L., Silva, N., Vargas, C. A., et al. (2011). Seasonal plankton variability in Chilean Patagonia fjords: carbon flow through the pelagic food web of the Aysen Fjord and plankton dynamics in the Moraleda Channel basin. Cont. Shelf Res. 31, 225–243. doi: 10.1016/j.csr.2010.08.010
González, H. E., Castro, L. R., Daneri, G., Iriarte, J. L., Silva, N., Tapia, F., et al. (2013). Land-ocean gradient in haline stratification and its effects on plankton dynamics and trophic carbon fluxes in Chilean Patagonian fjords (47°-50° S). Prog. Oceanogr. 119, 32–47. doi: 10.1016/j.pocean.2013.06.003
Gutiérrez, M. H., Galand, P. E., Moffat, C., and Pantoja, S. (2015). Melting glacier impacts community structure of Bacteria, Archaea and Fungi in a Chilean Patagonia fjord. Environ. Microbiol. 17, 3882–3897. doi: 10.1111/1462-2920.12872
Hajdu, S., Höglander, H., and Larsson, U. (2007). Phytoplankton vertical distribution and composition in Baltic Sea cyanobacterial blooms. Harmful Algae 6, 189–205. doi: 10.1016/j.hal.2006.07.006
Hamdan, L. J., Coffin, R. B., Sikaroodi, M., Greinert, J., Treude, T., and Gillevet, P. M. (2013). Ocean currents shape the microbiome of Arctic marine sediments. ISME J. 7, 685–696. doi: 10.1038/ismej.2012.143
Herlemann, D. P., Lundin, D., Andersson, A. F., Labrenz, M., and Jürgens, K. (2016). Phylogenetic signals of salinity and season in bacterial community composition across the salinity gradient of the Baltic Sea. Front. Microbiol. 7:1883. doi: 10.3389/fmicb.2016.01883
Herlemann, D. P. R., Labrenz, M., Jürgens, K., Bertilsson, S., Waniek, J. J., and Andersson, A. F. (2011). Transition in bacterial communities along the 200 km salinity gradient of the Baltic Sea. ISME J. 5, 1571–1579. doi: 10.1038/ismej.2011.41
Iriarte, J. L., León-Muñoz, J., Marcé, R., Clément, A., and Lara, C. (2016). Influence of seasonal freshwater streamflow regimes on phytoplankton blooms in a Patagonian fjord. New Zeal. J. Mar. Freshw. 51, 304–315. doi: 10.1080/00288330.2016.1220955
Kang, I., Lee, K., Yang, S. J., Choi, A., Kang, D., Lee, K. Y., et al. (2012). Genome sequence of “Candidatus Aquiluna” sp. strain IMCC13023, a marine member of the actinobacteria isolated from an Arctic Fjord. J. Bacteriol. 194, 3550–3551. doi: 10.1128/JB.00586-12
Lamendella, R., Strutt, S., Borglin, S., Chakraborty, R., Tas, N., Mason, O. U., et al. (2014). Assessment of the deepwater horizon oil spill impact on Gulf coast microbial communities. Front. Microbiol. 5:130. doi: 10.3389/fmicb.2014.00130
Landa, M., Blain, S., Christaki, U., Monchy, S., and Obernosterer, I. (2016). Shifts in bacterial community composition associated with increased carbon cycling in a mosaic of phytoplankton blooms. ISME J. 10, 39–50. doi: 10.1038/ismej.2015.105
Lara, C., Saldías, G. S., Tapia, F. J., Iriarte, J. L., and Broitman, B. R. (2016). Interannual variability in temporal patterns of Chlorophyll–a and their potential influence on the supply of mussel larvae to inner waters in northern Patagonia (41–44°S). J. Mar. Syst. 155, 11–18. doi: 10.1016/j.jmarsys.2015.10.010
Löscher, C. R., Kock, A., Koenneke, M., LaRoche, J., Bange, H. W., and Schmitz, R. A. (2012). Production of oceanic nitrous oxide by ammonia-oxidizing archaea. Biogeoscience 9, 2419–2429. doi: 10.5194/bg-9-2419-2012
Lozupone, C. A., and Knight, R. (2007). Global patterns in bacterial diversity. Proc. Natl. Acad. Sci. U.S.A. 104, 11436–11440. doi: 10.1073/pnas.0611525104
Mason, O. U., Hazen, T. C., Borglin, S., Chain, P. S. G., Dubinsky, E. A., Fortney, J. L., et al. (2012). Metagenome, metatranscriptome and single-cell sequencing reveal microbial response to deepwater horizon oil spill. ISME J. 6, 1715–1727. doi: 10.1038/ismej.2012.59
Montero, P., Daneri, G., González, H. E., Iriarte, J. L., Tapia, F. J., Lizárraga, L., et al. (2011). Seasonal variability of primary production in a fjord ecosystem of the Chilean Patagonia: Implications for the transfer of carbon within pelagic food webs. Cont. Shelf Res. 31, 202–215. doi: 10.1016/j.csr.2010.09.003
Montero, P., Daneri, G., Tapia, F., Iriarte, J. L., and Crawford, D. (2017a). Diatom blooms and primary production in a channel ecosystem of central Patagonia. Lat. Am. J. Aquat. Res. 45, 999–1016. doi: 10.3856/vol45-issue5-fulltext-16
Montero, P., Pérez-Santos, I., Daneri, G., Gutiérrez, M. H., Igor, G., Seguel, R., et al. (2017b). A winter dinoflagellate bloom drives high rates of primary production in a Patagonian fjord ecosystem. Estuar. Coast. Shelf Sci. 199, 105–116. doi: 10.1016/j.ecss.2017.09.027
Offre, P., Spang, A., and Schleper, C. (2013). Archaea in biogeochemical cycles. Annu. Rev. Microbiol. 67, 437–457. doi: 10.1146/annurev-micro-092412-155614
Oksanen, A. J., Blanchet, F. G., Kindt, R., Minchin, P. R., Hara, R. B. O., Simpson, G. L., et al. (2013). Vegan: Community Ecology Package. R package version 2.0–5. Available online at: https://github.com/vegandevs/vegan
O'Sullivan, L. A., Rinna, J., Humphreys, G., Weightman, A. J., and Fry, J. C. (2005). Fluviicola taffensis gen. nov., sp. nov., a novel freshwater bacterium of the family Cryomorphaceae in the phylum ‘Bacteroidetes’. Int. J. Syst. Evol. Microbiol. 55, 2189–2194. doi: 10.1099/ijs.0.63736-0
Ottesen, E. A., Youg, C. R., Eppley, J. M., Ryan, J. P., Chavez, F. P., Scholin, C. A., et al. (2012). Pattern and synchrony of gene expression among sympatric marine microbial populations. Proc. Natl. Acad. Sci. U.S.A. 110, E488–E497. doi: 10.1073/pnas.1222099110
Pantoja, S., Iriarte, J. L., Gutiérrez, M. H., and Calvete, C. (2005). “The southern chile continental margin,” in Carbon and Nutrient Fluxes in Continental Margins, eds K. K. Liu, L. Atkinson, R. Quiñones, and L. Talaue-McManus (Berlin; Heidelberg: Springer), 265–272.
Parsons, T. R., Maita, Y., and Lalli, C. M. (1984). A Manual of Chemical and Biological Methods for Seawater Analysis. Oxford: Pergamon Press.
Pérez-Santos, I., Garcés-Vargas, J., Schneider, W., Ross, L., Parra, S., and Valle-Levinson, A. (2014). Double-diffusivelayering and mixing in Patagonian fjords. Prog. Oceanogr. 129, 35–49. doi: 10.1016/j.pocean.2014.03.012
Pickard, G. (1971). Some physical oceanographic features of inlets of Chile. J. Fish Board Can. 28, 1077–1106. doi: 10.1139/f71-163
Pinhassi, J., and Hagström, A. (2000). Seasonal succession in marine bacterioplankton. Aquat. Microb. Ecol. 21, 245–256. doi: 10.3354/ame021245
Piquet, A. M. T., Maat, D. S., Confurius-Guns, V., Sintes, E., Herndl, G. J., van de Pol, W. H., et al. (2015). Springtime dynamics, productivity and activity of prokaryotes in two Arctic fjords. Polar Biol. 39, 1749–1763. doi: 10.1007/s00300-015-1866-x
Piquet, A. M. T., Scheepens, J. F., Bolhuis, H., Wiencke, C., and Buma, A. G. J. (2010). Variability of protistan and bacterial communities in two Arctic fjords (Spitsbergen). Polar Biol. 33, 1521–1536. doi: 10.1007/s00300-010-0841-9
Piquet, A. M. T., van de Poll, W. H., Visser, R. J. W., Wiencke, C., Bolhuis, H., and Buma, A. G. J. (2014). Springtime phytoplankton dynamics in Arctic Krossfjorden and Kongsfjorden (Spitsbergen) as a function of glacier proximity. Biogeosciences 11, 2263–2279. doi: 10.5194/bg-11-2263-2014
Prasad, S., Manasa, P., Buddhi, S., Tirunagari, P., Begum, Z., Rajan, S., et al. (2014). Diversity and bioprospective potential (cold-active enzymes) of cultivable marine bacteria from the subarctic glacial fjord, Kongsfjorden. Curr. Microbiol. 68, 233–238. doi: 10.1007/s00284-013-0467-6
Quintana, J. M., and Aceituno, P. (2012). Changes in the rainfall regime along the extratropical west coast of South America (Chile): 30-43° S. Atmósfera 25, 1–22.
Ríos, F., Kilian, R., and Mutschke, E. (2016). Chlorophyll-a thin layers in the Magellan fjord system: the role of the water column stratification. Cont. Shelf Res. 124, 1–12. doi: 10.1016/j.csr.2016.04.011
Riemann, L., Leitet, C., Pommier, T., Simu, K., Holmfeldt, K., Larsson, U., et al. (2008). The native bacterioplankton community in the central Baltic Sea is influenced by freshwater bacterial species. Appl. Environ. Microbiol. 74, 503–515. doi: 10.1128/AEM.01983-07
Rozas, M., and Enríquez, R. (2014). Piscirickettsiosis and Piscirickettsia salmonis in fish: a review. J. Fish Dis. 37, 163–188. doi: 10.1111/jfd.12211
Schneider, W., Pérez-Santos, I., Ross, L., Bravo, L., Seguel, R., and Hernández, F. (2014). On the oceanography of Puyuhuapi Channel. Prog. Oceanogr. 129, 8–18. doi: 10.1016/j.pocean.2014.03.007
Sepúlveda, J., Pantoja, S., and Hughen, K. A. (2011). Sources and distribution of organic matter in northern Patagonia fjords, Chile (~44-47° S): a multi-tracer approach for carbon cycling assessment. Cont. Shelf Res. 31, 315–329. doi: 10.1016/j.csr.2010.05.013
Sievers, H., and Silva, N. (2008). “Water masses and circulation in austral Chilean channels and fjords,” in Progress in the Oceanographic Knowledge of Chilean Interior Waters, from Puerto Montt to Cape Horn, eds S. Silva, and S. Palma (Valparaíso: Comité Oceanográfico Nacional, Pontificia Universidad Católica de Valparaíso), 53–58.
Signori, C. M., Thomas, F., Enrich-Prast, A., Pollery, R. C., and Sievert, S. M. (2014). Microbial diversity and community structure across environmental gradients in Bransfield Strait, Western Antarctic Peninsula. Front. Microbiol. 5:647. doi: 10.3389/fmicb.2014.00647
Silva, N., Calvete, C., and Sievers, H. (1998). Masas de agua y circulación para algunos canales australes entre Puerto Montt y Laguna San Rafael, Chile (Crucero Cimar-Fiordo 1). Cienc. Tecnol. Mar. 21, 17–48.
Silva, N., and Vargas, C. A. (2014). Hypoxia in Chilean Patagonia fjords. Prog. Oceanogr. 129, 62–74. doi: 10.1016/j.pocean.2014.05.016
Smith, M. W., Herfort, L., Tyrol, K., Suciu, D., Campbell, V., Crump, B. C., et al. (2010). Seasonal changes in bacterial and archaeal gene expression patterns across salinity gradients in the Columbia River coastal margin. PLoS ONE 5:e13312 doi: 10.1371/journal.pone.0013312
Smith, R. W., Bianchi, T. S., Allison, M., Savage, C., and Galy, V. (2015). High rates of organic carbon burial in fjord sediments globally. Nat. Geosci. 8, 450–454. doi: 10.1038/ngeo2421
Solorzano, L. (1969). Determination of ammonia in natural waters by the phenolhypochlorite method. Limnol. Oceanogr. 14, 799–801.
Stal, L. J., Staal, M., and Villbrandt, M. (1999). Nutrient control of cyanobacterial blooms in the Baltic Sea. Aquat. Microb. Ecol. 18, 165–173. doi: 10.3354/ame018165
Stevens, H., and Ulloa, O. (2008). Bacterial diversity in the oxygen minimum zone of the eastern tropical South Pacific. Environ. Microbiol. 10, 1244–1259. doi: 10.1111/j.1462-2920.2007.01539.x
Storesund, J. E., Erga, S. R., Ray, J. L., Thingstad, T. F., and Sandaa, R. A. (2015). Top-down and bottom-up control on bacterial diversity in a western Norwegian deep-silled fjord. FEMS Microbiol. Ecol. 91:fiv076. doi: 10.1093/femsec/fiv076
Strickland, J. D., and Parsons, T. R. (1972). A Manual of Sea Water Analysis. Otawa, ON: Fisheries Research Board of Canada.
Teeling, H., Fuchs, B. M., Becher, D., Klockow, C., Gardebrecht, A., Benke, C. M., et al. (2012). Substrate-controlled succession of marine bacterioplankton populations induced by a phytoplankton bloom. Science 4, 608–611. doi: 10.1126/science.1218344
Teira, E., Lebaron, P., van Aken, H., and Herndl, G. J. (2006). Distribution and activity of bacteria and Archaea in the deep water masses of the North Atlantic. Limnol. Oceanogr. 51, 2131–2144. doi: 10.4319/lo.2006.51.5.2131
Teske, A., Durbin, A., Ziervogel, K., Cox, C., and Arnosti, C. (2011). Microbial community composition and function in permanently cold seawater and sediments from an arctic fjord of Svalbard. Appl. Environ. Microbiol. 77, 2008–2018. doi: 10.1128/AEM.01507-10
Torres, R., Pantoja, S., Harada, N., González, H. E., Daneri, G., Frangopulos, M., et al. (2011). Air-sea CO2 fluxes along the coast of Chile: from CO2 outgassing in central northern upwelling waters to CO2 uptake in southern Patagonian fjords. J. Geophys. Res. 116:C09006. doi: 10.1029/2010JC006344
Tyrrell, T. (2011). Anthropogenic modification of the oceans. Philos. Trans. R. Soc. A 369, 887–908. doi: 10.1098/rsta.2010.0334
Varela, M. M., van Aken, H. M., Sintes, E., and Herndl, G. J. (2008). Latitudinal trends of Crenarchaeota and Bacteria in the meso- and bathypelagic water masses of the Eastern North Atlantic. Environ. Microbiol. 10, 110–124. doi: 10.1111/j.1462-2920.2007.01437.x
Walsh, E. A., Kirkpatrick, J. B., Rutherford, S. D., Smith, D. C., Sogin, M., and D'Hondt, S. (2015). Bacterial diversity and community composition from seasurface to subseafloor. ISME J. 10, 979–989. doi: 10.1038/ismej.2015.175
Webster, G., O'Sullivan, L. A., Meng, Y., Williams, A. S., Sass, A. M., Watkins, A. J., et al. (2015). Archaeal community diversity and abundance changes along a natural salinity gradient in estuarine sediments. FEMS Microbiol. Ecol. 91, 1–18. doi: 10.1093/femsec/fiu025
Wright, J. J., Konwar, K. M., and Hallam, S. J. (2012). Microbial ecology of expanding oxygen minimum zones. Nat. Rev. Microbiol. 10, 381–394. doi: 10.1038/nrmicro2778
Xia, X., Guo, W., and Liu, H. (2015). Dynamics of the bacterial and archaeal communities in the Northern South China Sea revealed by 454 pyrosequencing of the 16S rRNA gene. Deep Sea Res. II 117, 97–107. doi: 10.1016/j.dsr2.2015.05.016
Yilmaz, P., Yarza, P., Rapp, J. Z., and Glöckner, F. O. (2016). Expanding the world of marine bacterial and archaeal clades. Front. Microbiol. 6:1524. doi: 10.3389/fmicb.2015.01524
Zaikova, E., Walsh, D. A., Stilwell, C. P., Mohn, W. W., Tortell, P. D., and Hallan, S. J. (2010). Microbial community dynamics in a seasonally anoxic fjord: saanich inlet, British Columbia. Environ. Microbiol. 12, 172–191. doi: 10.1111/j.1462-2920.2009.02058.x
Zeng, Y., Zheng, T., and Li, H. (2009). Community composition of the marine bacterioplankton in Kongsfjorden (Spitsbergen) as revealed by 16S rRNA gene analysis. Polar Biol. 32, 1447–1460. doi: 10.1007/s00300-009-0641-2
Zeng, Y. X., Zhang, F., He, J. F., Lee, S. H., Qiao, Z. Y., Yu, Y., et al. (2013). Bacterioplankton community structure in the Arctic waters as revealed by pyrosequencing of 16S rRNA genes. Antonie Van Leeuwenhoek 103, 1309–1319. doi: 10.1007/s10482-013-9912-6
Zhang, C. L., Xie, W., Martin-Cuadrado, A. B., and Rodriguez-Valera, F. (2015). Marine group II Archaea, potentially important players in the global ocean carbon cycle. Front. Microbiol. 6:1108. doi: 10.3389/fmicb.2015.01108
Keywords: prokaryotic communities, environmental drivers, winter temperature trend, reducing diversity, Puyuhuapi fjord, Chilean Patagonia
Citation: Gutiérrez MH, Narváez D, Daneri G, Montero P, Pérez-Santos I and Pantoja S (2018) Linking Seasonal Reduction of Microbial Diversity to Increase in Winter Temperature of Waters of a Chilean Patagonia Fjord. Front. Mar. Sci. 5:277. doi: 10.3389/fmars.2018.00277
Received: 15 January 2018; Accepted: 20 July 2018;
Published: 14 August 2018.
Edited by:
Hongyue Dang, Xiamen University, ChinaReviewed by:
Angelina Lo Giudice, Consiglio Nazionale Delle Ricerche (CNR), ItalyKlaus Jürgens, Leibniz Institute for Baltic Sea Research (LG), Germany
Copyright © 2018 Gutiérrez, Narváez, Daneri, Montero, Pérez-Santos and Pantoja. This is an open-access article distributed under the terms of the Creative Commons Attribution License (CC BY). The use, distribution or reproduction in other forums is permitted, provided the original author(s) and the copyright owner(s) are credited and that the original publication in this journal is cited, in accordance with accepted academic practice. No use, distribution or reproduction is permitted which does not comply with these terms.
*Correspondence: Marcelo H. Gutiérrez, bWFndXRpZXJAdWRlYy5jbA==