 Heather D. Veilleux
 Taewoo Ryu
 Jennifer M. Donelson1
 Timothy Ravasi
 Philip L. Munday
- 1ARC Centre of Excellence for Coral Reef Studies, James Cook University, Townsville, QLD, Australia
- 2APEC Climate Center, Busan, South Korea
- 3KAUST Environmental Epigenetic Program, Division of Biological and Environmental Sciences and Engineering, King Abdullah University of Science and Technology, Thuwal, Saudi Arabia
Extreme thermal events are increasing in frequency and duration as the climate continues to warm, with potential detrimental effects on marine organisms. However, the effects of heatwaves may differ among geographically separated populations depending on their capacity for thermal plasticity. Here, we compared the response to simulated summer heatwave temperatures (+1.5 and +3.0°C above average) in two populations of a coral reef damselfish with different capacities for thermal plasticity. We found that the more thermally tolerant population had greater plasticity of gene expression and had significantly more downregulated genes, which may provide more energy to repair damage associated with thermal stress and to maintain basic functions at these extreme temperatures. In contrast, the thermally sensitive population exhibited higher basal levels of heat shock proteins and had three times fewer changes in gene expression overall. The limited changes in gene regulation suggest that individuals have reduced genome plasticity to tolerate thermal fluctuations and consequently may not have enough energy to repair damage and resume cellular homeostasis at extreme temperatures. Thus, we have identified the molecular signatures of how two genetically distinct fish populations cope with an extreme thermal event, and why they differ in their capacity for thermal plasticity.
Introduction
Extreme thermal events are increasing in frequency as the climate continues to warm (King et al., 2017). The COP21 Paris agreement on climate change is to limit the increase in global average temperature to well below 2°C above pre-industrial levels and to pursue efforts for only a 1.5°C increase. However, even with a 1.5°C increase in average temperature, extreme thermal events are 33% more likely to occur, and are 55% more likely if the average temperature increases by 2°C (King et al., 2017). Over the past 20 years, there have been four pan-tropical mass bleaching events coinciding with marine heatwaves (Hughes et al., 2017): 1998, 2002, 2016, and 2017. In the most extreme event to date, water temperatures in 2016 on the northern Great Barrier Reef (GBR) in Australia were 1.3–2.4°C above average for several months (Australian Bureau of Meteorology [BOM], 2016), killing more than 50% of corals on reefs in the far northern region (Hughes et al., 2018). Such thermal anomalies will become more frequent and severe as the oceans warm further with possible negative effects on a greater range of marine life. Therefore, it is imperative that we understand how marine species can respond to extreme thermal events if we are to properly manage marine ecosystems in the future.
The effects of extreme thermal events may differ among populations depending on their thermal tolerance and capacity for plasticity, which may arise due to adaptation to the local thermal environment. Lower latitude populations are predicted to be more sensitive to extreme temperatures than their higher latitude counterparts because they have narrower reaction norms and live closer to their thermal optimum and maximum (Tewksbury et al., 2008; Sunday et al., 2012). This narrow thermal performance is related to having evolved in an environment with a smaller range of thermal conditions, in contrast to higher latitude populations that experience a greater range of seasonal temperatures and have evolved broader reaction norms (Tewksbury et al., 2008; Sunday et al., 2012). The proximity of current tropical populations to their upper thermal limits during summer is of concern because it infers limited tolerance to both projected future average ocean temperatures and extreme thermal events (Tewksbury et al., 2008; Rummer et al., 2014; Rodgers et al., 2018). The capacity of individuals to respond to warming through plasticity will influence the thermal resilience of populations. Previous research has generally focused on the capacity of individuals to respond to the average projected warming within and across generations (Donelson and Munday, 2012; Donelson et al., 2012; Salinas and Munch, 2012; Shama et al., 2016). Little is known about the plasticity that may occur in response to an extreme thermal event (i.e., marine heatwave) and whether genetic differences between populations will affect the response to higher temperatures.
At the molecular level, environmental perturbations result in strained molecular function that can lead to damaged DNA, proteins, or other important macromolecules (Kültz, 2003). Although the specific genes affected during thermal stress are highly variable across taxa, there are two general but highly conserved responses: (1) the more transient cellular stress response (CSR) and (2) the cellular homeostasis response (CHR), which is sustained until conditions improve (Kültz, 2005). The CSR is activated when damage to cell membranes, DNA, or proteins is detected, and when changes in cellular redox state are sensed. This then signals for the cessation of growth and proliferation, activates cell cycle checkpoints, induces molecular chaperones to repair proteins or signal them for degradation (heat shock response), affects metabolic pathways to meet increased energy demands for the CSR and cellular antioxidant systems, and, in some cases, initiates programmed cell death (apoptosis) (Kültz, 2005). If the stressed condition persists, the CHR is established in order to maintain basic functions in the new environment (Kültz, 2005). Transcriptomic analysis exploring overall changes in gene expression is becoming a popular tool to understand how species and populations of fishes will cope with thermal stress (reviewed by Logan and Buckley, 2015). Interestingly, it has been found that species that have evolved in a narrow thermal range (i.e., tropic or polar regions) tend to lack a heat shock response when exposed to increased temperatures, although other genes in the CSR are activated (Hofmann et al., 2000; Kassahn et al., 2007a). Furthermore, it has been suggested that limited changes in gene expression following short-term (e.g., 28-day) exposure to high temperatures indicate the animal is at the extremes of its thermal tolerance (Logan and Somero, 2011).
Temperatures just 1.5–3°C above average can affect growth, reproduction, swimming ability, and behavior of coral reef fishes (Munday et al., 2008; Johansen and Jones, 2011; Pratchett et al., 2015). Variation in sensitivity to elevated temperatures is observed, with equatorial and lower latitude populations appearing to have a smaller safety margin for the negative effects of warming (Rummer et al., 2014; Rodgers et al., 2018) and exhibiting less thermal plasticity (Donelson and Munday, 2012) compared with higher latitude populations. In this study, we tested the molecular responses to an extreme thermal event in two genetically differentiated populations of the spiny chromis damselfish, Acanthochromis polyacanthus, from different geographical locations on the GBR. Over the past 13 years, the higher latitude Heron Island population has experienced an average of 2°C cooler temperatures throughout the year compared to the lower latitude Palm Island population, and although the two populations have similar seasonal variation in temperature, the Heron Island population experiences over twice as much variation in daily temperatures compared with the Palm Island population (Supplementary Table S1). Furthermore, water temperature at Heron Island much more regularly exceeds +1.5°C above the summer average compared to Palm Island (Supplementary Table S2).
Previous studies show that the Heron Island population of A. polyacanthus has a superior capacity for plasticity of aerobic performance if exposed to elevated temperatures compared to the Palm Island population (Donelson and Munday, 2012). Here, we aimed to understand the molecular strategies employed by adult fish from each population in response to a summer thermal anomaly. We evaluated three treatments per population: control +0°C consistent with average summer temperatures at the two locations (Heron = 27°C, Palm = 28.5°C) at the time of sampling, and two elevated temperature treatments in which fish were exposed to +1.5 and +3°C above control conditions for 28 days (Figure 1). Specifically, we investigated the transcriptional response in the liver to determine if these two populations of A. polyacanthus employ similar or different molecular strategies to cope with an extreme thermal event. We chose to analyze the metabolically active liver as changes to oxygen consumption and metabolic rate are fundamental responses to increased environmental temperature in fishes and other ectotherms (see Donelson and Munday, 2012).
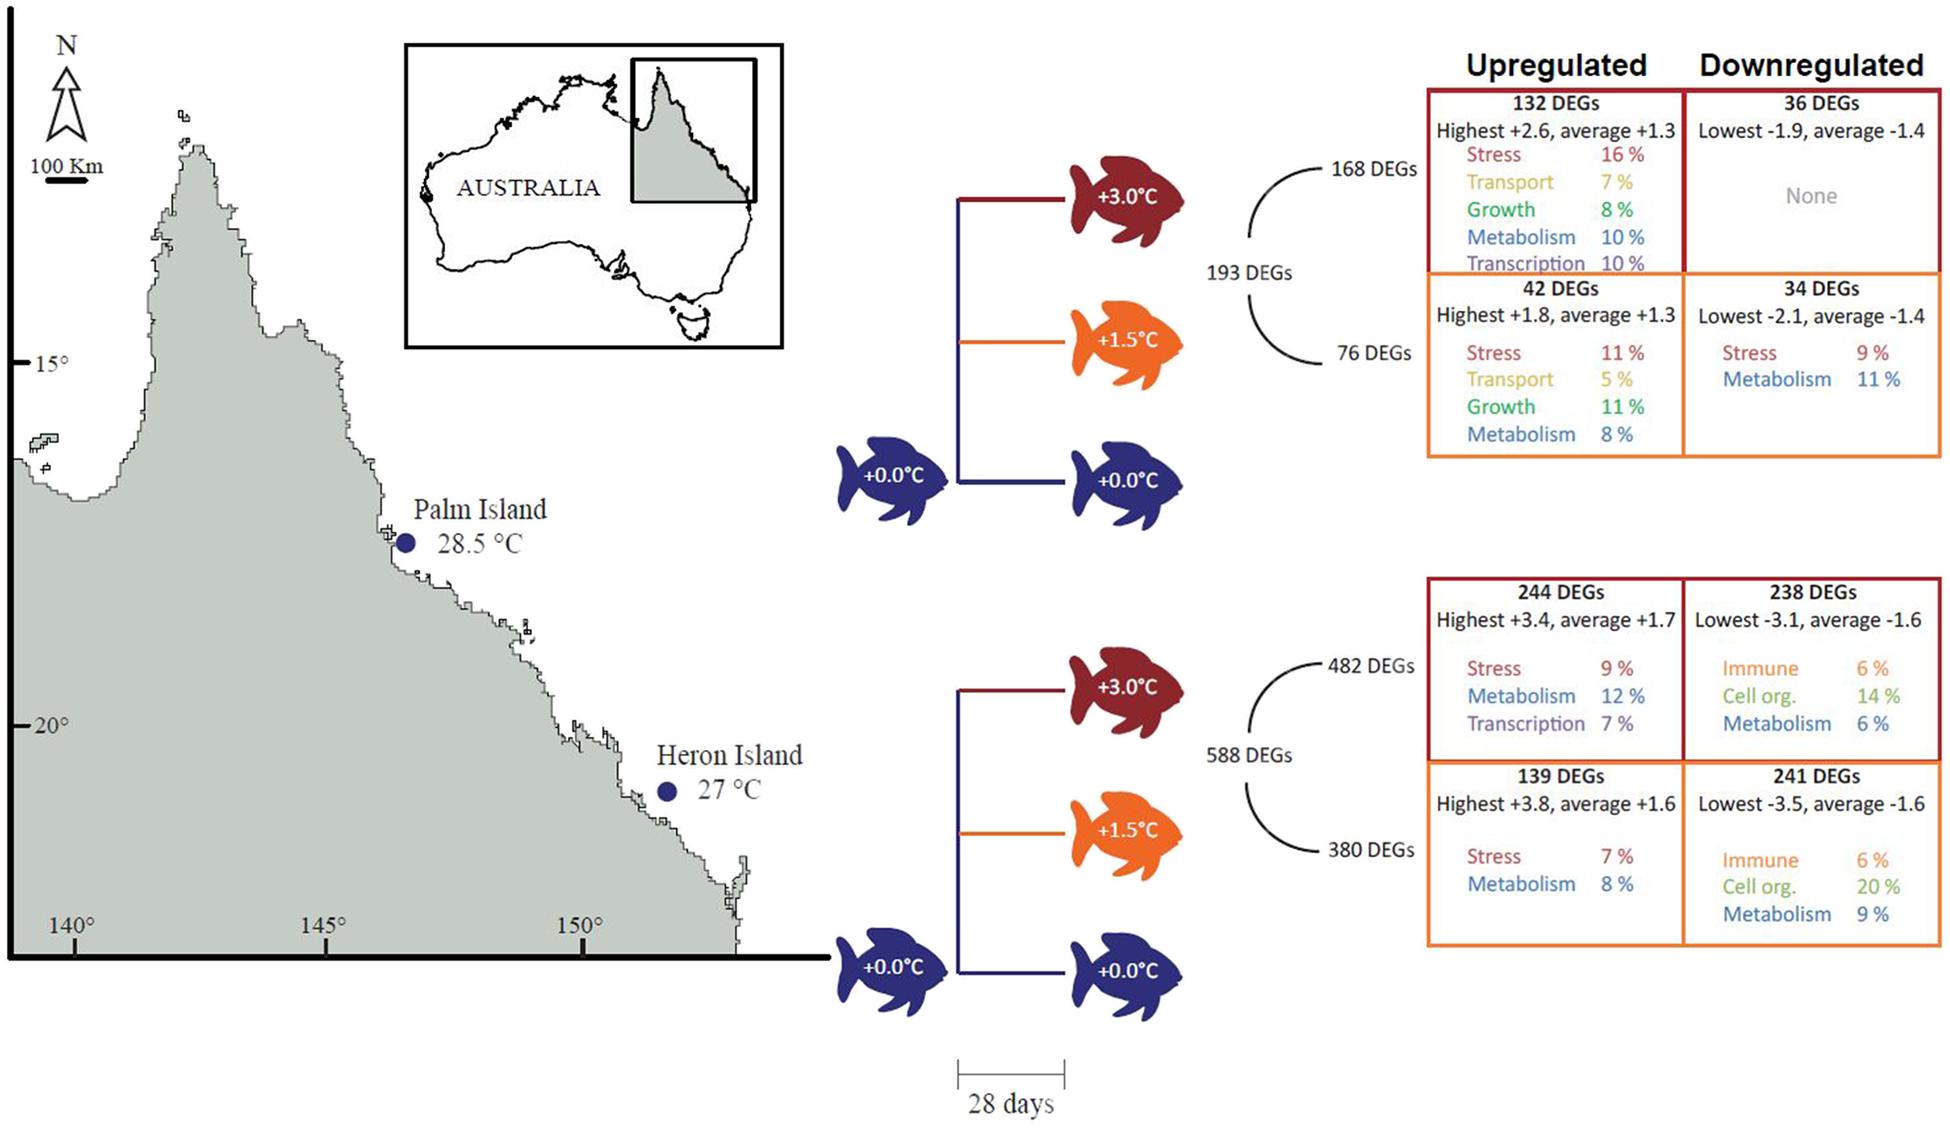
FIGURE 1. Experimental design and number of differentially expressed genes (DEGs) with associated top molecular functions. Adult Acanthochromis polyacanthus at summer average temperatures from Heron Island and Palm Island populations were separated into three treatments for 28 days: +0°C (control; blue; Heron = 27.5°C, Palm = 28°C), +1.5°C (orange), and +3°C (red). DEGs that were upregulated are described in the left-hand boxes and downregulated DEGs in the right-hand boxes. The total number of DEGs for each population is indicated to the right of the design tree, followed by the total DEGs per treatment. The number of DEGs that were up or down-regulated in each treatment are listed at the top of each box, followed by the highest or lowest and average differential expression. Functional categories representing at least the top 50% of the DEGs are indicated per treatment.
Materials and Methods
Study Species and Experimental Design
Acanthochromis polyacanthus (Bleeker 1855) is a common damselfish on coral reefs throughout the Indo-Australian archipelago (15°N to 26°S and 116°E to 169°E). It forms monogamous breeding pairs and parents provide parental care for their young for 30–45 days post-hatching (Kavanagh, 2000), after which the juveniles are evicted to nearby locations on their natal reef. As such, dispersal between populations is limited resulting in a high degree of genetic structure across the species range (Doherty et al., 1994; Kavanagh, 2000; Planes et al., 2001; van Herwerden and Doherty, 2006). The fish used in this study were collected from the southern and middle extent of the species range on the GBR, from Heron (23°27′ S, 151°57′ E) and Palm (18°37′ S, 146°30′ E) Island reefs, respectively. The Heron Island population typically experiences an annual mean summer temperature that is 2.1°C cooler than Palm Island fish (Australian Institute of Marine Science temperature loggers 2.0–8.0 m, 13-year average1), with similar seasonal variation, and 2.5 times greater difference in daily maximum and minimum temperatures (Supplementary Table S1).
Over the past 13 years, the Heron Island population maximum and average daily temperatures have exceeded 28.2°C (1.5°C above current day summer mean temperatures) 587 and 108 times, respectively. In contrast, the Palm Island population maximum and average daily temperatures only exceeded 30.3°C (1.5°C above current day summer mean temperatures) 120 and 2 times, respectively. The Palm Island reefs have not experienced +3°C, while Heron Island reefs have exceeded +3°C 142 and 13 times, for maximum and average daily temperatures. Interestingly, there were 2 days in January 2006 in which the minimum daily temperature at Heron Island exceeded 28.2°C (+1.5°C) (Supplementary Table S2).
For the Palm Island population, breeding pairs were collected from the reef during July to August 2007 and their offspring hatched in aquaria at James Cook University from December 2007 to February 2008. For the Heron Island population, recently hatched juveniles were collected directly from the reef at Heron Island during February to March 2009 and transferred to James Cook University. Both populations experienced gametogenesis and embryogenesis at the average temperature for their respective locations on the GBR. Juveniles from both populations were reared in seasonally varying temperatures representative of their collection locations [see Donelson and Munday (2012) for details]. After fish reached maturity, adults from both locations were subjected to one of three temperature treatments for 28 days: control temperatures (+0.0°C; Heron = 27°C, Palm = 28.5°C), +1.5°C (Heron = 28.5°C, Palm = 30°C), and +3°C (Heron = 30°C, Palm = 31.5°C). As the Heron Island population grew and matured faster, adults were transferred at 11–14 months old, while the Palm Island fish were transferred at 24–28 months old in order to compare responses at similar developmental stages. Despite this age difference, metabolic attributes from Palm Island fish did not differ between 1 and 2 years old (Donelson et al., 2011; Donelson and Munday, 2012).
Preparation and Sequencing of Samples
As this experiment was part of a broader, multi-generational rearing experiment, sample numbers and sexes available for each treatment were variable. Heron Island +0, +1.5, and +3°C treatments had seven, five, and six biological replicates, respectively. Palm Island +0, +1.5, and +3°C treatments had six, five, and five biological replicates, respectively. The sex ratios of samples are shown in Supplementary Table S3. Immediately following euthanasia, livers were dissected from each sample from the six treatments, snap-frozen in liquid nitrogen, and stored at -80°C until processing. As described in Veilleux et al. (2015), whole livers were homogenized in PerfectPure Lysis buffer (VWR, Murarrie, Australia) and RNA was extracted according to manufacturer instructions, including an on-column DNAase treatment. Extracted total RNA quality was determined by NanoDrop Spectrophotometer absorbance readings (Invitrogen, Mulgrave, Australia) and an RNase-free 1% agarose gel. Total RNA was pipetted onto an RNAstable plate according to manufacturer instructions (Biomatrica) for shipment to the Biosciences Core Laboratory sequencing facilities at the King Abdullah University of Science and Technology. Standard TruSeq protocol (Illumina) was followed for cDNA synthesis and library construction and HiSeq2000 was used for transcriptome sequencing.
Genome Assembly and Gene Annotation
Genome assembly and gene annotation for Heron Island A. polyacanthus were performed for the first time here, but was performed previously for Palm Island A. polyacanthus by Ryu et al. (2018). Methods of genome assembly and gene annotation for the Heron Island fish were the same as described in Ryu et al. (2018) for the Palm Island fish. Briefly, genome sequences of Heron Island and Palm Island fish resulted in 16,609 genomic scaffolds for Heron Island with 129× coverage (shortest scaffold: 500 bp, N50: 527,731 bp, longest scaffold: 3,215,819 bp, total length of scaffolds: 943 Mbp) and 30,414 genomic scaffolds for Palm Island with 173× coverage (shortest scaffold: 500 bp, N50: 334,400 bp, longest scaffold: 2,466,117 bp, total length of scaffolds: 992 Mbp). Genome assembly completeness assessed by CEGMA (Parra et al., 2007) was 99.19 and 97.98% for Heron and Palm Island populations, respectively.
Expression Analysis and Functional Annotation
25,301 and 23,465 annotated gene models for the Palm and Heron Island populations, respectively, were used for expression analysis. 17,423 orthologous groups (17,569 and 17,758 genes for Heron and Palm Island populations, respectively) between populations were determined using Inparanoid (O’Brien et al., 2005) and were used for downstream analyses. Raw read counts were normalized and variance stabilized, and p-values for each gene were calculated using the DESeq2 (Anders and Huber, 2010) between short-term treatments for each population relative to their respective controls. P-values were then corrected for multiple testing using p.adjust function of R with Benjamini and Hochberg method. Genes with adjusted p-value ≤ 0.05 and absolute value of log2 fold ≥1 were considered as differentially expressed genes (DEGs). DEGs were analyzed in an MDS using the “mds” function of the “smacof” R package (De Leeuw and Mair, 2011) using the Pearson correlation coefficient as the dissimilarity measure. Confidence radii on the MDS plots were calculated using “bootmds” of the “smacof” package (De Leeuw and Mair, 2011) with 1,000 bootstrap replications.
To determine differences in basal levels of heat shock protein (HSP) genes between populations, we performed an additional normalization and differential gene expression analysis to compare the Heron Island control read counts to the Palm Island control counts. This generated 6,488 orthologs. Sequences of DEGs were searched using BLASTP (Altschul et al., 1997) against the NCBI non-redundant protein database with an e-value cut-off of 10-10. We assigned biological function to each differentially expressed gene between the short-term treatment and controls [Supplementary Table S4 based on database information (Pundir et al., 2017), literature searches, and available Gene Ontology terms (Ashburner et al., 2000; The Gene Ontology Consortium, 2017)]. It should be noted that a gene may have multiple biological functions, however, we assigned the main and/or most likely function to gain an overall view of what is happening among the 690 DEGs (Supplementary Table S4). As above, MDS plots for upregulated and downregulated DEGs were performed using the total number of genes per function and temperature treatment.
Results
Differential Gene Expression Between Temperature Treatments and Populations
The Heron Island population had the most DEGs (588), with 380 and 482 genes in the +1.5 and +3°C treatments (respectively) compared with the control group (Figure 1), of which 325 genes were significantly different in both temperature treatments.
Palm Island had three times fewer DEGs (193), with 76 and 168 genes in the +1.5 and +3°C treatments (respectively) compared to the control group (Figure 1), of which 66 genes were significantly different in both temperature treatments. Multidimensional scaling (MDS) analysis of the DEGs for Heron Island (Figure 2A) and Palm Island (Figure 2B) populations shows clear separation between control and the two elevated temperature treatments.
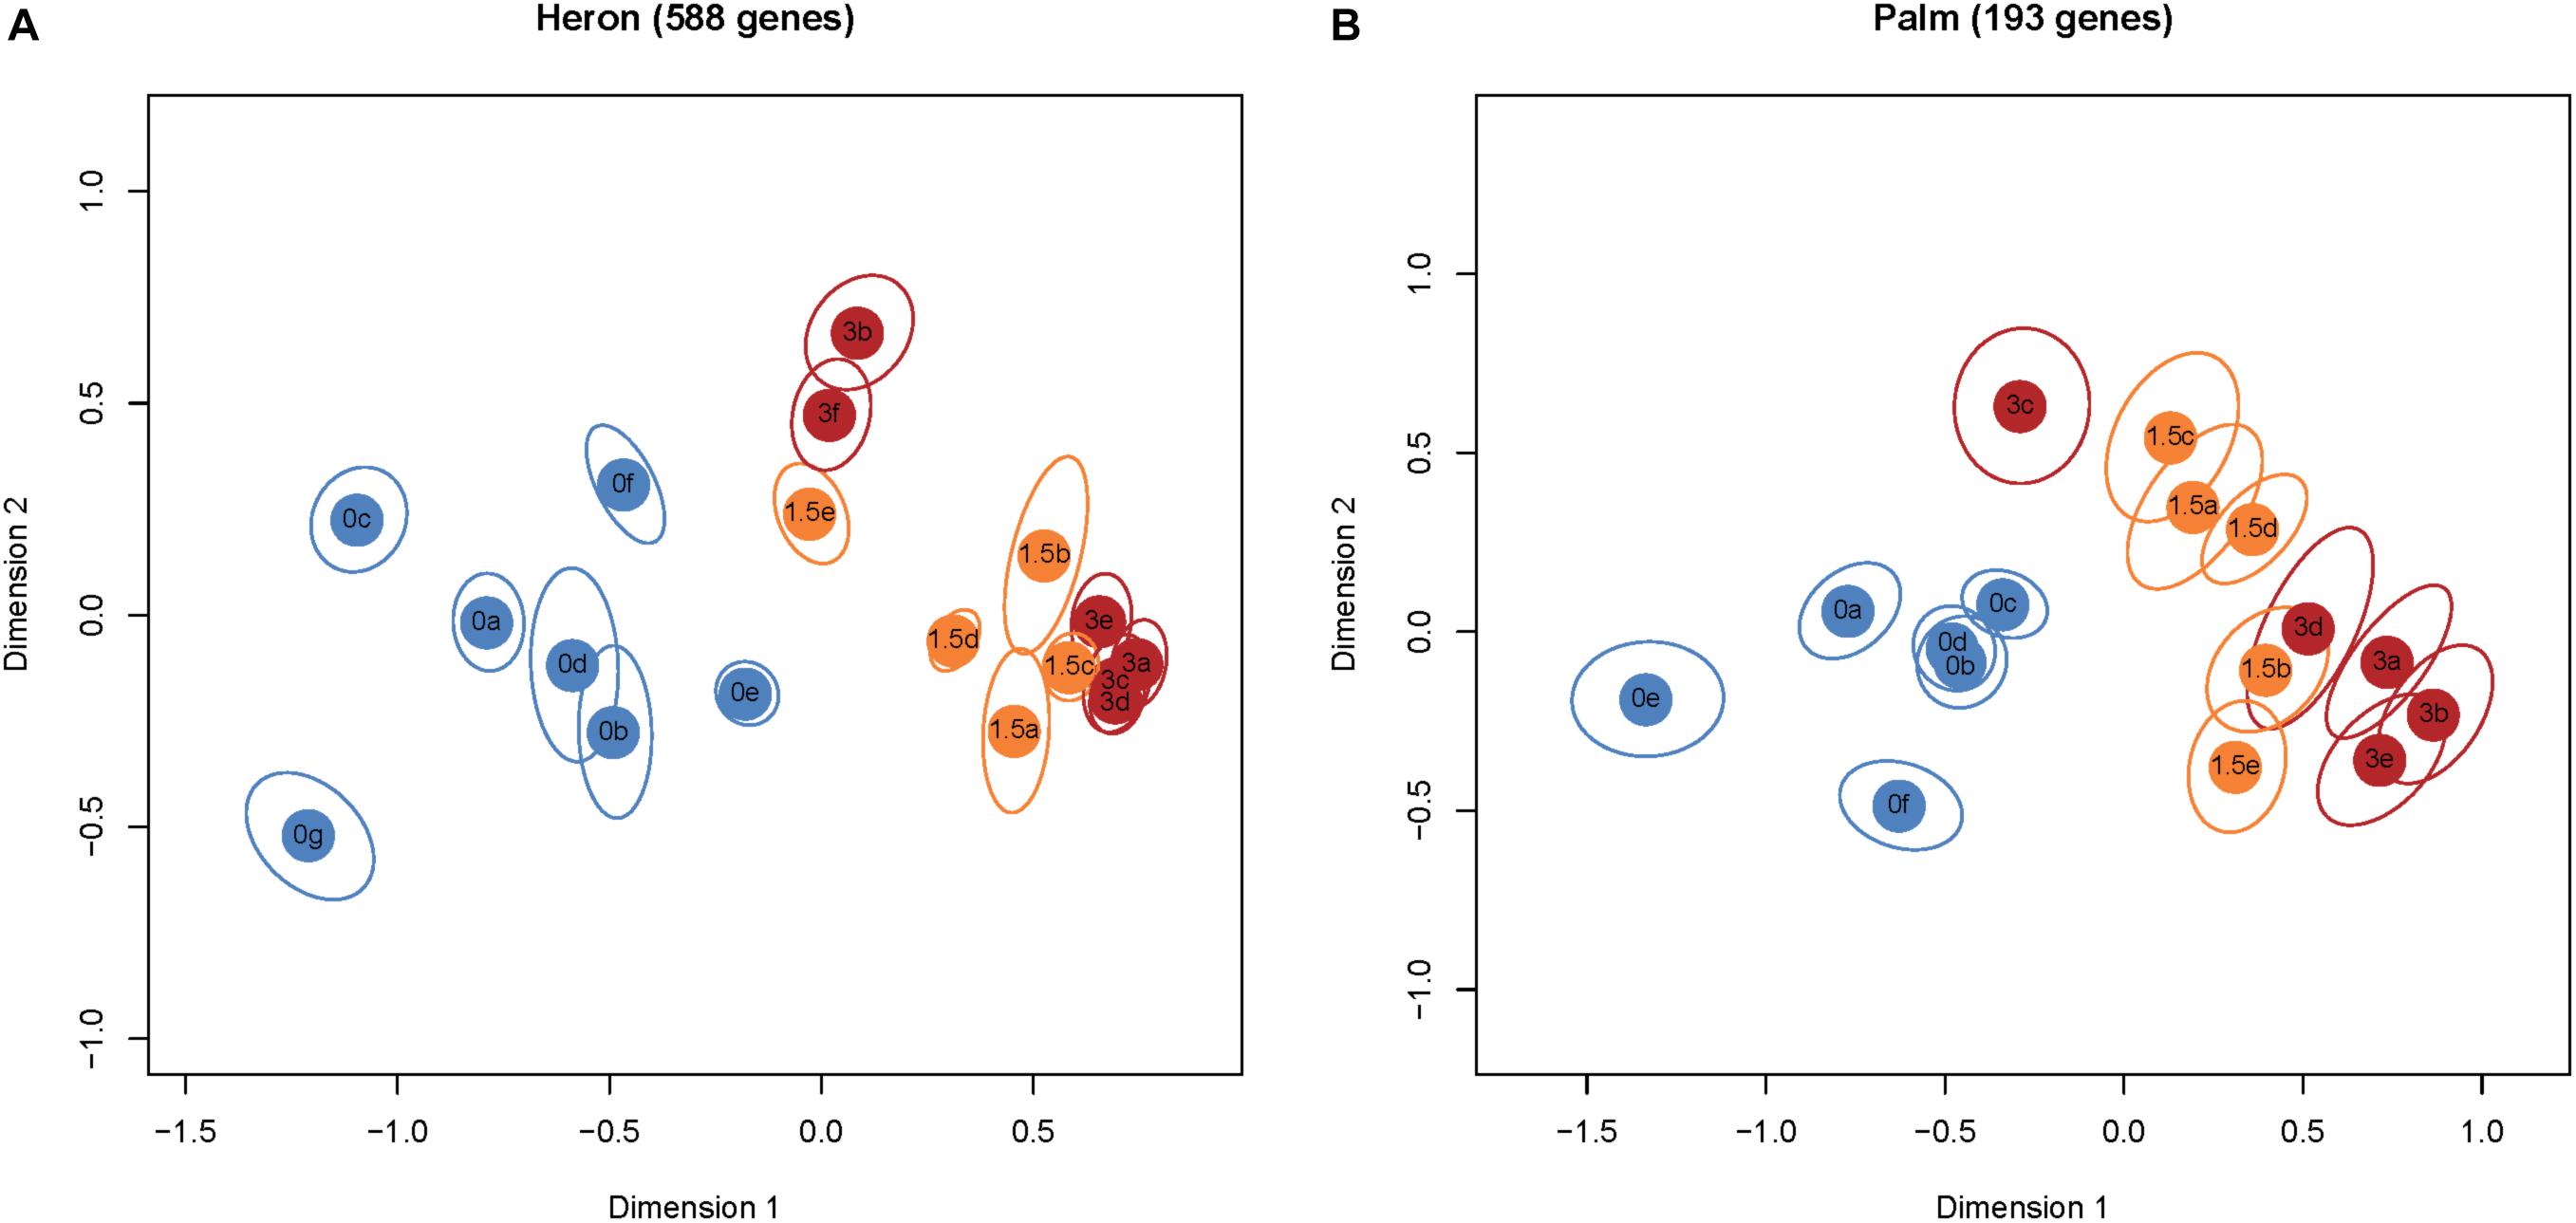
FIGURE 2. MDS plots of normalized and variance stabilized read counts of DEGs (≥1.0 and ≤–1.0 log2 fold). Each colored circle represents one fish. Treatment groups are denoted by different colors: blue +0°C, orange +1.5°C, and red +3°C. Each ellipse represents a 95% confidence interval from 1,000 bootstraps of DEGs from each sample. Non-overlapping ellipses imply statistically significant differences among individuals. There was overlap between the elevated temperature treatments in both populations, although this is not surprising given that 86% of DEGs from both populations in the +1.5°C treatments are also differentially expressed in their respective +3°C treatments. The Heron Island population (A) had a lower proportion of upregulated genes than the Palm Island population (B): +1.5°C 37% versus 55% and +3°C 51% versus 79% (Figure 1).
Functional Differences Between Temperature Treatments and Populations
Stress and metabolism were among the top upregulated functions in both populations and both temperature treatments (Figure 1). Transcriptional regulators were upregulated in both populations in the +3°C temperature treatments, while there was a high proportion of transport and growth genes upregulated only in the elevated temperature treatments for the Palm Island population. The Heron Island population downregulated immune function, cell organization, and metabolic genes in the elevated temperature treatments. In contrast, there were few highly represented downregulated functions in both elevated temperature treatments for Palm Island, with only stress and metabolic genes downregulated in Palm Island +1.5°C and none within the top 50% of genes in Palm Island +3°C (Table 1).
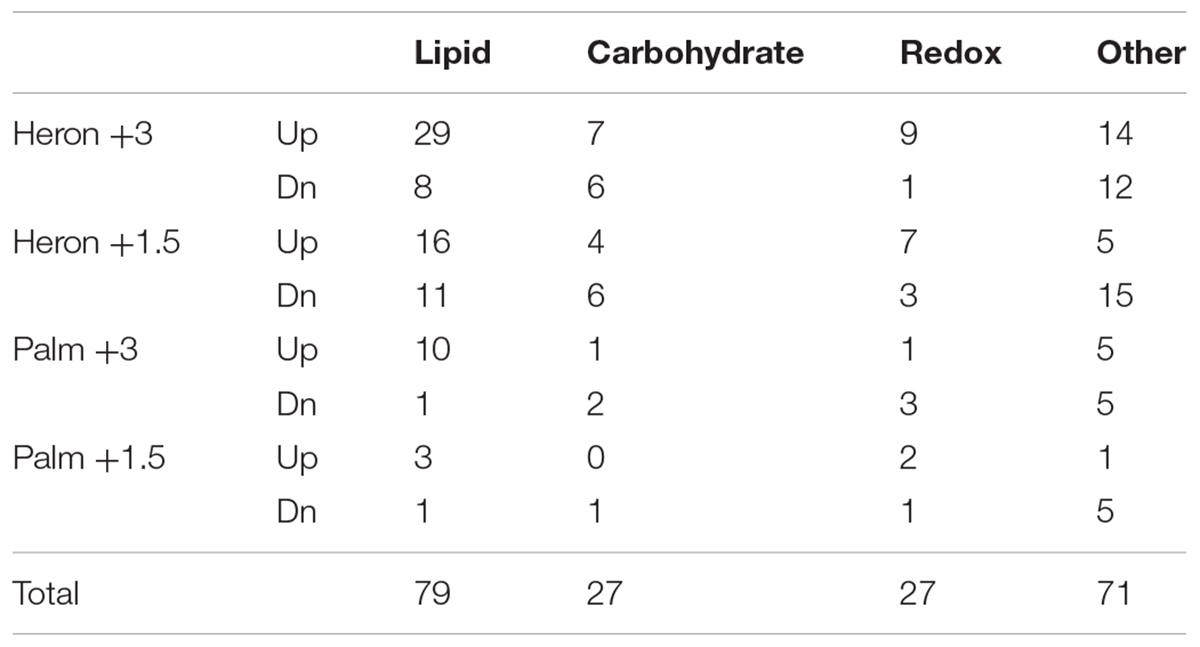
TABLE 1. Number of differentially regulated metabolic genes that were up and downregulated in each treatment.
Differential expression of metabolic genes, represented highly in nearly every temperature treatment (Table 1 and Figure 1), were primarily involved in lipid and carbohydrate metabolism, redox reactions, and protein catabolism. Overall, there were more genes upregulated than downregulated in lipid metabolism in each treatment. Carbohydrate metabolism was up and downregulated by nearly the same number of genes in each temperature treatment. There were more upregulated genes involved in redox reactions in every treatment except for Palm Island +3°C (Table 1).
Heron Island temperature treatments induced differential regulation of a similar number of genes to each other among all functional categories (Figure 3). The greatest difference in DEGs between Heron Island temperature treatments, with more genes upregulated in +3°C than +1.5°C, were for those genes involved in metabolism (27 genes) and stress (20 genes; Figure 3C). The MDS plot of upregulated functions did not show a clear separation between Palm Island +3°C and the Heron Island temperature treatments (Figure 3A).
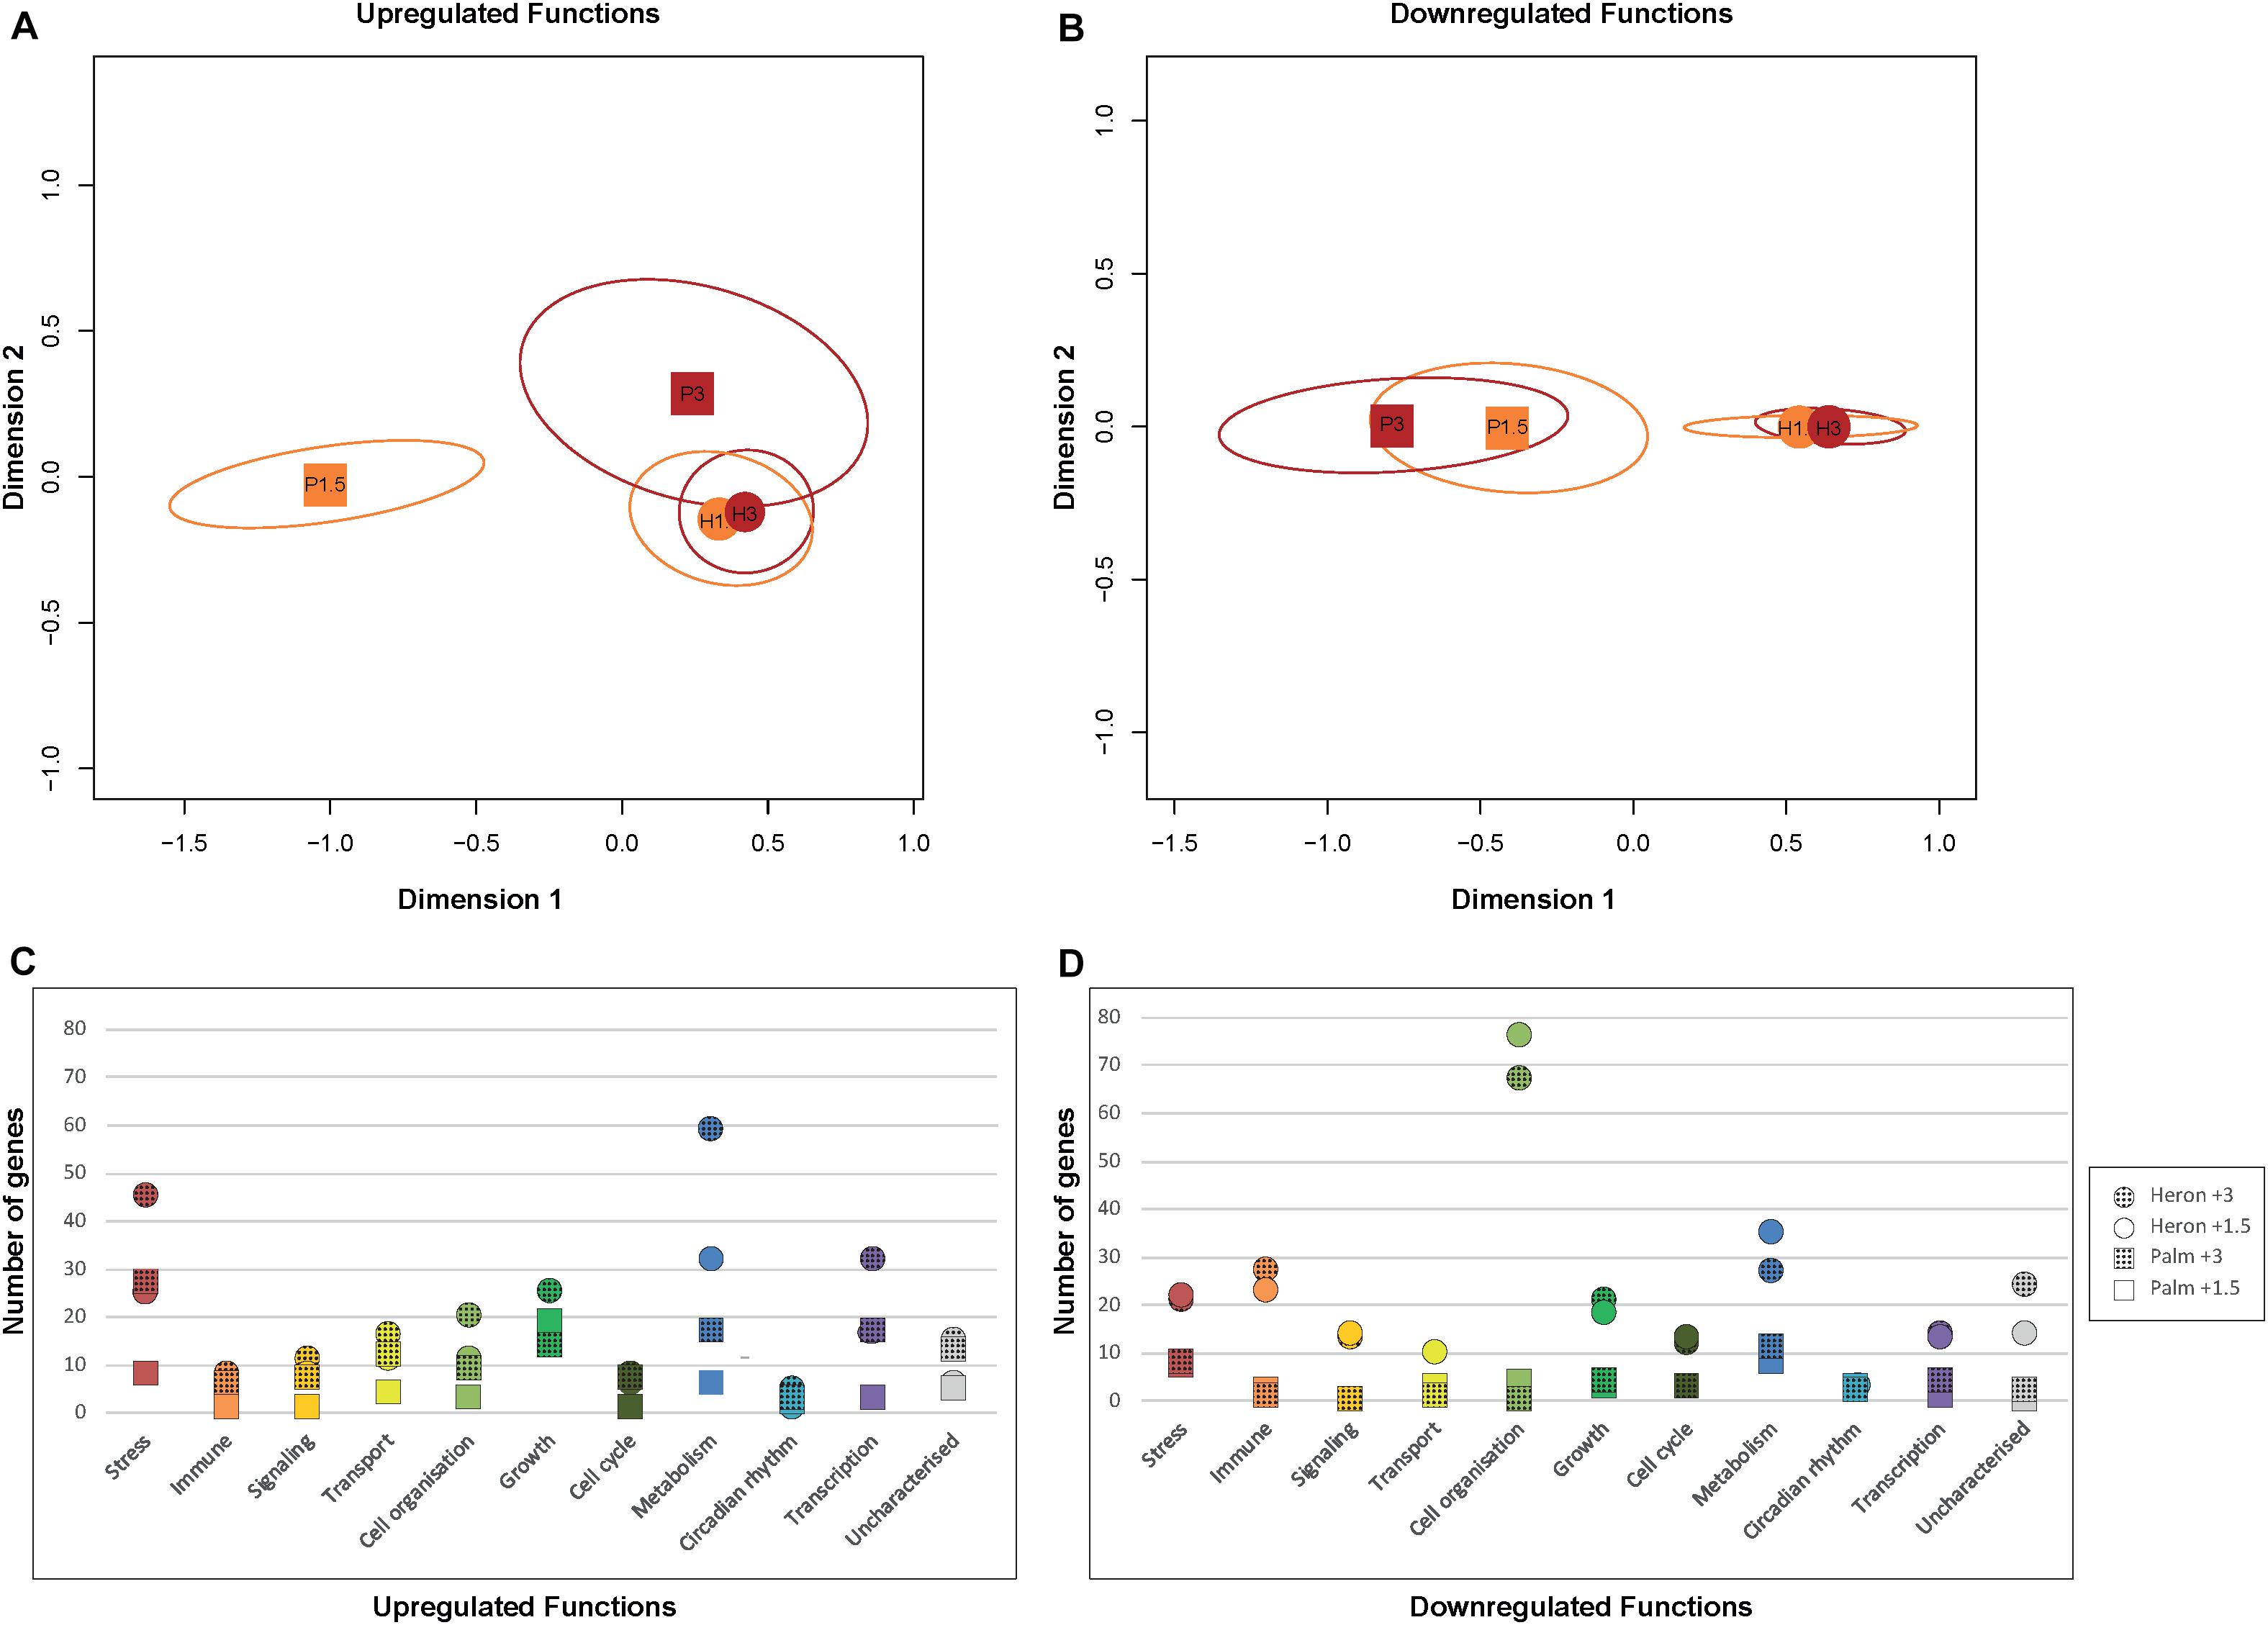
FIGURE 3. DEGs associated with biological functions from each temperature treatment (+1.5°C and +3°C) compared to respective controls from Heron Island and Palm Island populations of A. polyacanthus. MDS plots of the number of upregulated (A) and downregulated (B) genes from Heron (circles) and Palm (squares) Island populations relative to respective controls associated with each functional category. Temperature treatments are denoted by different colors: orange +1.5°C and red +3°C. Number of upregulated (C) and downregulated (D) genes associated with biological functions from each temperature treatment (+1.5°C = solid, +3°C = hatched fills) and population (Heron = circles, Palm = squares) relative to respective controls.
However, Palm Island +3°C and the Heron Island temperature treatments were clearly separated from Palm Island +1.5°C (Figure 3A), which is unsurprising given that Palm Island +1.5°C had three times fewer upregulated genes than Palm Island +3°C and Heron Island +1.5°C, and six times fewer than Heron Island +3°C (Figure 1). In contrast, the MDS analysis of downregulated functions showed clear separation between Heron and Palm Island temperature treatments (Figure 3B). Nearly every functional category had more downregulated DEGs in the Heron Island population compared to the Palm Island population, with the greatest difference between the treatment means of each population involved in cell organization (70 genes ± 5 SE), immune function (24 genes ± 2 SE), and metabolism (22 genes ± 4 SE; Figure 3D).
Common Transcriptional Responses Between Populations
137 genes were differentially expressed in both populations relative to their respective control in at least one temperature treatment (Figures 4H–O).
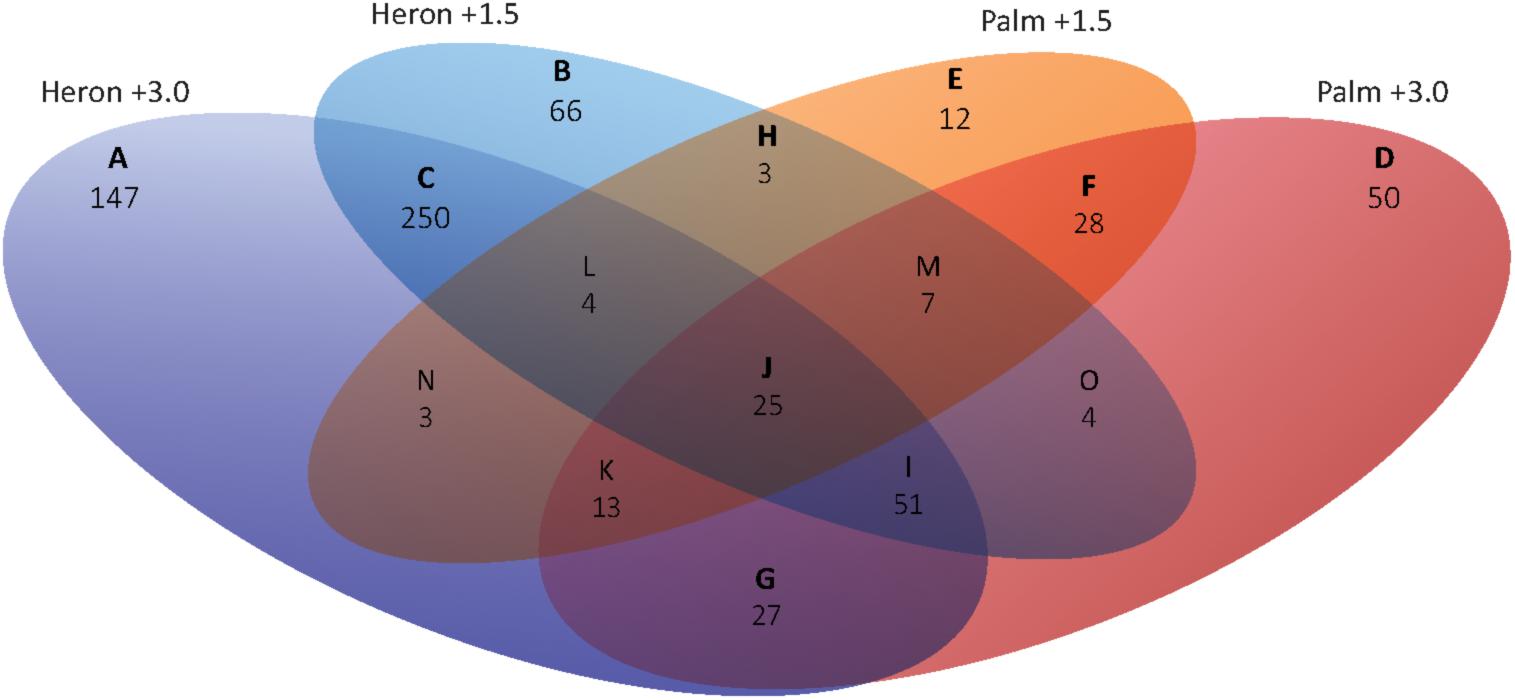
FIGURE 4. Venn diagram of DEGs (≥1.0 and ≤–1.0 log2 fold) for Heron and Palm Island thermal stress treatments (+1.5 and +3°C) compared to their respective controls (+0°C). Representing a general response to increased temperature, 25 genes were differentially expressed in all temperature treatments relative to controls (Figure 4J). Over half of these genes were upregulated in all treatments and were largely involved in metabolism (lipid, cholesterol, amino acid) and stress (neuroprotection and apoptosis; Supplementary Figure S1). Homer1 was the most DEG across all treatments, with double the upregulation in the Heron Island (+1.5°C: 3.0-fold, +3°C: +3.2-fold) compared to Palm Island (+1.5°C: +1.1-fold, +3°C: +1.5-fold) population. Homer1 regulates metabotropic glutamate receptor function (Brakeman et al., 1997), which in turn is involved in synaptic plasticity, neurotoxicity, and neuroprotection (Bruno et al., 2001).
Twenty-seven genes were only activated upon experiencing the most extreme temperature, +3°C, in both populations (Figure 4G). Again, most genes (20) were upregulated in the +3°C treatments and were primarily involved in a stress response (apoptosis and ubiquitination), cell organization (cell adhesion, actin cytoskeleton, and endocytosis), and transcriptional regulation (Supplementary Figure S1). The most upregulated gene was Timp2 (Heron +3°C: +2.8-fold, Palm +3°C: +2.6-fold), which suppresses cell proliferation and may be critical for maintaining tissue homeostasis (Stetler-Stevenson and Seo, 2005). Additionally, three genes involved in apoptosis were upregulated in both +3°C treatments: Acaa2, Ier3, and Tp53bp2. Chordc1, a putative co-chaperone with HSP90 (Gano and Simon, 2010) involved in the stress response, had the greatest downregulation (Heron +3°C: -1.6-fold, Palm +3°C: -1.8-fold). Only three genes were induced in both populations at +1.5 and not +3°C (Figure 4H), including an upregulated developmental gene, Adamts6, and two downregulated genes involved in transport (Abca1: cholesterol transport and Slc25a34: a mitochondrial carrier). Fifty-one genes were differentially regulated in both Heron Island temperature treatments and only at the highest temperature in Palm Island +3°C (Figure 4I). Forty-two (82%) of these genes were upregulated and involved primarily in transcriptional regulation, metabolism (carbohydrate, lipid), and stress (apoptosis, liver regeneration, ubiquitination; Supplementary Figure S1). The two most upregulated genes across the three treatments, Grb10 (+2.6-, +2.7-, and +2.3-fold for Heron +1.5, Heron +3, and Palm +3, respectively) and Esrra (+3.3-, +2.1-, and +1.4-fold fold for Heron +1.5, Heron +3, and Palm +3, respectively), may have major roles in hormonal regulation.
Common Transcriptional Responses Between Temperature Treatments
We found 250 genes that were differentially expressed within both Heron Island temperature treatments (Figure 4C). 165 (66%) of these genes were downregulated and involved mostly in cell organization (9 of the top 20 downregulated genes), metabolism (lipid, protein, carbohydrate, oxidation–reduction), and immune function (Supplementary Figure S1). Upregulated genes were primarily involved in metabolism, with many linked to the electron transport chain.
Twenty-eight genes were shared between the Palm Island temperature treatments (Figure 4F). In contrast to the Heron Island treatments, most of these genes were upregulated (64%) and were primarily involved in ion transport, cell organization, growth, and stress (apoptosis; Supplementary Figure S1). The most upregulated gene was Ppm1k (Palm +1.5°C: +1.8-fold, Heron +3°C: +2.0-fold) and is essential for cell survival and development by playing a key role in the regulation of the mitochondrial permeability transition pore.
Temperature- and Population-Specific Transcriptional Responses
A total of 275 genes were differentially expressed in only one temperature and population treatment. Heron Island +3°C had 147 DEGs compared to control that were not found in any other treatment (Figure 4A). Most genes were upregulated, with primary functions in metabolism, stress, and transcription (Supplementary Figure S1). The most highly upregulated gene was Bbox1 (+2.7-fold), which catalyzes the formation of L-carnitine – an essential molecule for the transport of fatty acids across the mitochondrial membrane during beta-oxidation. In contrast, 80% of the 66 Heron Island +1.5°C genes were downregulated (Figure 4B) and were mostly involved in cell organization, metabolism, and immune processes (Supplementary Figure S1). The most downregulated Heron Island +1.5°C gene was Elovl6 (-2.9-fold), which catalyses the first and rate-limited reaction of long-chain fatty acid elongation.
Palm Island +3°C differentially expressed 50 unique genes when compared to control (Figure 4D). Similar to Heron Island +3°C, most genes differentially regulated genes in Palm Island +3°C were upregulated (74%), and were primarily involved in transcription, stress, metabolism, and signaling (Supplementary Figure S1). One of the most upregulated was Cyp27a1 (+1.8-fold), involved in catalyzing the first step in the oxidation of the side chain of sterol intermediates. Twelve unique genes were differentially expressed in Palm Island +1.5°C relative to control (Figure 4C), of which most were downregulated (67%) and involved in stress, cell organization, and metabolism (Supplementary Figure S1). Klk8 was the most downregulated gene (-2.1-fold) and is a serine protease capable of degrading many proteins.
Heat Shock Proteins
Of 96 identified inducible HSPs (Kampinga et al., 2009), only 4 were differentially expressed in the Heron and Palm Island populations of A. polyacanthus following 28-day exposure to +1.5 and +3°C compared to respective controls (Figure 5).
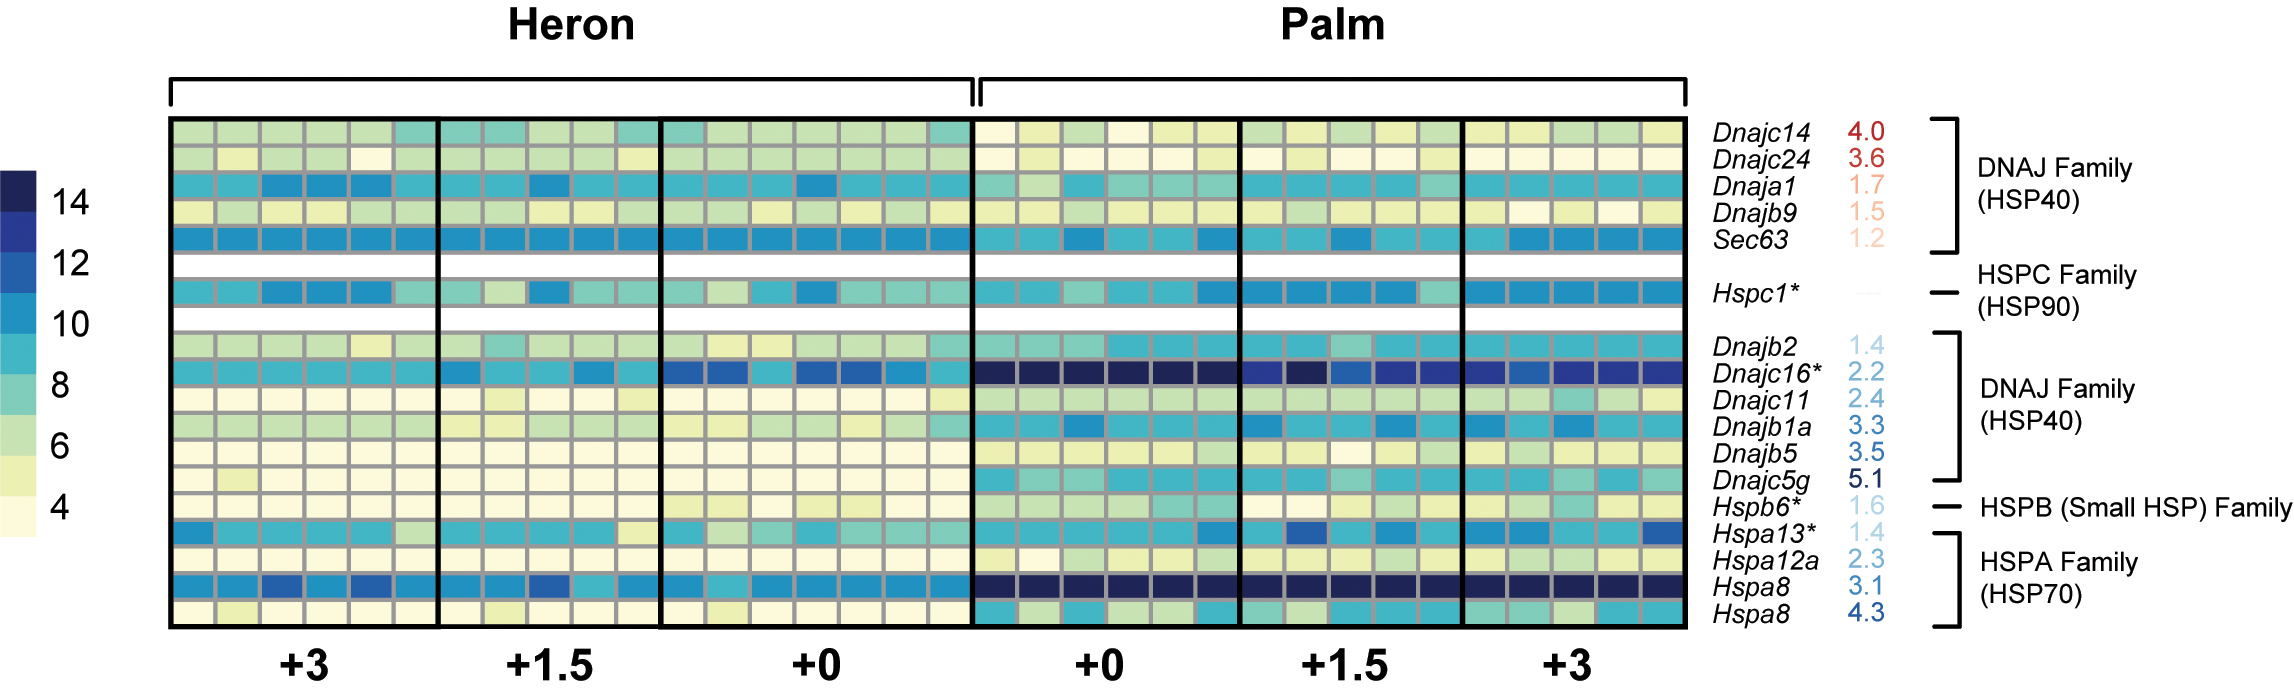
FIGURE 5. Heatmap representing the normalized read counts of Hsp genes that were differentially expressed between Heron and Palm Island control (+0°C) treatments. Genes are grouped by HSP families and separated based on higher expression in Heron Island controls (red numbers) or higher expression in Palm Island controls (blue numbers). Hsp genes with an ∗ denote genes with differential expression between at least one elevated treatment and the respective control.
Two of these were upregulated: Hspa13 of the heat-inducible HSP70 family was upregulated in Heron Island +3°C relative to control (+1.7-fold) and Hspc1 of the HSP90 family was upregulated in Palm Island +3°C. Of the two downregulated HSPs, one was from the HSP40 family, Dnajc16, and was downregulated in all but the Heron Island +1.5°C treatment (-1.1-, -1.1-, and -1.5-fold in Heron +3, Palm +1.5, and Palm +3°C, respectively). Finally, from the small HSP family, Hspb6 was downregulated in Palm Island +1.5°C (-1.5-fold) treatment compared to control.
To determine if the Palm Island population has a greater baseline level of expression of HSP genes to cope with on average 1.5°C warmer annual temperatures compared to the Heron Island population, we identified differential gene expression of orthologs between the controls of both populations. Of the 6,488 genes, of which 4,804 had ≥1.0 or ≤-1.0 log2 fold change, 16 HSPs were differentially expressed between Heron Island +0 and Palm Island +0°C (Figure 5). Five HSPs had greater expression in Heron Island control and all were from the DNAJ (HSP40) family. Over twice as many HSPs had greater expression in the Palm Island controls, six of which were also from the DNAJ (HSP40) family, albeit different members than those that were higher in Heron controls. In addition, there was one HSP higher in Palm controls from the HSPB (small HSP) family, and four were from the HSPA (HSP70) family.
Discussion
To understand how reef fish cope with extreme thermal events, we measured the transcriptional responses in the liver of two genetically distinct populations of spiny chromis damselfish that have different capacities for acclimating aerobic performance to high temperatures: the higher-latitude population from Heron Island has greater capacity for thermal plasticity of aerobic scope than the lower-latitude Palm Island population (Donelson and Munday, 2012). Here we show that the Heron and Palm Island populations have different transcriptomic signatures following 28 days of elevated summer temperatures within the range that are predicted to occur more frequently on coral reefs in the near future. The Heron Island population showed greater plasticity of gene expression, with over three times as many differentially expressed genes compared to the Palm Island population. In addition, the Heron Island fish downregulated more genes in nearly every functional category than the Palm Island fish, with a high proportion of genes involved in the downregulation of cell organization and immune processes. These trends suggest that the reduction in expression of many functions following 28 days of thermal stress in the Heron population may allow improved maintenance of basal functions during sustained elevated temperatures. Interestingly, the Palm Island treatments upregulated a high proportion of genes involved in growth and cell proliferation, despite the fact that these functions are typically suppressed during the CSR (Kültz, 2005). In addition, we found a common molecular signature represented by 25 genes, which did not include HSPs, that were differentially expressed in both populations and each treatment and may be generic indicators of thermal stress. In all, our results suggest that the two populations employ different strategies to cope with thermal stress and that the Heron Island population may be better suited to prolonged exposure to elevated temperatures.
The different transcriptomic responses of the two populations of A. polyacanthus to the same relative short-term increases in temperature are consistent with selection and potentially local adaptation to their different thermal environments. The limited ability to affect gene expression in the Palm Island compared to Heron Island population is consistent with the hypothesis that living in a warmer environment reduces the need to maintain a plastic response to thermal stress (Tewksbury et al., 2008). HSPs are molecular chaperones that are expressed to protect proteins, help them fold or, if too damaged, remove them through proteolysis (Feder and Hofmann, 1999). There are two broad categories of HSPs: (1) constitutively expressed HSPs that maintain normal cellular function and protein folding and (2) inducible HSPs that are activated following cellular stress. In general, the temperature at which the heat shock response is induced is correlated with the temperature range the organism typically experiences – the higher the temperature in which the organism lives, the higher the threshold for induction (Feder and Hofmann, 1999). As absolute control temperatures differed between populations (Heron: 27°C, Palm: 28.5°C), we evaluated if the reduced number of DEGs in the Palm Island population could be due to elevated basal levels of Hsp genes. The induction and synthesis of HSPs are likely energetically costly (Feder and Hofmann, 1999) and maintaining elevated basal levels could be advantageous to organisms that frequently experience high temperatures. Numerous fishes that have evolved in constant cold (Hofmann et al., 2000; Afonso et al., 2008; Clark et al., 2008) or warm temperatures (Kassahn et al., 2007a) have failed to elicit a HSR when exposed acutely or short term to increased temperatures. For these fishes, it has been hypothesized that maintaining higher constitutive levels of otherwise inducible HSPs are required to sustain proper protein folding and function in chronically cold or warm conditions (Logan and Buckley, 2015). We found that the Heron and Palm Island populations each induced only one Hsp gene (Hspa13 and Hspc1, respectively). However, we also found that each population expressed different basal levels of several DNAJ (HSP40) family members in control conditions, with five higher in Heron and six higher in the Palm Island control treatments. The DNAJ family interacts with HSP70 proteins, stimulates HSP70 ATPase activity, and prevents the aggregation of unfolded proteins. The different suites of DNAJ family members expressed in the two distinct populations may be a result of their differing evolutionary history. Although the DNAJs were the only HSPs with elevated expression in the Heron Island controls compared to Palm Island controls, there were five other HSPs from two families that were higher in the Palm Island population: Hspb6 from the HSPB (small HSP) family, which mediates cardioprotection and angiogenesis, and four members of the HSPA (HSP70) family, including two isoforms of Hspa8, which is a constitutively expressed HSP that aids in the correct folding of newly translated and misfolded proteins. The higher expression levels of HSPA and HSPB members in the Palm Island population may contribute to the three times lower change in gene expression at higher temperatures; having ready access to elevated levels of these HSP genes may help initially with short-term thermal stress.
A hallmark of the CSR is the activation of cell cycle checkpoints to monitor the integrity of macromolecules and detect and repair DNA damage. Although genes related specifically to cell cycle were not proportionally high in any treatment, Heron Island fish significantly downregulated more genes in this category than Palm Island fish. Further, Heron Island fish downregulated more genes in nearly every functional category assessed compared to the Palm population, suggesting most of these functions may be suppressed to increase available energy during sustained stress. Cell organization and immune response functions were the two most downregulated processes in both Heron treatments and were not represented at a proportionally high level in the Palm treatments. As part of the broader CSR, cell organization genes have been shown to be differentially regulated in several transcriptome studies of fish exposed to thermal stress (Podrabsky and Somero, 2004; Buckley et al., 2006; Kassahn et al., 2007a,b; Rebl et al., 2013; Smith et al., 2013; Jorgensen et al., 2014). Stabilizing cell structure and integrity is thought to be important during thermal stress (Podrabsky and Somero, 2004), and downregulation of cytoskeletal genes has been proposed to be a consequence of compromised growth performance and energy homeostasis in the hearts of immature Atlantic Salmon exposed to higher temperature (Jorgensen et al., 2014). This is consistent with our hypothesis that downregulation of cell organization in the Heron Island population provided increased energy levels during sustained thermal stress. Immune suppression and increased susceptibility to disease are a common response to thermal stress in fish (Wendelaar Bonga, 1997). Thus, by downregulating immune function to putatively increase energy homeostasis, the Heron Island population may potentially be more susceptible to infection and disease compared to the Palm Island population during extreme thermal stress.
Upon sensing damage to lipid membranes, DNA, proteins, and changes to the cellular redox state or free radical levels, the cell responds by stabilizing and repairing damage using metabolic resources reallocated from general functions to the CSR (Kültz, 2005). Both temperature treatments in the Heron and Palm Island populations showed shifts in metabolism, with upregulated and downregulated genes proportionally high in nearly every treatment. Lipid metabolism was more highly upregulated than downregulated in each treatment and genes involved in cellular redox were more upregulated in all but the Palm Island +3°C treatment. Increases in lipid use (Kieffer et al., 1998), an increased demand for fatty acid oxidation (McClelland, 2004), and induction of enzymes required to produce reducing equivalents (NADH, NADPH) needed for cellular antioxidant systems (Kültz, 2005) are common during thermal stress. In addition, the upregulation of lipid metabolism may also reflect the need to adjust cellular membrane composition to compensate for increased membrane fluidity in warmer temperatures, a process known as homeoviscous adaptation (Hazel, 1995).
Another feature of the CSR found among the temperature treatments in both the Heron and Palm Island populations was an upregulation in genes involved in stress, primarily involved in apoptosis and ubiquitination. There was also a high proportion of downregulated genes in the Heron Island +1.5°C treatment involved in stress, with three genes involved in the HSR (Hsbp6, Hsf1, and Dnajc16). Further, HSPs and other co-chaperones were downregulated in each of the other treatments, albeit not at a proportionally high level. Expression of several HSPs (Hsp90α/Hsp90aa1, Hsp90β/Hsp90aab1, Hsp47/Serpine1, and Hsp70/Hspa1a) was downregulated in lake whitefish (Coregonus clupeaformis) embryos that received 1 h of thermal stress (+6 or +9°C) repeated every 6 days from 15 to 75 days post-fertilization (Whitehouse et al., 2017). The authors suggest that the HSP downregulation may be due to an increased pool of HSPs. Although the sustained thermal stress experienced by A. polyacanthus in our experiment was quite different to the lake whitefish, the costly nature of transcribing and translating HSPs may lead to a downregulation of Hsp genes once a certain amount of HSPs have been produced so the cell can better conserve energy during the continued thermal stress.
A typical universal response of the CSR is the suppression of growth and cell proliferation to preserve and redirect energy toward macromolecule stabilization and repair (Kültz, 2005). The Heron Island population downregulated more growth-related genes than Palm Island fish, again suggesting that the Heron Island population has a superior ability to conserve energy and promote repair under extreme thermal stress. Contrary to the typical CSR, both Palm Island treatments had a high proportion of upregulated genes involved in growth and cell proliferation. Increased expression of growth and cell proliferation genes were also observed in transcriptome analyses of the gills of two strains of rainbow trout exposed to thermal stress for 2 weeks (Rebl et al., 2013) and the gills of the longjaw mudsucker following acute thermal stress for 8 h. Rebl et al. (2013) surmise that elevated levels of HSPs could be responsible for increased proliferation since HSPs can interact with certain growth-specific proteins. This may also be the case for the Palm Island population as they had higher basal quantities of Hsp genes compared to Heron Island fish. Our results indicate that further investigation into a relationship of growth-HSP gene induction under thermal stress is warranted. Regardless, while the Heron Island population appears to conserve energy by downregulating growth-related genes, the Palm Island population expends energy on growth during thermal stress, perhaps at the cost of other important processes.
There were 51 genes shared among Heron and Palm Island populations that were differentially expressed at both elevated temperatures in the Heron Island population but only differentially regulated at the highest temperature in the Palm Island population. This may reflect a need to conserve energy in the Palm Island population, perhaps eliciting an impaired stress response in the Palm +1.5°C treatment. For example, the lack of Ptpn21 upregulation in Palm +1.5°C compared to the other treatments may have consequences on the liver as this gene has putative roles in liver regeneration in mice (Higashitsuji et al., 1995) and, through its association with the protein BMX, may confer adaptive cytoprotection against stress (Chau et al., 2005).
Conclusion
Our results suggest that the higher latitude Heron Island population has greater plasticity of gene expression. Furthermore, Heron Island fish downregulated many biological processes, particularly cell organization and immune function, likely to provide more energy to cope in an extreme thermal environment. We hypothesize that this mass downregulation indicates that this population reduces these functions in order to maintain critical functions as part of the CHR. However, this may be at the cost of other processes such as immune function, potentially increasing susceptibility to infection and disease at higher temperatures. In contrast, the Palm Island population differentially regulated far fewer genes in the higher temperature treatments, and most were upregulated. Elevated levels of Hsp gene expression in controls compared to the Heron Island population may contribute to this limited change in gene expression and may also promote the expression of genes related to growth. Further investigation into how the adapted levels of HSPs in different populations may confer some resilience to extreme temperatures in this tropical marine species and others across a wide geographical range may provide insight into how these animals may cope during extreme thermal events. Regardless, the limited change in gene expression to cope with thermal stress compared to the Heron Island population under the same absolute changes in temperatures suggests the Palm Island population had more limited energy available for properly stabilizing and repairing damage caused by thermal stress.
Data Availability
RNA-Seq transcriptome sequences have been deposited in GenBank under BioProject ID PRJNA255544.
Ethics Statement
This study was carried out in accordance with the recommendations of James Cook University Animal Ethics Committee. The protocol was approved by the JCU Animal Ethics Committee under JCU Ethics A1233 and A1415.
Author Contributions
JD and PM designed and managed the fish rearing experiments. HV prepared samples for sequencing. TR assembled and annotated the genome and transcriptomes. HV analyzed and annotated the expression data. All authors wrote the paper, and read and approved the manuscript.
Funding
Funding for this project was provided by Competitive Research Funds OCRF-2014-CRG3-62140408 from the King Abdullah University of Science and Technology (TR and PM); the Australian Research Council (PM); ARC Centre of Excellence for Coral Reef Studies (PM and JD); and APEC Climate Center (TR).
Conflict of Interest Statement
The authors declare that the research was conducted in the absence of any commercial or financial relationships that could be construed as a potential conflict of interest.
Acknowledgments
We thank the Integrative Systems Biology Lab at the King Abdullah University of Science and Technology, and the Marine and Aquaculture Research Facility Unit and the Molecular Ecology and Evolution Laboratory at James Cook University.
Supplementary Material
The Supplementary Material for this article can be found online at: https://www.frontiersin.org/articles/10.3389/fmars.2018.00349/full#supplementary-material
FIGURE S1 | Bar graphs depicting the number of genes per functional category from each section of the Venn diagram (Figure 4). Colors denote function. Upregulated genes are represented by solid bars and downregulated genes are represented by hatched bars. Bars with numbers indicate functions that represent at least 50% of the genes from each Venn diagram location.
TABLE S1 | Water temperatures.Mean seasonal water temperatures (± SD) for Palm and Heron Islands and differences in maximum and minimum daily temperatures over the past 13 years (http://data.aims.gov.au).
TABLE S2 | Number of days in which the average, maximum, and minimum daily temperatures exceeded +1.5°C or +3°C for Heron or Palm Island over the past 13 years (http://data.aims.gov.au).
TABLE S3 | Number of male and female biological replicates of Acanthochromis polyacanthus from control (+0°C) and temperature treatments (+1.5°C and +3°C) from Heron and Palm Island populations.
TABLE S4 | List of differentially expressed genes, log2 differential expression for each treatment relative to the respective population’s control, location in Venn diagram (Figure 4), and the assigned main or most likely function according to database and literature searches.
Footnotes
References
Afonso, L. O. B., Hosoya, S., Osborne, J., Gamperl, A. K., and Johnson, S. (2008). Lack of glucose and hsp70 responses in haddock Melanogrammus aeglefinus (L.) subjected to handling and heat shock. J. Fish Biol. 72, 157–167. doi: 10.1111/j.1095-8649.2007.01697.x
Altschul, S. F., Madden, T. L., Schäffer, A. A., Zhang, J., Zhang, Z., Miller, W., et al. (1997). Gapped BLAST and PSI-BLAST: a new generation of protein database search programs. Nucleic Acids Res. 25, 3389–3402. doi: 10.1093/nar/25.17.3389
Anders, S., and Huber, W. (2010). Differential expression analysis for sequence count data. Genome Biol. 11:R106. doi: 10.1186/gb-2010-11-10-r106
Ashburner, M., Ball, C. A., Blake, J. A., Botstein, D., Butler, H., Cherry, J. M., et al. (2000). Gene ontology: tool for the unification of biology. Nat. Genet. 25, 25–29. doi: 10.1038/75556
Australian Bureau of Meteorology [BOM] (2016). eReefs Marine Water Quality Dashboard. Melbourne, VIC: Bureau of Meteorology
Brakeman, P. R., Lanahan, A. A., O’Brien, R., Roche, K., Barnes, C. A., Huganir, R. L., et al. (1997). Homer: a protein that selectively binds metabotropic glutamate receptors. Nature 386, 284–288. doi: 10.1038/386284a0
Bruno, V., Battaglia, G., Copani, A., D’Onofrio, M., Di Iorio, P., De Blasi, A., et al. (2001). Metabotropic glutamate receptor subtypes as targets for neuroprotective drugs. J. Cereb. Blood Flow Metab. 21, 1013–1033. doi: 10.1097/00004647-200109000-00001
Buckley, B. A., Gracey, A. Y., and Somero, G. N. (2006). The cellular response to heat stress in the goby Gillichthys mirabilis: a cDNA microarray and protein-level analysis. J. Exp. Biol. 209, 2660–2677. doi: 10.1242/jeb.02292
Chau, C. H., Clavijo, C. A., Deng, H.-T., Zhang, Q., Kim, K.-J., Qiu, Y., et al. (2005). Etk/Bmx mediates expression of stress-induced adaptive genes VEGF, PAI-1, and iNOS via multiple signaling cascades in different cell systems. Am. J. Physiol. Cell Physiol. 289, C444–C454. doi: 10.1152/ajpcell.00410.2004
Clark, M. S., Fraser, K. P. P., Burns, G., and Peck, L. S. (2008). The HSP70 heat shock response in the Antarctic fish Harpagifer antarcticus. Polar Biol. 31, 171–180. doi: 10.1007/s00300-007-0344-5
De Leeuw, J., and Mair, P. (2011). Multidimensional scaling using majorization: SMACOF in R. J. Stat. Softw. 31, 1–30.
Doherty, P. J., Mather, P., and Planes, S. (1994). Acanthochromis polyacanthus, a fish lacking larval dispersal, has genetically differentiated populations at local and regional scales on the Great Barrier Reef. Mar. Biol. 121, 11–21. doi: 10.1007/BF00349469
Donelson, J., Munday, P., McCormick, M., and Pitcher, C. (2011). Rapid transgenerational acclimation of a tropical reef fish to climate change. Nat. Clim. Change 2, 30–32. doi: 10.1038/nclimate1323
Donelson, J. M., and Munday, P. L. (2012). Thermal sensitivity does not determine acclimation capacity for a tropical reef fish. J. Anim. Ecol. 81, 1126–1131. doi: 10.1111/j.1365-2656.2012.01982.x
Donelson, J. M., Munday, P. L., McCormick, M. I., and Pitcher, C. R. (2012). Rapid transgenerational acclimation of a tropical reef fish to climate change. Nat. Clim. Change 2, 30–32. doi: 10.1038/nclimate1323
Feder, M. E., and Hofmann, G. E. (1999). Heat-shock proteins, molecular chaperones, and the stress response: evolutionary and ecological physiology. Annu. Rev. Physiol. 61, 243–282. doi: 10.1146/annurev.physiol.61.1.243
Gano, J. J., and Simon, J. A. (2010). A proteomic investigation of ligand-dependent HSP90 complexes reveals CHORDC1 as a novel ADP-dependent HSP90-interacting protein. Mol. Cell. Proteomics 9, 255–270. doi: 10.1074/mcp.M900261-MCP200
Hazel, J. R. (1995). Thermal adaptation in biological membranes: is homeoviscous adaptation the explanation? Annu. Rev. Physiol. 57, 19–42. doi: 10.1146/annurev.ph.57.030195.000315
Higashitsuji, H., Arii, S., Furutani, M., Imamura, M., Kaneko, Y., Takenawa, J., et al. (1995). Enhanced expression of multiple protein tyrosine phosphatases in the regenerating mouse liver: isolation of PTP-RL10, a novel cytoplasmic-type phosphatase with sequence homology to cytoskeletal protein 4.1. Oncogene 10, 407–414.
Hofmann, G. E., Buckley, B. A., Airaksinen, S., Keen, J. E., and Somero, G. N. (2000). Heat-shock protein expression is absent in the Antarctic fish Trematomus bernacchii (family Nototheniidae). J. Exp. Biol. 203(Pt 15),2331–2339.
Hughes, T. P., Kerry, J. T., Álvarez-Noriega, M., Álvarez-Romero, J. G., Anderson, K. D., Baird, A. H., et al. (2017). Global warming and recurrent mass bleaching of corals. Nature 543, 373–377. doi: 10.1038/nature21707
Hughes, T. P., Kerry, J. T., Baird, A. H., Connolly, S. R., Dietzel, A., Eakin, C. M., et al. (2018). Global warming transforms coral reef assemblages. Nature 556, 492–496. doi: 10.1038/s41586-018-0041-2
Johansen, J. L., and Jones, G. P. (2011). Increasing ocean temperature reduces the metabolic performance and swimming ability of coral reef damselfishes. Glob. Change Biol. 17, 2971–2979. doi: 10.1111/j.1365-2486.2011.02436.x
Jorgensen, S. M., Castro, V., Krasnov, A., Torgersen, J., Timmerhaus, G., Hevroy, E. M., et al. (2014). Cardiac responses to elevated seawater temperature in Atlantic salmon. BMC Physiol. 14:2. doi: 10.1186/1472-6793-14-2
Kampinga, H. H., Hageman, J., Vos, M. J., Kubota, H., Tanguay, R. M., Bruford, E. A., et al. (2009). Guidelines for the nomenclature of the human heat shock proteins. Cell Stress Chaperones 14, 105–111. doi: 10.1007/s12192-008-0068-7
Kassahn, K. S., Caley, M. J., Ward, A. C., Connolly, A. R., Stone, G., and Crozier, R. (2007a). Heterologous microarray experiments used to identify the early gene response to heat stress in a coral reef fish. Mol. Ecol. 16, 1749–1763.
Kassahn, K. S., Crozier, R. H., Ward, A. C., Stone, G., and Caley, M. J. (2007b). From transcriptome to biological function: environmental stress in an ectothermic vertebrate, the coral reef fish Pomacentrus moluccensis. BMC Genomics 8:358. doi: 10.1186/1471-2164-8-358
Kavanagh, K. D. (2000). Larval brooding in the marine damselfish Acanthochromis polyacanthus (Pomacentridae) is correlated with highly divergent morphology, ontogeny and life-history traits. Bull. Mar. Sci. 66, 321–337.
Kieffer, J., Alsop, D., and Wood, C. (1998). A respirometric analysis of fuel use during aerobic swimming at different temperatures in rainbow trout (Oncorhynchus mykiss). J. Exp. Biol. 201, 3123–3133.
King, A. D., Karoly, D. J., and Henley, B. J. (2017). Australian climate extremes at 1.5°C and 2°C of global warming. Nat. Clim. Change 7, 412–416. doi: 10.1038/nclimate3296
Kültz, D. (2003). Evolution of the cellular stress proteome: from monophyletic origin to ubiquitous function. J. Exp. Biol. 206, 3119–3124. doi: 10.1242/jeb.00549
Kültz, D. (2005). Molecular and evolutionary basis of the cellular stress response. Annu. Rev. Physiol. 67, 225–257.
Logan, C. A., and Buckley, B. A. (2015). Transcriptomic responses to environmental temperature in eurythermal and stenothermal fishes. J. Exp. Biol. 218, 1915–1924. doi: 10.1242/jeb.114397
Logan, C. A., and Somero, G. N. (2011). Effects of thermal acclimation on transcriptional responses to acute heat stress in the eurythermal fish Gillichthys mirabilis (Cooper). Am. J. Physiol. Regul. Integr. Comp. Physiol. 300,R1373–R1383. doi: 10.1152/ajpregu.00689.2010
McClelland, G. B. (2004). Fat to the fire: the regulation of lipid oxidation with exercise and environmental stress. Comp. Biochem. Physiol. B Biochem. Mol. Biol. 139, 443–460. doi: 10.1016/j.cbpc.2004.07.003
Munday, P. L., Jones, G. P., Pratchett, M. S., and Williams, A. J. (2008). Climate change and the future for coral reef fishes. Fish Fish. 9, 261–285. doi: 10.1111/j.1467-2979.2008.00281.x
O’Brien, K. P., Remm, M., and Sonnhammer, E. L. L. (2005). Inparanoid: a comprehensive database of eukaryotic orthologs. Nucleic Acids Res. 33(Suppl. 1), D476–D480.
Parra, G., Bradnam, K., and Korf, I. (2007). CEGMA: a pipeline to accurately annotate core genes in eukaryotic genomes. Bioinformatics 23, 1061–1067. doi: 10.1093/bioinformatics/btm071
Planes, S., Doherty, P. J., and Bernardi, G. (2001). Strong genetic divergence among populations of a marine fish with limited dispersal, Acanthochromis polyacanthus, within the great barrier reef and the coral sea. Evolution 55, 2263–2273. doi: 10.1111/j.0014-3820.2001.tb00741.x
Podrabsky, J. E., and Somero, G. N. (2004). Changes in gene expression associated with acclimation to constant temperatures and fluctuating daily temperatures in an annual killifish Austrofundulus limnaeus. J. Exp. Biol. 207(Pt 13), 2237–2254. doi: 10.1242/jeb.01016
Pratchett, M. S., Wilson, S. K., and Munday, P. L. (2015). “Effects of climate change on coral reef fishes,” in Ecology of Fishes on Coral Reefs, ed. C. Mora (Cambridge: Cambridge University Press), 127–134.
Pundir, S., Martin, M. J., and O’Donovan, C. (2017). “UniProt Protein Knowledgebase,” in Protein Bioinformatics: From Protein Modifications and Networks to Proteomics, eds C. H. Wu, C. N. Arighi, and K. E. Ross (New York, NY: Springer), 41–55.
Rebl, A., Verleih, M., Kobis, J. M., Kuhn, C., Wimmers, K., Kollner, B., et al. (2013). Transcriptome profiling of gill tissue in regionally bred and globally farmed rainbow trout strains reveals different strategies for coping with thermal stress. Mar. Biotechnol. 15, 445–460. doi: 10.1007/s10126-013-9501-8
Rodgers, G. G., Donelson, J. M., McCormick, M. I., and Munday, P. L. (2018). In hot water: sustained ocean warming reduces survival of a low-latitude coral reef fish. Mar. Biol. 165:73. doi: 10.1007/s00227-018-3333-z
Rummer, J. L., Couturier, C. S., Stecyk, J. A. W., Gardiner, N. M., Kinch, J. P., Nilsson, G. E., et al. (2014). Life on the edge: thermal optima for aerobic scope of equatorial reef fishes are close to current day temperatures. Glob. Change Biol. 20, 1055–1066. doi: 10.1111/gcb.12455
Ryu, T., Veilleux, H. D., Donelson, J. M., Munday, P. L., and Ravasi, T. (2018). The epigenetic landscape of transgenerational acclimation to ocean warming. Nat. Clim. Change 8, 504–509. doi: 10.1038/s41558-018-0159-0
Salinas, S., and Munch, S. B. (2012). Thermal legacies: transgenerational effects of temperature on growth in a vertebrate. Ecol. Lett. 15, 159–163. doi: 10.1111/j.1461-0248.2011.01721.x
Shama, L. N. S., Mark, F. C., Strobel, A., Lokmer, A., John, U., and Mathias Wegner, K. (2016). Transgenerational effects persist down the maternal line in marine sticklebacks: gene expression matches physiology in a warming ocean. Evol. Appl. 9, 1096–1111. doi: 10.1111/eva.12370
Smith, S., Bernatchez, L., and Beheregaray, L. B. (2013). RNA-seq analysis reveals extensive transcriptional plasticity to temperature stress in a freshwater fish species. BMC Genomics 14:375. doi: 10.1186/1471-2164-14-375
Stetler-Stevenson, W. G., and Seo, D.-W. (2005). TIMP-2: an endogenous inhibitor of angiogenesis. Trends Mol. Med. 11, 97–103. doi: 10.1016/j.molmed.2005.01.007
Sunday, J. M., Bates, A. E., and Dulvy, N. K. (2012). Thermal tolerance and the global redistribution of animals. Nat. Clim. Change 2, 686–690. doi: 10.1038/nclimate1539
Tewksbury, J. J., Huey, R. B., and Deutsch, C. A. (2008). Putting the heat on tropical animals. Science 320, 1296–1297. doi: 10.1126/science.1159328
The Gene Ontology Consortium (2017). Expansion of the gene ontology knowledgebase and resources. Nucleic Acids Res. 45, D331–D338. doi: 10.1093/nar/gkw1108
van Herwerden, L., and Doherty, P. J. (2006). Contrasting genetic structures across two hybrid zones of a tropical reef fish, Acanthochromis polyacanthus (Bleeker 1855). J. Evol. Biol. 19, 239–252. doi: 10.1111/j.1420-9101.2005.00969.x
Veilleux, H. D., Ryu, T., Donelson, J. M., van Herwerden, L., Seridi, L., Ghosheh, Y., et al. (2015). Molecular processes of transgenerational acclimation to a warming ocean. Nat. Clim. Change 5, 1074–1078. doi: 10.1038/nclimate2724
Wendelaar Bonga, S. E. (1997). The stress response in fish. Physiol. Rev. 77, 591–625. doi: 10.1152/physrev.1997.77.3.591
Whitehouse, L. M., McDougall, C. S., Stefanovic, D. I., Boreham, D. R., Somers, C. M., Wilson, J. Y., et al. (2017). Development of the embryonic heat shock response and the impact of repeated thermal stress in early stage lake whitefish (Coregonus clupeaformis) embryos. J. Therm. Biol. 69, 294–301. doi: 10.1016/j.jtherbio.2017.08.013
Keywords: climate change, heatwaves, ocean warming, transcriptomics, genomics, local adaptation, plasticity
Citation: Veilleux HD, Ryu T, Donelson JM, Ravasi T and Munday PL (2018) Molecular Response to Extreme Summer Temperatures Differs Between Two Genetically Differentiated Populations of a Coral Reef Fish. Front. Mar. Sci. 5:349. doi: 10.3389/fmars.2018.00349
Received: 05 June 2018; Accepted: 10 September 2018;
Published: 28 September 2018.
Edited by:
Jose M. Eirin-Lopez, Florida International University, United StatesReviewed by:
Adam Michael Reitzel, University of North Carolina at Charlotte, United StatesMarta Barluenga, Consejo Superior de Investigaciones Científicas (CSIC), Spain
Copyright © 2018 Veilleux, Ryu, Donelson, Ravasi and Munday. This is an open-access article distributed under the terms of the Creative Commons Attribution License (CC BY). The use, distribution or reproduction in other forums is permitted, provided the original author(s) and the copyright owner(s) are credited and that the original publication in this journal is cited, in accordance with accepted academic practice. No use, distribution or reproduction is permitted which does not comply with these terms.
*Correspondence: Heather D. Veilleux, aGVhdGhlci52ZWlsbGV1eEBqY3UuZWR1LmF1 Philip L. Munday, cGhpbGlwLm11bmRheUBqY3UuZWR1LmF1