 Christopher Tyler Fountain
 Rhian G. Waller
 Peter J. Auster
- 1Darling Marine Center, School of Marine Sciences, University of Maine, Orono, ME, United States
- 2Department of Marine Sciences, University of Connecticut, Groton, CT, United States
- 3Mystic Aquarium, Mystic, CT, United States
Deep-sea corals are of conservation concern in the North Atlantic due to prolonged disturbances associated with the exploitation of natural resources and a changing environment. As a result, two research cruises in the Gulf of Maine region during 2014 and 2017 collected samples of two locally dominant coral species, Primnoa resedaeformis and Paramuricea placomus, at six locations to investigate reproductive ecology. Remotely operated vehicles (ROVs) were used to collect specimens that were examined via paraffin histology, and coincident video surveys were used to determine size class distributions. Both species were identified as gonochoristic, and sampled locations exhibited dissimilarities in spermatocyst development and oocyte size except for those in close geographic proximity. Fecundities exhibited substantial ranges across sample locations and average oocyte sizes (±SD) were 140 ± 117 μm for P. resedaeformis and 64 ± 46 μm for P. placomus. In addition, colony size distributions were also significantly different across sampling locations. Notably, the Outer Schoodic Ridge sample location, with larger colony and oocyte sizes, was identified as a potential key source population of reproductive material in the Gulf of Maine. These data were used to calculate differences in reproductive potential based on relationships between colony morphology and reproductive output using height as a predictive proxy. Furthermore, calculated age at first reproduction, 7.6–19.8 years for P. resedaeformis and 20.7–37 years for P. placomus, which may be dependent on sex of the colony, provides a metric for estimating the amount of time these coral habitats will take to recover. This investigation, in response to historical population impacts and environmental change, links reproductive and morphometric relationships to inform population scale reproductive models, while also establishing an understanding of regional scale gametogenic variability within the Gulf of Maine region.
Introduction
Many deep-sea coral species, functioning as foundation structures and ecosystem engineers, act as physical habitat for a myriad of taxa. As autogenic engineers, these structure-forming species increase the complexity of the environments in which they grow (Jones et al., 1994; Lumsden et al., 2007; Kahng et al., 2011; Soetaert et al., 2016) and communities formed by dense aggregations (i.e., >0.1 colonies per m2) of one or more species of deep-sea octocorallians are known as “coral gardens” (ICES, 2007; Bullimore et al., 2013). Associated organisms rely on the presence and growth of corals to change the environment by providing shelter and altering resource flows (Metaxas and Davis, 2005; Lacharité and Metaxas, 2013; Soetaert et al., 2016). Their branching morphology and considerable size create space for other organisms to seek refuge, increase habitat variability, and result in more opportunity for increases in abundance and densities of associated fauna (Etnoyer and Morgan, 2005; Lumsden et al., 2007; Watanabe et al., 2009; Tong et al., 2012; Lacharité and Metaxas, 2013). However, the growth and formation of deep-sea coral habitat occurring on the time-scale of decades to millennia (Roark et al., 2009), in addition to their intricate morphologies make these organisms vulnerable to a multitude of disturbances. These disturbances range from bottom fishing activities (Koslow et al., 2000; Roberts and Hirshfield, 2004; Mortensen et al., 2005; Murillo et al., 2011), and oil and gas exploration and exploitation (Ramirez-Llodra et al., 2011; White et al., 2012; Fisher et al., 2014; DeLeo et al., 2016; Etnoyer et al., 2016), to more protracted disturbances including increases in ocean stratification, temperature and acidification due to climate change (Roberts et al., 2006; Lumsden et al., 2007; Hofmann et al., 2010; Mercier and Hamel, 2011; Maier et al., 2012; Lunden et al., 2014; Hennige et al., 2015; Soetaert et al., 2016). In response, and to better understand the rate at which recovery and subsequent biogenic habitat formation occurs, it is necessary to investigate the reproductive biology, growth, and relationships therein of deep-sea corals at both the individual and population level.
Deep-sea corals, as sessile benthic suspension feeders, rely on the delivery of nutrients via advection to sustain metabolic processes (Roberts et al., 2006; Thiem et al., 2006; Wagner et al., 2011; Soetaert et al., 2016) such as reproduction and growth, two biological functions which compete for limited energy (Wahle, 1983; Chornesky and Peters, 1987). Studies investigating the relationships between sexual reproduction and growth of deep-sea octocorals (Cordes et al., 2001; Orejas et al., 2002) in addition to work identifying variability in reproductive methods, gamete sizes, fecundities, and reproductive cycles (Orejas et al., 2007; Waller and Baco, 2007; Edwards and Moore, 2009; Sun et al., 2010a; Kahng et al., 2011; Waller et al., 2014; Baillon et al., 2015), have set the stage providing context for larger scale reproductive ecology work and comparative studies to take place. This study investigates the reproductive ecology of Primnoa resedaeformis (Gunnerus, 1763) and Paramuricea placomus (Linnaeus, 1758), two deep-sea corals from the North Atlantic (Buhl-Mortensen et al., 2015). Members of the Primnoidae family are predominantly gonochoric and show species dependent internal brooding or broadcast spawning to be their reproductive modes (Kahng et al., 2011; Waller et al., 2014; Feehan and Waller, 2015). Primnoa resedaeformis has not shown signs of internal brooding and is a known broadcast spawner with overlapping cohorts of oocytes (Mercier and Hamel, 2011; Lacharité and Metaxas, 2013). Broadcast spawning relies on fertilization and development to occur in the water column and mitigates the effects of predation through satiation while simultaneously maximizing fertilization rates and minimizing sperm limitation (Alino and Coll, 1989; Lasker et al., 1996). Primnoa resedaeformis also exhibits mixed size classes of oocytes within colonies suggesting multiple overlapping reproductive cohorts and a gametogenic cycle which is longer than a year in duration (Mercier and Hamel, 2011). Comparatively, very little is known about the reproductive biology of P. placomus (Simpson et al., 2005).
Growth, a determinant of colony size, in turn effects the reproductive potential of colonial organisms (Hall and Hughes, 1996) through the addition of new ramets (polyps in this case) via asexual reproduction (Jackson et al., 1985; Kahng et al., 2011). Additionally, size is important as larger colonies contribute disproportionally more reproductive material to the population (Babcock, 1984; Beiring and Lasker, 2000). In gorgonian octocorals, growth is primarily measured both axially and radially (Andrews et al., 2002; Sherwood et al., 2005). Axial growth is the total elongation of the main stem and branches (Watling et al., 2011) which can be subdivided into first, second, and third order branches for more detailed morphological investigation (Brazeau and Lasker, 1988). Primnoa resedaeformis has an axial growth rate of 0.15–2.92 cm per year exhibiting variation among geographic regions and colony age (Andrews et al., 2002; Risk et al., 2002; Mortensen and Buhl-Mortensen, 2005; Sherwood and Edinger, 2009). Additionally, two Paramuricea spp. specimens, collected from the Central Labrador Slope, were estimated to have axial growth rates of 0.51–0.61 cm per year (Sherwood and Edinger, 2009). With its arborescent growth, P. resedaeformis colonies range in size from 5 to 115 cm (Mortensen and Buhl-Mortensen, 2005; Personal observation), and exhibiting more planar growth P. placomus colonies have been observed to range in size from 5 to 65 cm (Personal observation). Large maximum colony sizes, complex morphologies, and slow growth rates further corroborate that recovery may be on the scale of decades to centuries (Andrews et al., 2002; Watling and Auster, 2005; Waller et al., 2007).
In 2014 and 2017, two research cruises in the Gulf of Maine region collected samples of P. resedaeformis and P. placomus. These species of focus were based on their local dominance, high colony densities, affiliation with a diverse array of organisms, and habitat reduction to potentially small refugia due to prolonged disturbance associated with mobile fishing gear (Watling and Auster, 2005; Auster et al., 2013). Within the Northeast Channel and Gulf of Maine, 97 epifaunal species (Metaxas and Davis, 2005), and various megafauna including Acadian redfish, cusk, silver hake, Atlantic cod, and pandalid shrimp have been observed to associate with P. resedaeformis and P. placomus colonies (Auster, 2005; Auster et al., 2013, 2014; Personal observation). Specimen collections from 2014 were coupled with remotely operated vehicle (ROV) video surveys. Combined, these data were used to: characterize gametogenesis, evaluate spermatocyst stages and oocyte size frequencies, quantify fecundities per reproductive polyp, discern reproductive and colony size differences among sample populations, compare reproductive variability between 2 months, assess morphometric and reproductive relationships while developing individual based reproductive models, and calculate size and age ranges at maturation. Investigating these biological elements provides insight into the potential reproductive output of entire coral colonies and a snapshot of gametogenic variability between 2 months. These data are critical for understanding the potential recovery rates and population resilience among deep-sea coral species and for identifying the most fecund populations. The goal of this study was to combine size relative species fecundity and population size distributions to understand the population scale reproductive potential of these deep-sea coral species within the Gulf of Maine region. These estimations will help to further identify key source populations and inform the development of management alternatives and trade-offs for conservation of coral habitats.
Materials and Methods
High-definition video and discrete samples from branches of two locally dominant deep-sea coral species, Primnoa resedaeformis (Primnoidae) and Paramuricea placomus (Plexauridae), were collected with remotely operated vehicles (ROVs) during two research cruises within the Gulf of Maine (Table 1). Branches were cut from colonies of multiple size classes using the ROV Kraken II 6-function HYDRO-LEK hydraulic manipulator arm equipped with a coral cutter collection claw (operated by the University of Connecticut) and ROPOS Shilling Titan 4 spatially correspondent 7-function manipulators with hydraulic cutters (operated by the Canadian Scientific Submersible Facility). Coral samples were collected from the Western Jordan Basin (WJB), Outer Schoodic Ridge (OSR), and Central Jordan Basin (CJB) during the 24 July to 4 August 2014 cruise of the R/V Connecticut (n = 74, Figure 1). Additional samples were collected from Western Jordan Basin (WJB), Nygren-Heezen InterCanyon (NHI), Corsair Canyon (CC), and Georges Canyon (GC) during the 12–17 June 2017 cruise of the NOAA ship Henry B. Bigelow (n = 35, Figure 1).
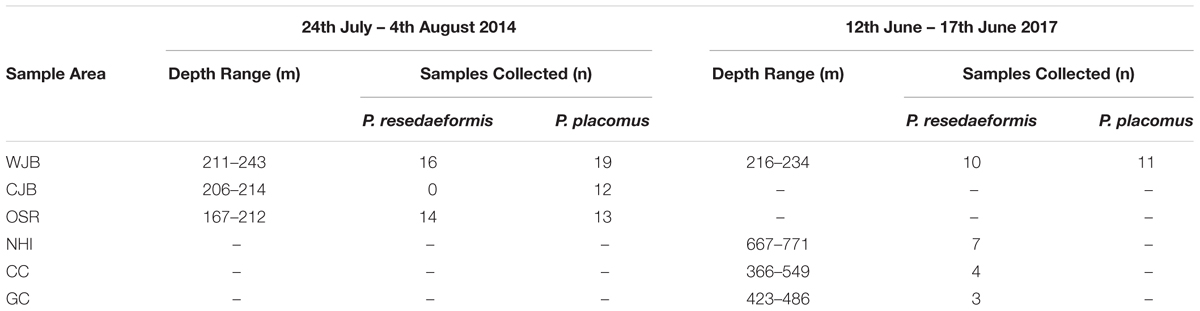
Table 1. Sample collections by location, year, and species.
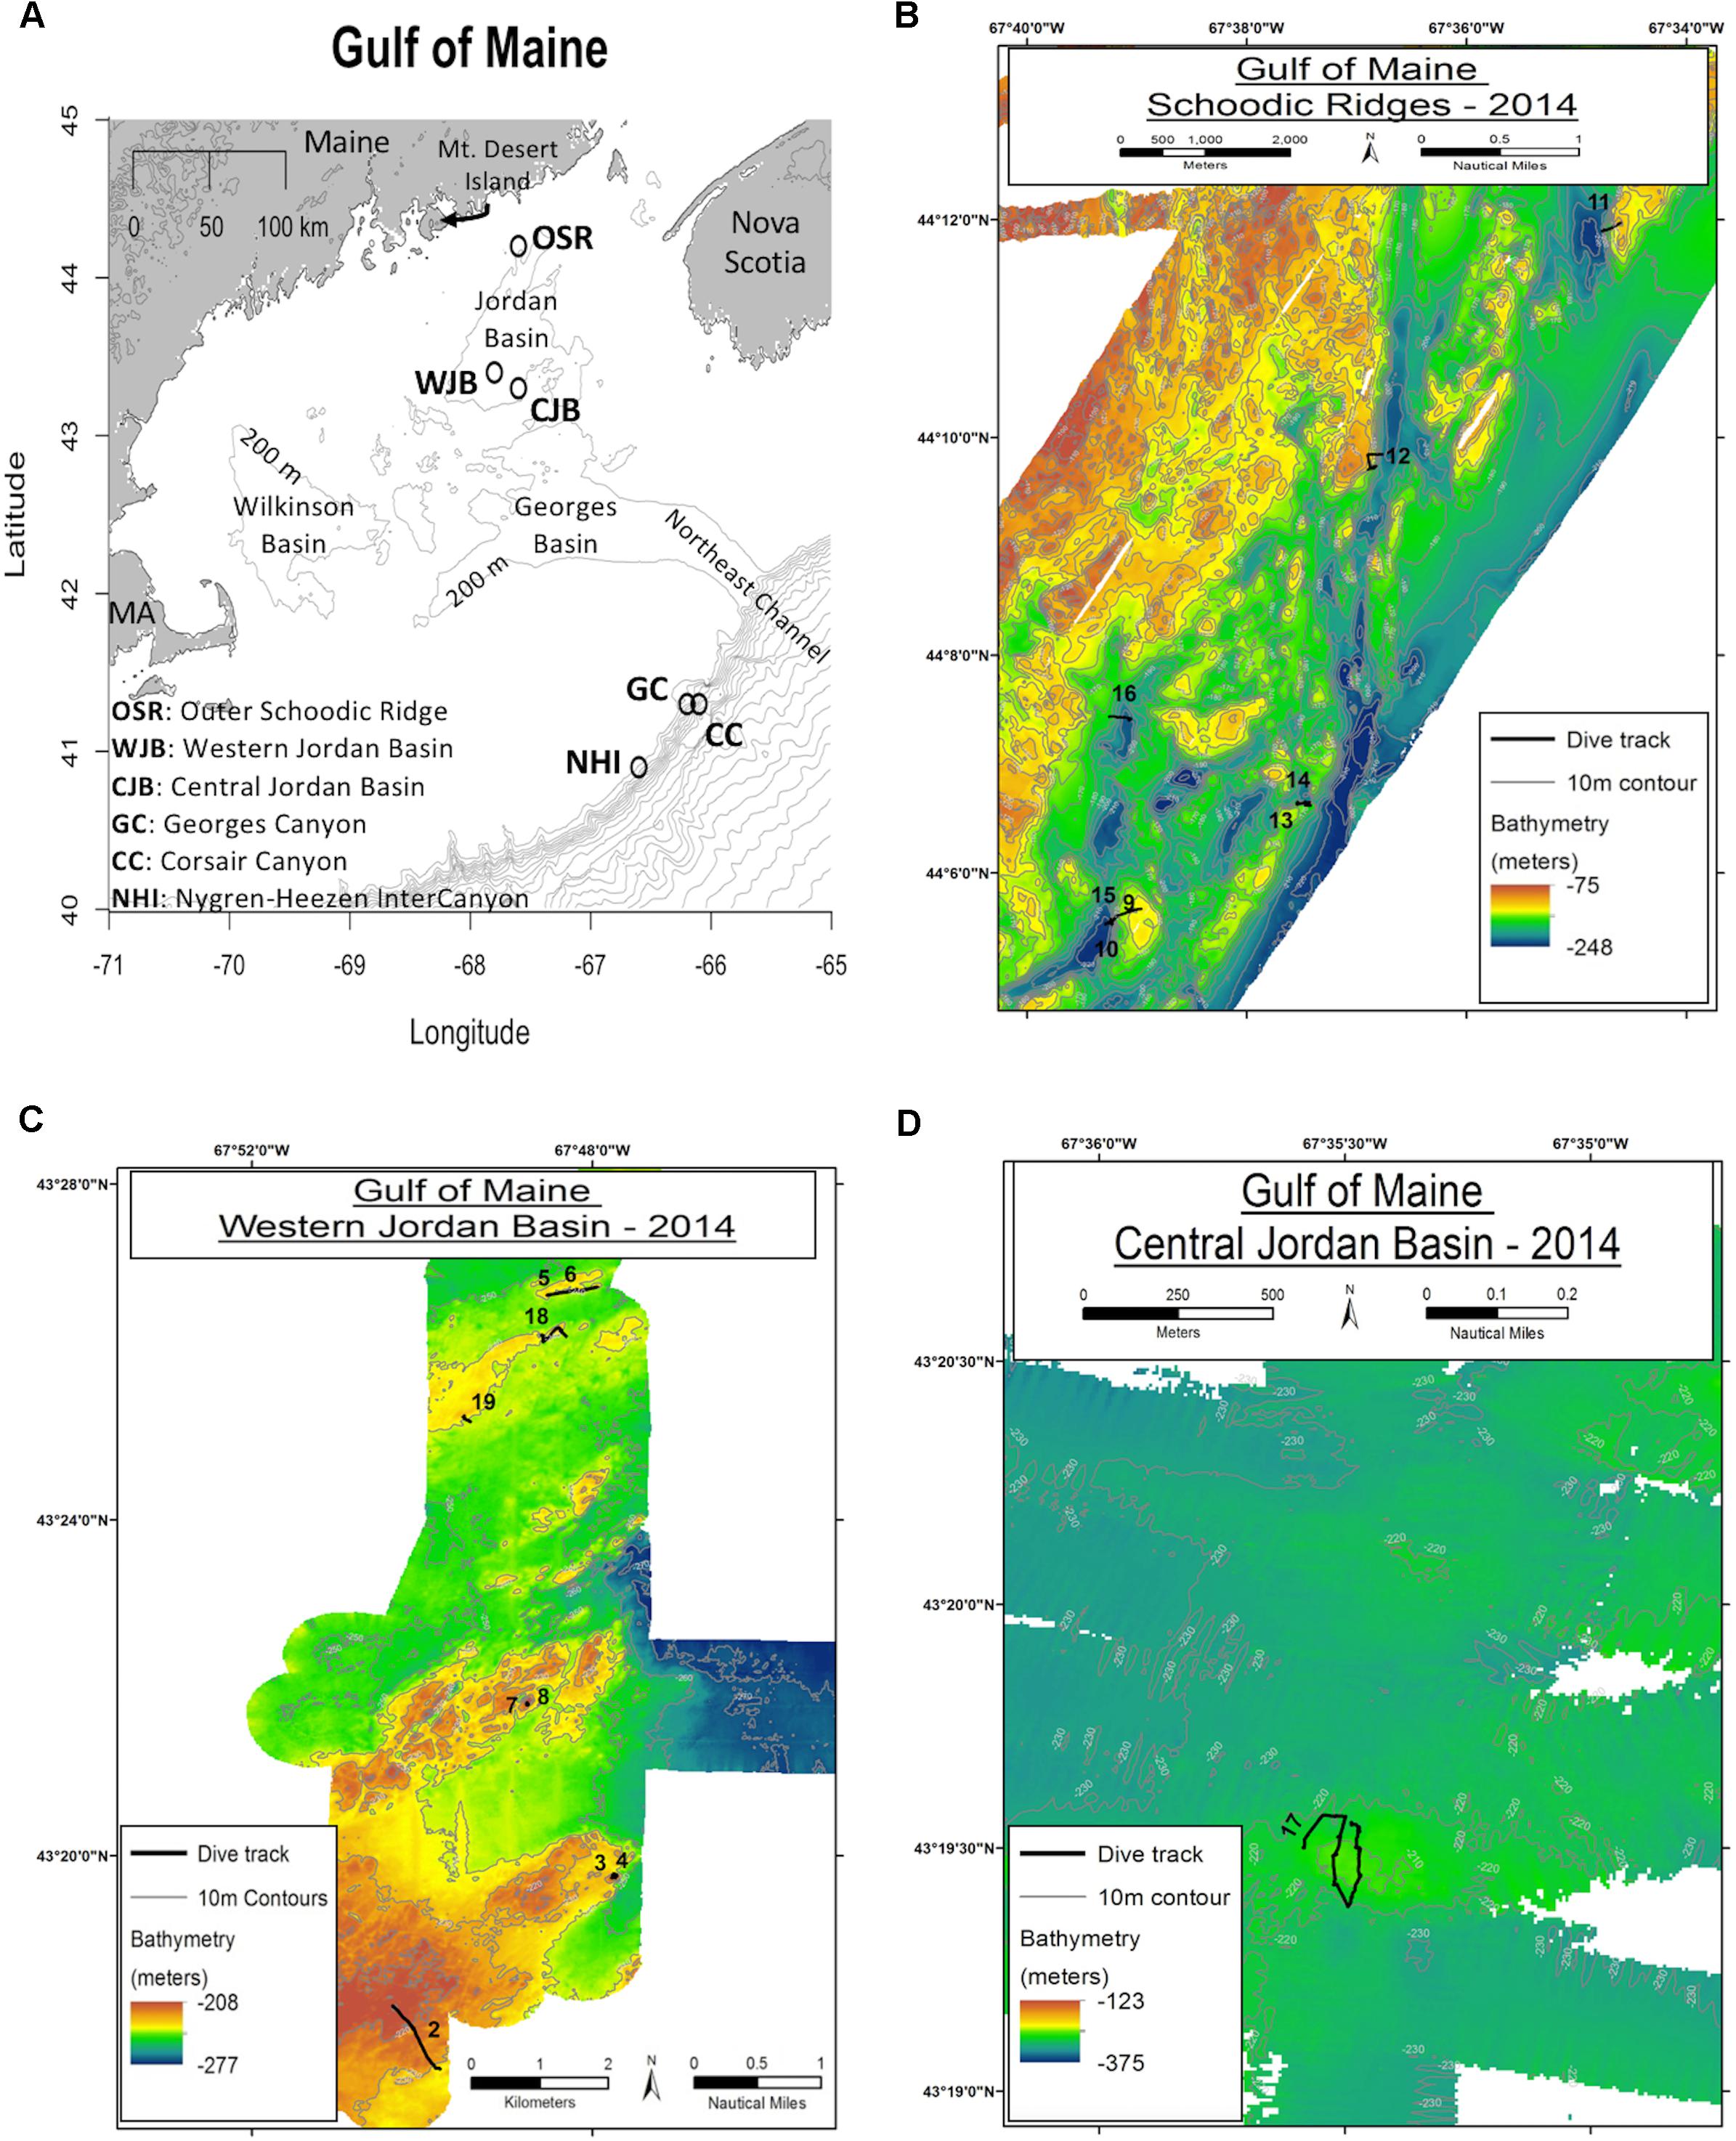
Figure 1. Sample locations from 2014 to 2017 in addition to bathymetric maps from 2014. (A) Spatial distribution of sampling locations (open circles) throughout the Gulf of Maine and marginal canyons. Gray lines show 200 m depth contours. (B–D) Bathymetric maps showing numbered ROV transects from Outer Schoodic Ridge (B) Western Jordan Basin (C) and Central Jordan Basin (D). Maps B–D, courtesy of Dave Packer and Victoria Kentner, USDOC NOAA.
Corals from the WJB site occurred in a moderate sloping landscape with steep short rock faces 2–4 m in maximum height surrounded by finer gained sediments. Temperature at the depth of collection was 10.1°C. Corals at the OSR site occurred in a precipitous landscape context with steep tall rock faces up to 12 m maximum height with a temperature at collection depth of 9.8°C. The CJB site had low relief rock outcrops <∼1 m in height and a surrounding substrate of mud covered gravel. Temperature at collection depth within CJB was 10.2°C. See Auster et al. (2014) for additional details of habitat characteristics from the 2014 sample locations. Coral samples collected in 2017 from the continental margin were associated with areas of high vertical relief typical of submarine canyons in the region (Cooper et al., 1987). The minor canyon between Nygren and Heezen Canyons consisted of steep rock walls with intervening small terraces. Temperature at collection depth was 4.3°C. Both Corsair and Georges Canyon sites were steep sided but mostly draped in sediment with occasional boulders and associated corals. Temperatures at collection were 6.5 and 6.2°C, respectively. All samples collected, once onboard, were fixed in 4% buffered formalin in preparation for laboratory analysis using histology.
Histology
Samples of P. resedaeformis were prepared for histological analysis following the methodology of Waller et al. (2014 and references therein). Preparation of P. placomus deviated slightly due to the smaller size and fragility of samples. Primnoa resedaeformis subsample preparation consisted of removing the central axis prior to the decalcification of sclerites in Rapid Bone Decalcifier (American MasterTech Scientific). Similarly, P. placomus subsamples had their central axis dissected out and were then placed in Cal-Ex (Fisher Scientific) to dissolve the remaining calcareous components (sclerites). For both species skeletal components were removed and decalcified prior to tissue dehydration. Subsamples were then dehydrated over the course of 2.5–3.5 h through a series of ethanol baths. These ethanol baths were graded from 30 to 100% following a 5 to 10% increase between each step then left to sit in 100% ethanol overnight for approximately 18 h. The dehydration process of P. resedaeformis took place using a rotary mixer to eliminate internal air bubbles and P. placomus dehydration was carried out in a 500 ml jar because bubble entrapment in tissue was negligible. Tissues were then rinsed in a final 100% ethanol bath before being cleared in Xylenes. Once cleared, the subsamples were placed into molten paraffin for up to 48 h and then embedded into standard histology molds using a MEDITE embedding station. After the paraffin molds containing the tissue subsamples were hardened, they were sectioned using a MICROM HM325 or LEICA RM2155 microtome. Serial slicing occurred at 7 μm (P. resedaeformis) or 5 μm (P. placomus) increments based on nuclear diameters of oocytes. This spacing, of one nucleus diameter, is necessary to reduce the possibility of double counting oocytes when quantifying fecundities per polyp, as only sections consisting of nuclear material were counted. In this study more than 220 polyps were examined of P. placomus and more than 180 polyps were examined of P. resedaeformis.
Reproductive Analysis
Slides were stained using Masson’s Trichrome and then viewed under an Olympus CX31 light microscope to stage spermatocysts and photograph oocytes using a microscope mounted Infinity 1 camera (Lumenera). Photographs were taken of one hundred randomly selected oocytes (in sensu Waller and Tyler, 2005) and then circled using image J (NIH). Feret diameters were then calculated from the area of the circled oocyte as if it was a perfect circle (Eq. 1). These data were used to determine oocyte size distributions among species, individuals, and locations. Additionally, fecundity was determined by averaging the total number of oocytes per polyp across three randomly selected reproductive polyps from each female sample. While counting fecundities, oocytes were also categorized as either vitellogenic or previtellogenic as a means of quantifying the percentage of viable oocytes per reproductive cohort. This oogenic distinction was made following descriptions from Fadlallah (1983), Waller and Tyler (2005), and Roberts et al. (2009). State of maturation was identified based on presence (mature) and absence (immature) of vitellogenic oocytes for females and spermatocyst staging (Stage I and II, immature / Stage III and IV mature) for males. It is important to note that male gametogenesis is often more difficult to gauge (Tyler et al., 1982), however maturation at Stage III is also suggested by Mercier and Hamel (2011), resultant of spermatozoa prominence within spermatocysts.
For male individuals, one hundred random spermatocysts were staged from each colony (Waller et al., 2002, 2014; Waller and Tyler, 2005; Mercier and Hamel, 2011) and then combined within sample locations. These data then provided insight into differences in reproductive timing between sample locations based on the proportional differences in spermatocyst stages from each location. The following descriptions of spermatocyst stages ensured consistency throughout the duration of data collection (Figure 2).
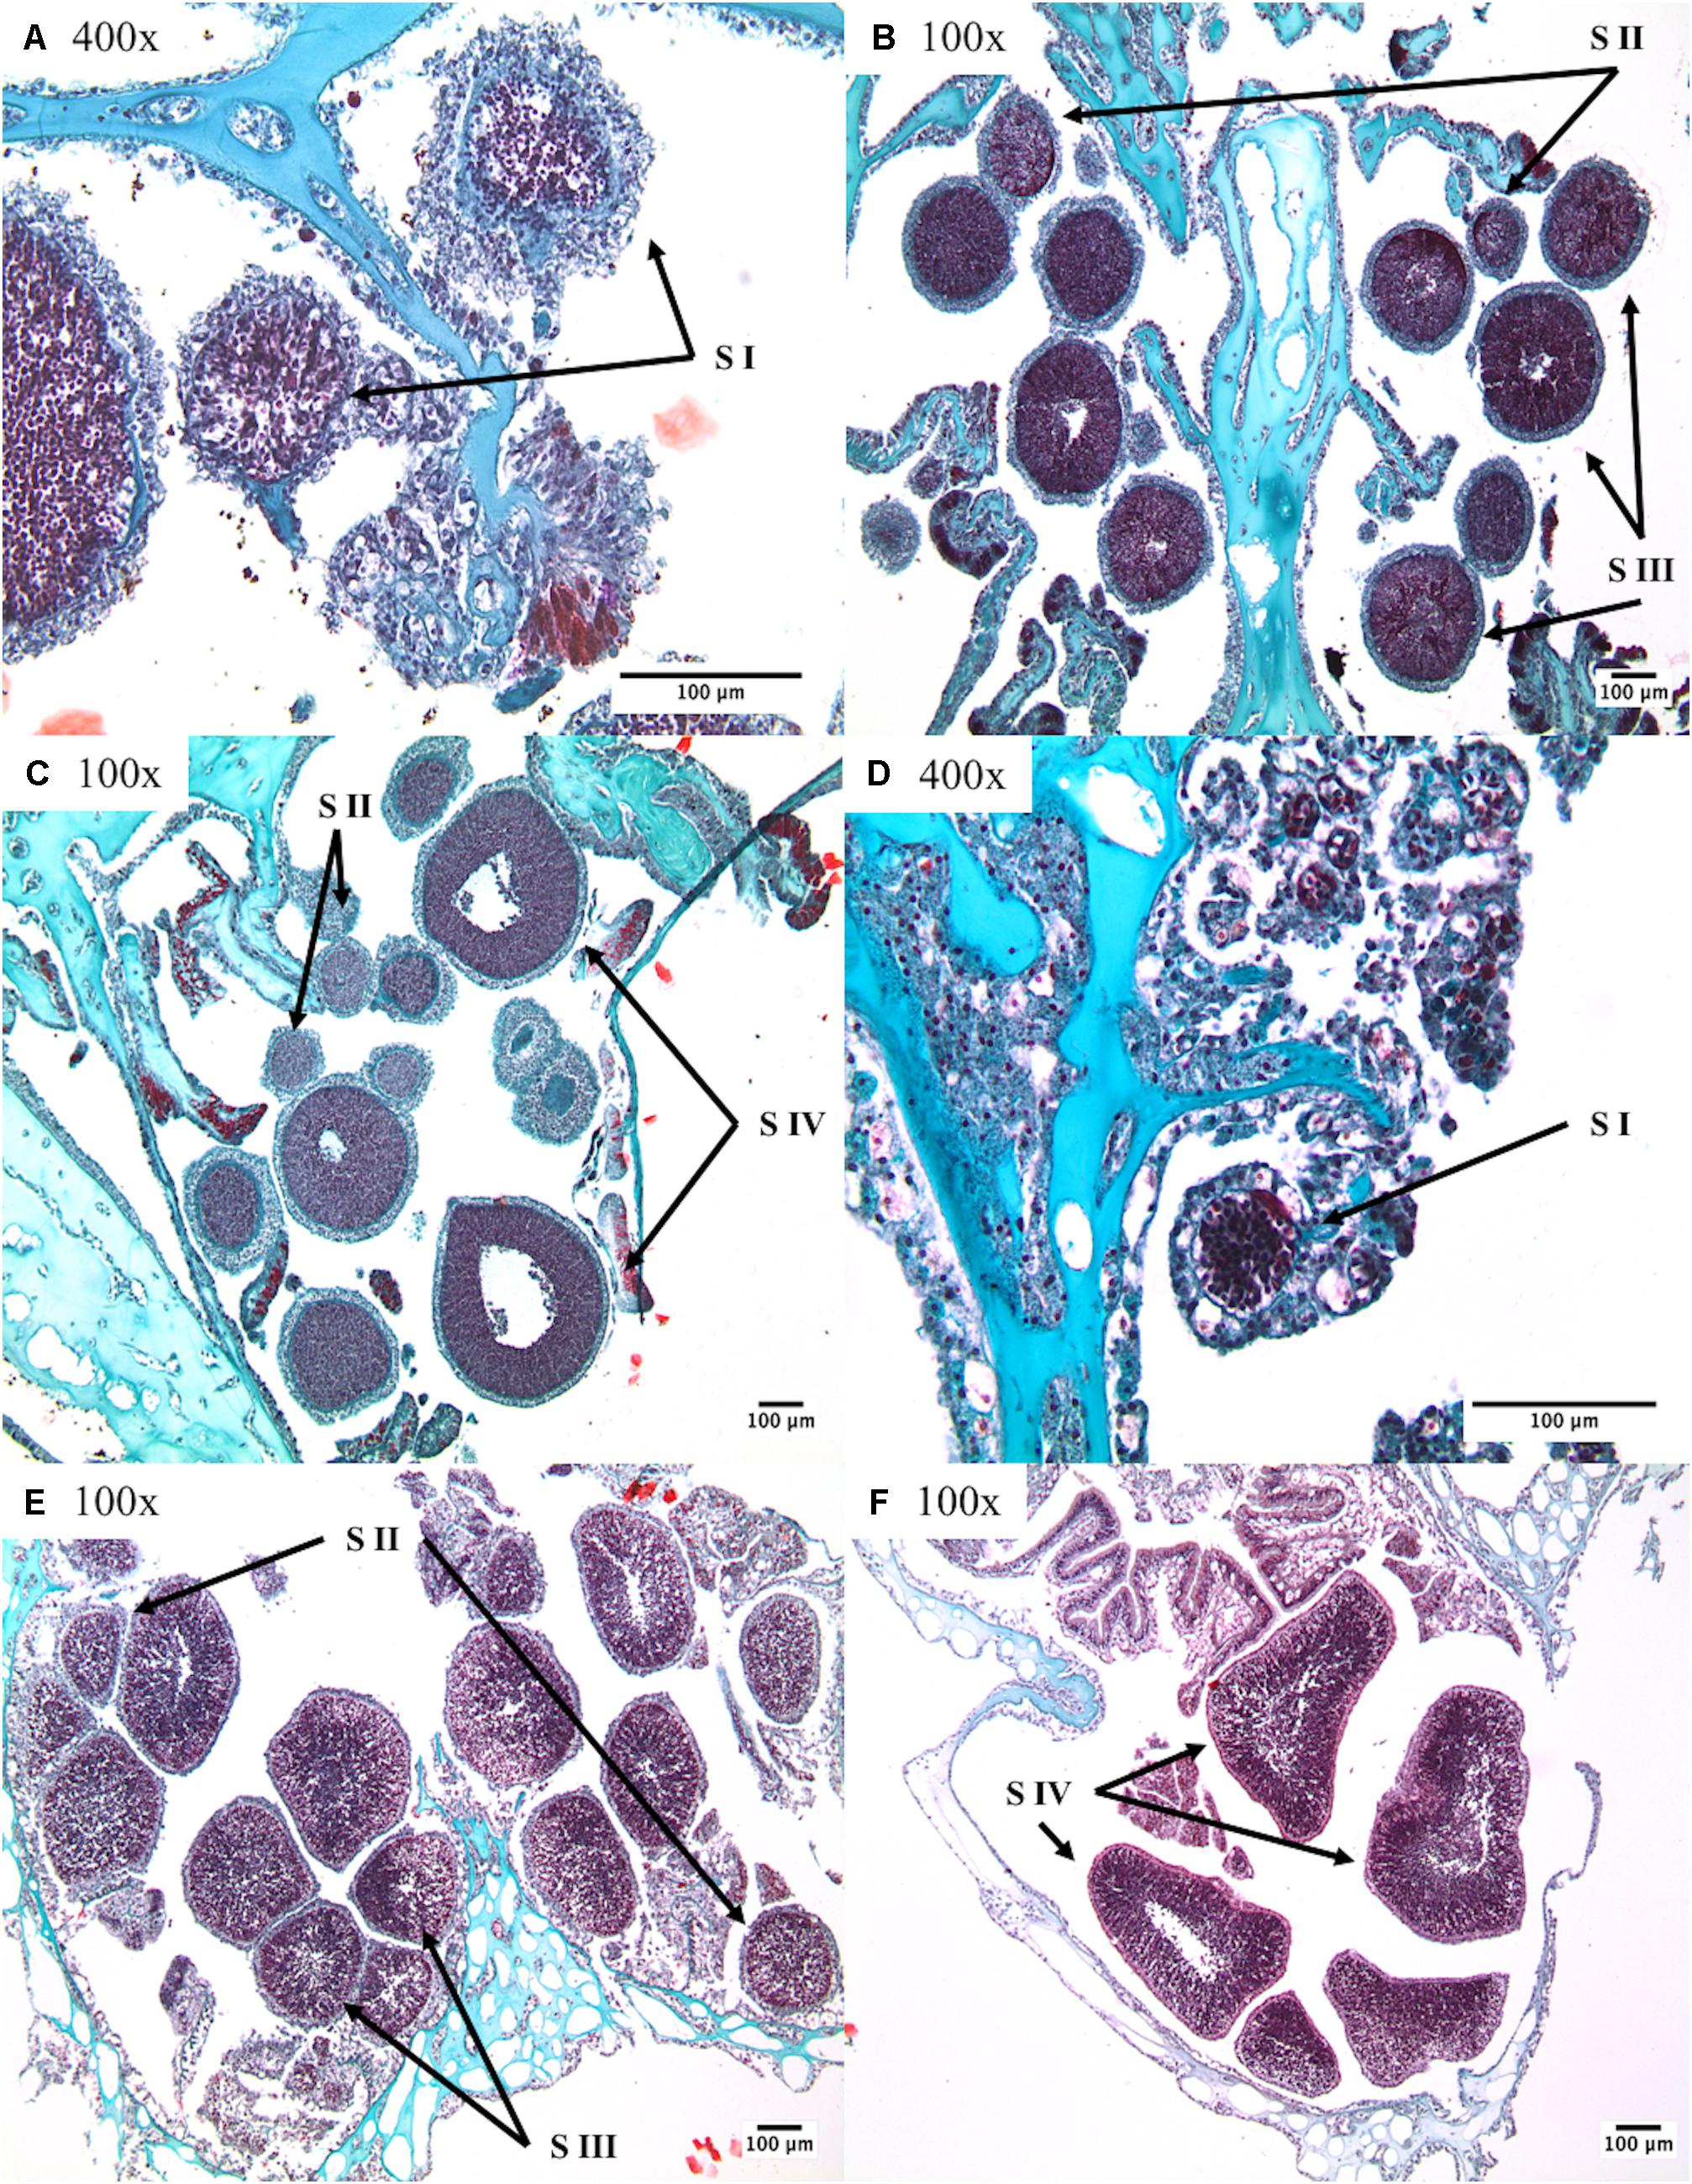
Figure 2. The stages of spermatogenesis in Primnoa resedaeformis and Paramuricea placomus: (A–C) identifiable stages within Primnoa resedaeformis; (D–F) identifiable stages within Paramuricea placomus. S I stage one, S II stage two, S III stage three, and S IV stage four. Note magnifications included within micrographs, all scale bars indicate 100 μm.
Stage I: Small spermatocysts enveloped by a thin mesogleal membrane often seen with attached pedicel.
Stage II: Larger spermatocyst containing loosely packed and uniformly distributed spermatids.
Stage III: Increased density and “organization” of spermatids which at this stage are starting to develop into spermatozoa. Lumen becoming distinct toward the center of the spermatocyst.
Stage IV: Substantial spermatocysts with increasingly large lumen, developing spermatozoa packing and lining the mesogleal envelope.
Female gametogenesis, examined quantitatively (Figure 3), was used to investigate the percentage of vitellogenic and previtellogenic oocytes present in collected specimens. Described below are the criteria which constituted differentiation between previtellogenic and vitellogenic oocytes.
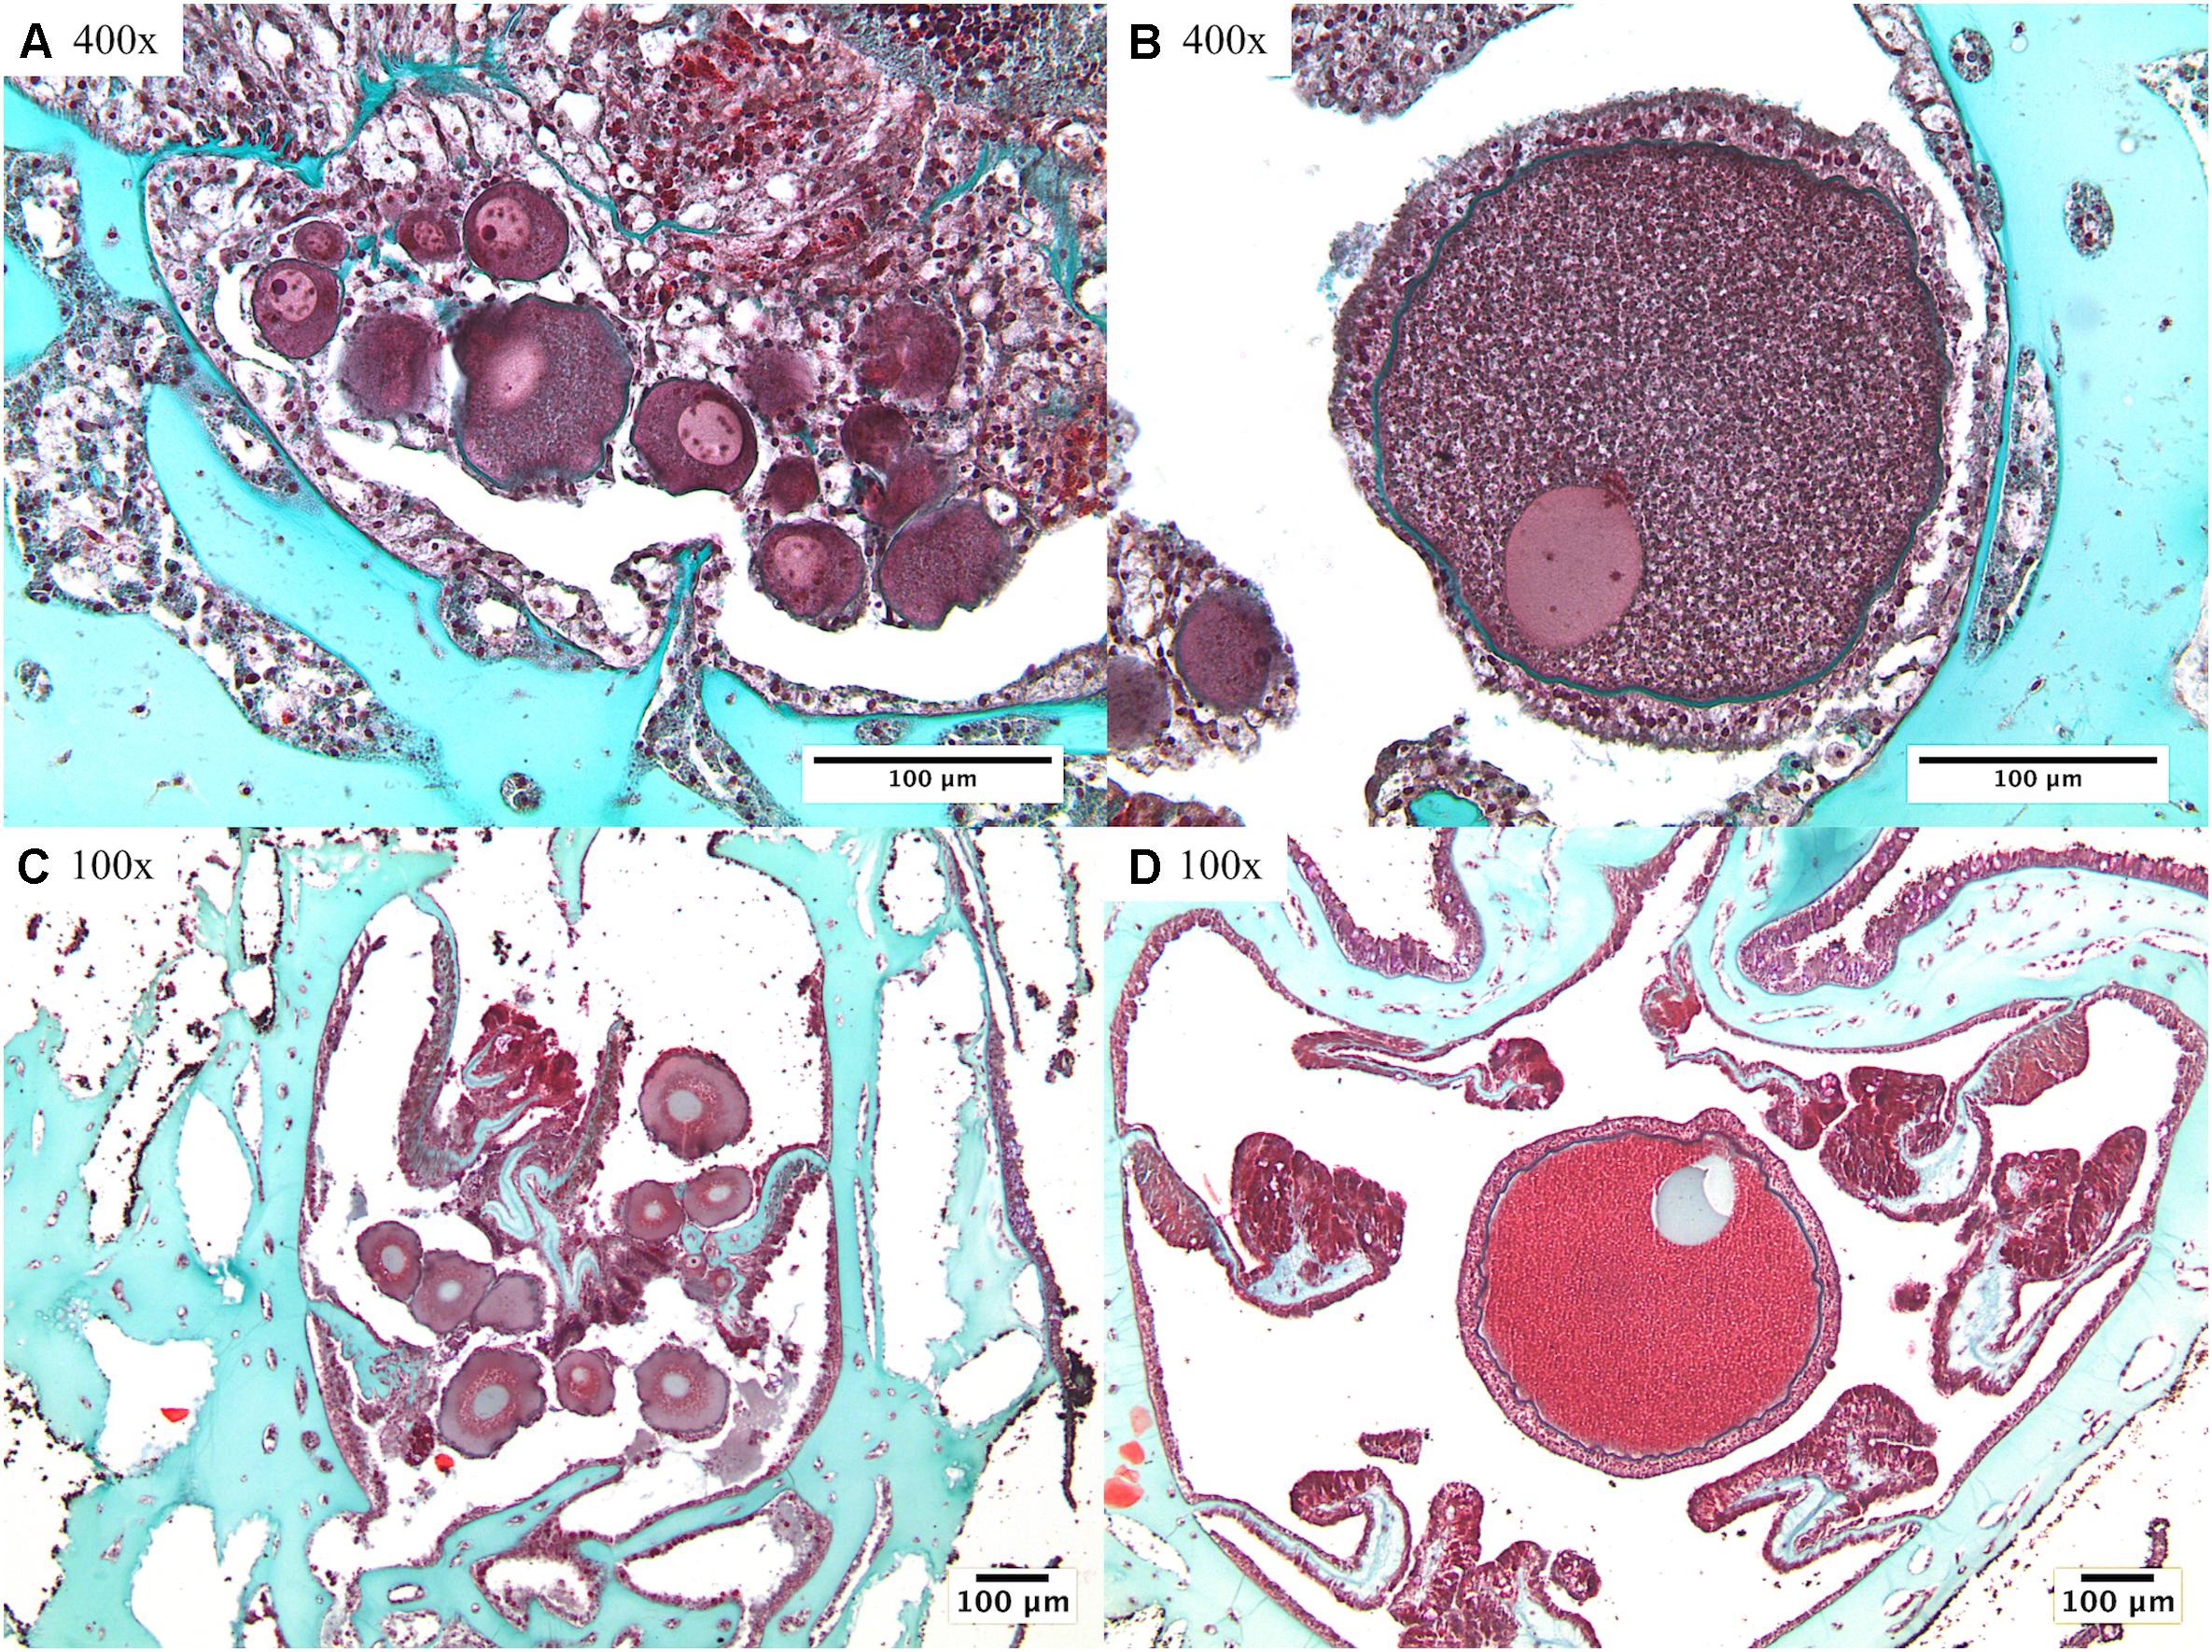
Figure 3. Differentiation between previtellogenic and vitellogenic oocytes: (A) previtellogenic oocytes of Paramuricea placomus; (B) a well-developed vitellogenic oocyte of Paramuricea placomus; (C) cluster of previtellogenic oocytes of Primnoa resedaeformis; (D) vitellogenic oocyte of Primnoa resedaeformis. Note magnifications included within micrographs, all scale bars indicate 100 μm.
Previtellogenic: Small oocytes, consisting of a thin mesogleal envelope, lacking development of a thick cortical granular layer. Observed closely to mesenteric lamellae. Transition from previtellogenic to vitellogenic oocytes takes place at ∼230 μm in P. resedaeformis and at ∼100 μm in P. placomus.
Vitellogenic: Larger oocytes, consisting of a granular yolk and development of a thick cortical granular layer enveloping the cell. Observed centrally toward the aboral end of the gastrovascular cavity and in one instance within the longitudinal compartment/tentacle cavity of the polyp.
Video Analysis and Reproductive Modeling
Video transects were recorded coincident with sample collection dives in 2014 by the ROV Kraken II and again in 2017 by the ROPOS. Video imagery was used to estimate gross morphometrics of coral colonies and gather height measurements to quantify colony size frequency distributions between sample locations. Sizing of colonies is important because it can have a major influence on a colony’s reproductive capacity, especially for organisms which may have genetically indeterminate growth, such as corals (Hall and Hughes, 1996). Coral colonies were measured, when estimated to be in a plane parallel to the video camera, with paired parallel lasers (10 cm spacing; mounted on the video camera) projected on the colony or as close as possible to the base of the colony for length calibration. Frame captures were then taken and colony morphometrics measured using Image J (Abramoff et al., 2004). Measurements taken were height and total branch length (Figure 4). Due to differences in morphology of the two coral species, total branch length was only able to be acquired from P. placomus colonies and is the sum of all first, second, and third order branches within a colony. Total branch length was used in correlation analyses with height data to investigate gross morphometric relationships (Mistri, 1995) of P. placomus colonies. Additional morphometric data quantifying the number of polyps per axial cm, collected using a Motic SMZ-168 dissecting scope, were used as a variable to inform a colony based reproductive potential model.
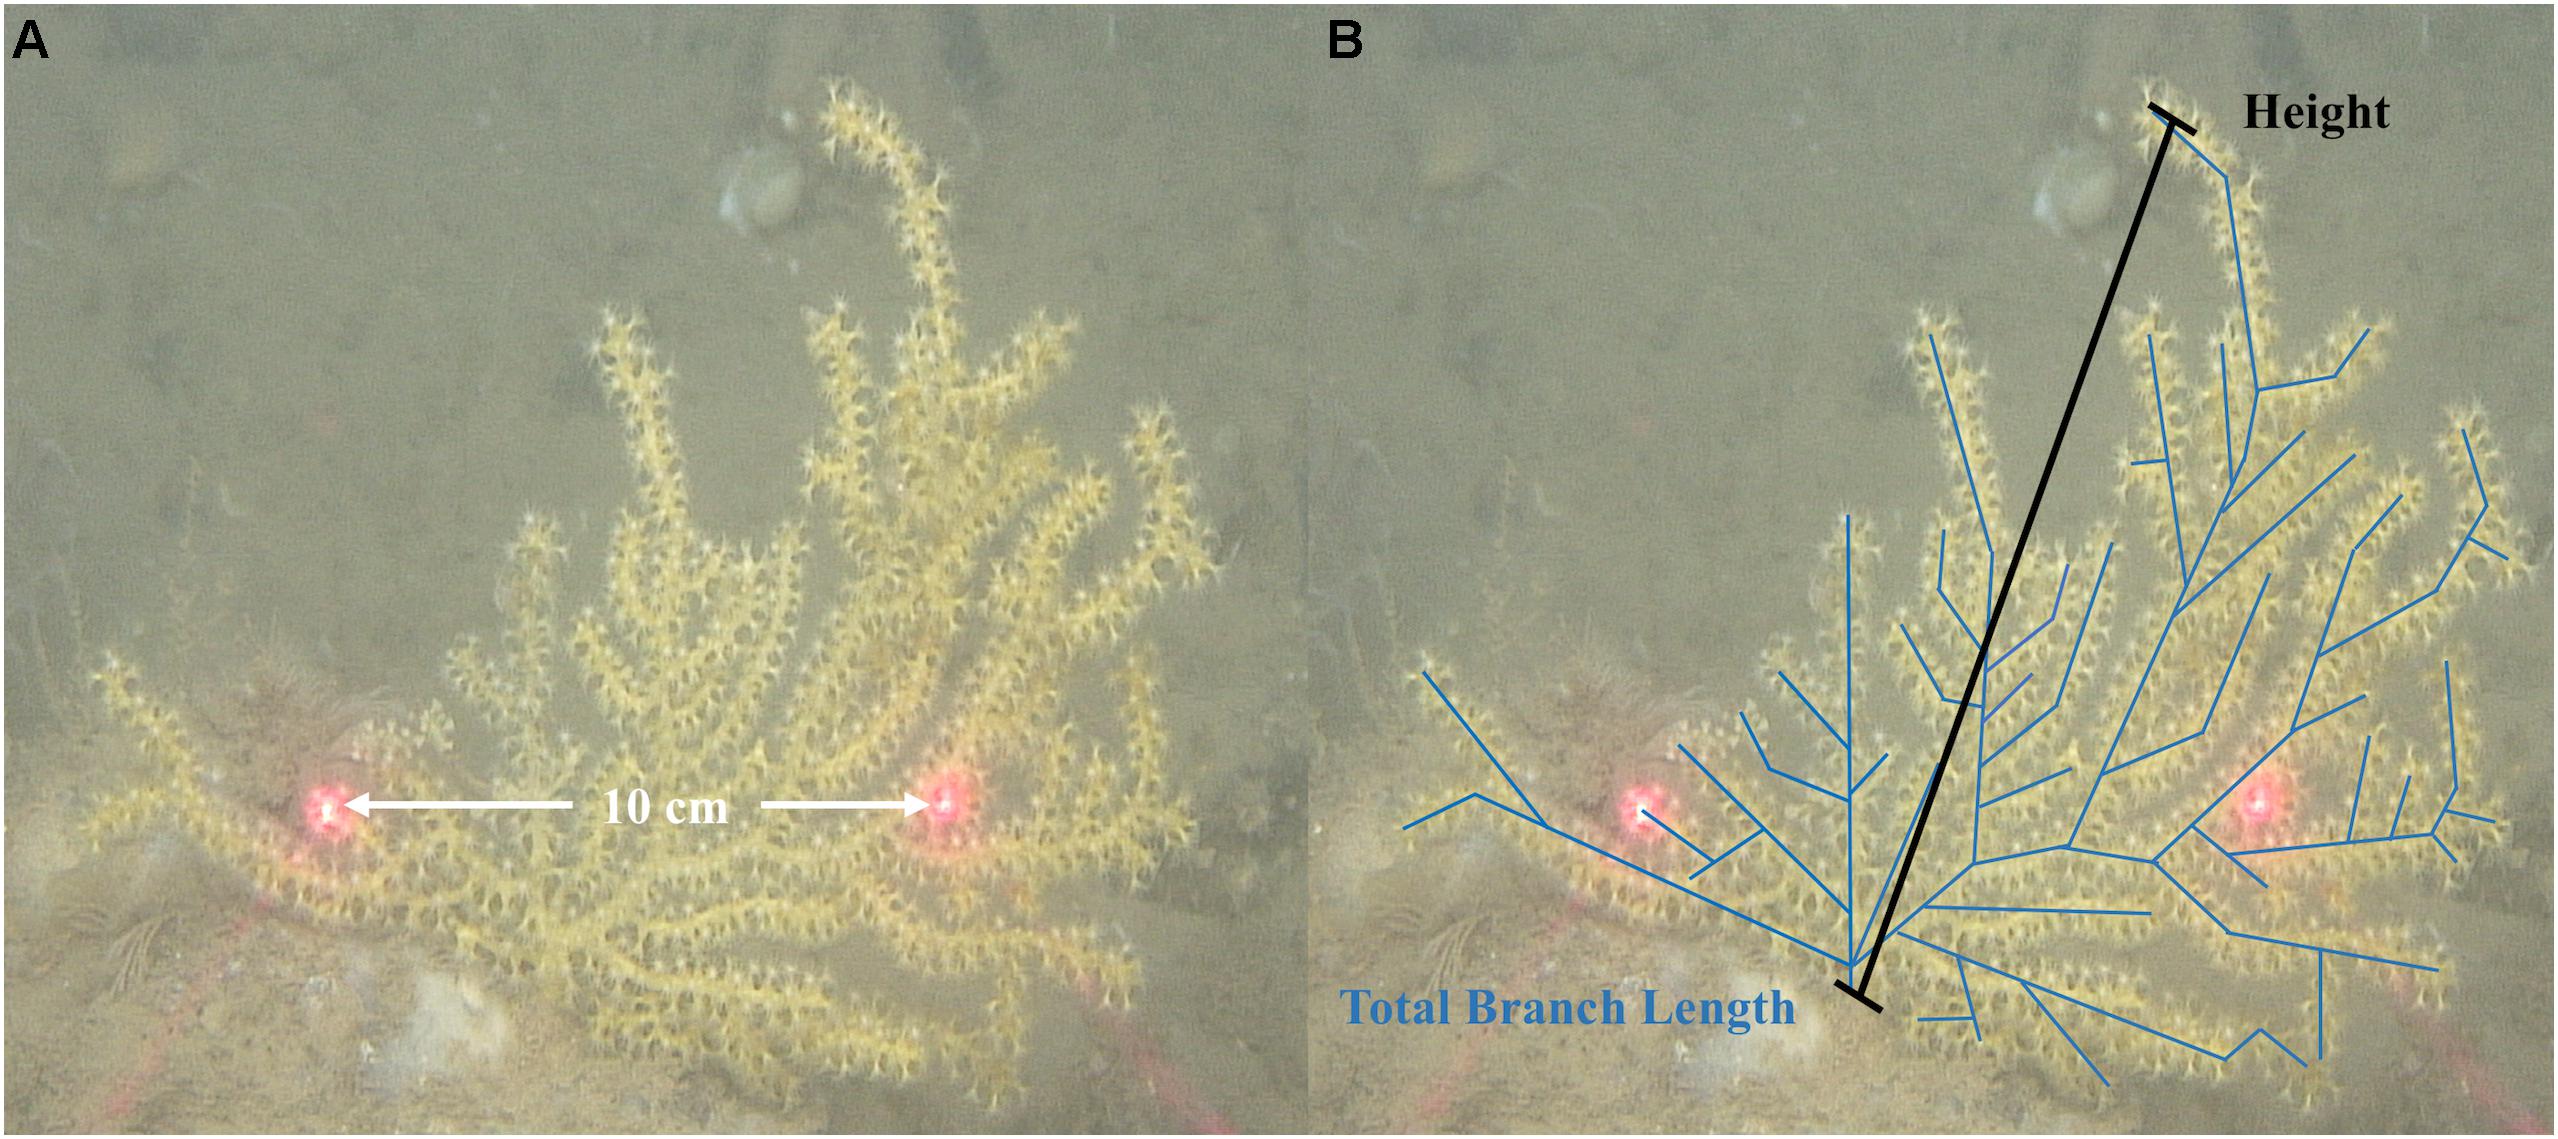
Figure 4. Schematic representation of imagery analysis scaling and a demonstration of morphologic data collection of Paramuricea placomus: (A) 10 cm laser scale; (B) Representation of data collection which included colony height and total branch length.
Following a similar methodology to Babcock (1984), Beiring and Lasker (2000), and Orejas et al. (2002) fecundity per reproductive polyp, polyps per axial cm, and total branch length were regressed with colony heights to develop quantifiable relationships used to inform a cohesive model for estimating the reproductive potential of entire coral colonies (Eq. 2). Regression models were run to define the functional relationships between each variable in Eq. 2 and colony height and are outlined in more detail in Table 2. Each variable was selected based on a logical progression building from individual gamete to entire colony. The idea that the polyp, as a single modular unit, forms a larger colony, based on asexual redundancies, is the foundation connecting coral reproductive biology to their morphology. This is not the first time the idea of modularity has been explored, as reviewed by Boardman et al. (1973), again by Jackson et al. (1985) and more recently in Hall and Hughes (1996). By further defining these functional relationships, more dynamic estimations are made as they account for changes between variables.
Where
F, potential relative colony fecundity
P, represents fecundity per reproductive polyp
r, is the percentage of reproductive polyps per axial cm
R, polyps per axial cm
T, total branch length
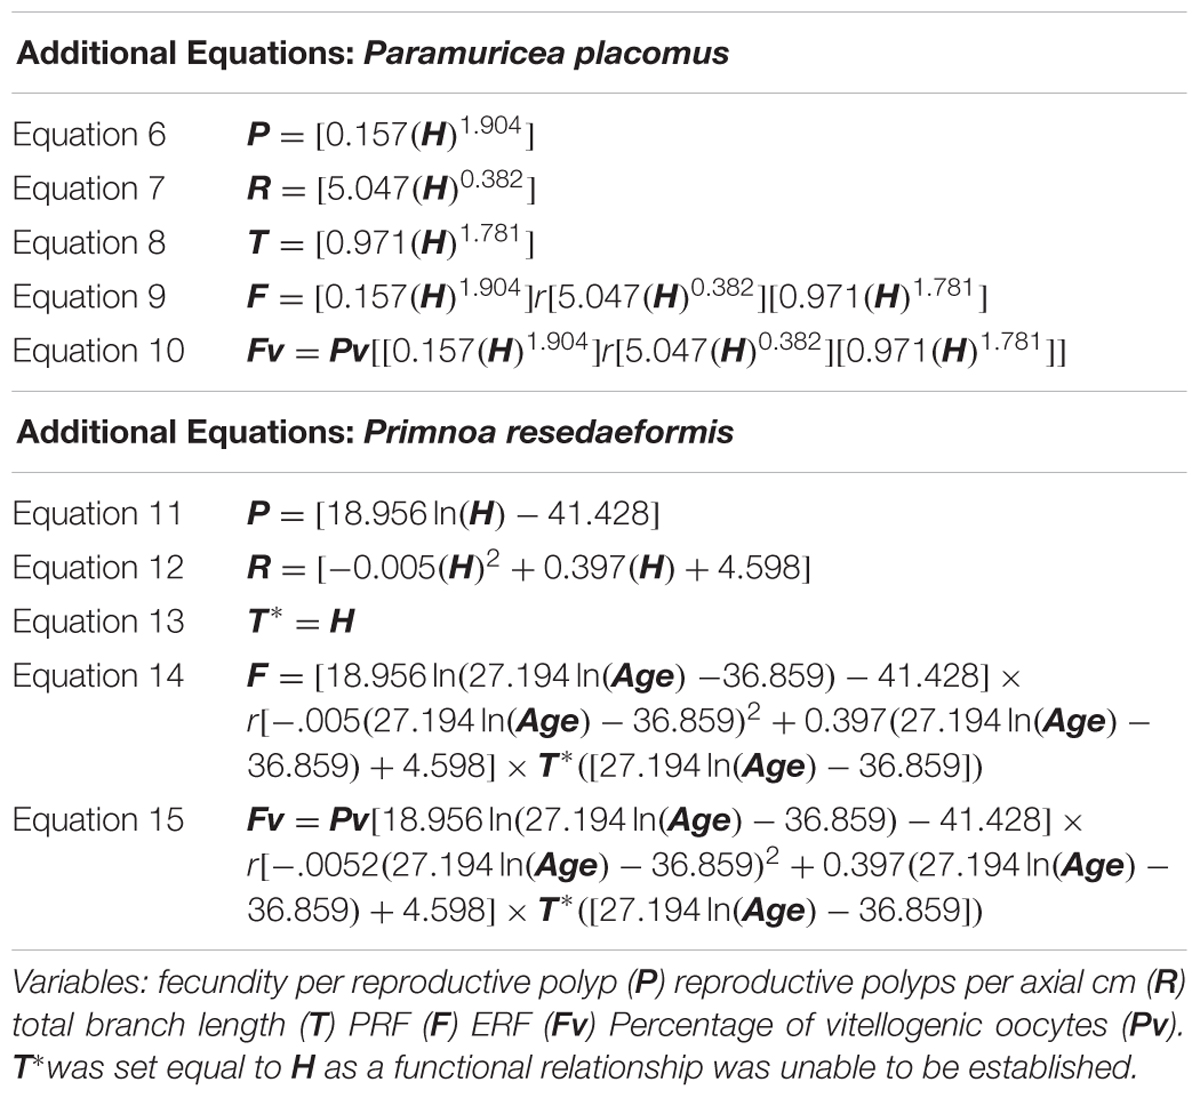
Table 2. Relationships used to model colony PRF and ERF using height (H) and age (Age) as inputs.
Functional relationships, established by quantifying reproductive development and colony morphologies, are an important component required to formulate a comprehensive model, used to estimate both potential relative fecundity (PRF) and effective relative fecundity (ERF) for entire coral colonies (in sensu Mercier and Hamel, 2011). PRF is an estimate of all oocytes within a colony and ERF is used to estimate the amount of vitellogenic oocytes within a colony. Mathematical modeling was used to further investigate the intersection of data streams to estimate the PRF (denoted by the symbol F in Eq. 2) and ERF (denoted by the symbol Fv in Eq. 3), and is the culmination of data collected throughout this and prior investigations (Eqs 2–3). These models were created as a means of quantifying the PRF of entire colonies, in this case specific to P. placomus and P. resedaeformis, with the ability of using height as a proxy. A proxy measurement, such as colony height, allows for larger ecosystem scale data to be collected more efficiently and the methodology and framework, from which this model is based, can be applied laterally to other coral and colonial species. The percent of reproductive polyps per axial cm, denoted by r, was not included in any of the calculations, or the final models, as this value has yet to be determined. However, it was left in the equation because of its importance to future iterations of reproductive models and will substantially contribute to increasing the accuracy of these calculations.
Where
Fv, Effective relative colony fecundity
Pv, is the scaling percentage of vitellogenic oocytes
Results
Both species in this study are gonochoristic. Of the 55 P. placomus samples analyzed 21 were female, 25 were male, and 9 were non-reproductive individuals. This resulted in a 0.84:1, female to male sex ratio among colonies of P. placomus. Similarly, P. resedaeformis colonies exhibited a 0.85:1 sex ratio of females to males, based on measurements from 54 samples: 23 females, 27 males, and 3 non-reproductive individuals. However, observed results were not significantly different from an expected 1:1 female to male sex ratio (P. placomus: Pearson’s chi-square, χ2 = 0.34, d.f. = 1, p > 0.05; P. resedaeformis: Pearson’s chi-square, χ2 = 0.32, d.f. = 1, p > 0.05). Notable as well, of the P. resedaeformis samples examined, one was an aberrant hermaphrodite, which was exceptionally fecund (Sample ID: OSR 100-1).
Data analysis between sample locations was evaluated at a significance threshold of p = 0.05. Included below is a comprehensive list detailing adjusted p-values for pairwise comparisons of: spermatocyst stages, oocyte diameter, fecundity, and height distributions (Table 3). All results were analyzed using RStudio version 1.0.136 (R Core Team, 2017).
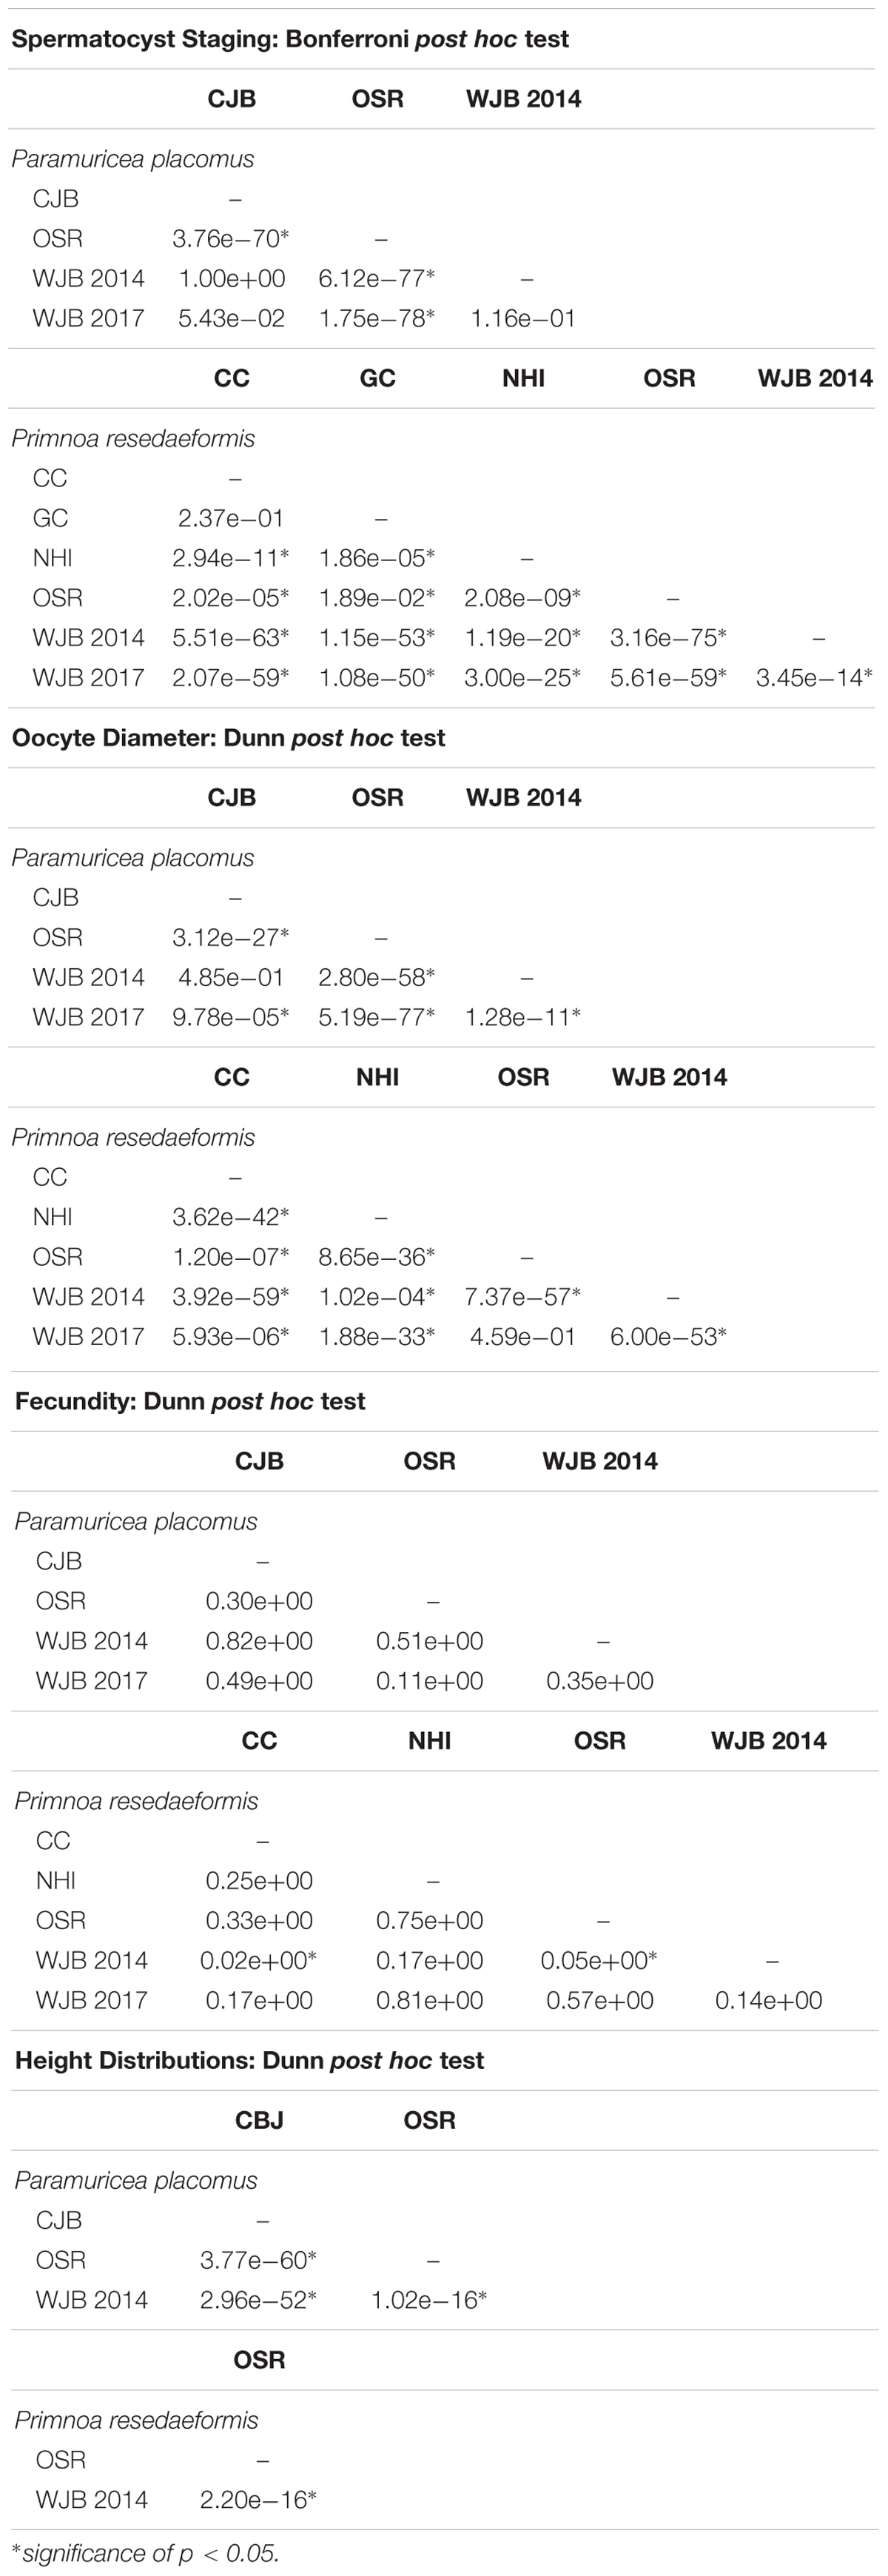
Table 3. Post hoc results of: spermatocyst staging, oocyte diameter, fecundity, and height distributions showing pairwise comparisons by site.
Spermatocyst Stages
Male colonies exhibited variable developmental trends based on sample location. Individuals from the Outer Schoodic Ridge, Nygren-Heezen InterCanyon, Corsair Canyon, and Georges Canyon consisted of larger proportions of stage IV spermatocysts than Western Jordan Basin and Central Jordan Basin. Both species showed a significant difference in spermatocyst stages based on sampling locations (P. placomus: Pearson’s chi-square, χ2 = 627.85, d.f. = 9, p < 0.05; P. resedaeformis: Pearson’s chi-square, χ2 = 707.63, d.f. = 15, p < 0.05). Pairwise comparisons were then evaluated using a Bonferroni post hoc test. In each comparison, there were significant differences in spermatocyst stages between sample locations (Bonferroni post hoc, p < 0.05) except for those in close geographic proximity. Locations in close geographic proximity that exhibited non-significant differences in spermatocyst stages are P. placomus samples from Western Jordan Basin and Central Jordan Basin (Bonferroni post hoc, p > 0.05) as well as P. resedaeformis colonies from Corsair and Georges Canyon (Bonferroni post hoc, p > 0.05).
Oocyte Diameter
Females examined exhibited differences in oocyte size, between P. placomus and P. resedaeformis, as well as between locations within species. The mean oocyte diameter (±SD) among P. placomus samples was 64 ± 46 μm and P. resedaeformis mean oocyte diameters were 140 ± 117 μm. Oocyte diameter distributions were heavily skewed to the right, showing the predominance of smaller previtellogenic oocytes, for both species. These distributions were further dissected to investigate the underlying differences in reproductive variability based on sampling locations.
Oocyte diameters were significantly different between sampling locations of P. placomus (Kruskal-Wallace, χ2 = 403.54, d.f. = 3, p < 0.05). A Dunn post hoc test, using a Benjamini-Hochberb p-value adjustment method, was performed to further analyze pairwise comparisons between 2014 sample locations. Oocyte diameters among the Outer Schoodic Ridge and Western/Central Jordan Basin sample locations were significantly different (Dunn post hoc, p < 0.05). However, Western Jordan Basin and Central Jordan Basin sample locations in close geographic proximity, did not show significant differences in oocyte size (Dunn post hoc, p > 0.05).
Like P. placomus, P. resedaeformis also showed variation in oocyte size among sampling locations. Data from 2014 to 2017 were analyzed following the same statistical framework as P. placomus and similarly oocyte size distributions were significantly different between sample locations (Kruskal-Wallace, χ2 = 496.47, d.f. = 4, p < 0.05). Pairwise comparisons indicate that oocyte diameters are significantly different among sample locations (Dunn post hoc, p < 0.05), except for between Outer Schoodic Ridge and collections from Western Jordan Basin 2017 (Dunn post hoc, p > 0.05).
Fecundity
Fecundity data, measured by the number of oocytes per reproductive polyp, also showed variation between sampling locations. Average quantities shown express mean ± SE. The average fecundity per reproductive polyp, across all female samples, was 23.4 ± 4.3 oocytes per polyp for P. placomus and 16.5 ± 2.5 oocytes per polyp for P. resedaeformis. There also existed substantial ranges in fecundity of reproductive P. placomus (1–86 oocytes per polyp) and P. resedaeformis (2–49 oocytes per polyp) individuals. Fecundity differences between sample locations were not significant for P. placomus (Kruskal-Wallace, χ2 = 5.57, d.f. = 3, p > 0.05). Conversely, colonies of P. resedaeformis exhibited significant differences in fecundity between sampling locations (Kruskal-Wallace, χ2 = 11.85, d.f. = 4, p < 0.05). Pairwise comparisons identified that fecundities were significantly different between Western Jordan Basin 2014 and Corsair Canyon 2017 (Dunn post hoc, p < 0.05) and Western Jordan Basin 2014 and Outer Schoodic Ridge 2014 sample locations (Dunn post hoc, p < 0.05).
Height Distributions
Size distributions of both species were significantly different between sampling locations (P. placomus: Kruskal-Wallace, χ2 = 346.15, d.f. = 2, p < 0.05; P. resedaeformis: Kruskal-Wallace, χ2 = 88.41, d.f. = 1, p < 0.05) and pairwise comparisons, using a Benjamini-Hochberg p-value adjustment, showed that all locations exhibited significant differences in colony size (Dunn post hoc, p < 0.05). For both species, the Outer Schoodic Ridge had the largest colony sizes on average followed by the Western Jordan Basin and then Central Jordan Basin (Figure 5).
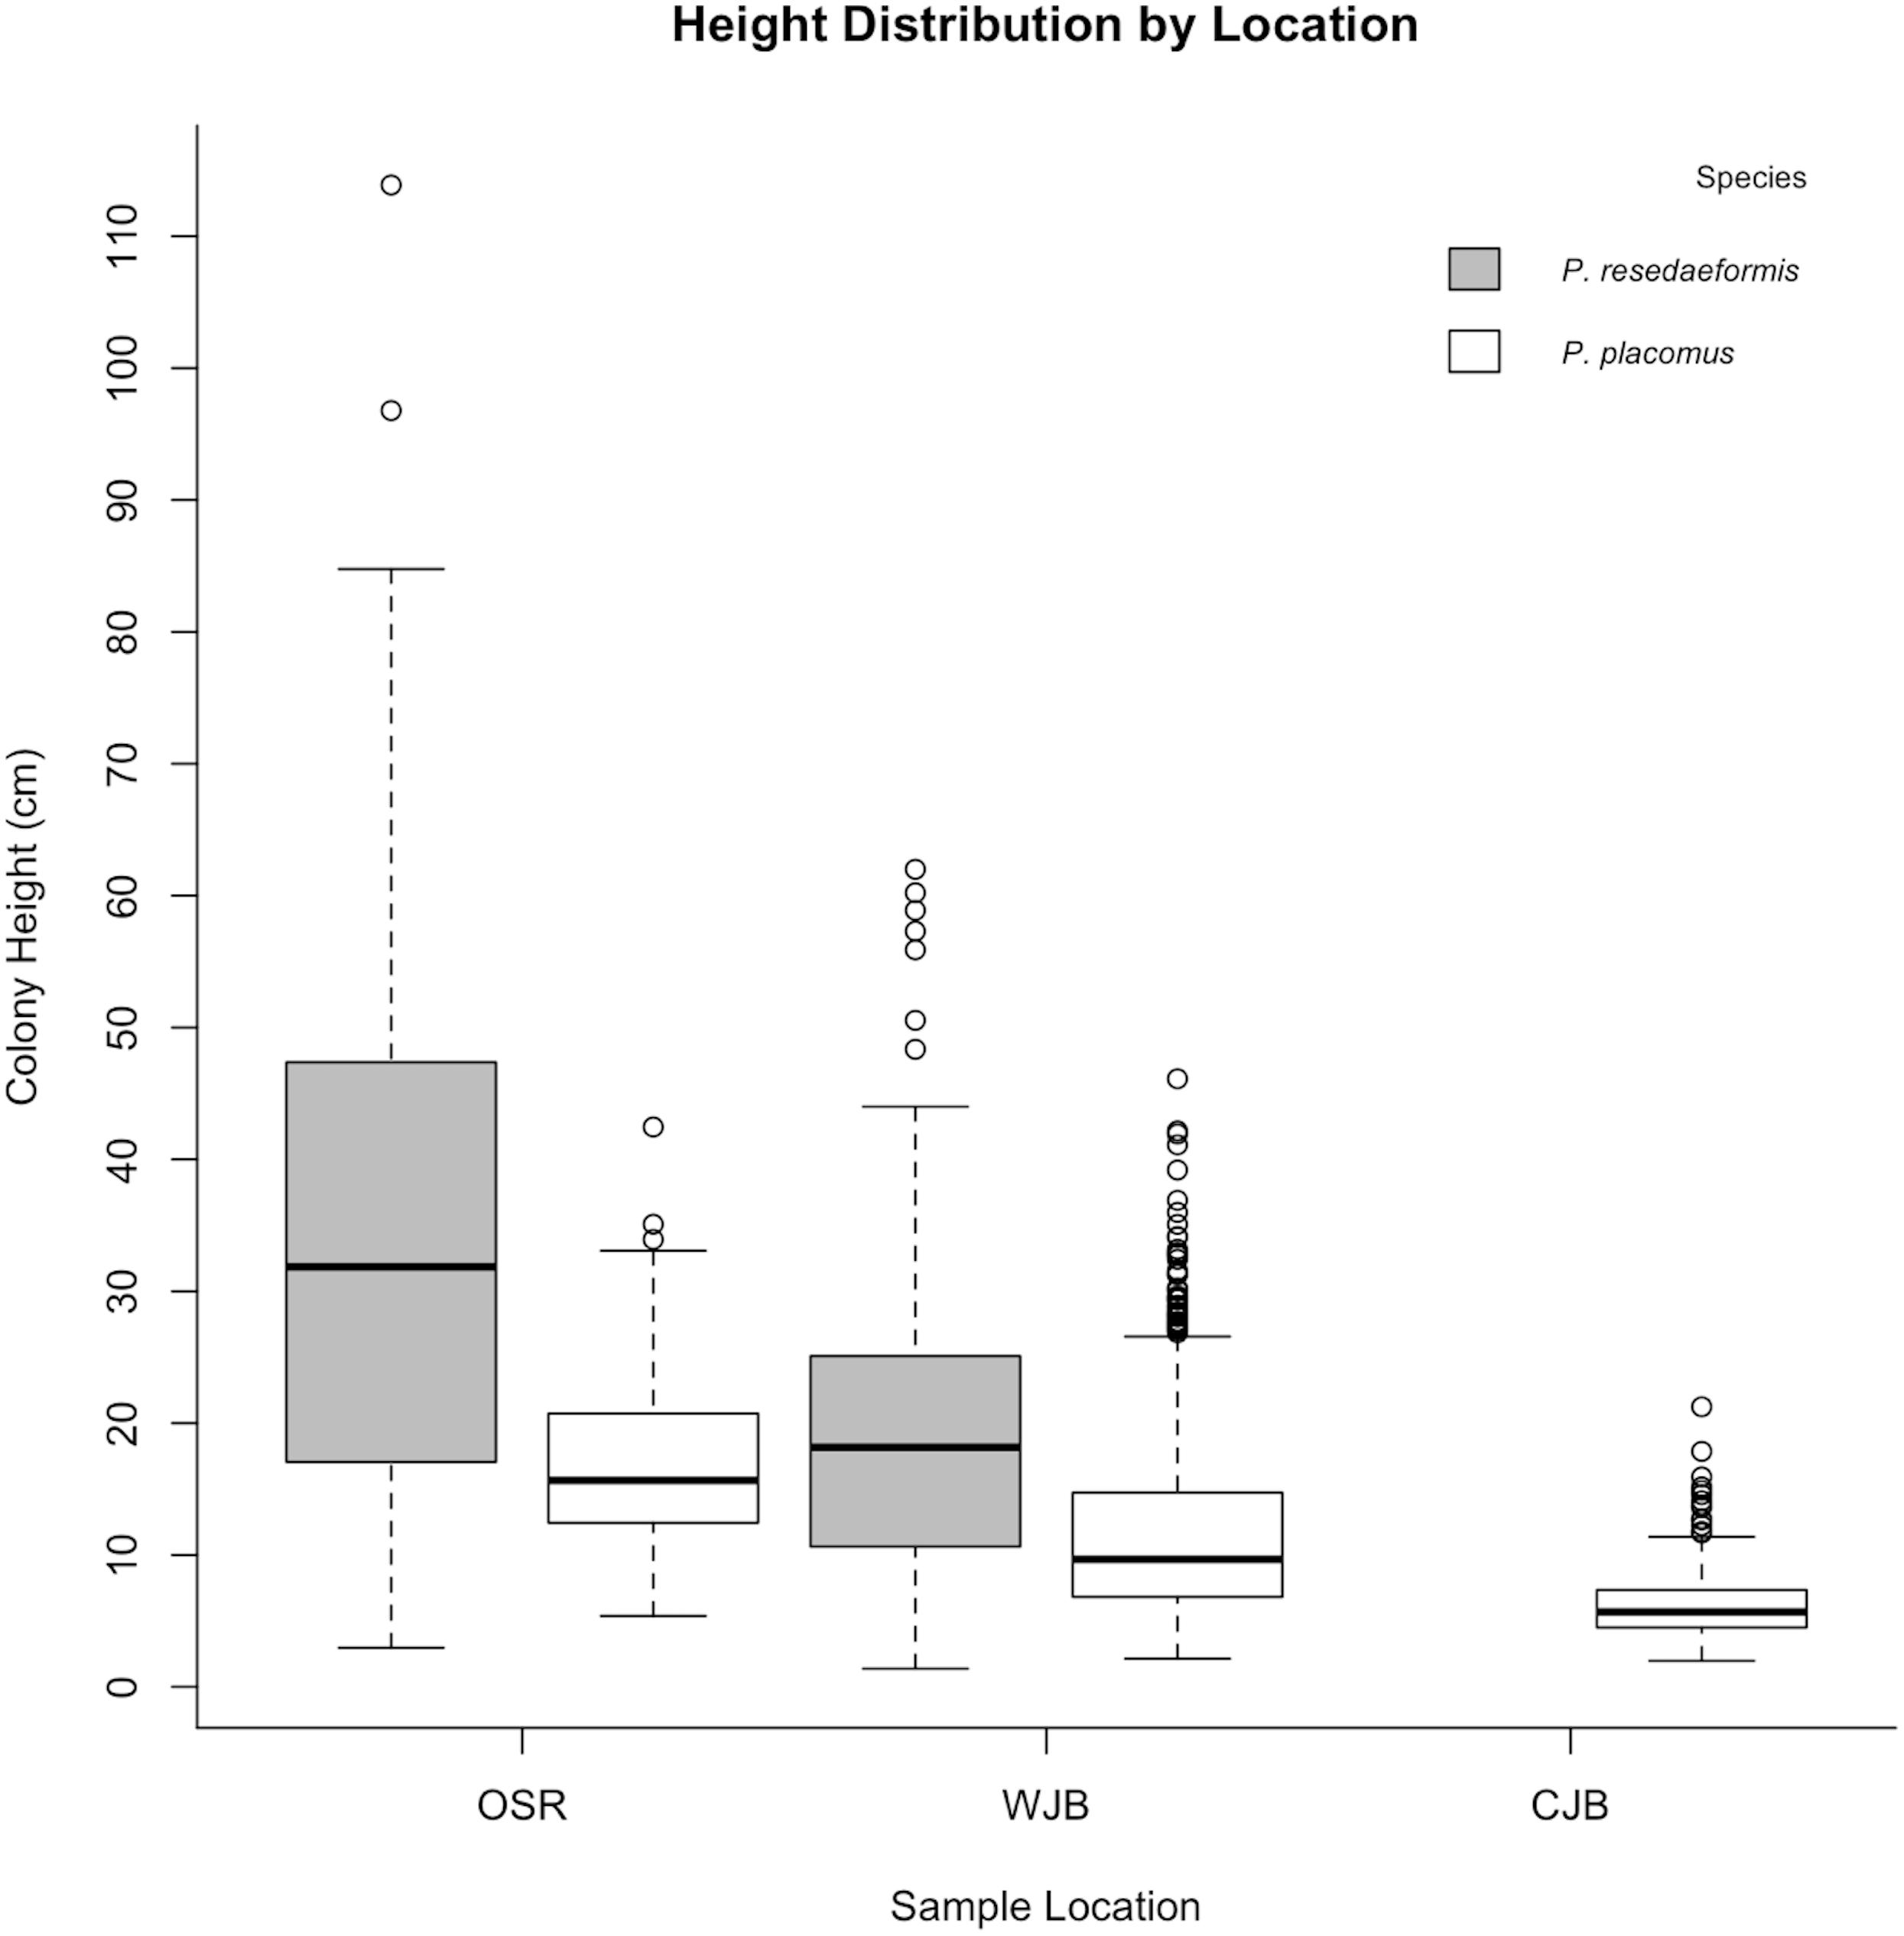
Figure 5. Species height distributions by sampling location. Both species exhibit variation in colony height across sample locations. Primnoa resedaeformis was not found at the Central Jordan Basin sample location.
Reproductive Variability Between June and August
Repeat sampling from the Western Jordan Basin from August 2014 and June 2017 allowed for monthly variability of oocyte size and spermatocyst stages to be investigated for both P. placomus and P. resedaeformis. Average quantities shown express mean ± 2 SE. Average oocyte size of P. placomus from August 2014 was 57.2 ± 2 μm and average oocyte size from June 2017 was 45.1 ± 1.8 μm. For P. resedaeformis average oocyte size was 70.6 ± 4 μm of samples collected from August 2014 and 153.9 ± 8.8 μm from samples collected in June 2017. These differences in oocyte size (Dunn post hoc, p < 0.05) provide evidence to support that there exists not only spatial variation in reproductive development, but expected monthly variation as well, among coral species within the Gulf of Maine. Additionally, P. resedaeformis colonies exhibited a significant difference in spermatocyst stages when comparing samples from WJB 2014 and WJB 2017 (Bonferroni post hoc, p < 0.05).
Reproductive Modeling
Paramuricea placomus data were fit using power function regression models as they provided the best coefficients of determination between height and variables in Eq. 2 (fecundity: R2 = 0.48, polyps per axial cm: R2 = 0.49, and total branch length: R2 = 0.78), accounting for a higher proportion of variance shared by the data then linear models. All regression models were tested using Akaike’s Information Criterion (AIC) providing further evidence that power function regression models were the best fit. In addition, all three regression models were a significant fit to the data (Pearson’s correlation, p < 0.05). The resulting functional relationships thus allow for colony height to be used as relatively accurate proxy measurement for the changes in fecundity, polyps per axial cm, and total branch length of P. placomus colonies and are of further importance for estimating the total reproductive potential of colonies among this species.
The relationship between total branch length and height was difficult to quantify with P. resedaeformis colonies as they show less consistency in their growth and tend toward more three-dimensional arborescent morphologies, making them difficult to quantify with reasonable certainty on a two-dimensional screen. However, other relationships such as fecundity per reproductive polyp and polyps per axial cm were still able to be regressed with height. Linear regression models were used to analyze the relationship between fecundity per reproductive polyp and height as well as the relationship between polyps per axial cm and height, for P. resedaeformis samples. AIC model evaluation was run to determine which linear functions were the best fit, selecting for a logarithmic linear model (R2 = 0.47), to describe the relationship between fecundity per reproductive polyp and height, and a second order polynomial function to describe the relationship between polyps per axial cm and height (R2 = 0.30). Both linear models were also significant fits of the data (Pearson’s correlation, p < 0.05).
Equations describing the relationship between colony height and their corresponding variables, as explained through prior regression analysis were then substituted back into Eq. 2. Additional examination of mature female colonies showed that 16% of the oocytes observed for P. placomus and 19% for P. resedaeformis were vitellogenic. These percentages of vitellogenic oocytes are important for modeling the reproductive potential as they help to quantify the ERF of mature female colonies and were used to further inform and develop Eq. 3. This results in two functions which account for changes in reproductive parameters as height changes (Table 2). These relationships allow for a single measurement to be used, height, as a predictor of PRF and ERF of entire coral colonies (Figure 6). Further representation depicts the height distributions across locations, of P. placomus, as plotted on top of the reproductive model (Figure 7). Height measurements collected from ROV video analysis were used to calculate the average PRF and ERF of coral colonies from surveyed locations (Table 4).
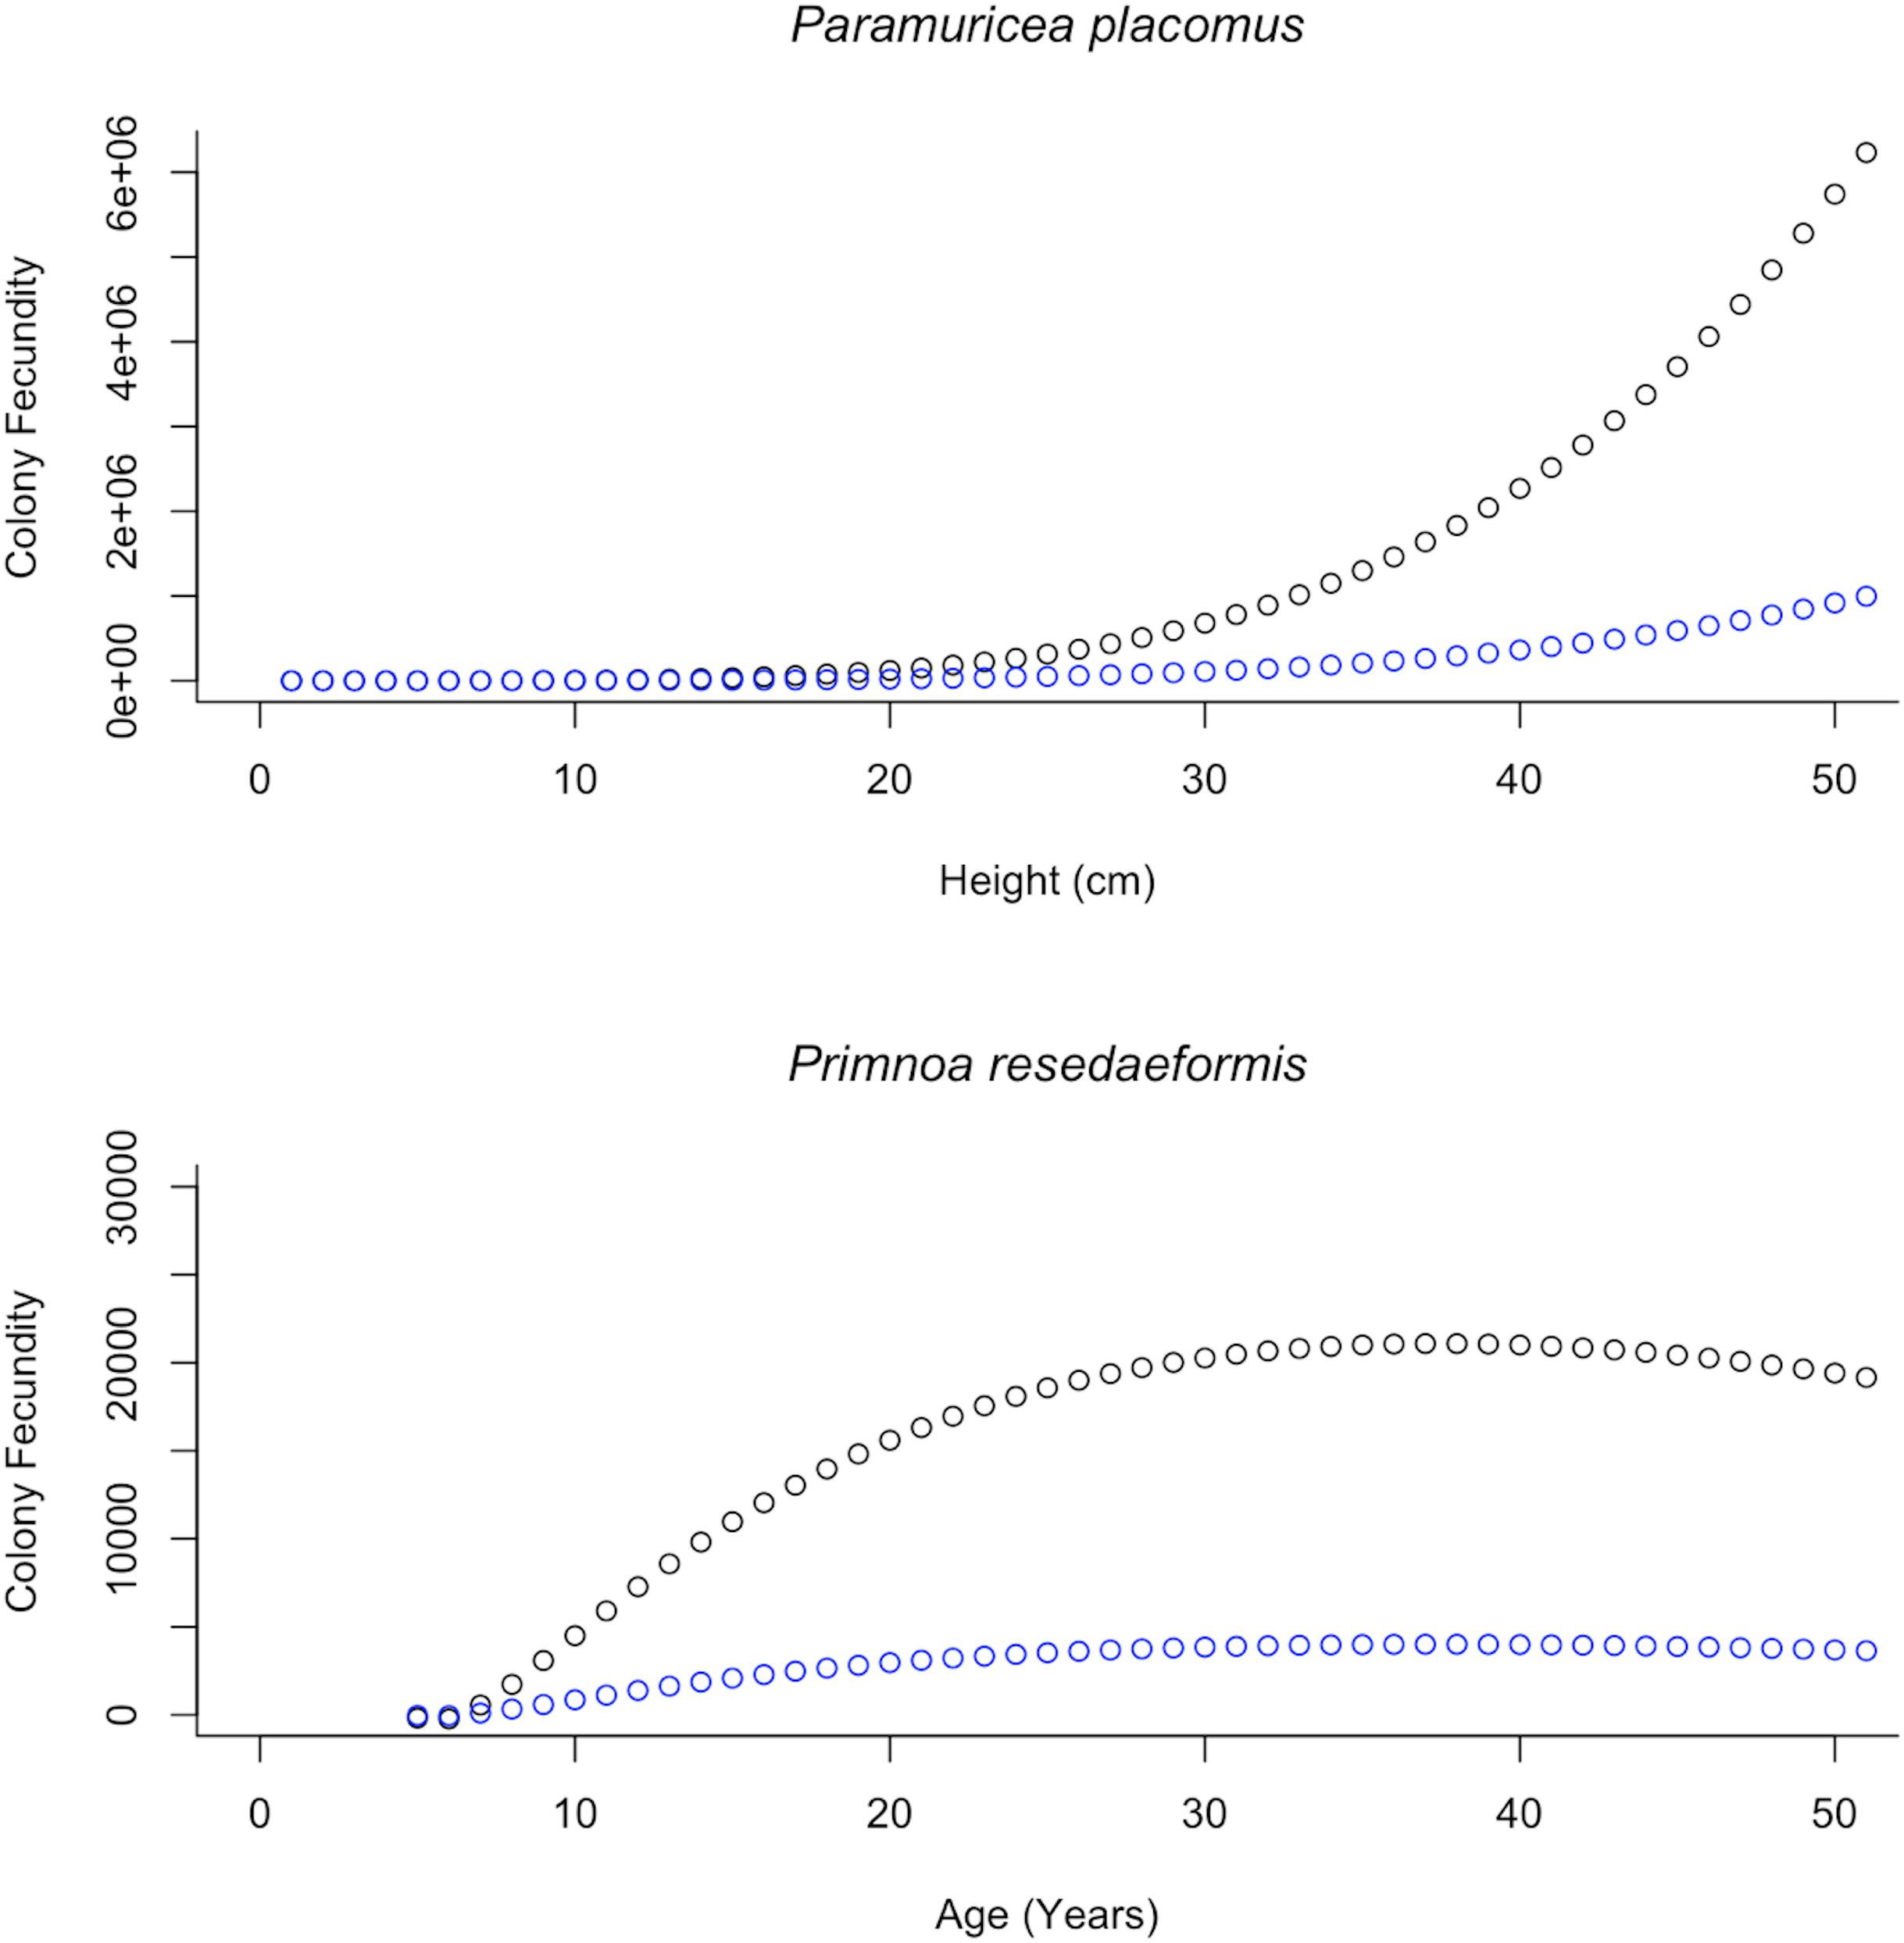
Figure 6. Modeled relationships between colony fecundity and height/age showing the difference between PRF (F) and ERF (Fv) based on the proportion of vitellogenic oocytes. Top: The increase in colony fecundity with increasing height. Plotted in black is the PRF, fitted with height values, 1–50 cm, spanning the range of observed Paramuricea placomus colonies. In blue these same height values are plotted using the proportion of vitellogenic oocytes and show the ERF. Bottom: The annual increase in colony fecundity. Plotted in black is the PRF, fitted with age values, 1–50 years, spanning the range of calculated Primnoa resedaeformis colony ages. In blue these same age values are plotted, showing the ERF based on the proportion of vitellogenic oocytes.
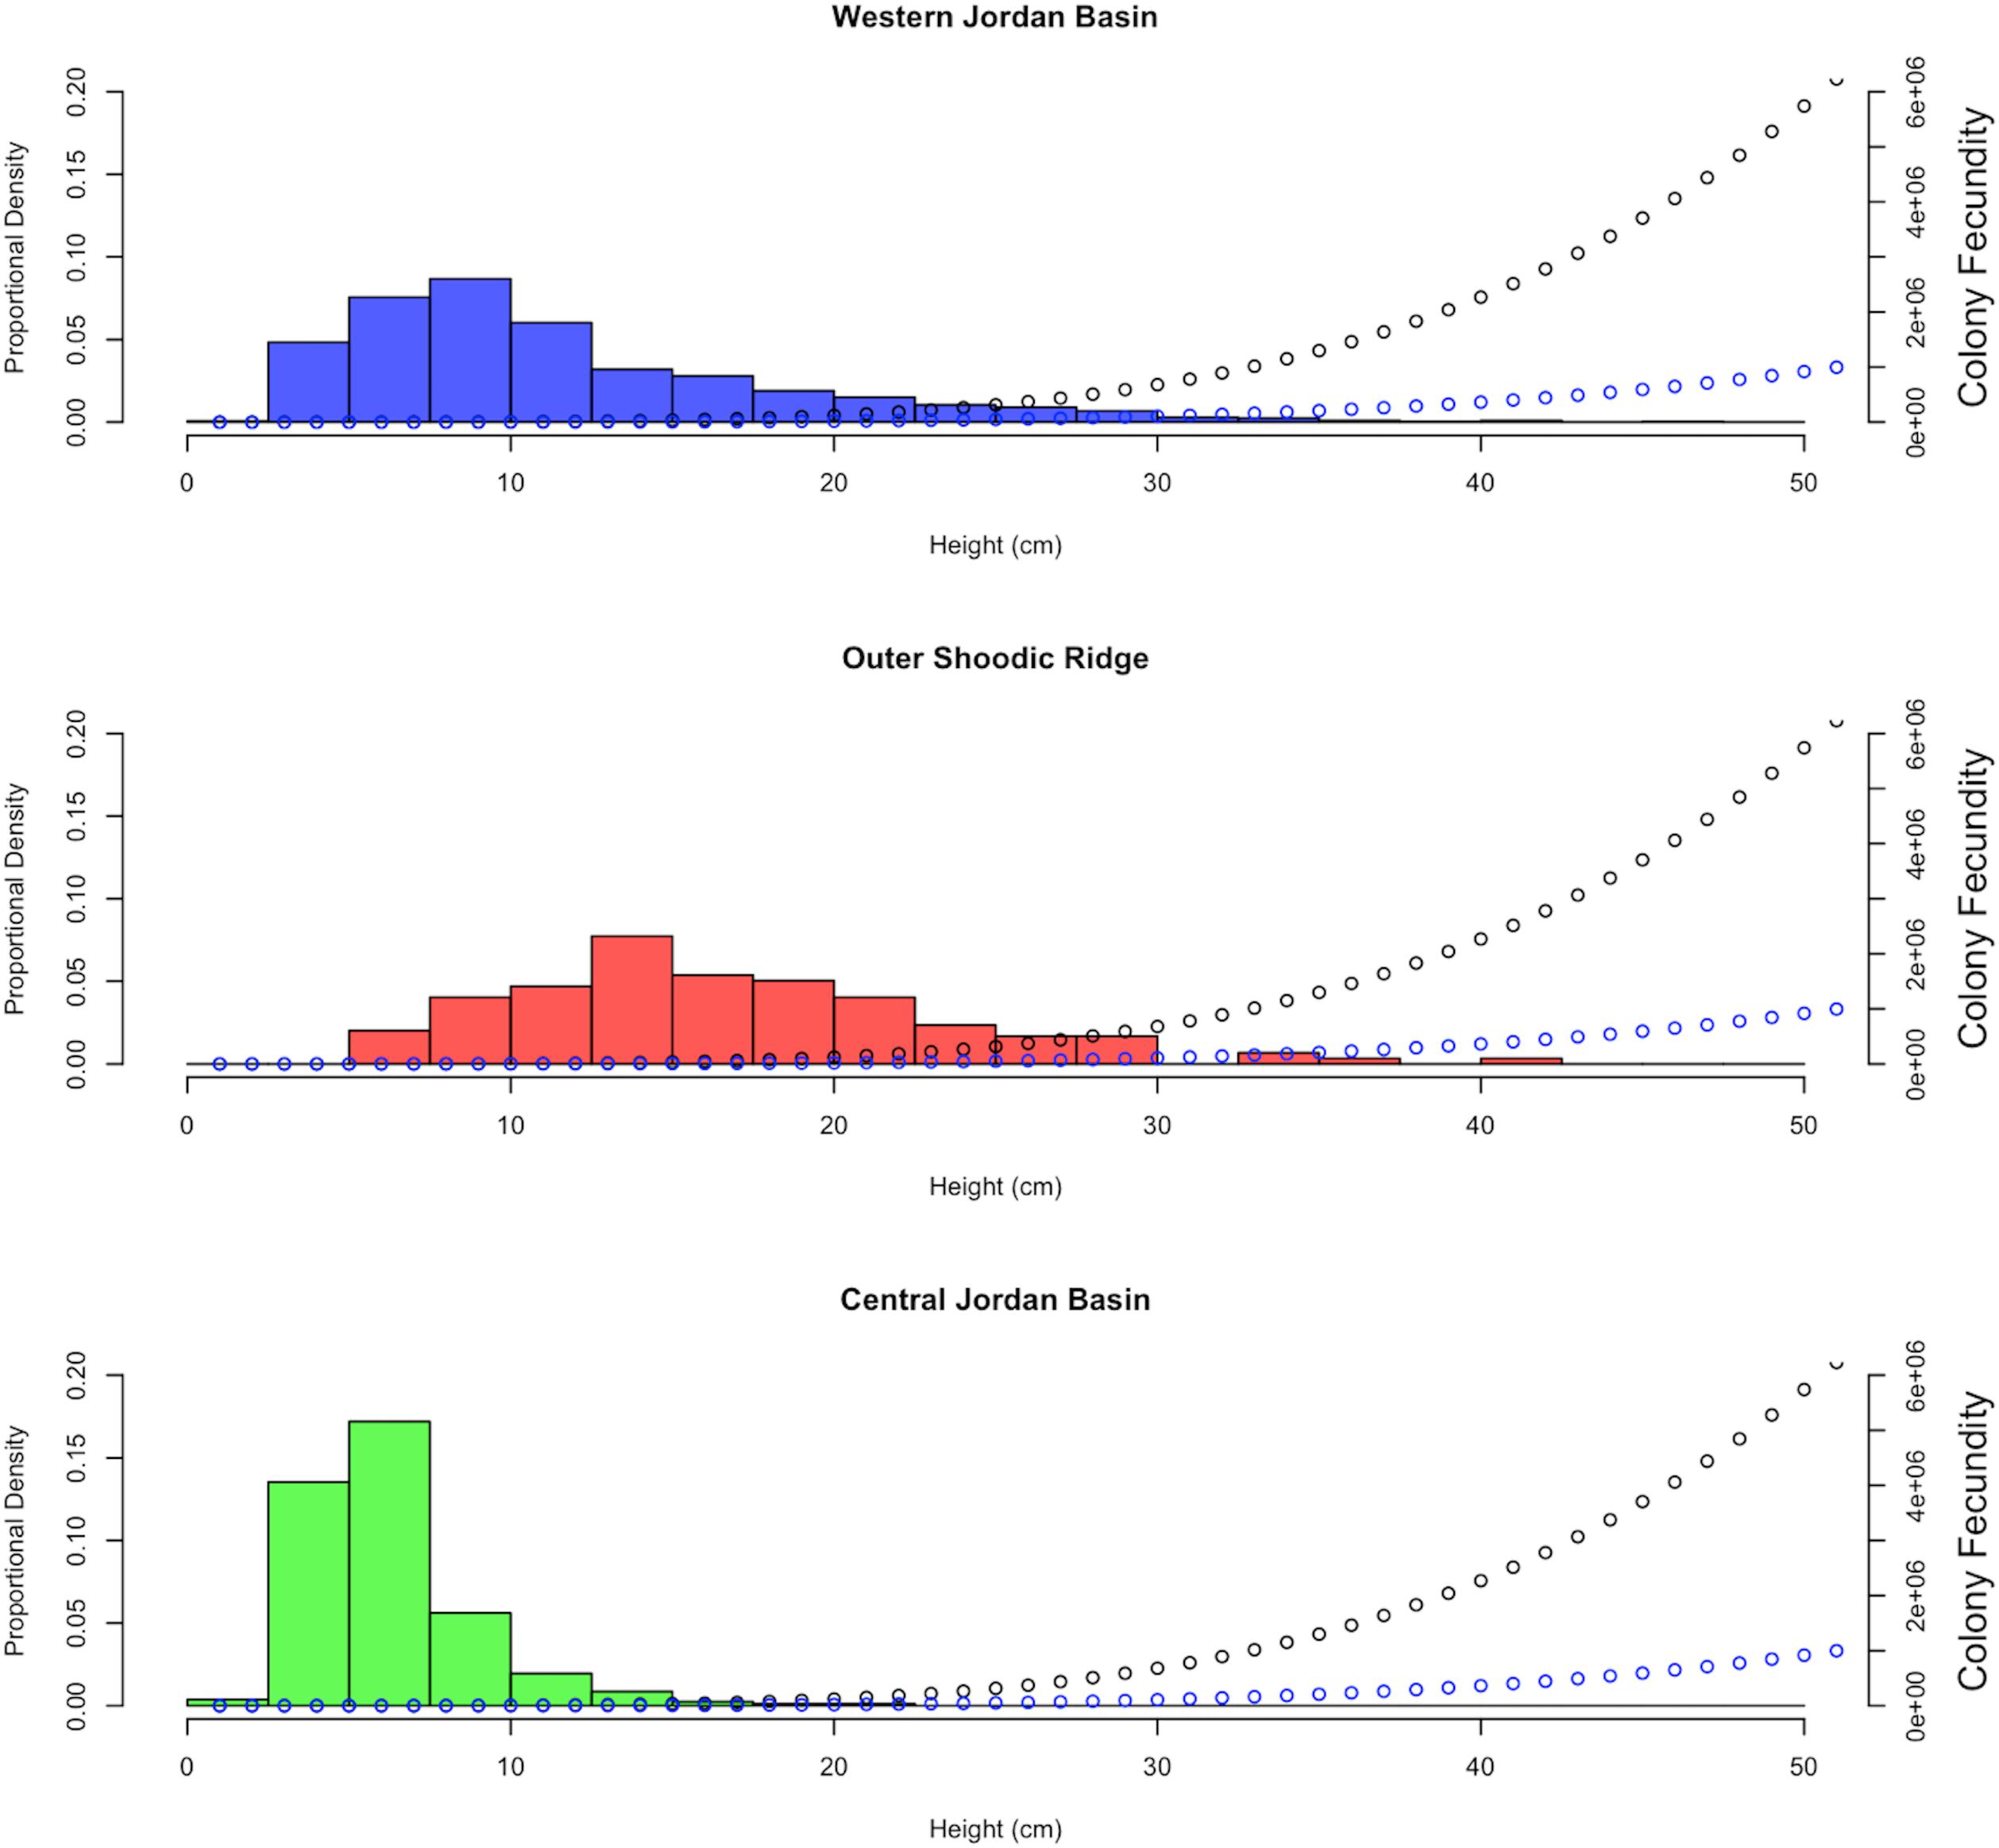
Figure 7. Colony height distribution frequencies, of Paramuricea placomus, by sampling location. Number of colonies in which height was measured (n). WJB n = 1116, OSR n = 119, CJB n = 328. Additionally, PRF (black) and ERF (blue) models are plotted on top of colony height distributions.
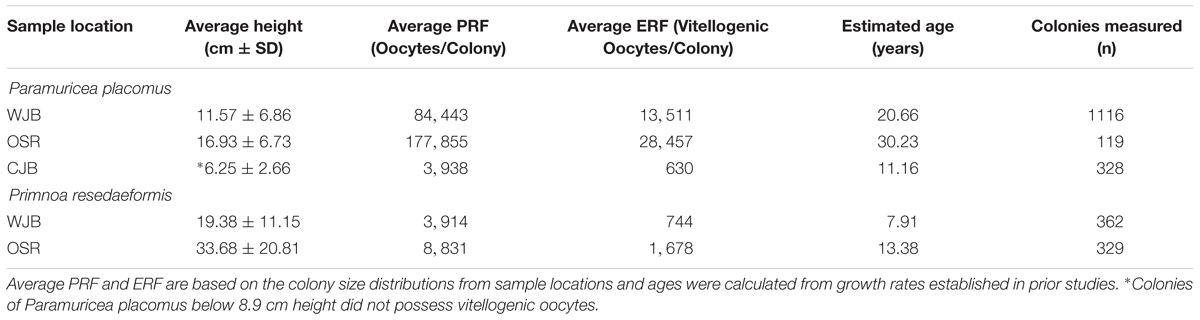
Table 4. Average colony heights by sample location based on ROV video analysis.
Potential relative fecundity and ERF were also modeled for P. resedaeformis colonies. Additionally, the relationship between colony height and age (Eq. 4), established by Mortensen and Buhl-Mortensen (2005), was substituted in, providing the change in colony height over time thus allowing for an estimation of annual changes in PRF and ERF (Table 2). As a result, modeled increase in colony fecundity with increasing age was plotted on top of calculated age distributions of P. resedaeformis colonies from both the Outer Schoodic Ridge and Western Jordan Basin (Figure 8). Estimates of average PRF and ERF were then made based on the calculated age class distributions from these sample locations (Table 4). Growth rate for P. resedaeformis, from Mortensen and Buhl-Mortensen’s (2005) model, looking at height and age, allow for changes in colony fecundity estimations over time to be made, but the relationship between total branch length and colony size is still missing, thus drastically diminishing the total colony fecundity estimation. In addition, the relationship between total branch length and height of P. placomus was modeled, which allows for a more accurate total colony fecundity estimation to be made, but it is missing the growth model showing how colony size changes over time. Essentially these are two halves of the same model with further data needed to improve either or both.
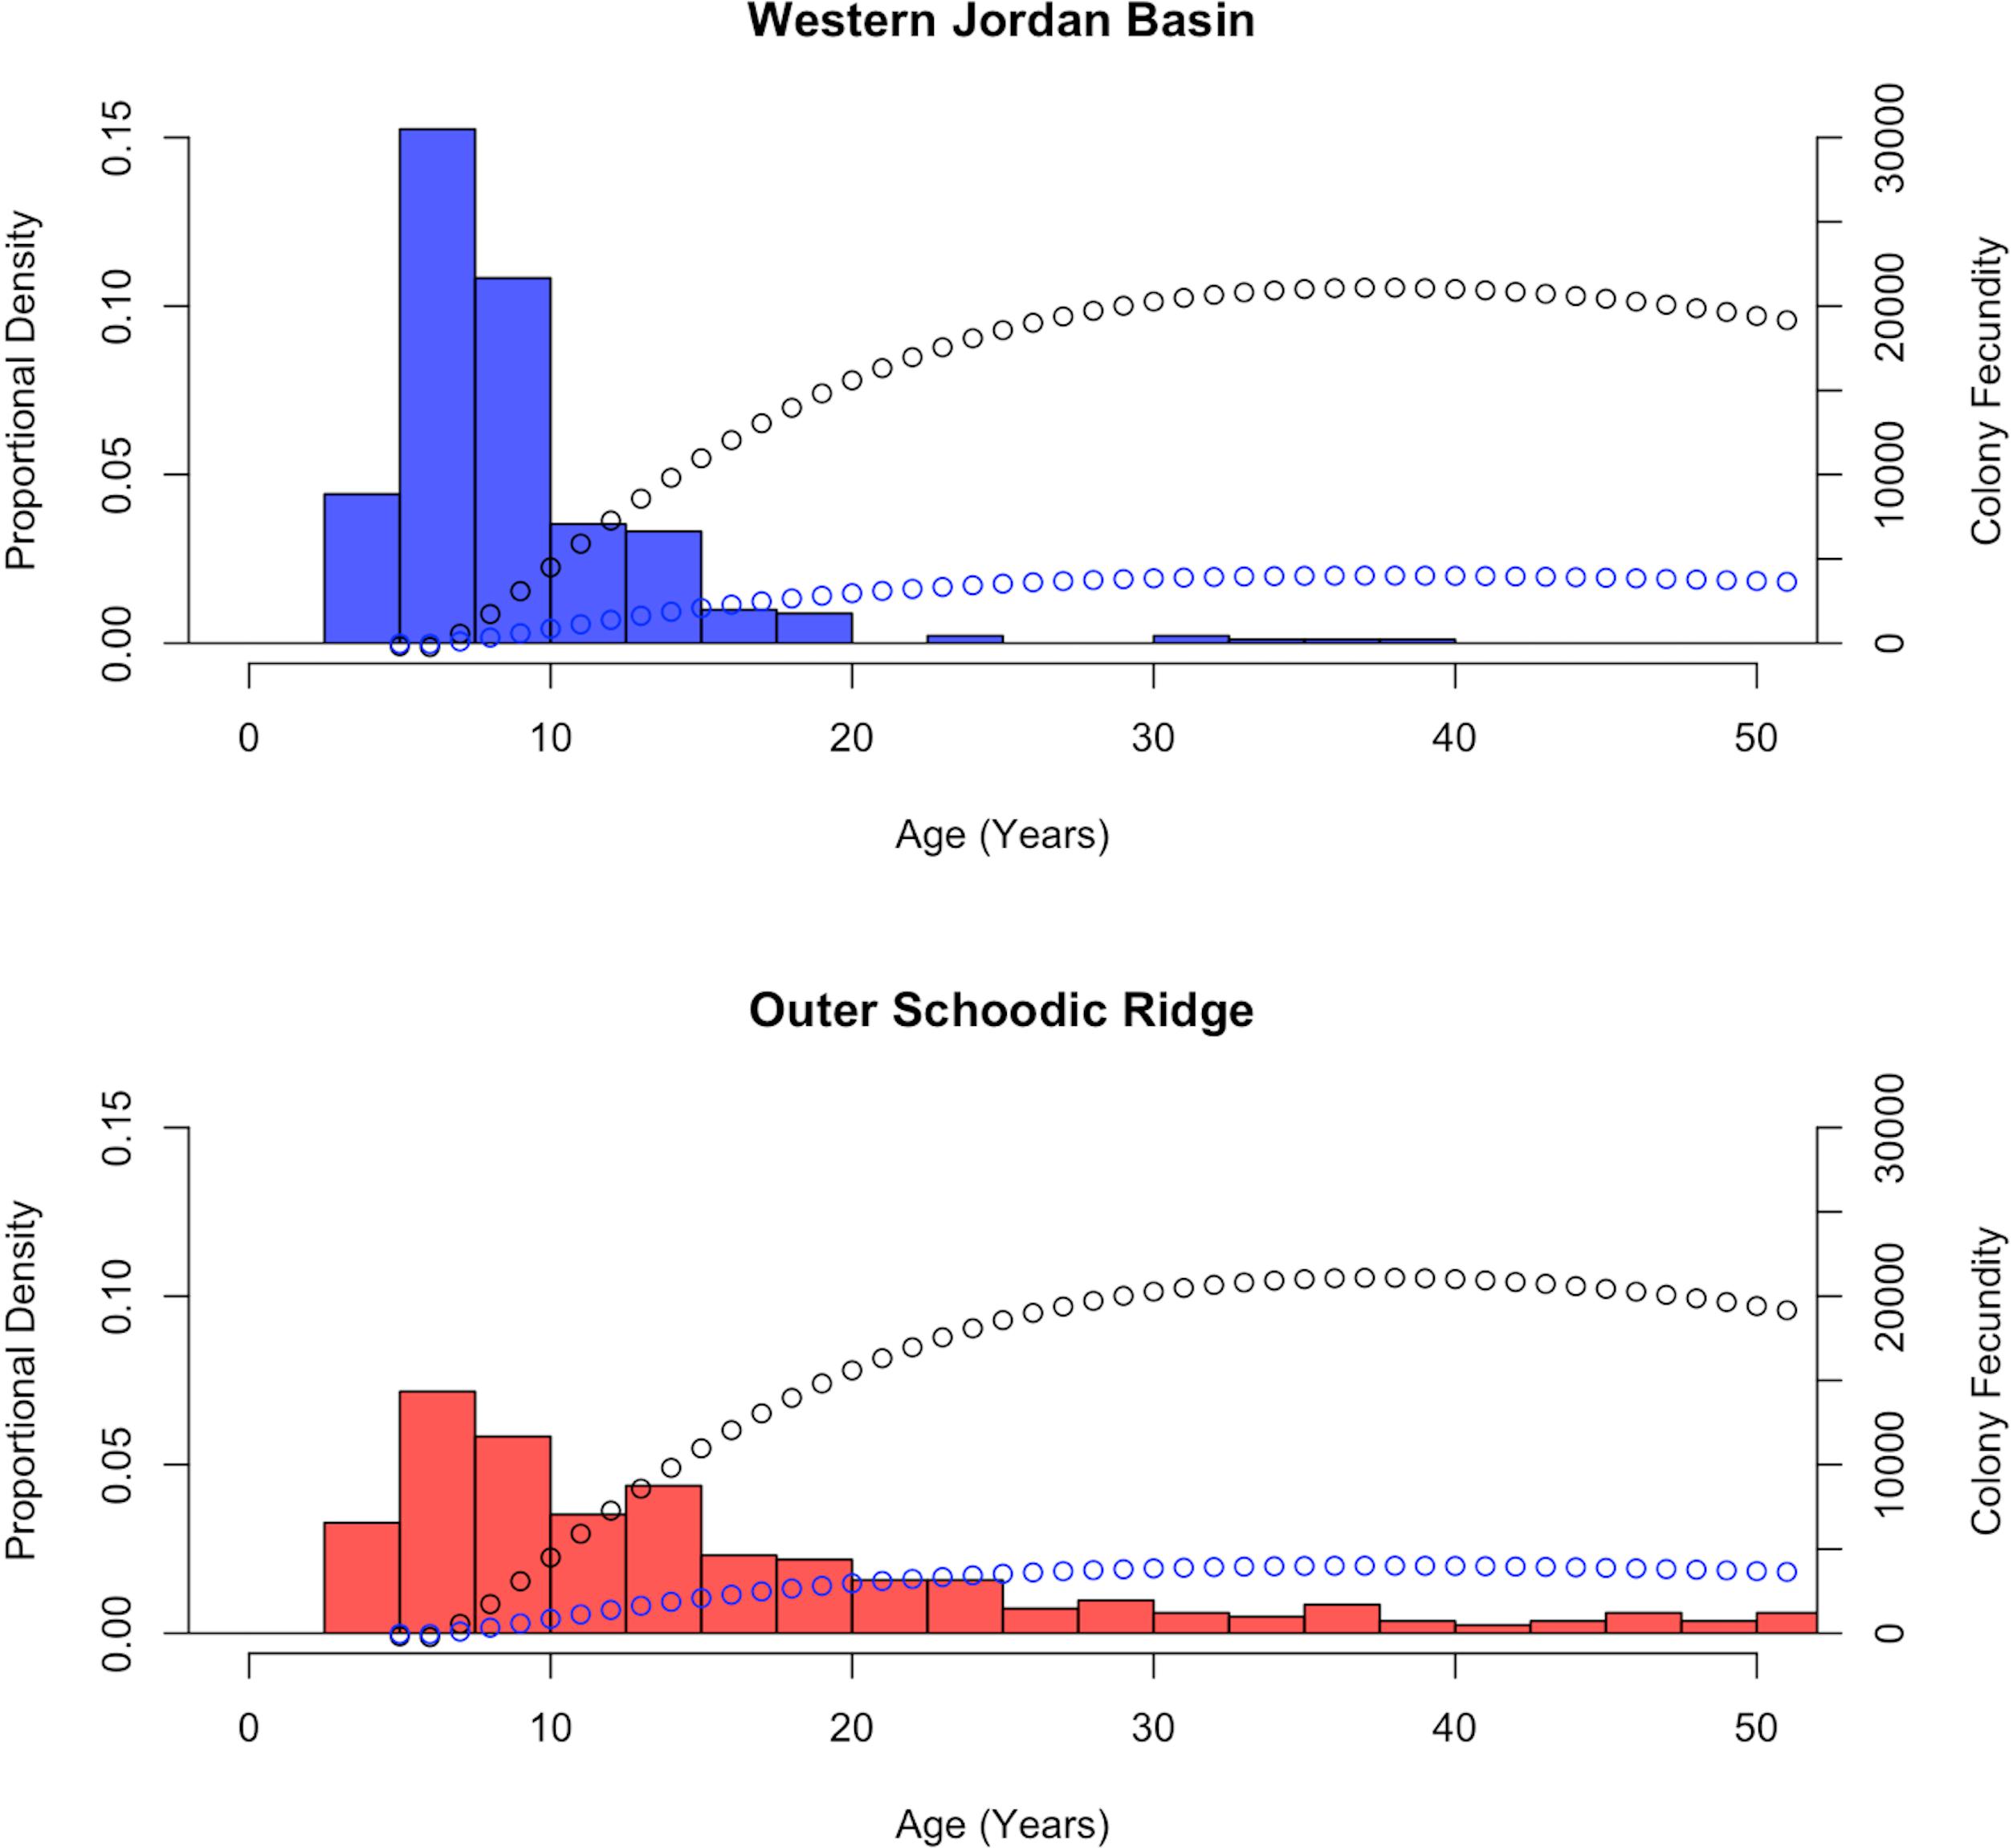
Figure 8. Calculated age distribution frequencies, of Primnoa resedaeformis, by sampling location. Number of colonies in which height was measured and then converted to age (n). WJB n = 362, OSR n = 329. Additionally, PRF (black) and ERF (blue) models are plotted on top of calculated age distributions based on colony height.
Age at Maturation
Standard errors ( ± 2 SE) were used to establish colony size ranges encompassing the stage of reproduction/non-reproduction being discussed. The following estimations of colony age at corresponding height are derived from an average annual growth of 0.56 cm per year (Sherwood and Edinger, 2009), assuming a constant and continuous growth rate for P. placomus (Table 5).
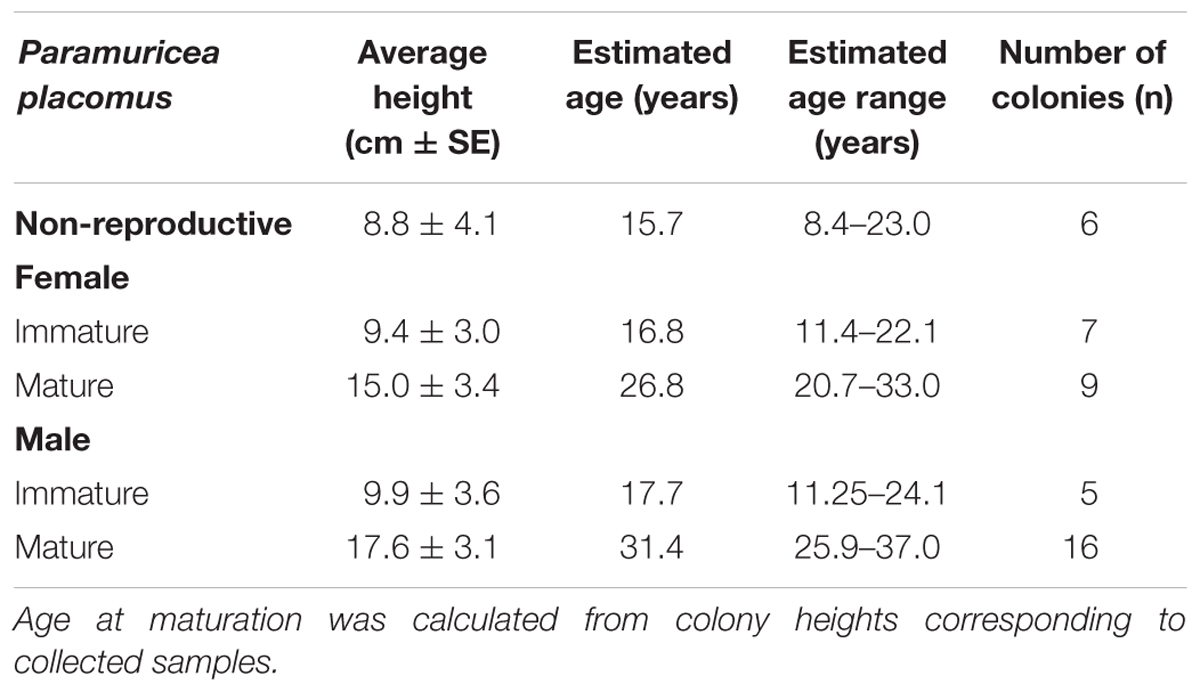
Table 5. Paramuricea placomus: Range in reproductive maturation, expressed as colony height and age.
These same data were collected for P. resedaeformis colonies (Table 6), however, work done by Mortensen and Buhl-Mortensen (2005) provide a functional relationship between height and age showing changes in growth rate over time (Eq. 4). This modeled relationship provides more informative estimations of age as it does not assume a constant and continuous growth rate. When solved for age, this equation (Eq. 5) can also be used to calculate the age of P. resedaeformis colonies based on their height. Importantly, Eq. 4 was derived from data collected from the Northeast Channel, south of Nova Scotia, which is in close geographical proximity to the data collected in this study.
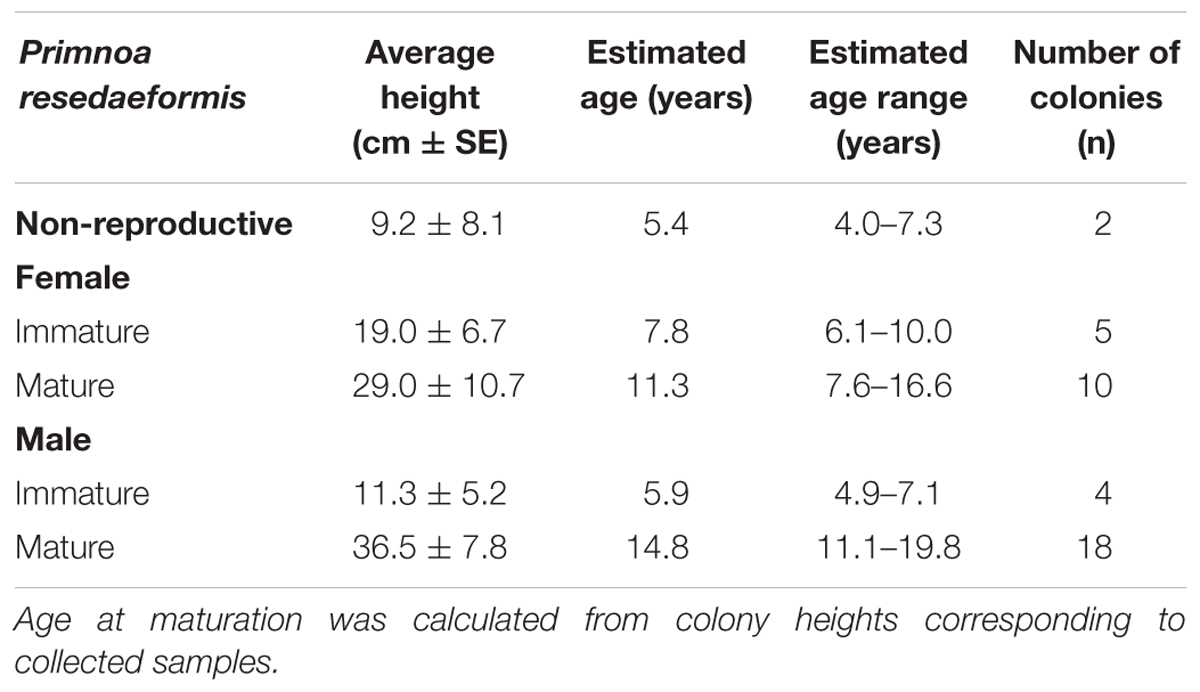
Table 6. Primnoa resedaeformis: Range in reproductive maturation, expressed as colony height and age.
Size at maturation estimates, growth rates, and morphometric data, provide the relationships necessary to further inform entire colony PRFs and ERFs while progressing toward calculated annual changes in reproductive effort.
In summation, spermatocyst staging, oocyte size, fecundity (of P. resedaeformis colonies), and colony size all show quantifiable differences between coral sample locations in the Gulf of Maine region, and maturity to first reproduction is expected to take decades. Based on these findings reproductive models were developed to estimate differences in reproductive potential across collection locations within the Gulf of Maine. Colony height was utilized as a proxy measurement for reproductive potential and using colony size distributions it was then possible to calculate the PRF and ERF from surveyed locations.
Discussion
Here we have demonstrated spatial variability in: spermatocyst stages, oocyte size, fecundity, and height distributions between sampling locations of P. placomus and P. resedaeformis colonies. In addition, these data link spatially explicit reproductive potential of individual colonies to population processes for the first time in this region. By describing and quantifying the reproductive biology of P. placomus and P. resedaeformis, these reproductive data can now be used to inform individual colony and population scale estimations of reproductive potential. These estimations are based on the relationships between reproduction, morphometrics, and colony size distributions from multiple locations across the Gulf of Maine region. These linked analyses have allowed for portions of per species individual based colony reproductive potential models to be made and has provided insight into data gaps to be filled to improve future estimations.
In this study, both P. placomus and P. resedaeformis show an observed 0.85:1 sex ratio of females to males. These gonochoristic species did not deviate significantly from a 1:1 sex ratio, as seen in other octocorals (Benayahu and Loya, 1986; Orejas et al., 2002; Ribes et al., 2007; Kahng et al., 2011), indicating populations of random mating based on optimal sex allocation (Kahng et al., 2011). However, what is pertinent in both species, within the Gulf of Maine region, is an observed reduction in female representation. This may be a result of differences in maturation rates between male and female colonies (Benayahu and Loya, 1983), the energetic imbalance between female and male sexual development (Ribes et al., 2007), and differential responses to disturbance (Linares et al., 2008). Contrarily, P. resedaeformis has also shown an absence of male representation and a significant female biased sex ratio along the continental slope off of Newfoundland and Labrador (Mercier and Hamel, 2011). Whereas the gonochoristic ratio between male and female colonies has been further elucidated how these individuals are distributed throughout the population remains variable and unknown.
Interpretation of regression analyses identified a best fit second order polynomial function quantifying the relationship between reproductive polyps per axial cm and colony height of P. resedaeformis. This function suggests that polyps per axial cm increases with colony size initially then decreases as the colony continues to grow. This may be the result of changes in resource allocation as colonies grow (Heino and Kaitala, 1999), or colonial compensation for decreasing particle capture rates as colony sizes increase (McFadden, 1986), thus having fewer polyps and reducing intracolonial competition and the cost of excess vegetative growth. This may also explain why P. resedaeformis colonies show a high degree of morphometric plasticity as this is believed to dampen the effect of intraspecific competition (Hoogenboom et al., 2008) and increase adaptability to environmental heterogeneity (Stearns, 1989; Shaish et al., 2007; Rowley et al., 2015). The relationship between total branch length and height was unable to be obtained for P. resedaeformis colonies and will be necessary to acquire and combine with published growth rates in future work. Researchers will then be able to estimate timescales over which recovery is expected by calculating annual changes in PRF and ERF of P. resedaeformis colonies, as partly demonstrated above. Additionally, the relationship between total branch length and height, of P. placomus (i.e., as above R2 value of 0.78) was strikingly similar to the coefficient of determination obtained by Mistri (1995) (R2 value of 0.77) when also assessing the relationship between total branch length and height of Paramuricea clavata (Risso, 1826) in the Mediterranean. This may be attributable to strong morphotyping of this genus, showing a tendency toward planar growth, as a strategy for utilizing nutrient uptake in uni- and bi-directional flows (Mortensen and Buhl-Mortensen, 2005) while also potentially minimizing polyp overcrowding and “shading” within the colony. Providing biological context to these regression models also suggests that additional sampling of P. placomus, especially on the minimum and maximum ends of the colony size range, is important for increased interpolative accuracy, as it is likely that fecundity per reproductive polyp will eventually be constrained by internal polyp space (Fadlallah, 1983; Sebens, 1987; Hall and Hughes, 1996).
Interspecific comparisons between P. placomus and P. resedaeformis revealed that P. resedaeformis oocytes and colony sizes are ∼2.3 × larger on average. Interestingly, even though P. resedaeformis colonies and oocytes are ∼2.3 × larger on average, than P. placomus, the average oocyte size is 0.0006 × the colony height for both species. These interspecific similarities provide evidence to support a potential allometric relationship between oocyte size and species size within octocorals. There also exist intraspecific differences in average mature colony sizes between females and males of both species, as noted in Tables 5, 6. These differences may be driven by the disparity between gametogenic duration times of male and female colonies, as male colonies in other octocorals have shown drastically shorter gametogenic cycles than their female counterparts (Ribes et al., 2007; Waller et al., 2014). These variations in reproductive development may result in more energy allocated to growth, suggesting a difference in growth rates between male and female colonies as well. Many studies investigating coral reproduction have noted the importance of colony size and the coinciding amount of time it takes to reach maturation (Sebens, 1984, 1987; Soong and Lang, 1992; Hall and Hughes, 1996; Bak and Meesters, 1998).
Primnoa resedaeformis, within the Gulf of Maine, exist toward the upper thermal limit observed in this species, interquartile range 4.5–7.5°C (Buhl-Mortensen et al., 2015), with temperatures recorded at 250 m, within the Western Jordan Basin, between 6.5 and 9.5°C (Townsend et al., 2015). These differences in temperature may act as divergent drivers of local selection. Latitudinal compensation, intra specific physiological adaptation to environmental gradients (often correlate with temperature), results in distinguishable differences in baseline metabolic rates, differences in temperature tolerances, and differences in reproductive processes such as egg development times (Levinton, 1983), reproductive output (McGuire, 1998; Airi et al., 2014), and reproductive timing (McGuire, 1998; Kersting et al., 2013; Goodbody-Gringley and de Putron, 2016). Spatial variability in reproductive potential and colony size, among local coral populations, may be further exacerbated by the fact that the Gulf of Maine, one of the fastest warming bodies of water on the planet (Pershing et al., 2015), is also experiencing seasonal changes in phenology (Thomas et al., 2017). The consequence of these combined changes, in addition to regional differences in the timing and intensity of surface productivity (Thomas et al., 2003) may alter coinciding variability in vertical nutrient fluctuations, and further disrupt the reproductive cycling among coral populations within the Gulf of Maine. This is especially pronounced when studying slow growth species, like P. placomus and P. resedaeformis, as it is concerning when rates of environmental change outpace an organism’s ability to adapt (Connell, 1978). As a result, the Gulf of Maine provides a steep environmental gradient, deterministic of the rate of species divergence, based on the biogeographic adaptability and genetic isolation of P. resedaeformis (Morrison pers. comm.) and Paramuricea spp. (Thoma et al., 2009). These processes are capable of promoting minor taxonomic transitions, defined as microevolutionary change (Levinton and Monahan, 1983), and can be further elucidated by using discrete sampling from multiple locations to study biogeographic differences in reproductive potential (Airi et al., 2016). Biogeographic variability in environmental processes in addition to regional differences in oocyte size and colony fecundities, may be a step along this microevolutionary gradient of which ecological speciation is derived (Schluter, 2001; West-Eberhard, 2005).
Biogeography is also an important driver of reproductive potential in the Gulf of Maine region as female and male colonies of P. placomus and P. resedaeformis exhibited variation in gametogenic development between sampling locations, except for those in close geographic proximity. This idea also holds true when comparing oocyte size and fecundities of P. resedaeformis colonies from the north of Labrador (Mercier and Hamel, 2011) and Gulf of Maine region (this study). Northern Labrador and the Gulf of Maine represent distinct biogeographic regions (Cook and Auster, 2007; Buhl-Mortensen et al., 2015), distinguished by physical environmental characteristics and species distributions (Cairns and Chapman, 2001; Watling and Auster, 2005). Maximum observed oocyte size from the Labrador population, between August 2005 and July 2006 collections, were ∼1000 μm and average fecundities were 84.3 ± 3.1 oocytes per polyp (<500 m) and 45.5 ± 1.7 oocytes per polyp (>650 m) (Mercier and Hamel, 2011). Within the Gulf of Maine populations, maximum observed oocyte size was ∼625 μm, from July 24 – August 4 of 2014 and June 12 – 17 of 2017, and the average fecundity was 13.5 ± 2.4 oocytes per polyp (<500 m). It must also be noted that oocyte size differences between these two locations may be an artifact of oocyte shrinkage during disparate sample processing between these two studies. To address this, standardizing protocol in future studies will be necessary when calculating oocyte size. Knowing these differences are significant rather than an artifact of sample processing is important since oocyte size can influence the likelihood of fertilization success (Levitan, 1993) including broadcast spawning species (Levitan, 2006) such as P. resedaeformis. However, these are still profound differences in fecundity, and as a result, it is reasonable to hypothesize that the northern Labrador region provides a more optimal habitat than the Gulf of Maine, suggesting an important relationship between geographical differences in reproductive variability resultant of environmental differences among geographic regions (Waller et al., 2014). Conversely, this reduction in oocyte size and fecundity could be the result of colony overcrowding, interspecific competition beneficial for reducing competitive overgrowth, but detrimental to nutrient capture and growth (McFadden, 1986; Sebens, 1987).
Oocyte size and height distributions between sampling locations of P. placomus and P. resedaeformis colonies, show a snapshot of oogenesis, as well as colony height differences, suggesting reproductive variation between local coral populations. Of the sites in the greater Gulf of Maine region surveyed, the Outer Schoodic Ridge shows the highest capacity for reproductive potential based on average colony sizes, PRFs, and ERFs of both species. Colonies of P. placomus, based on population size distributions, from Outer Schoodic Ridge, showed an average PRF ∼2.1 × greater than colonies from Western Jordan Basin, and based on average colony size the Central Jordan Basin population was essentially non-reproductive. Similarly, colonies of P. resedaeformis, based on calculated age distributions, from Outer Schoodic Ridge, exhibited an average PRF ∼2.3 × greater than colonies from Western Jordan Basin. The Outer Schoodic Ridge population also shows proportionally more vitellogenic to previtellogenic oocytes, in addition to significantly larger oocytes and colony sizes than other sampled and surveyed locations. This is important to consider when evaluating regional differences in reproductive potential as variations in oocyte size can influence larval competency times based on nutrient reserves (Ben-David-Zaslow and Benayahu, 1998; Pechenik, 1999; Cordes et al., 2001; Hwang and Song, 2007) and larger colonies can contribute disproportionally more reproductive material to the population (Babcock, 1984; Beiring and Lasker, 2000). Reproductive and colony size variability between sample locations also highlights the likeliness of extrinsic environmental influences driving population differentiation (Sebens, 1987). Importance of temporal replication to identify seasonal peaks in reproductive effort (Waller et al., 2014) to help establish potential correlations with environmental constraints, such as temperature, nutrient fluctuations (Sebens, 1984; Tyler and Gage, 1984) and tidal current velocities (Sebens, 1984), driving nutrient advection, particle capture rates (McFadden, 1986), and larval dispersal, are important next steps in understanding more holistically the reproductive ecology and demographic linkage of these coral populations (Sale et al., 2005; Jones et al., 2009).
This study provides a means and demonstration of quantifying geographic variability in individual and population scale reproductive potentials, of two deep-sea coral species local to the Gulf of Maine region. Based on relationships between reproduction and colony morphometrics it is possible to quantify differences in reproductive effort, specific to local populations, based on colony size. These models are important for developing and informing continued deep-sea survey work, as height measurements are more efficient, and account for morphological complexities, thus increasing the effectiveness, and scale of future data collection. The methodology in this investigation is also ideal for minimizing excessive sample collection in these ecologically fragile habitats, while making use of video imagery as a non-destructive sampling tool for assessing spatial variation within sample locations. These reproductive models can also be used during future survey work to identify other potential key source populations, such as the Outer Schoodic Ridge and Western Jordan Basin. Key source populations are an essential component to sustaining local populations (Sun et al., 2010b) and contribute larger portions of gametes to the reproductive pool thus increasing recruitment potential, dispersal capabilities, and connectivity among coral populations (Morrison et al., 2015).
Coral populations, within the Gulf of Maine, have been subjected to the compounding effects of fisheries impacts, historic and present, and the inevitability of environmental change. This synergy of multiple stressors amplifies the vulnerability of these coral habitats on individual, population, and evolutionary timescales. To protect and/or mitigate future impact, dynamic conservation strategies, focused on ecosystem based management, are required. At the foundation of this understanding sits reproduction, quintessential to a species ability to adapt and respond to change. Nevertheless, future studies addressing the relationships between colony morphometrics and growth are an essential component for further evaluating the reproductive potential of these coral species. These studies will provide a means of quantifying reproductive potential changes over time, thus increasing the ability to assess the rate of habitat recovery. Additional survey work quantifying population densities, describing habitat differences, and investigating the coupled effects of reproductive seasonality and environmental heterogeneity, are important next steps for further understanding the geographic variability in reproductive ecology. Synthesis between spatial, temporal, and environmental processes will be necessary in future studies when investigating the reproductive ecology of deep-sea corals.
Data Availability
Raw data produced by this study will be made available by the authors upon request.
Author Contributions
CF, RW, and PA contributed to writing and reviewing the manuscript. CF contributed to sample processing, data collection and analysis, and preparing manuscript figures. RW and PA contributed to project design and sample collection.
Funding
This work was funded by the National Oceanic and Atmospheric Administration’s Deep Sea Coral Research and Technology Program through NOAA Grant NA13NMF4720187 and NOAA Contract EA-133F-14-SE-3060 all to the University of Connecticut and NOAA Grant NA14OAR4320158 through the Cooperative Institute for North Atlantic Region to the University of Maine. Additional funding for the 2017 mission was provided by NOAA/NMFS Northeast Fisheries Science Center, a grant from the NSECR Ship Time Allocation Committee #RGPST/501171/2017, Department of Fisheries and Oceans Canada and NOAA Office of Ocean Exploration and Research.
Conflict of Interest Statement
The authors declare that the research was conducted in the absence of any commercial or financial relationships that could be construed as a potential conflict of interest.
Acknowledgments
A special thank you to: Ashley Rossin, Julia Johnstone, Elise Hartill, Lauren Rice, Isabelle Landers Holt, Gus Pendleton, Genny Wilson, Diego Gamero Huayhua, and Keri Feehan for helping to refine histologic protocol; and Dr. Robert Boenish for help with modeling work in addition to Dr. Robert Steneck, for his critical evaluation of the subject matter and comments on multiple iterations of the manuscript. We would also like to thank our scientific collaborators, at NOAA, NMFS, and USGS: Dr. Martha Nizinski, Dave Packer, Victoria Kentner, and Dr. Cheryl Morrison, for sample collection and geographic visualization. We thank the crews of the R/V Connecticut and NOAA ship Henry B. Bigelow as well as the Kraken II, and ROPOS underwater vehicles for exceptional support in the field, and support from the Canadian Scientific Submersible Facility is gratefully acknowledged.
References
Abramoff, M. D., Magalhães, P. J., and Ram, S. J. (2004). Image processing with imageJ. Biophoton. Int. 11, 36–42.
Airi, V., Gizzi, F., Falini, G., Levy, O., Dubinsky, Z., and Goffredo, S. (2014). Reproductive efficiency of a mediterranean endemic zooxanthellate coral decreases with increasing temperature along a wide latitudinal gradient. PLoS One 9:e91792. doi: 10.1371/journal.pone.0091792
Airi, V., Gizzi, F., Marchini, C., and Goffredo, S. (2016). “Sexual reproduction of Mediterranean scleractinian corals,” in The Cnidaria, Past, Present and Future, eds S. Goffredo and Z. Dubinsky (Switzerland: Springer International Publishing), 279–289.
Alino, P. M., and Coll, J. C. (1989). Observations of the synchonized mass spawning and postsettlement activity of octocorals on the great barrier reef, Australia: biological aspects. Bull. Mar. Sci. 45, 697–707.
Andrews, A. H., Cordes, E. E., Mahoney, M. M., Munk, K., Coale, K. H., Cailliet, G. M., et al. (2002). Age, growth and radiometric age validation of a deep-sea, habitat-forming gorgonian (Primnoa resedaeformis) from the gulf of alaska. Hydrobiologia 471, 101–110. doi: 10.1023/A:1016501320206
Auster, P. J. (2005). “Are deep-water corals important habitats for fishes?,” in Cold-Water Corals and Ecosystems, eds A. Freiwald and J. M. Roberts (Berlin: Springer-Verlag).
Auster, P. J., Kilgour, M., Packer, D., Waller, R., Auscavitch, S., and Watling, L. (2013). Octocoral gardens in the gulf of maine (NW Atlantic). Biodiversity 14, 193–194. doi: 10.1080/14888386.2013.850446
Auster, P. J., Packer, D., Waller, R., Auscavitch, S., Kilgour, M. J., Watling, L., et al. (2014). Imaging Surveys of Select Areas in the Northern Gulf of Maine for Deep-Sea Corals and Sponges During 2013-2014. Rep New England Fishery Management Council. Silver Spring: National Oceanic and Atmospheric Administration.
Babcock, R. (1984). Reproduction and distribution of two species of Goniastrea (Scleractinia) from the great barrier reef province. Coral Reefs 2, 187–195.
Baillon, S., Hamel, J., and Mercier, A. (2015). Protracted oogenesis and annual reproductive periodicity in the deep-sea pennatulacean Halipteris finmarchica (Anthozoa, Octocorallia). Mar. Ecol. 36, 1364–1378. doi: 10.1111/maec.12236
Bak, R. P., and Meesters, E. H. (1998). Coral population structure: the hidden information of colony size-frequency distributions. Mar. Ecol. Prog. Ser. 162, 301–306. doi: 10.3354/meps162301
Beiring, E. A., and Lasker, H. R. (2000). Egg production by colonies of a gorgonian coral. Mar. Ecol. Prog. Ser. 196, 169–177. doi: 10.3354/meps196169
Benayahu, Y., and Loya, Y. (1983). Surface brooding in the red sea soft coral Parerythropodium fulvum fulvum (Forskål, 1775). Biol. Bull. 165, 353–369. doi: 10.2307/1541201
Benayahu, Y., and Loya, Y. (1986). Sexual reproduction of a soft coral: synchronous and brief annual spawning of Sarcophyton glaucum (Quoy and Gaimard, 1833). Biol. Bull. 170, 32–42. doi: 10.2307/1541378
Ben-David-Zaslow, R., and Benayahu, Y. (1998). Competence and longevity in planulae of several species of soft corals. Mar. Ecol. Pro. Ser. 163, 235–243. doi: 10.3354/meps163235
Brazeau, D. A., and Lasker, H. R. (1988). Inter- and intraspecific variation in gorgonian colony morphology: quantifying branching patterns in arborescent animals. Coral Reefs 7, 139–143. doi: 10.1007/BF00300973
Buhl-Mortensen, L., Olafsdottir, S. H., Buhl-Mortensen, P., Burgos, J. M., and Ragnarsson, S. A. (2015). Distribution of nine cold-water coral species (Scleractinia and Gorgonacea) in the cold temperate North Atlantic: effects of bathymetry and hydrography. Hydrobiologia 759, 39–61. doi: 10.1007/s10750-014-2116-x
Bullimore, R. D., Foster, N. L., and Howell, K. L. (2013). Coral-characterized benthic assemblages of the deep Northeast Atlantic: defining “coral gardens” to support future habitat mapping efforts. ICES J. Mar. Sci. 70, 511–522. doi: 10.1093/icesjms/fss195
Cairns, S. D., and Chapman, R. E. (2001). “Biogeographic affinities of the North Atlantic deep-water scleractinia,” in Proceedings of the First International Symposium on Deep-Sea Corals, Ecology Action Center and Nova Scotia Museum, eds J. H. Martin Willison, et al., Halifax, 30–57.
Chornesky, E. A., and Peters, E. C. (1987). Sexual reproduction and colony growth in the scleractinian coral Porites astreoides. Biol. Bull. 172, 161–177. doi: 10.2307/1541790
Connell, J. H. (1978). Diversity in tropical rain forests and coral reefs. Science 199, 1303–1310. doi: 10.1126/science.199.4335.1302
Cook, R. R., and Auster, P. J. (2007). A Bioregional Classification of the Continental Shelf of Northeastern North America for Conservation Analysis and Planning Based on Representation. Marine Sanctuaries Conservation Series NMSP-07-03. Silver Spring, MD: U.S. Department of Commerce, National Oceanic and Atmospheric Administration, National Marine Sanctuary Program, 14.
Cooper, R. A., Valentine, P., Uzmann, J. R., and Slater, R. A. (1987). “Submarine canyons,” in Georges Bank, ed. R. H. Backus (Cambridge: MIT Press), 52–63.
Cordes, E. E., Nybakken, J. W., and VanDykhuizen, G. (2001). Reproduction and growth of Anthomastus ritteri (Octocorallia: Alcyonacea) from Monterey Bay, California, USA. Mar. Biol. 138, 491–501. doi: 10.1007/s002270000470
DeLeo, D. M., Ruiz-Ramos, D. V., Baums, I. B., and Cordes, E. E. (2016). Response of deep-water corals to oil and chemical dispersant exposure. Deep Sea Res. Part II 129, 137–147. doi: 10.1016/j.dsr2.2015.02.028
Edwards, D. C. B., and Moore, C. G. (2009). Reproduction in the sea pen Funiculina quadrangularis (Anthozoa: Pennatulacea) from the west coast of scotland. Estuar. Coast. Shelf Sci. 82, 161–168. doi: 10.1016/j.ecss.2009.01.006
Etnoyer, P., and Morgan, L. E. (2005). “Habitat-forming deep-sea corals in the Northeast Pacific Ocean,” in Cold-Water Corals and Ecosystems, eds A. Freiwald and J. M. Roberts (Berlin: Springer-Verlag).
Etnoyer, P. J., Wickes, L. N., Silva, M., Dubick, J. D., Balthis, L., Salgado, E., et al. (2016). Decline in condition of gorgonian octocorals on mesophotic reefs in the northern Gulf of Mexico: before and after the deepwater horizon oil spill. Coral Reefs 35, 77–90. doi: 10.1007/s00338-015-1363-2
Fadlallah, Y. H. (1983). Sexual reproduction, development and larval biology in scleractinian corals. Coral Reefs 2, 129–150. doi: 10.1007/BF00336720
Feehan, K. A., and Waller, R. G. (2015). Notes on reproduction of eight species of eastern pacific cold-water octocorals. J. Mar. Biol. Assoc. U.K. 95, 691–696. doi: 10.1017/S0025315415000053
Fisher, C. R., Hsing, P. Y., Kaiser, C. L., Yoerger, D. R., Roberts, H. H., Shedd, W. W., et al. (2014). Footprint of Deepwater Horizon blowout impact to deep-water coral communities. Proc. Natl. Acad. Sci. U.S.A. 111, 11744–11749. doi: 10.1073/pnas.1403492111
Goodbody-Gringley, G., and de Putron, S. J. (2016). “Brooding corals: planulation patterns, larval behavior, and recruitment dynamics in the face of environmental change,” in The Cnidaria, Past, Present and Future, eds S. Goffredo and Z. Dubinsky (Switzerland: Springer International Publishing), 279–289.
Hall, V. R., and Hughes, T. P. (1996). Reproductive strategies of modular organisms: comparative studies of reef-building corals. Ecology 77, 950–963. doi: 10.2307/2265514
Heino, M., and Kaitala, V. (1999). Evolution of resource allocation between growth and reproduction in animals with indeterminate growth. J. Evol. Biol. 12, 423–429. doi: 10.1046/j.1420-9101.1999.00044.x
Hennige, S. J., Wicks, L. C., Kamenos, N. A., Perna, G., Findlay, H. S., and Roberts, J. M. (2015). Hidden impacts of ocean acidification to live and dead coral framework. Proc. R. Soc. B 282:20150990. doi: 10.1098/rspb.2015.0990
Hofmann, G. E., Barry, J. P., Edmunds, P. J., Gates, R. D., Hutchins, D. A., Klingler, T., et al. (2010). The effect of ocean acidification on calcifying organisms in marine ecosystems: an organism-to-ecosystem perspective. Annu. Rev. Ecol. Evol. Syst. 41, 127–147. doi: 10.1146/annurev.ecolsys.110308.120227
Hoogenboom, M. O., Connolly, S. R., and Anthony, K. R. N. (2008). Interactions between morphological and physiological plasticity optimize energy acquisition in corals. Ecology 89, 1144–1154. doi: 10.1890/07-1272.1
Hwang, S., and Song, J. (2007). Reproductive biology and larval development of the temperate soft coral Dendronephthya gigantean (Alcyonacea: Nephtheidae). Mar. Biol. 152, 273–284. doi: 10.1007/s00227-007-0679-z
ICES (2007). Report of the Working Group on Deep-Water Ecology (WGDEC), 26-28 February 2007, ICES CM 2007/ACE:01 Ref. LRC. Toronto: ICES.
Jackson, J. B. C., Buss, L. W., and Cook, R. E. (1985). Population Biology and Evolution of Clonal Organisms. New Haven: Yale University Press.
Jones, C. G., Lawton, J. H., and Shachak, M. (1994). Organisms as ecosystem engineers. OIKOS 69, 373–386. doi: 10.2307/3545850
Jones, G. P., Almany, G. R., Russ, G. R., Sale, P. F., Steneck, R. S., van Oppen, M. J. H., et al. (2009). Larval retention and connectivity among population of corals and reef fish: history, advances and challenges. Coral Reefs 28, 307–325. doi: 10.1007/s00338-009-0469-9
Kahng, S. E., Benayahu, Y., and Lasker, H. R. (2011). Sexual reproduction in octocorals. Mar. Ecol. Prog. Ser. 443, 265–283. doi: 10.3354/meps09414
Kersting, D. K., Casado, C., López-Legentil, S., and Linares, C. (2013). Unexpected patterns in the sexual reproduction of the Mediterranean scleractinian coral Cladocora caespitosa. Mar. Ecol. Prog. Ser. 486, 165–171. doi: 10.3354/meps10356
Koslow, J. A., Boehlert, G. W., Gordon, J. D. M., Haedrich, R. L., Lorance, P., and Parin, N. (2000). Continental slope and deep-sea fisheries: implications for a fragile ecosystem. ICES J. Mar. Sci. 57, 548–557. doi: 10.1006/jmsc.2000.0722
Lacharité, L., and Metaxas, A. (2013). Early life history of deep-water gorgonian corals may limit their abundance. PLoS One 8:e65394. doi: 10.1371/journal.pone.0065394
Lasker, H. R., Brazeau, D. A., Calderon, J., Coffroth, M. A., Coma, R., and Kim, K. (1996). In situ rates of fertilization among broadcast spawning gorgonian corals. Biol. Bull. 190, 45–55. doi: 10.2307/1542674
Levinton, S. J. (1983). The latitudinal compensation hypothesis: growth data and a model of latitudinal growth differentiation based upon energy budgets. I. Interspecific comparison of Ophryotrocha (Polychaeta: Dorvilleidae). Biol. Bull. 165, 686–698. doi: 10.2307/1541471
Levinton, S. J., and Monahan, R. K. (1983). The latitudinal compensation hypothesis: growth data and a model of latitudinal growth differentiation based upon energy budgets. II. Interspecific comparisons between subspecies of Ophryotrocha puerilis (Polychaeta: Dorvilleidae). Biol. Bull. 165, 699–707. doi: 10.2307/1541472
Levitan, D. R. (1993). The importance of sperm limitation to the evolution of egg size in marine invertebrates. Am. Nat. 141, 517–536. doi: 10.1086/285489
Levitan, D. R. (2006). The relationship between egg size and fertilization success in broadcast-spawning marine invertebrates. Integr. Comp. Biol. 46, 298–311. doi: 10.1093/icb/icj025
Linares, C., Coma, R., and Zabala, M. (2008). Effects of a mass mortality event on gorgonian reproduction. Coral Reefs 27, 27–43. doi: 10.1007/s00338-007-0285-z
Lumsden, S. E., Hourigan, T. F., Bruckner, A. W., and Dorr, G. (eds) (2007). The State of Deep Coral Ecosystems of the United States. Silver Spring MD: NOAA Technical Memorandum CRCP-3.
Lunden, J. J., McNicholl, C. G., Sears, C. R., Morrison, C. L., and Cordes, E. E. (2014). Acute survivorship of the deep-sea coral Lophelia pertusa from the Gulf of Mexico under acidification, warming, and deoxygenation. Front. Mar. Sci. 1:78. doi: 10.3389/fmars.2014.00078
Maier, C., Watremez, P., Taviani, M., Weinbauer, M. G., and Gattuso, J. P. (2012). Calcification rates and the effect of ocean acidification on Mediterranean cold-water corals. Proc. R. Soc. B 279, 1716–1723. doi: 10.1098/rspb.2011.176
McFadden, C. S. (1986). Colony fission increases particle capture rates of a soft coral: advantages of being a small colony. J. Exp. Mar. Biol. Ecol. 103, 1–20. doi: 10.1016/0022-0981(86)90129-2
McGuire, M. P. (1998). Timing of larval release by Porites astreoides in the northern florida keys. Coral Reefs 17, 369–375. doi: 10.1007/s003380050141
Mercier, A., and Hamel, J. F. (2011). Contrasting reproductive strategies in three deep-sea octocorals from eastern Canada: Primnoa resedaeformis, Keratoisis ornata, and Anthomastus grandiflorus. Coral Reefs 30, 337–350. doi: 10.1007/s00338-011-0724-8
Metaxas, A., and Davis, J. (2005). Megafauna associated with assemblages of deep-water gorgonian corals in Northeast channel, off Nova Scotia. Can. J. Mar. Biol. Assoc. U.K. 85, 1381–1390. doi: 10.1017/S0025315405012567
Mistri, M. (1995). Gross morphometric relationships and growth in the Mediterranean gorgonian Paramuricea clavata. Boll. Zool. 62, 5–8. doi: 10.1080/11250009509356043
Morrison, C. L., Baco, A. R., Nizinski, M. S., Coykendall, D. K., Demopoulos, A. W. J., Cho, W., et al. (2015). “Population connectivity of dee-sea corals,” in The State of Deep-Sea Coral and Sponge Ecosystems of the United States: 2015, eds T. F. Hourigan, P. J. Etnoyer, and S. D. Cairns (Silver Spring: NOAA Technical Memorandum X. NOAA).
Mortensen, P. B., and Buhl-Mortensen, L. (2005). Morphology and growth of the deep-water gorgonians Primnoa resedaeformis and Paragorgia arborea. Mar. Biol. 147, 775–788. doi: 10.1007/s00227-005-1604-y
Mortensen, P. B., Buhl-Mortensen, L., Gordon, D. C. Jr., Fader, G. B. J., McKeown, D. L., and Fenton, D. G. (2005). “Effects of fisheries on deepwater gorgonian corals in the Northeast Channel, Nova Scotia,” in 2005. American Fisheries Society Symposium, eds P. W. Barnes and J. P. Thomas 369–382.
Murillo, F. J., Muñoz, P. D., Altuna, A., and Serrano, A. (2011). Distribution of deep-water corals of the flemish cap, flemish pass, and the grand banks of newfoundland (Northwest Atlantic Ocean): interaction with fishing activities. ICES J. Mar. Sci. 68, 319–332. doi: 10.1093/icesjms/fsq071
Orejas, C., Gili, J. M., López-González, P. J., Hasemann, C., and Arntz, W. E. (2007). Reproduction patterns of four Antarctic octocorals in the Weddell Sea: an inter-specific, shape, and latitudinal comparison. Mar. Biol. 150, 551–563. doi: 10.1007/s00227-006-0370-9
Orejas, C., López-González, P. J., Gili, J. M., Teixidó, N., Gutt, J., and Arntz, W. E. (2002). Distribution and reproductive ecology of the Antarctic octocoral Ainigmaptilon antarcticum in the Weddell Sea. Mar. Ecol. Prog. Ser. 231, 101–114. doi: 10.3354/meps231101
Pechenik, J. A. (1999). On the advantages and disadvantages of larval stages in benthic marine invertebrate life cycles. Mar. Ecol. Prog. Ser. 177, 269–297. doi: 10.3354/meps177269
Pershing, A. J., Alexander, M. A., Hernandez, C. M., Kerr, L. A., Le Bris, A., Mills, K. E., et al. (2015). Slow adaptation in the face of rapid warming leads to collapse of the gulf of maine cod fishery. Science 350, 809–812. doi: 10.1126/science.aac9819
R Core Team (2017). R: A Language and Environment for Statistical Computing. Vienna: R Foundation for Statistical Computing.
Ramirez-Llodra, E., Tyler, P. A., Baker, M. C., Bergstad, O. A., Clark, M. C., Escobar, E., et al. (2011). Man and the last great wilderness: human impact on the deep sea. PLoS One 6:e22588. doi: 10.1371/journal.pone.0022588
Ribes, M., Coma, R., Rossi, S., and Micheli, M. (2007). Cycle of gonadal development in Eunucella singularis (Cnidaria: Octocorallia): trends in sexual reproduction in gorgonians. Invert. Biol. 126, 307–317. doi: 10.1111/j.1744-7410.2007.00101.x
Risk, M. J., Heikoop, J. M., Snow, M. G., and Beukens, R. (2002). Lifespans and growth patterns of two deep-sea corals: Primnoa resedaeformis and Desmophyllum cristagalli. Hydrobiologia 471, 125–131. doi: 10.1023/A:1016557405185
Roark, E. B., Guilderson, T. P., Dunbar, R. B., Fallon, S. J., and Mucciarone, D. A. (2009). Extreme longevity in proteinaceous deep-sea corals. Proc. Natl. Acad. Sci. U.S.A. 106, 5204–5208. doi: 10.1073/pnas.0810875106
Roberts, J. M., Wheeler, A. J., and Freiwald, A. (2006). Reefs of the deep: the biology and geology of cold-water coral ecosystems. Science 312, 543–547. doi: 10.1126/science.1119861
Roberts, J. M., Wheeler, A. J., Freiwald, A., and Cairns, S. D. (2009). Cold-Water Corals. Cambridge: Cambridge University Press. doi: 10.1017/CBO9780511581588
Roberts, S., and Hirshfield, M. (2004). Deep-sea corals: out of sight, but no longer out of mind. Front. Ecol. Environ. 2, 123–130. doi: 10.1890/1540-92952004002
Rowley, S. J., Pochon, X., and Watling, L. (2015). Environmental influences on the Indo-Pacific octocoral Isis hippuris Linnaeus 1758 (Alcyonacea: Isididae): genetic fixation or phenotypic plasticity? PeerJ. 3:e1128. doi: 10.7717/peerj.1128
Sale, P. F., Cowen, R. K., Danilowicz, B. S., Jones, G. P., Kritzer, J. P., Lindeman, K. C., et al. (2005). Critical science gaps impede use of no-take fishery reserves. Trends Ecol. Evol. 20, 74–80. doi: 10.1016/j.tree.2004.11.007
Schluter, D. (2001). Ecology and the origin of species. Trends Ecol. Evol. 16, 372–380. doi: 10.1016/S0169-5347(01)02198-X
Sebens, K. P. (1984). Water flow and coral colony size: interhabitat comparisons of the octocoral Alcyonium siderium. Proc. Natl. Acad. Sci. U.S.A. 81, 5473–5477. doi: 10.1073/pnas.81.17.5473
Sebens, K. P. (1987). The ecology of indeterminate growth in animals. Annu. Rev. Ecol. Syst. 18, 371–407. doi: 10.1146/annurev.es.18.110187.002103
Shaish, L., Abelson, A., and Rinkevich, B. (2007). How plastic can phenotypic plasticity be? The branching coral Stylophora pistillata as a model system. PLoS One 2:e644. doi: 10.1371/journal.pone.0000644
Sherwood, O. A., and Edinger, E. N. (2009). Ages and growth rates of some deep-sea gorgonian and antipatharian corals of Newfoundland and Labrador. Can. J. Fish Aquat. Sci. 66, 142–152. doi: 10.1139/F08-195
Sherwood, O. A., Heikoop, J. M., Scott, D. B., Risk, M. J., Guilderson, T. P., and McKinney, R. A. (2005). Stable isotopic composition of deep-sea gorgonian corals Primnoa spp.: a new archive of surface processes. Mar. Ecol. Prog. Ser. 301, 135–148. doi: 10.3354/meps301135
Simpson, A. W., Eckelbarger, K. J., and Watling, L. (2005). “Some aspects of the reproductive biology of Paramuricea placomus (Octocorallia) from the Gulf of Maine. Integr. Comp. Biol. 45,” in Proceedings of the Third International Symposium on Deep-sea Coral, Miami.
Soetaert, K., Mohn, C., Rengstorf, A., Grehan, A., and van Oevelen, D. (2016). Ecosystem engineering creates a direct nutritional link between 600-m deep cold-water coral mounds and surface productivity. Sci. Rep. 6:35057. doi: 10.1038/srep35057
Soong, K., and Lang, J. C. (1992). Reproductive integration in reef corals. Biol. Bull. 183, 418–431. doi: 10.2307/1542018
Stearns, S. C. (1989). The evolutionary significance of phenotypic plasticity. BioScience 39, 436–445. doi: 10.2307/1311135
Sun, Z., Hamel, J. F., Edinger, E., and Mercier, A. (2010a). Reproductive biology of the deep-sea octocoral Drifa glomerata in the Northwest Atlantic. Mar. Biol. 157, 863–873. doi: 10.1007/s00227-009-1369-9
Sun, Z., Hamel, J. F., and Mercier, A. (2010b). Planulation periodicity, settlement preferences and growth of two deep-sea octocorals from the northwest Atlantic. Mar. Ecol. Prog. Ser. 410, 71–87. doi: 10.3354/meps08637
Thiem,Ø, Ravagnan, E., Fosså, J. H., and Berntsen, J. (2006). Food supply mechanisms for cold-water corals along a continental shelf edge. J. Mar. Syst. 60, 207–219. doi: 10.1016/j.jmarsys.2005.12.004
Thoma, J. N., Pante, E., Brugler, M. R., and France, S. C. (2009). Deep-sea octocorals and antipatharians show no evidence of seamount-scale endemism in the NW Atlantic. Mar. Ecol. Prog. Ser. 397, 25–35. doi: 10.3354/meps08318
Thomas, A. C., Pershing, A. J., Friedland, K. D., Nye, J. A., Mills, K. E., Alexander, M. A., et al. (2017). Seasonal trends and phenology shifts in sea surface temperature on the North American northeastern continental shelf. Elem. Sci. Anth. 5:48. doi: 10.1525/elementa.240
Thomas, A. C., Townsend, D. W., and Weatherbee, R. (2003). Satellite-measured phytoplankton variability in the Gulf of Maine. Cont. Shelf Res. 23, 971–989. doi: 10.1016/S0278-4343(03)00086-4
Tong, R., Purser, A., Unnithan, V., and Guinan, J. (2012). Multivariate statistical analysis of distribution of deep-water gorgonian corals in relation to seabed topography on the Norwegian margin. PloS One 7:e43534. doi: 10.1371/journal.pone.0043534
Townsend, D. W., Pettigrew, N. R., Thomas, M. A., Neary, M. G., McGillicuddy, D. J. Jr., Dennis, J., et al. (2015). Water masses and nutrient sources to the Gulf of Maine. J. Mar. Res. 73, 93–122. doi: 10.1357/002224015815848811
Tyler, P. A., and Gage, J. D. (1984). Seasonal reproduction of Echinus affinis (Echinodermata: Echinoidea) in the Rockall Trough, northeast Atlantic Ocean. Deep Sea Res. 31, 387–402. doi: 10.1016/0198-0149(84)90091-8
Tyler, P. A., Grant, A., Pain, S. L., and Gage, J. D. (1982). Is annual reproduction in deep-sea echinoderms a response to variability in their environment? Nature 300, 747–750. doi: 10.1038/300747a0
Wagner, H., Purser, A., Thomsen, L., Jesus, C. C., and Lundälv, T. (2011). Particulate organic matter fluxes and hydrodynamics at the tisler cold-water coral reef. J. Mar. Syst. 85, 19–29. doi: 10.1016/j.jmarsys.2010.11.003
Wahle, C. M. (1983). Regeneration of injuries among Jamaican gorgonians: the roles of colony physiology and environment. Biol. Bull. 165, 778–790. doi: 10.2307/1541478
Waller, R. G., and Baco, A. R. (2007). Reproductive morphology of three species of deep-water precious corals from the Hawaiian archipelago: Gerardia sp., Corallium secundum, and Corallium lauuense. Bull. Mar. Sci. 81, 533–542.
Waller, R. G., Stone, R. P., Johnstone, J., and Mondragon, J. (2014). Sexual reproduction and seasonality of the alaskan red tree coral, Primnoa pacifica. PloS One 9:e90893. doi: 10.1371/journal.pone.0090893
Waller, R. G., and Tyler, P. A. (2005). The reproductive biology of two deep-water, reef-building scleractinians from the NE Atlantic Ocean. Coral Reefs 24, 514–522. doi: 10.1007/s00338-005-0501-7
Waller, R. G., Tyler, P. A., and Gage, J. D. (2002). Reproductive ecology of the deep-sea scleractinian coral Fungiacyathus marenzelleri (Vaughan, 1906) in the northeast Atlantic Ocean. Coral Reefs 21, 325–331.
Waller, R. G., Watling, L., Auster, P., and Shank, T. (2007). Anthropogenic impacts on the corner rise seamounts, north-west Atlantic Ocean. J. Mar. Biol. Assoc. U.K. 87, 1075–1076. doi: 10.1017/S0025315407057785
Watanabe, S., Metaxas, A., Sameoto, J., and Lawton, P. (2009). Patterns in abundance and size of two deep-water gorgonian octocorals, in relation to depth and substrate features off Nova Scotia. Deep Sea Res. Part I 56, 2235–2248. doi: 10.1016/j.dsr.2009.09.003
Watling, L., and Auster, P. J. (2005). “Distribution of deep-water alcyonacea off the northeast coast of the United States,” in Cold-Water Corals and Ecosystems. Erlangen Earth Conference Series, eds A. Freiwald and J. M. Roberts (Berlin: Springer-Verlag).
Watling, L., France, S. C., Pante, E., and Simpson, A. (2011). Biology of deep-water octocorals. Adv. Mar. Biol. 60, 41–122. doi: 10.1016/B978-0-12-385529-9.00002-0
West-Eberhard, M. J. (2005). Developmental plasticity and the origin of species differences. Proc. Natl. Acad. Sci. U.S.A. 102, 6543–6549. doi: 10.1073/pnas.0501844102
Keywords: Primnoa resedaeformis, Paramuricea placomus, reproductive ecology, age at maturation, image analysis, size distribution, remotely operated vehicle (ROV), video
Citation: Fountain CT, Waller RG and Auster PJ (2019) Individual and Population Level Variation in the Reproductive Potential of Deep-Sea Corals From Different Regions Within the Gulf of Maine. Front. Mar. Sci. 6:172. doi: 10.3389/fmars.2019.00172
Received: 22 August 2018; Accepted: 18 March 2019;
Published: 03 April 2019.
Edited by:
Elva G. Escobar-Briones, National Autonomous University of Mexico, MexicoReviewed by:
Covadonga Orejas, Instituto Español de Oceanografía, SpainAnn I. Larsson, University of Gothenburg, Sweden
Tina Molodtsova, P.P. Shirshov Institute of Oceanology (RAS), Russia
Copyright © 2019 Fountain, Waller and Auster. This is an open-access article distributed under the terms of the Creative Commons Attribution License (CC BY). The use, distribution or reproduction in other forums is permitted, provided the original author(s) and the copyright owner(s) are credited and that the original publication in this journal is cited, in accordance with accepted academic practice. No use, distribution or reproduction is permitted which does not comply with these terms.
*Correspondence: Christopher Tyler Fountain, Yy50eWxlci5mb3VudGFpbkBnbWFpbC5jb20=