 Nadja S. Steiner1*
 William W. L. Cheung2
 Andres M. Cisneros-Montemayor2
 Helen Drost1,3
 Hakase Hayashida4,5Carie Hoover6,7Jen Lam8Tessa Sou1
 U. Rashid Sumaila2Paul Suprenand9
 Travis C. Tai2
 David L. VanderZwaag10
- 1Institute of Ocean Sciences, Fisheries and Oceans Canada, Sidney, BC, Canada
- 2Institute for the Oceans and Fisheries, University of British Columbia, Vancouver, BC, Canada
- 3Sheluqun Environmental, Saltspring, BC, Canada
- 4School of Earth and Ocean Sciences, University of Victoria, Victoria, BC, Canada
- 5Institute for Marine and Antarctic Studies, University of Tasmania, Hobart, TAS, Australia
- 6Centre for Earth Observation Science, University of Manitoba, Winnipeg, MB, Canada
- 7Freshwater Institute, Fisheries and Oceans Canada, Winnipeg, MB, Canada
- 8Joint Secretariat, Inuvialuit Settlement Region, Inuvik, NWT, Canada
- 9Mote Marine Laboratory, Sarasota, FL, United States
- 10Schulich School of Law, Dalhousie University, Halifax, NS, Canada
This study synthesizes results from observations, laboratory experiments and models to showcase how the integration of scientific methods and indigenous knowledge can improve our understanding of (a) past and projected changes in environmental conditions and marine species; (b) their effects on social and ecological systems in the respective communities; and (c) support management and planning tools for climate change adaptation and mitigation. The study links climate-ecosystem-economic (CEE) models and discusses uncertainties within those tools. The example focuses on the key forage species in the Inuvialuit Settlement Region (Western Canadian Arctic), i.e., Arctic cod (Boreogadus saida). Arctic cod can be trophically linked to sea-ice algae and pelagic primary producers and are key vectors for energy transfers from plankton to higher trophic levels (e.g., ringed seals, beluga), which are harvested by Inuit peoples. Fundamental changes in ice and ocean conditions in the region affect the marine ecosystem and fish habitat. Model simulations suggest increasing trends in oceanic phytoplankton and sea-ice algae with high interannual variability. The latter might be linked to interannual variations in Arctic cod abundance and mask trends in observations. CEE simulations incorporating physiological temperature limits data for the distribution of Arctic cod, result in an estimated 17% decrease in Arctic cod populations by the end of the century (high emission scenario), but suggest increases in abundance for other Arctic and sub-Arctic species. The Arctic cod decrease is largely caused by increased temperatures and constraints in northward migration, and could directly impact key subsistence species. Responses to acidification are still highly uncertain, but sensitivity simulations suggests an additional 1% decrease in Arctic cod populations due to pH impacts on growth and survival. Uncertainties remain with respect to detailed future changes, but general results are likely correct and in line with results from other approaches. To reduce uncertainties, higher resolution models with improved parameterizations and better understanding of the species' physiological limits are required. Arctic communities should be directly involved, receive tools and training to conduct local, unified research and food chain monitoring while decisions regarding commercial fisheries will need to be precautionary and adaptive in light of the existing uncertainties.
1. Introduction
The Inuvialuit peoples maintain the link to their traditional way of life through their harvesting practices. Hunting, fishing and trapping are both subsistence and economic activities. The foods harvested from the land and ocean are an integral dimension of their diet and the harvest byproducts support thriving economies based on arts and cultural activities. Hence, potential changes to subsistence harvest species are highly relevant to them.
The Arctic Monitoring and Assessment Program (AMAP) report on Adaptation Actions in a Changing Arctic (AACA) in the Bering, Chukchi and Beaufort Sea (AMAP, 2017) states that, based on scientific observations and Indigenous knowledge (IK), the region is moving toward conditions never witnessed before. Environmental drivers related to seasonal loss of sea ice and water temperature have led to changes in the distribution of ice-dependent or ice-associated marine mammals and birds and initiated changes in migratory pathways and phenologies of mammals and fish, causing changes in species composition and season of harvests. Some coastal communities are impacted as availabilities of subsistence species are changing or have changed or moved beyond the geographic reach of harvesters (Loseto et al., 2018). Access complications are also linked to changes in weather, storms and sea state (e.g., Steiner et al., 2015a) which have made the sea rougher, less predictable and more dangerous for small boat travel. AMAP (2017) lists human health issues, such as obesity, diabetes and heart disease, which have already impacted coastal communities due to loss of the subsistence life style (see also Inuit health survey, e.g., Galloway et al., 2010; Egeland et al., 2011; Zhou et al., 2011; Saudny et al., 2012; Zienczuk and Egeland, 2012). AMAP (2017) suggests that restructuring of harvesting strategies in response to changes in the species composition and availability of the subsistence food resources might be inevitable (see also Ford, 2009; Ford and Pearce, 2010; Ford et al., 2014).
This study synthesizes previous (section 2) and new results (section 4) from observations, laboratory experiments and model tools to help understand how Arctic cod (Boreogadus saida), a key forage fish for subsistence species in Arctic communities, might be affected by climate change and ocean acidification. The example provided focuses on the Inuvialuit Settlement Region (ISR) in the Western Canadian Arctic and highlights how the combination of multiple tools based on Scientific Methods (SM) and Indigenous knowledge can improve our understanding of (a) past and projected changes in environmental conditions and marine species, (b) how these might affect specific social and ecological systems in the communities of a particular region, and (c) how to inform management and planning tools for adaptation and mitigation. The study includes an effort to directly link available climate-ecosystem-economic (CEE) models (e.g., Sumaila et al., 2019) and discusses uncertainties within those models.
2. Background
2.1. Study Area
The ISR was established in 1984 under the Inuvialuit Final Agreement by the Government of Canada and the Inuvialuit. The ISR includes the north slope of the Yukon and northern North West Territory, the inland delta communities Inuvik and Aklavik on the mainland, Tuktoyaktuk and Paulatuk along the mainland coast, Ulukhaktok on the northwestern coast of Victoria Island and Sachs Harbour on the western coast of Banks Island (Figure 1). The associated oceanic regions include the Beaufort Sea, composed of shallow shelves and the deep (up to 3,600 m) Canada Basin, and the western part of the Canadian Polar Shelf (CPS), which includes the Amundsen and Coronation Gulf. While sea ice shows significant reductions in the Beaufort Sea, the CPS in many areas acts as a repository or reservoir of thick ice. An overview of the oceanography of the region and recent and projected future environmental changes is provided in Steiner et al. (2015a). The active collaboration between the Inuvialuit and the Government of Canada includes a network planning process for marine protected areas (MPAs) which supported the recent establishment of the Anguniaqvia niqiqyuam, ANMPA, (est. 2016) in addition to the Tarium Niryutait, TNMPA, (est. 2010) (Figure 1, Loseto et al., 2018). The TNMPA is an important summer habitat for the Eastern Beaufort Sea beluga and a diverse range of fish species. Both MPAs have the conservation objective to maintain habitat and support populations of key species such as beluga whales, Arctic char, and ringed and bearded seals. The co-management structure of the ISR together with the ecological importance of the area which is exhibiting some of the largest changes in sea-ice and other environmental factors within the Arctic, makes this an ideal case study area.
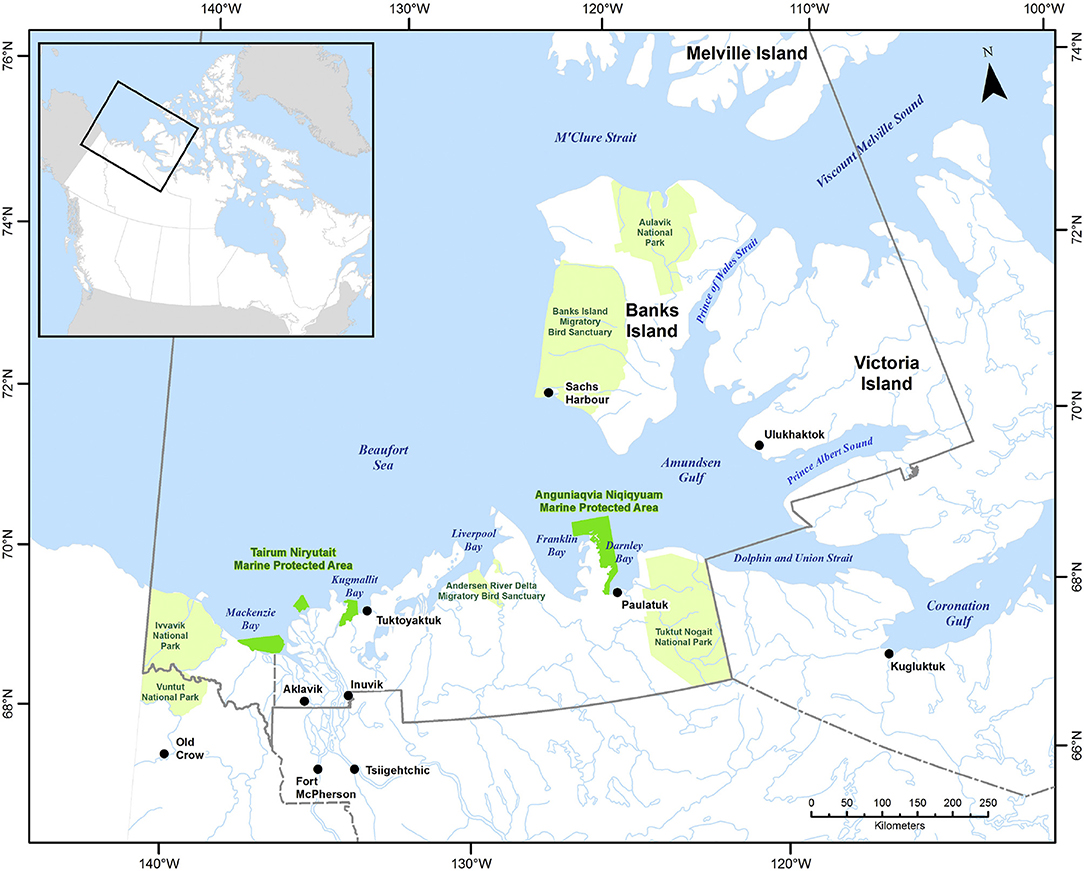
Figure 1. Geographic representation of the Western Canadian Arctic and the Inuvialuit Settlement Region (ISR). The Tarium Niryutait Marine Protected Area (TN MPA, made up of three separate parcels in the Mackenzie Estuary) and the Anguniaqvia Niqiqyuam Marine Protected Area (AN MPA, located in Darnley Bay are indicated in dark green, national parks and park reserves are shown in light green. The ISR boundary is shown in solid gray. Reproduced from Loseto et al. (2018) with permission from Elsevier.
2.2. Focus Species Arctic Cod (Boreogadus saida)
In order to bridge model projections of sea-ice and other environmental changes to the impacts on harvested subsistence species, particular emphasis was given to the key forage fish species Arctic cod. Arctic cod is considered an ecological key species, because of its high stock biomasses and its importance as a carbon source for seabirds, fish and marine mammals in high Arctic ecosystems (Bradstreet et al., 1986; Coad and Reist, 2004; Kohlbach et al., 2017), many of which are key subsistence species harvested by Inuvialuit communities and are included in the MPA conservation objectives. Studies in the Beaufort Sea have reported Arctic cod as the most abundant demersal species across a range of habitats (Rand and Logerwell, 2010; Majewski et al., 2013; Walkusz et al., 2013). A recent assessment of fish assemblages in the Beaufort Shelf and Slope (Beaufort Sea Marine Fishes Project) indicates that Arctic cod typifies each of the four species assemblages (near-shore shelf, off-shore shelf, upper slope, lower slope) to varying degrees. High abundance of Arctic cod (≈ 80%) at upper-slope stations was a major structuring feature of the fish community (Majewski et al., 2013, 2015, 2017). Under-sea ice habitats host unique food webs that Arctic cod can access due to their cold adaptation. Arctic cod survive in ice-covered, sub-zero waters due to the presence of anti-freeze glycoproteins, specialized kidney function (Osuga and Feeney, 1978; Christiansen et al., 1996) and the ability to digest food at -1.4°C water temperatures (Hop and Tonn, 1998). Arctic cod are generalist feeders and will eat what is available and digestible. Young Arctic cod (1–2 years) are often associated with the underside of sea ice where ice-associated (sympagic) amphipods and copepods (at all life stages) are key prey species (Bradstreet and Cross, 1982; Lønne and Gulliksen, 1989; David et al., 2015, 2016; Kohlbach et al., 2016, 2017). Under ice Arctic cod larvae mainly feed on copepod eggs and naupli (Walkusz et al., 2011) but 26% of their stomach contents can comprise of ice algal cells (Gilbert et al., 1992). Fatty acid profiles of Arctic cod further indicate that (ice algal) diatoms are the primary carbon source, indirectly obtained via amphipods and copepods (Kohlbach et al., 2017). This indicates a high importance of ice-algae produced carbon in early Arctic cod development, but also suggests a particular vulnerability to changes in the distribution and structure of sea-ice habitats. Arctic cod predation efficiently moves a large proportion of the energy and nutrients from Arctic algae and invertebrates to higher trophic levels (Bain and Sekerak, 1978; Welch et al., 1993; Crawford and Jorgenson, 1996; Christiansen et al., 2012; Hop and Gjøsæter, 2013). Due to the key role of Arctic cod, changes at the base of the sea ice-associated food web are likely to affect the higher trophic levels of high-Arctic ecosystems and hence the communities harvesting those species.
2.3. Aquatic Species Physiological Limits
A major gap in determining ecosystem risks and fisheries impacts of climate change (e.g., increased temperature, sea ice/habitat loss, noise, pollution) and ocean acidification is the limited information on physiological limits of key Arctic marine species to single and multiple stressors. As part of this project, we synthesized available literature into a database of Aquatic Species Physiological Limits (ASPL) for Arctic and sub-Arctic species indicating available information on species thresholds, lethal limits and acclimation potential for several stressors as well as sub-chronic thresholds that are termed “pejus” limits (tipping points when metabolic performance begins to decline). The ASPL database has been summarized in a technical report (Steiner et al., 2018) and entries for Arctic cod and capelin are shown in Table 1. The database includes data for cardio-respiratory performance of ectotherm species which is a powerful tool to quantify the impact of environmental stress upon animal health (Farrell et al., 2008; Anttila et al., 2013; Ferreira et al., 2014; Drost et al., 2016; Farrell, 2016). The impact of global warming on the physiology of ectotherm marine species (e.g., fish, copepods, bivalves) is of particular concern due to an ectotherms total reliance on habitat temperature to maintain body heat. Temperature drives metabolism and hence basic performance including development, growth, reproduction and survival (Brown et al., 2004). In addition the physiology and ecology of fish can also be impacted by other factors such as sea water pH (i.e., ocean acidification), e.g., acid excretion across gills is dependent upon water pH.
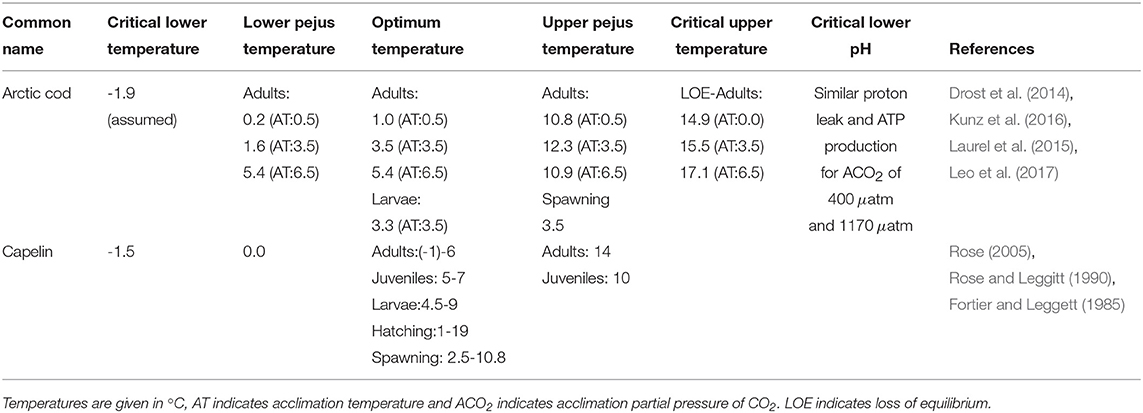
Table 1. Physiological limits extract from Aquatic Species Physiological Limits database (Steiner et al., 2018).
Only few laboratory-based thermal tolerance studies of Arctic cod exist and even fewer quantify the impact of multi-stressors (Kunz et al., 2016, 2018; Leo et al., 2017). Table 1 indicates the known physiological limits for Arctic cod and capelin, in comparison. Drost et al. (2016) showed that after 1 month acclimation at 6.5°C water temperature, Arctic cod can actually improve their cardio-respiratory performance, essentially increasing aerobic scope capacity in water warmer than expected. Clearly these fish have some capacity for thermal acclimation and a greater than expected thermal performance of larvae and adult Arctic cod, which suggests that temperature may not be the sole dictator of their biogeographic range. It appears that the under-ice ecosystem they are associated with serves as a critical component of their biographic distribution and survival.
2.4. Observed Changes in Forage and Subsistence Species
Empirical observations already indicate a northward retreat of Arctic cod from their southern-most distributions, e.g., waters off Disko Bay, Greenland, Iceland-East Greenland waters, the Barents Sea, Cooper Island, Bering Sea and in the ISR (Hansen et al., 2012; Farrell et al., 2013; Astthorsson, 2015; Divoky et al., 2015; Harwood et al., 2015, and pers. comm. Rubin, 2017). Analyzing body condition since the late 1980s in five marine vertebrate species, Harwood et al. (2015) identified ringed seal, beluga, black guillemot chicks, all consumers with a dietary preference for Arctic cod, experience declines in condition, growth and/or production. Over the same time period they found increasing body condition in bowhead whale (sub-adults) and (Arctic char), in both cases influenced by sea ice. Reductions of summer sea ice extent, including increased duration of open water, changes in upwelling potential (wind stress), and possibly higher primary production in the marine ecosystem favor herbivorous zooplankton that are targeted by bowheads (e.g., Lowry et al., 1978; Walkusz et al., 2012; Nelson et al., 2014). Northward spread of Pacific zooplankton into the Beaufort Sea has also been recognized (Nelson et al., 2009, 2014). Stomach contents indicate the diet of Arctic char includes a substantial number of Arctic cod in some years and is dominated by zooplankton in other years (Harwood, Drost, unpublished data). Harwood et al. (2015) state that the proximate causes of the observed changes in body condition remain unknown, but may reflect an upward trend in secondary productivity (zooplankton), and a concurrent downward trend in the availability of forage fishes, such as the preferred Arctic cod. Among other factors, the body condition of marine vertebrates is directly linked to the total annual availability and quality of their prey, with nutritional stress ultimately linked to health of individuals and populations (Moore and Gulland, 2014).
2.5. Foodweb Structure Around Arctic Cod
An analysis of past ecosystem and foodweb changes in the Beaufort Sea with the Ecopath with Ecosim (EwE) modeling tool (see section 3) has been performed by Suprenand et al. (2018), indicating already occurring food-web shifts and tipping points relevant to Arctic cod and higher trophic level species.
The EwE results suggest increases in biomass for both the Arctic cod and capelin model groups (Suprenand et al., 2018). These increases in model biomass are primarily driven by increases in primary production caused by warmer temperatures and longer open water seasons, which increase the trophic pathways for species favoring warmer water. Arctic cods' biomass is positively influenced by small primary producers (<5 μm in the model), microzooplankton, and some mesozooplankton functional groups as Arctic cod consume these functional groups. According to the model's historic reconstruction from 1970 to 2014, ringed seals (whose diet is 12% Arctic cod) are becoming increasingly reliant on Arctic cod as prey, which constitute a large percentage of their overall diets. In addition, polar bears, who consume ringed seals, act to limit ringed seals predatory pressure on Arctic cod, thus yielding an indirect positive influence overall. If a sudden decrease in the ecosystem energetic contributions from Arctic cod occurs as the Beaufort Sea warms, higher trophic level predators (beluga whales, ringed seals, Arctic char) reliant on Arctic cod (Bradstreet et al., 1986; DFO, 1999; Loseto et al., 2009) will have to alter their prey, possibly to include sub-Arctic species such as capelin (Rose, 2005; Walkusz et al., 2013). Capelin are still considered low abundance in the region (1970 EwE model biomass 0.105t km−2), compared to Arctic cod (1970 EwE model biomass 0.651t km−2); however, they co-occur across the Beaufort Sea and have dietary overlaps with Arctic cod (Panasenko and Soboleva, 1980; Cobb et al., 2008; Mcnicholl et al., 2016). In the Beaufort Sea, both species are modeled to increase in both biomass and trophic level (TL), with these increases attributed to bottom-up changes in the food web, primarily driven by increases in sea surface temperature, a longer open water season, and increases in warm-water lower TL species. Slight increases in TL from 1970-2014 for cods (3.45 to 3.46) and capelin (3.45 to 3.51) are due to larger proportions of the diet from herring and smelt (TL = 3.08), macro-zooplankton (TL = 2.64), and reductions of colder-water species such as large copepods (TL = 2.306). Note, in the EwE model, primary producers and detrital groups are assigned a TL of 1, and consumers with a diet comprised entirely of primary producers have a TL of 2 (primary consumers). Each predator TL is calculated based on the proportion (X) of each prey item (a,b,c) and the TL of these prey items (TLa, TLb, TLc). Furthermore, while capelin are consumed by marine mammals in other Arctic regions (Bluhm and Gradinger, 2008), their importance to marine mammals (beluga whales and ringed seals) in the Beaufort Sea has not been noted until recently (Choy et al., 2016). Increases in capelin as a forage fish have occurred in Hudson Bay (Gaston et al., 2003) and the Barents Sea (Hop and Gjøsæter, 2013), with the potential to at least partially replace Arctic cod (Hoover et al., 2013a,b), highlighting the potential for large increases in the Beaufort Sea. However, the energetic contributions of Arctic cod and capelin are similar (5-7 kJ g−1ww vs. 4-5 kJ g−1ww, respectively (Hop and Gjøsæter, 2013), with higher values up to 8.4 kJ g−1ww reported by Lawson et al. (1998) meaning energetic impacts from shifting diets to capelin from Arctic cod may not be as extreme as expected, assuming there are no ecological (predator-prey) barriers.
2.6. Fisheries in the Canadian Arctic
Fisheries harvest in Canada's Arctic is largely for subsistence purposes, providing key sources of food and nutrition for Inuit communities (Zeller et al., 2011). Information on the magnitude of seafood (and other country food) consumption by Arctic communities is critical for evaluating public health trade-offs between traditional subsistence harvest and imported (often processed) foods. Limited studies in the region indicate unclear recent (last 50 years) patterns in traditional food use in the communities (Berkes, 1990), but it is clear that their seafood consumption is markedly higher than in the general population. Based on a meta-analysis using available population and harvest data, in the Canadian Arctic some 70,000 people in 60 communities eat around 2,600 metric tonnes of seafood per year (Cisneros-Montemayor et al., 2016). While such studies help provide a sense of magnitude to coastal Indigenous seafood consumption, they also highlight the need for joining appropriate local research and observations with interdisciplinary modeling efforts in order to better inform climate and policy scenarios. Arctic commercial fisheries are very minor in Canada, but the increase in accessibility with ocean warming and decreasing sea-ice cover may encourage such development.
2.7. Climate Change and Acidification in the Western Canadian Arctic Ocean
Past environmental changes in the Western Canadian Arctic have been highlighted in recent assessments (e.g., Steiner et al., 2015a; AMAP, 2017) and show atmospheric and oceanic temperature increases, intense summer sea-ice retreat and thinning, particularly in the Beaufort Sea, as well as changes in stratification. In the Western Canadian Arctic the progression of ocean acidification is indicated by a significant northward expansion of waters with low aragonite saturation state, and upper halocline waters and deep waters now regularly showing aragonite undersaturation particularly in the off-shelf waters (Miller et al., 2014; Qi et al., 2016; AMAP, 2018).
Global Earth System Model (ESM) projections suggest the marine environment in the western Arctic is likely to experience large changes with suggested atmospheric temperature increases of 0–3°C in summer and 3–7°C in winter over the next 50 years (Steiner et al., 2015a). A multi-model analysis indicates different rates of sea-ice retreat in the region which cause differences in stratification and mixing, affecting exchanges with the atmosphere, such as heat uptake in summer. The models suggest reduced vertical mixing in the central Beaufort Sea, but increases to different degrees in the shelf areas (e.g., Steiner et al., 2014). Localized processes are likely to affect coastal regions much differently than the overall average over the Arctic region, causing some areas with greater or lesser changes in environmental conditions. The ESM projections also consistently show enhanced ocean acidification in the region with continuation over the next century, including accelerated reductions in calcium carbonate saturation state at least until the sea-ice cover reaches a new steady state with largely ice-free summers (Steiner et al., 2014). Projections with the high emission scenario (Representative Concentration Pathway, RCP8.5, see section3.1) forcing for the Canada Basin show reductions in the bidecadal mean surface pH from about 8.1 in 1986–2005 to 7.7 by 2066–2085, closely linked to reductions in the saturation states (ΩA,C) from about 1.4 (2.0) to 0.7 (1.0) for aragonite (calcite). The changes coincide with a decrease in sea-ice concentration (98% to 96% in winter and 60% to 3% in summer) and maximum mixed layer depth (by 5–10 m with high variability among the models) (Steiner et al., 2014). An analysis of future nutrients and primary production including 11 models (Vancoppenolle et al., 2013) indicates a consistent decrease in nutrients but increase in light for the area. The respective multi-model mean response shows an increase in the Beaufort Sea and even stronger increase in most of the CPS, however the models are inconsistent in their responses for primary production, depending on which of the two factors (light increase and nutrient decrease) has a more pronounced effect on the production. (Note that not all models have adequate resolution to resolve the CPS).
3. Materials and Methods
The development of modeling tools in climate, ecosystem and fisheries research has made significant progress over the last two decades. Coupling and linking those tools can highlight impacts from climate change and other stressors for specific social-ecological contexts. In anticipation of significant changes in Arctic marine ecosystems, a co-production of knowledge (incorporating scientific methods, SM, and indigenous knowledge, IK) framework has been developed. This framework aims at improving the understanding of recent and forthcoming climate and ecosystem changes and their impacts at a community level, and identifying and supporting potential mitigation and adaptation measures. The framework represents a multi-step process combining modeling and analysis tools to both synthesize available knowledge and create new information. Figure 2 indicates the various components with IK contributions in red, SM in blue, and a combination thererof indicated in purple. The steps include:
• Monitoring efforts providing information on past observed trends;
• Model simulations with global and regional climate models including future projections;
• Assessment of physiological responses and thresholds in marine species to help understand observed changes and provide input into models;
• Species distribution/habitat suitability, higher trophic level Ecosim/Ecopath models;
• Bio-economic models;
• Analysis of current subsistence fishery and economic activities in communities;
• Review of relevant laws and policies to assess how, e.g., adaptation measures on global, regional and national scales may impact the communities.
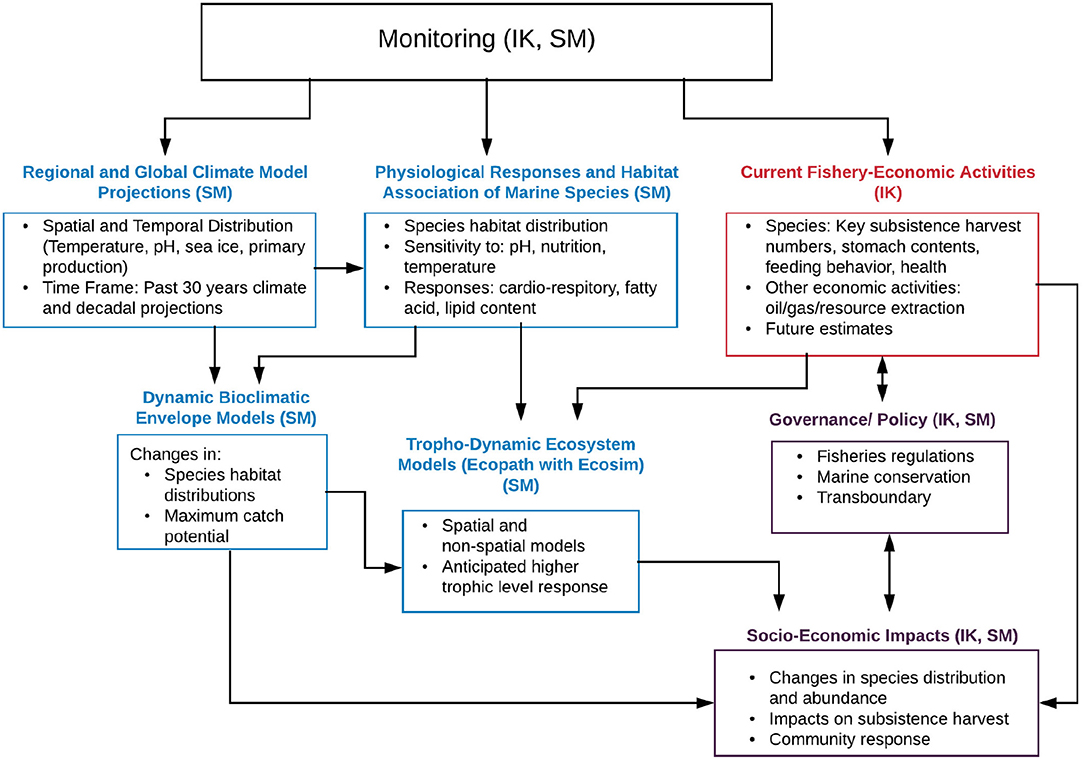
Figure 2. Flow chart indicating a multi-step framework based on indigenous knowledge (IK, indicated in red) and scientific methods (SM, indicated in blue, efforts including both IK and SM input are indicated in purple). Monitoring efforts leading to observed trends are feeding into regional and global climate models for validation and model development, provide information on current species habitat as well as current fisheries-economic activities. Projection simulations with global and regional climate models in turn provide information on potential environmental and biogeochemical changes which can be used to assess physiological responses and thresholds in marine species. Simulated changes, physiological responses and fisheries activities can then be fed into species distribution/habitat suitability and higher trophic level (Ecopath with Ecosim) models. Combined output of all the above allows for the evaluation of socio-economic impacts on the community level. Additional impacts can be linked to or mitigated by policy and governance. Note that international policy decisions, e.g., related to carbon emissions can in turn affect the input into global climate projections (link not indicated in the schematic). Figure modified from AMAP (2018) with permission from AMAP.
Observational monitoring efforts from SM and IK methods (ideally longterm) provide critical information of environmental conditions (including temperature, salinity, sea ice, nutrients, primary production etc.), which are used in regional and global climate models for validation and model development. In addition, monitoring efforts provide information on current species habitat as well as current fisheries-economic activities. Projection simulations with global and regional climate models provide information on potential future environmental and biogeochemical changes which can be used to assess potential physiological responses and thresholds in marine species. Simulated environmental changes, physiological responses and fisheries activities can then be fed into species distribution/habitat suitability and higher trophic level (EwE) models to assess potential changes in species distribution and abundance, species community structure and predator-prey interactions. Combining the output and information of all the above allows us to assess potential impacts of a changing ocean climate to socio-economic impacts on the community level. The latter can both influence and be affected by policy and governance, e.g., via fisheries regulations or conservation measures. Note that international policy decisions, e.g., related to carbon emissions can in turn affect the input into global climate projections (link not indicated in Figure 2 for clarity).
Within the CEE model tool box, all the required tools have been developed, however due to their high complexity and computational demands not all components have been run out for future simulations and/or adequately coupled yet, e.g., while higher resolution model projections are presented for the area, the habitat suitability and economic models are still driven by global climate models, the regional climate model with sea-ice algal representation as well as the Ecopath model have not yet been run out into the future and physiological responses are only limitedly reflected in the higher trophic level models. An uncertainty analysis and discussion of required refinements are provided in section 5. A summary of the applied model tools is provided in Table 2, indicating type and name of the model, resolution, timeperiod, ecosystem model components (for marine biogeochmistry models only). Also indicated is which other model the stated model is driving or feeding into. Links that have not yet been performed within this study, but will be included in future iterations are indicated in italics. Note that the food web model (EwE) has been implemented for the Beaufort Sea and evaluated in a previous study (Suprenand et al., 2018), but is included here, since it represents an essential component of the CEE tool box. The EwE model is currently being updated and will be directly linked in the next iteration to address potential future food web changes. The following sections provide some details of the CEE model components with additional detail in the Supplementary Material.
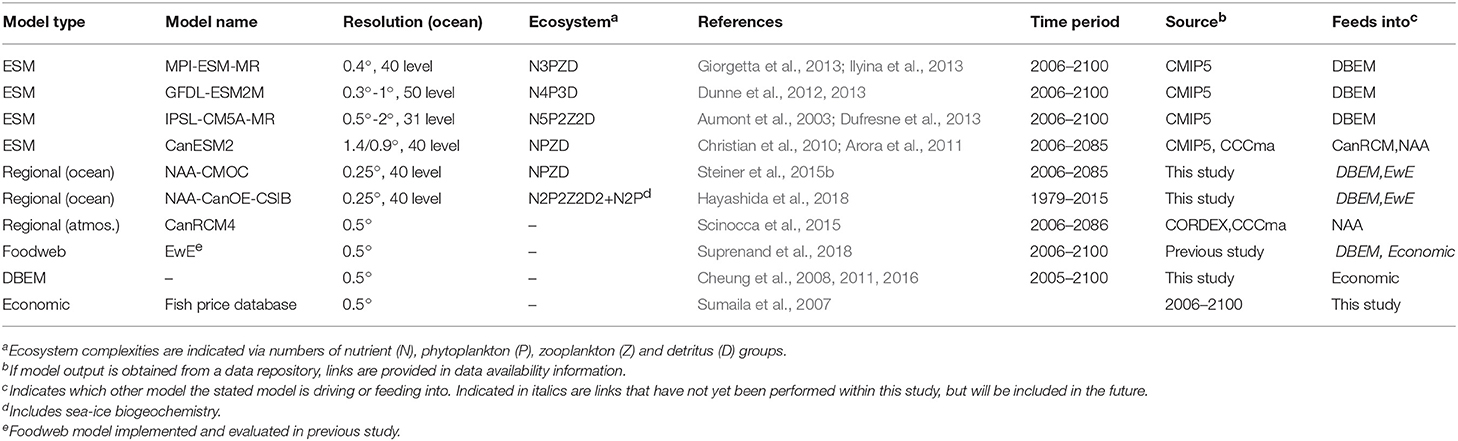
Table 2. Description of models used in this study.
3.1. Global Earth System Models
Projecting future ecosystem responses to climate change, ocean acidification and other potential stressors requires the application of numerical ecosystem models. The 5th Coupled Model Intercomparison Project (CMIP5) included for the first time a variety of Earth System Models (ESMs, model systems with fully coupled atmosphere, ocean, sea ice, and land components including interactive biogeochemical modules for all components). Simulations from three different ESMs (Geophysical Fluid Dynamics Laboratory ESM, GFDL-ESM2G, Institut Pierre Simon Laplace low-resolution ESM, IPSL-CM5A-MR, Max Planck Institute for Meteorology, MPI-ESM-MR) and two different scenarios were used as environmental input data for the dynamic bioclimatic envelope model (DBEM) to provide projections of species distribution and abundance. Multiple models and scenarios were used to estimate uncertainty ranges (see section 5.1.1). The three ESMs differ in their resolution, parameterizations and model structure (see Table 2) resulting in dissimilarities in key biophysical drivers, i.e., primary production (Stock et al., 2011; Vancoppenolle et al., 2013), sea-ice cover and acidification (Steiner et al., 2014). With each ESM, two contrasting Representative Concentration Pathways (RCPs Moss et al., 2010) with differing greenhouse gas concentration forcings were used to evaluate biophysical responses of marine organisms. The first is the current “business-as-usual” trajectory, projecting to increase global sea surface temperature by 3.5°C by the end of the century relative to pre-industrial temperatures (RCP 8.5), while the second conforms to the Paris Agreement targets of limiting temperature increases to 1.5°C (RCP 2.6). We refer to the RCP 2.6 and RCP 8.5 scenarios as low and high CO2 scenario, respectively. In addition, output from the Canadian Earth System Model version 2 (CanESM2, Table 2) for the high CO2 scenario (RCP8.5) serves as boundary condition for the atmosphere-only Canadian regional climate model (CanRCM4), which in turn provides the amospheric forcing for the regional ocean model discussed below. The CanESM2 and CanRCM4 modules for the atmosphere use the same dynamical core, but different resolution which allows for consistency in the boundary forcing. CanESM2 does not provide output for oxygen, hence could not be included in the DBEM projections.
3.2. Ocean Ecosystem Models
The fairly coarse horizontal and vertical resolution of ESMs restricts the ability to resolve biological or chemical processes happening in the euphotic zone and on coastal shelves as well as small-scale physical processes important for biogeochemistry. Hence regional climate models (RCM) and basin-scale models need to be developed. So far these models are only limitedly available. We are presenting results from the North Atlantic Arctic (NAA) Model, a regional model for the Arctic with highest resolution in the Canadian Arctic. The model is based on the Nucleus for European Modeling of the Ocean (NEMO) coupled to the Louvain-la-Neuve sea Ice Model version 2 (LIM2) in the configuration by Hu and Myers (2013, 2014). The model is coupled to a low and a high complexity ecosystem model. The low complexity ecosystem component is the Canadian Model for Ocean Carbon (CMOC; Zahariev et al., 2008) which is the same module as in CanESM2. CMOC shows good correspondence with observed chlorophyll features in the Canada Basin for the NAA and CanESM2 configuration (Steiner et al., 2015b). NAA-CMOC has been forced with output from CanRCM4 with 22 km resolution to simulate the years 2006–2085.
NAA has now also been coupled with the higher complexity pelagic Canadian ocean ecosystem model (CanOE) and the Canadian sea-ice biogeochemistry model (CSIB) (Hayashida, 2018; Hayashida et al., 2018), which allows a more direct link to ice associated species feeding directly or indirectly (via sympagic zooplankton grazers) on ice algae, i.e., Arctic cod. NAA-CanOE-CSIB has been run from 1969 to 2015 to investigate the interannual variability and trends in sea-ice and pelagic primary production in recent decades in the Arctic Ocean. The spin-up years 1969–1978 were excluded from the analysis. This model version has not yet been run out for future scenarios. Additional details for model, forcing and input data are provided in the Supplementary Material.
3.3. Food Web Model (Ecopath)
In order to link environmental drivers with impacts to the food web as a whole, the Ecopath with Ecosim (EwE) modeling software provides a suitable tool. The EwE model enables impacts to species or species groups within the food web to be assessed including multiple stressors such as direct (harvest and predation mortality) and indirect (environmental changes or shifts in prey items) impacts (Pauly et al., 2000; Christensen and Walters, 2004). The EwE software is comprised of three main components: The Ecopath component provides the instantaneous snap-shot of the energy balance between predator-prey relationships, the Ecosim component performs temporal simulations utilizing multiple drivers at once if necessary, and the Ecospace allows for spatial and temporal simulations for the ecosystem model (Christensen and Walters, 2004; Christensen et al., 2007).
The Beaufort Sea EwE model was created for an area containing the ISR and the eastern portion of the Alaskan Beaufort Sea) for the 1970s time frame (Suprenand et al., 2018). It considers 36 functional groups, including single species and aggregated groups of species, ranging from top predators (marine mammals) to primary producers and detritus, covering taxa throughout the food web. The Ecopath “snap-shot” of material fluxes are used to account for the energy of the system using a mass-balance approach, whereby production of a species group is determined for all components of the food web, and linked through diet proportions connecting species through predator-prey interactions. Adding in layers to account for harvest and environmental changes allows users to account for responses by functional or species groups to multiple stressors simultaneously. We are currently developing the protocol to directly link the NAA-CanOE-CSIB model with the EwE and species distribution models, however, no new analysis of the EwE model has been performed within this study. As an intermediate step, information on how the ecosystem structure and function changed over time with relevance to this study and Arctic cod in particular has been extracted from Suprenand et al. (2018) and summarized in section 2.5 above.
3.4. Species Distribution Model
A dynamic bioclimatic envelope model (DBEM, Cheung et al., 2008, 2011, 2016) was used to project the spatial and temporal change in species distributions and abundances due to changes in habitat and environmental conditions. ESMs are used as inputs for environmental change. The DBEM integrates ecophysiological growth (Cheung et al., 2011) and population growth (Pauly, 1980) models to simulate changes in biomass, while advection-diffusion (Sibert et al., 1999) and habitat suitability (Cheung et al., 2008) models determine spatial movements. It uses a global grid with a resolution of 0.5° longitude by 0.5° latitude. Thus, populations grow and move based on gradients of environmental suitability (e.g., temperature, oxygen, acidification, salinity, primary production) and carrying capacity, and we can expect population to shift in space and time to optimize areas where habitat is more suitable and potential for population growth is higher.
The full DBEM model version spans the Chuckchi Sea, Beaufort Sea, Canadian Polar Shelf, and Baffin Bay, and includes a total of 82 marine species (57 finfish and 25 invertebrate species). Species-specific data to parameterize the DBEM were collected from FishBase (Froese and Pauly, 2018) and SeaLifeBase (Palomares and Pauly, 2018). Invertebrates were modeled to respond to changes in acidity, in addition to other climate-related drivers such as temperature and oxygen concentration. Meta-analyses have shown evidence of negative (Munday et al., 2009; Baumann et al., 2012) and small to negligible (Kroeker et al., 2013) effects of acidification on growth and survival in marine finfish species, but most invertebrate species groups showed some level of sensitivity to acidification (Kroeker et al., 2013). (Additional details on the DBEM are provided in the Supplementary Material.)
Current evidence shows that there are negligible to minimal effects of ocean acidification on Arctic cod growth or survival (Kunz et al., 2016). However, similar studies have found evidence of behavioral and biochemical changes with acidification, especially when combined with other stressors such as temperature (Leo et al., 2017; Schmidt et al., 2017). Due to this uncertainty surrounding effects of acidification, we tested the sensitivity of Arctic cod abundance to changes in acidity. For every 100% increase in acidity (hydrogen concentration), ocean acidification was modeled to negatively affect both growth and survival by 10, 20, and 30%. While these values may be greater than what has been observed in Arctic cod growth and survival, it provides a measure of the relative weight of ocean acidification effects on abundance and distribution in a multistressor context.
The DBEM assesses shifts in species distribution based on (a) the change in environmental conditions which are favorable to each species, and (b) the carrying capacity (maximum attainable biomass) in each grid cell. The DBEM is developed on a grid and resolutions similar to climate models, but it does not include trophic interaction among species. It can be used to inform economic models which assign a monetary value to the fisheries changes or potential. In comparison, the EwE model assesses potential changes across the food web based on (a) changes in environmental conditions, (b) fisheries impacts, and (c) how these impacts are propagated throughout the food web. EwE models are often regionally averaged (1-dimensional) or include a very coarse spatial separation, which essentially applies the same food-web linkages on smaller domains and combines the results afterwards in a spatial map. The two methods complement each other and can provide different aspects of change. They can also be combined when spatial components of the EWE model are developed and linked to the DBEM, which then incorporates how the entire food web could change spatially.
In it's current state the DBEM has not yet been set up to run with input from the higher resolution model due to inconsistencies in the grid and areal coverage. This will be addressed in a second iteration of the process.
3.5. Economic Model
Changes in distribution and abundance from the DBEM for each species were used to estimate changes in fisheries catch potential, which assumes that annual catch potential is equal to the maximum sustainable yield. The DBEM results were used to assess downstream effects to Arctic communities as drivers of socioeconomic indicators such as food security (i.e., catch potential) and revenues (i.e., landed values) and to provide an assessment of the potential scale of Arctic fisheries in the reference time period (2001–2010), as well as the potential change expected in the future (2091–2100). Ex-vessel prices (i.e., price of catch at the first point of sale) were weighted and averaged across the countries that reported respective catch and averaged for the 2001–2010 reference period to estimate the potential value of present and future Arctic fisheries. Prices for species were taken from a global ex-vessel fish price database (Sumaila et al., 2007; Tai et al., 2017). We used global average annual prices from the years 2001–2010, and corrected the prices to reflect inflation, purchasing power, and exchange rates. These prices were applied to estimates of annual landed value for the 2001–2010 and the 2091–2100 period.
4. Results
4.1. Ocean Ecosystem Model Results: Recent Past
The pan-Arctic representation of NAA-CanOE-CSIB model has been evaluated in detail in Hayashida et al. (2018) and Hayashida (2018) and shows good correspondence with available observations. A more detailed analysis with respect to recent changes in the Western Canadian Arctic is included in the Supplementary Material (section S1.2). Arctic cod are tightly linked to the sea-ice habitat with young Arctic cod feeding under the ice on small zooplankton species that are feeding on ice algae. Hence, changes in ice algae production and distribution have direct impacts on the recruitment and distribution of Arctic cod. Models which include ice algae explicitly might therefore provide information that directly affects the distribution and abundance of Arctic cod. Simulated changes which might affect forage fish distribution and abundance and impact subsistence fisheries are evaluated here. The NAA-CanOE-CSIB simulations indicate the ISR as productive with respect to both ice algal and pelagic production. Figures 3a,b show the simulated production averaged from 1979 to 2015. Higher values are shown within the CPS than in the open Beaufort Sea (which is known for its low nutrient content). Averaged over the CPS, Beaufort Shelf and Beaufort Basin (Figure 3c), ice algae are suggested to increase in the CPS, but show little change in the Beaufort Shelf and Basin. Interannual variability over the CPS is high and seems to be increasing (Figure 3d). This might be a significant contributor to interannual changes in forage fish distribution and abundances. A regional trend analysis for the model suggests an increase in ice algae on the Beaufort Shelf and some part of the CPS in spring, but a decrease in some other parts over the period 1979–2015 (Figure 4d). This seems to a large part be related to a decrease in sea ice (Figure 4b) and snow thickness (Figure 4a) allowing enhanced light transmission. In the CPS several areas show increases in snow coverage in hand with a decrease in ice algae. Ice algae show hardly any change in summer which is not unexpected, since the ice algae bloom tends to be limited to spring season (Figure 4d). Phytoplankton production is suggested to have increased everywhere in the region both in spring and in summer (Figures 4e,k), particularly since the early 2000s (Figure 3e). This domain-wide increase appears to be tightly coupled to the vertical thinning (Figures 4b,h) and horizontal shrinking (Figures 4c,i) of sea ice, both of which lead to more light penetration into the water column. A consistent increase in ice mobility is indicated in spring (Figure 4f) and in some regions in summer (Figure 4l). In addition to the ice thinning and weakening, increased ice mobility further impedes cross-ice travel and hence access to traditional fishing grounds.
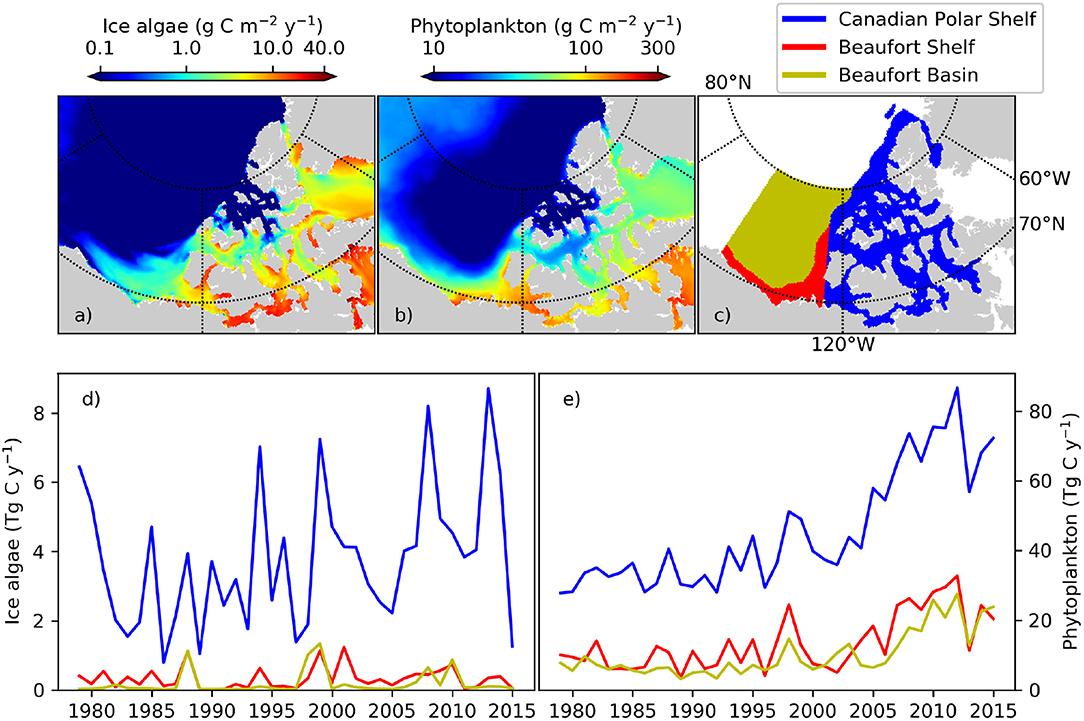
Figure 3. (a) ice algal and (b) phytoplankton annual primary production in the Western Canadian Arctic averaged over the period 1979–2015 as simulated with the regional high resolution model NAA-CanOE-CSIB. (c) Areal definitions of three oceanographic subregions used for regional averaging. Time series of simulated (d) ice algal and (e) phytoplankton annual primary production integrated for each of the three subregions.
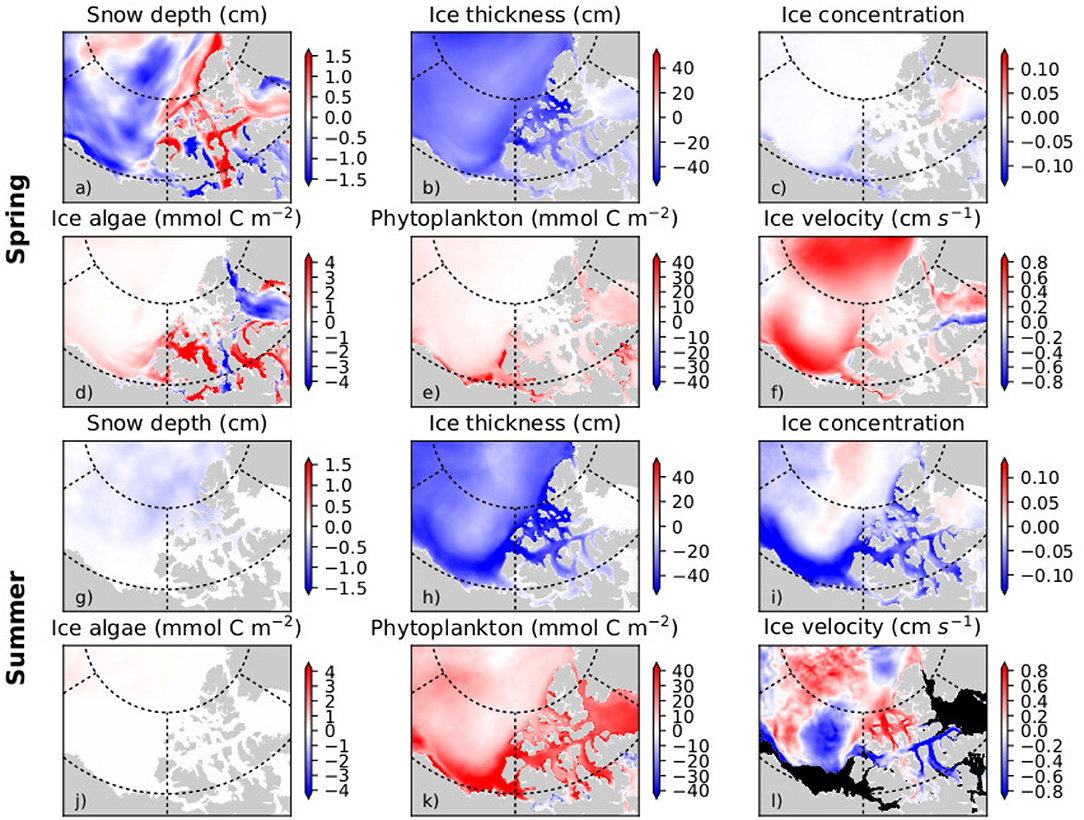
Figure 4. Mean trend (per decade) in the spring (April-June; a–f) and summer (July-September; g–l) for snow depth, ice thickness, ice concentration, ice algal biomass, phytoplankton biomass, and ice velocity in the Western Canadian Arctic over the period 1979–2015 as simulated with the regional high resolution model NAA-CanOE-CSIB.
4.2. Ocean Ecosystem Model Results: Future Projections
Figure 5 shows some of the DBEM input variables for sea surface (upper panels) and sea bottom (lower panels) derived from the three ESMs (GFDL, IPSL, MPI) introduced above. Shown are regional averages across the region (shown in Figure 9) for all three models (thin lines) and the mean over all models (thick lines) for the high (RCP8.5, red) and low (RCP2.6, blue) emission scenarios. As expected the high emission scenario shows a much stronger response with significant temperature increases (≈ 2.5°C for the surface and ≈ 0.8° for the bottom, Figures 5A,D), oxygen declines, likely related to temperature related decreases in solubility (≈ -20μmol-L−1 and ≈-10μmol-L−1, Figures 5B,E), and pH reductions (≈ -0.5 and ≈ -0.2 for surface and bottom, respectively, Figures 5C,F). The NAA-CMOC is run under high CO2 conditions (RCP8.5) and available from 2006 to 2085 (a portion of the ESM timeseries). An anomaly calculation for the NAA-CMOC using the regionally averaged values from 2006 to 2010 indicates the change in surface temperature and pH is within the range of the ESM models. Bottom temperature show a somewhat larger increase (1.2°C) and the NAA-CMOC bottom pH decrease is consistent with the ESM model mean. In the NAA-CMOC run, O2 has been initialized with a value too low for the Arctic (177.6 mmol-O2m−3), hence surface O2 increases until year 2046 when it starts to decline similar to the ESMs. As the deep ocean adjusts slower, the bottom O2 increases the entire 80 year run. This error in the O2 initialization does not affect the discussed NAA-CMOC results and has been corrected for NAA-CanOE-CSIB.
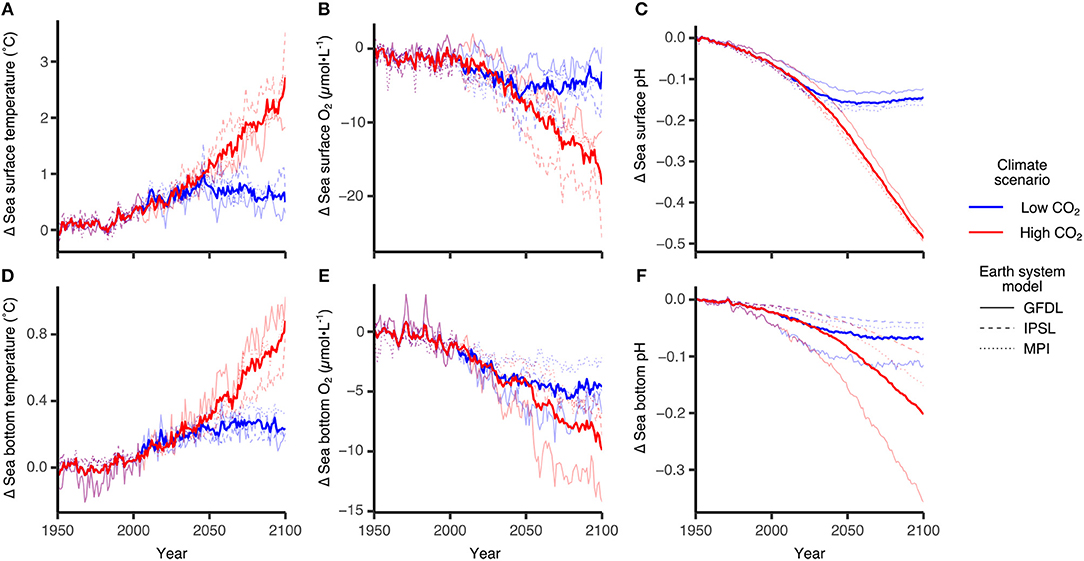
Figure 5. Projected changes in sea surface and bottom ocean variables using three ESMs GFDL-ESM2G, IPSL-CM5A-MR and MPI-ESM-MR. Individual panels show changes in sea surface (A) temperature, (B) oxygen concentration and (C) pH and in bottom (D) temperature, (E) oxygen concentration and (F) pH. Bold lines represent multi-model averages and trajectories are relative to the 1951–1960 average. Blue lines are trajectories following climate scenarios where carbon emissions are mitigated and Paris Agreement targets are met (RCP2.6, +1.5°C global sea surface temperature), while red lines are climate scenarios along our current emissions trajectory (RCP8.5,+3.5°C). Reproduced from AMAP (2018) with permission from AMAP.
ESM results for the low emission scenarios show initially a similar change but level out after 2050 when interannual variability dominates any trends. The range among the models indicates the model uncertainty which needs to be taken into account when evaluating the DBEM outcomes. Projections performed with higher resolution ocean only models provide more detailed projections for the region, while showing very similar trends and Pan-Arctic patterns. NAA-CMOC simulations suggest a combination of changes which potentially affect the performance, abundance and phenology of marine species. Figure 6 shows simulated ice concentration for the high emission scenario (RCP8.5) from 2010 to 2086 for winter (JFM) and summer (JAS) averaged over the (A) Northern Beaufort Sea, (B) Southern Beaufort Sea, and (C) the CPS. Ice concentration is projected to decrease mostly in summer (by -7%/decade), but also by some fraction (-2%/decade) in winter, which might have both positive and negative effects on species due to effects on habitat and primary production. Changes in the southern Beaufort Sea are much lower than in the other regions, since the area is already mostly ice free in summer by 2010. Ice thickness is simulated to continue decreasing at a rate of -(0.15–0.2)m/decade for all seasons, but with strongest declines in winter (not shown). Regional changes within the ISR, simulated with the same model (NAA-CMOC), are shown in Figure 7. Changes in summer over the 60 year time period from 2006–2025 to 2066–2085 are very low (Figures 7a,b), since the area already experienced significant ice thinning in the 90s and early 2000s. A continuous increase in sea surface temperature is simulated in the region and occurs across all depths in the Canadian Polar Shelf. The model suggest summer temperatures to increase by 4-6 °C within all of the ISR over a 60 year time period (Figures 7c,d). Progressing acidification is simulated in the ISR with decreases of −(0.3-0.4) for pH, −(0.6-0.9) for ΩC, and −(0.4-0.6) for ΩA (Figures 7e,f, Ωa only). This indicates aragonite undersaturation for the whole region but surface waters remain supersaturated with respect to calcite. The projections also show a continuous decline across all depths over time for both ΩA,C. By 2066–2085 all of the central CPS is projected to be undersaturated with respect to ΩA.
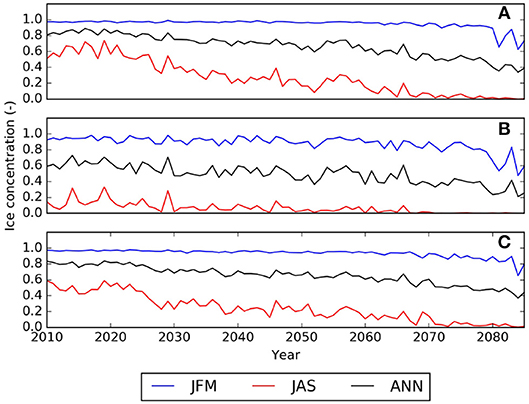
Figure 6. Temporal evolution of the ice concentration (values between 0.0 and 1.0 representing 0–100% ice coverage) averaged over the (A) Northern Beaufort Sea, (B) Southern Beaufort Sea, and (C) the Canadian Polar Shelf (CPS) as simulated with the regional NAA-CMOC model. JFM indicates averages over January, February, March, JAS averages over July, August, September, ANN indicates the annual mean.
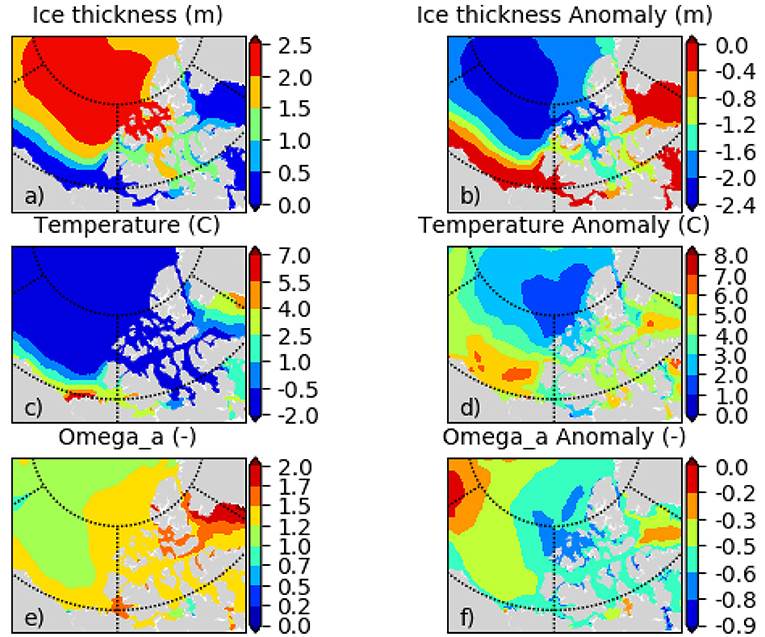
Figure 7. (a) sea ice thickness hice, (c) temperature Ts, and (e) aragonite saturation state ΩA for the bidecade 2006–2025, and respective change (2066–2085) minus (2006–2025) for (b) hice, (d) Ts, (f) ΩA for July, August, September (JAS) as simulated with the regional NAA-CMOC model.
4.3. DBEM Results—Arctic Cod Distribution and Abundance
In the DBEM, projected changes are expressed in terms of Maximum catch potential (MCP). MCP is equal to the maximum sustainable yield of the projected abundance in the DBEM, equal to rK/4 where r is the intrinsic rate of population growth, and K is the carrying capacity. Projected changes in the overall MCP for the 82 modeled species are discussed in AMAP (2018) and indicate increases across the Canadian Arctic for the high emission scenario (overall increase by 35% from 2001–2010 to 2090–2100 for RCP8.5) and negligible effects for RCP2.6. Effects of ocean acidification on invertebrates reduced the projected increase in MCP by >10%, suggesting that ocean acidification reduces any gains from temperature-driven shifts in distributions. Increases in MCP occur due to increases in primary production and increases in northward moving species. DBEM results for Arctic cod populations show largely negative effects to climate change mainly due to temperature and sea-ice related habitat reductions. In the high emission scenario abundance decreases by more than 17% without the effects of ocean acidification (Figure 8). Changes in Arctic cod abundance (by 2100 relative to the averaged abundance from 2001 to 2010 shown in Figure 9A) shows significant decreases in the more southerly regions, and increases in northern regions, suggesting a northward shift for the species (Figure 9B). Note, however, that the large range in the simulated ESM input variables leads to a large standard deviation among the projected changes, indicating significant uncertainty. The model suggests that adding an ocean acidification effect by reducing growth and survival of Arctic cod by 10, 20, and 30% For every 100% increase in acidity has a consistent negative effects across much of the species range (Figure 9C), but the estimated effects of ocean acidification are small and amount to only an additional ≈1% decrease in abundance. Note only the 20% effect is shown in Figures 8, 9.
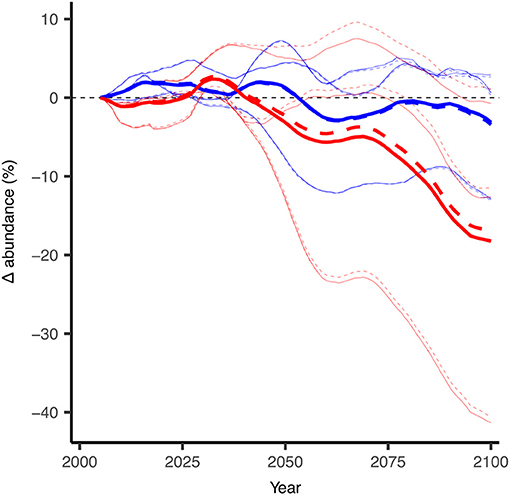
Figure 8. Projected changes in abundance for Arctic cod (B. saida) with and without the modeled effects of ocean acidification as simulated with the DBEM. Thin lines indicate the individual DBEM results with forcing input from each of the three earth system models (GFDL, IPSL, MPI). Thick lines represent the averaged results from the respective three runs. Dashed lines indicate DBEM results which include impacts of ocean acidifcation on Arctic cod (For every 100% increase in acidity, i.e., hydrogen concentration, ocean acidification was modeled to negatively affect both growth and survival by 20%), solid lines include no acidification effect on the species. Changes in abundance are 10-year running means and relative to the 2001–2010 average. Red indicates the DBEM results forced with ESMs using the high CO2 emission scenario (RCP8.5) and blue indicates results for the low emission scenario (RCP2.6). Modified from AMAP (2018) with permission from AMAP.
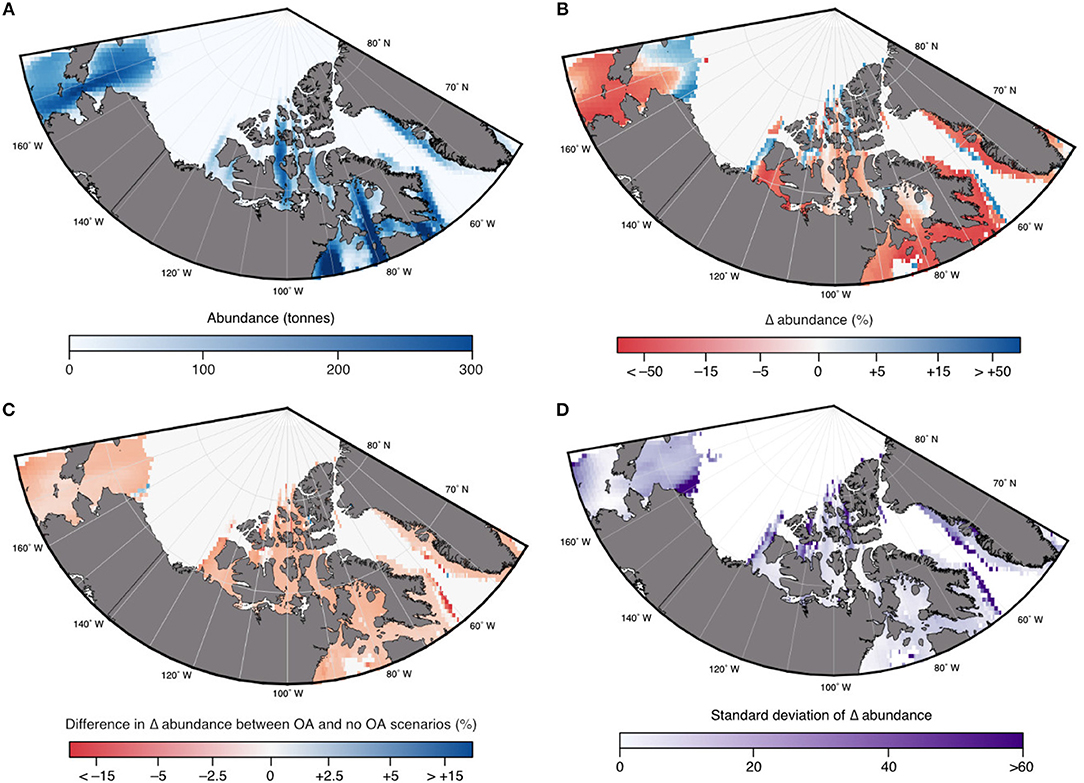
Figure 9. Projected multimodel mean (of the 3 ESMs) changes in abundance for Arctic cod (B. saida) under the high emission (RCP8.5) scenario: (A) 2001–2010 abundance; (B) relative changes in abundance by 2100 compared to 2001–2010 in response to multiple stressors (i.e., ocean acidification, temperature, oxygen); and (C) changes in abundance due to additional effects of ocean acidification (OA) using a 20% negative effect on growth and survival (see text); and (D) the standard deviation of the changes in abundance shown in B, based on the three input ESMs. Modified from AMAP (2018) with permission from AMAP.
4.4. Economic Model Results
Using current prices, the economic model estimates the current value for Beaufort Sea fisheries for all species to be $4.5 million USD. Under the low CO2 scenario this landed value is projected to marginally increase to $5.3 million USD, but under the high CO2 scenario it is expected to increase to $15.7 million USD (AMAP, 2018). This increased landed value is largely due to substantial increases in capelin, a comparatively low-priced species. This explains the 5-fold increase in catch potential but only a 3-fold increase in landed value: Table 3 shows catch potential and landed values for Arctic cod and capelin in the Beaufort Sea. Arctic char is added for comparison to highlight the large biomass contribution from forage species. The summary indicates significant increases in capelin and slight reductions in Arctic cod for the high emission scenario, but also an increase in the subsistence species Arctic char.
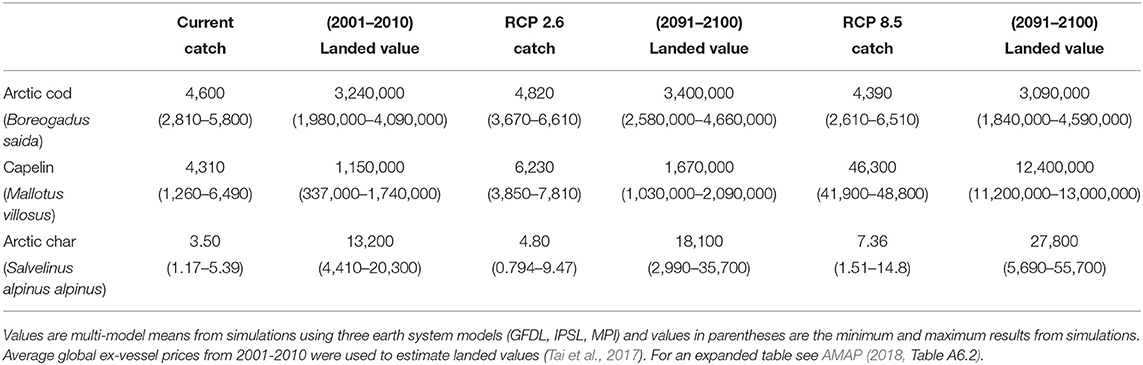
Table 3. Examples for estimates of catch (tonnes) and landed value (USD) of potential current fisheries and future projections under RCP 2.6 and 8.5 scenarios in the Beaufort Sea.
5. Discussion
5.1. Uncertainties
All applied model tools are prone to a variety of uncertainties which are highlighted below. Table 4 summarizes those uncertainties and indicates ways to estimate the range and reduce those uncertainties. Coupling those model tools sequentially can lead to propagation and amplification of uncertainties, hence ways to reduce uncertainties need to be evaluated for each model component.
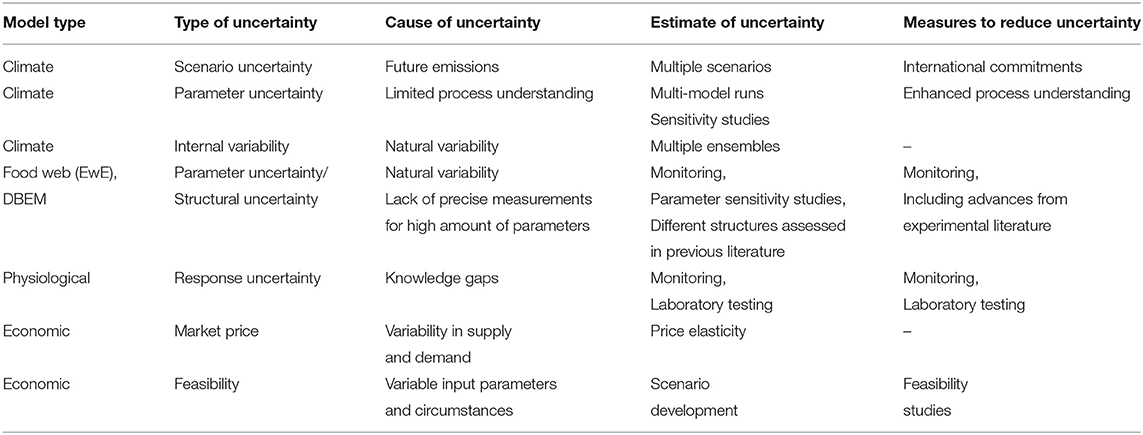
Table 4. Uncertainties in coupled climate-ecosystem-economic (CEE) models.
5.1.1. Uncertainty in Climate Model Projections
The issue of uncertainty in climate model projections is discussed in detail within the Intergovernmental Panel on Climate Change (IPCC) 5th Assessment report (AR5) and focused research papers (e.g., Collins et al., 2013; Cubasch et al., 2013; Kirtman et al., 2013; Knutti and Sedlláçek, 2013). Kirtman et al. (2013), indicate three main sources of uncertainty. (1) Natural internal variability which is intrinsic to the climate system and places fundamental limits on the precision with which future climate variables can be projected. (2) Uncertainty concerning the past, present and future forcing of the climate system by natural and anthropogenic forcing agents (emission uncertainty). (3) Uncertainty related to the response of the climate system to the specified forcing agents (model uncertainty). The forcing-related uncertainty is estimated using the spread of projections for different emission scenarios (e.g., RCPs), while the spread among different models for individual scenarios is used as a measure of the model response uncertainty. However, due to their natural internal variability, ESMs have limitations and cannot reliably simulate interannual and decadal variability, which might overlay and sometimes mask or enhance a longer term trend (Taylor et al., 2012; Loder and van der Baaren, 2013; Swart et al., 2015). Dynamical or statistical downscaling procedures introduce an additional dimension of model uncertainty.
Biogeochemical models of the Arctic are still under development and show inconsistent results with respect to the amount of primary production at current and future times (Popova et al., 2012; Vancoppenolle et al., 2013; Steiner et al., 2015b). Differences are related to the opposing impacts of increased light vs. decreased nutrient supply, and the representation thereof in the models, but also to our limited understanding of ecosystem functions such as the light-growth response in Arctic marine phytoplankton. Many biogeochemical processes are still insufficiently parameterized. The different pace in the projected ice retreat in the ESMs further affects light availability and exchange processes at the ocean surface, increasing model uncertainty (see e.g., Figure 5 results for oxygen and pH). Models representing sea-ice algae which are closely linked to the diet of young Arctic cod have only recently been developed for regional Arctic models, and current models do not differentiate between sympagic and pelagic zooplankton species.
Many processes which are responsible for mixing and nutrient supply are smaller scale processes (e.g., coastal upwelling, local mixing and tidal mixing) and require higher resolution modeling and adequate bathymetry information. (The current model bathymetry is shown in the Supplementary Material). The Canadian Arctic is still not very well charted with main hydrographic surveys focusing on main shipping routes and only few models include tides.
5.1.2. Uncertainty in Physiological Responses for Key Marine Species
Traditionally critical limits were the focus of many early physiological research. However, sub-chronic limits to performance are potentially more important as drivers of marine species distribution and much more research on those lower threshold temperature limits is needed. Also required are studies that quantify the cumulative impacts of multi-stressors such as temperature, ocean acidification, hypoxia, contaminants and even underwater noise on aquatic species. The EwE model and DBEM include physiological species responses to environmental changes. Uncertainties and lacking information transfers into uncertainties in those models and or leads to rough estimates for potential impacts (e.g., acidification response of Arctic cod). Acclimation potential to changing conditions is generally not included in models of species distribution based on thermal limits. Arctic cod have the ability to acclimate to different temperatures depending on the duration of exposure (Drost et al., 2016). This finding is not unexpected as it has been shown that even true stenothermal Antarctic fish species are able to acclimate to warmer temperatures (Pörtner et al., 2000; Seebacher et al., 2005; Franklin et al., 2007; Robinson and Davison, 2008; Peck et al., 2014; Lanning et al., 2015). However, there may be a significant cost to acclimation and the subsequent alterations in respiratory and cardiac performance to maintain fundamental physiological demands (Pörtner and Farrell, 2008). The challenge is quantifying acclimation potential as well as the cost and benefits of acclimation on ectotherms, both for individuals and populations. Existing research suggests that the cost of acclimation may, in some cases, outweigh the benefits (Woods and Harrison, 2001; Seebacher et al., 2005; Deutsch et al., 2015; Pershing et al., 2015; Drost et al., 2016). The potential to acclimate (e.g., thermal plasticity in fish) requires further study and this potential should be included in ecosystem models that project climate change impacts on food webs (Farrell and Franklin, 2016).
5.1.3. Uncertainty in Food Web and Species Distribution
From the EwE perspective, uncertainties are based on assumptions made to calculate or estimate parameters in the initial model, and changes over time. Considering the initial Ecopath model, input parameters are ranked based on how they were calculated using a pedigree analysis available in EwE (Christensen et al., 2007). Each input parameter is ranked based on the level of assumptions made when setting initial parameters. An estimate of the uncertainty representing 6 categories for biomass and 8 categories for production and consumption is indicated in AMAP (2018) (their Figure A6.22). High uncertainty is associated with simple estimates from Ecopath or other models and the lowest uncertainty is associated with high precision local sampling (similar species/same system). Much of the information about links in the food web comes from research on higher trophic levels (stable isotopes and fatty acid analysis), giving insight into the structure and function of the lower trophic levels. Fish groups are some of the biggest uncertainty in terms of ecosystem research in the ISR, as only recently large scale assessments on numbers of local species have been collected under the Beaufort Regional Environmental Assessment (BREA)-Marine Fishes program (2012–2015) (Majewski et al., 2017). The Arctic and Polar cod group is marked as estimated from Ecopath (for biomass) and via empirical relationships (for production and consumption). Zooplankton and production studies on abundance, distribution, and food web role have occurred more recently, providing more relevant information on these groups. Previously, expert knowledge was relied upon for an understanding of these groups. As sampling of species diets occurs in the summer months due to logistics of working in the Arctic, there is a potential lack of understanding of annual diets from the food web perspective, so switching from specialists to generalists adds uncertainty to individual species and ecosystem impacts. Uncertainties in the species distribution model also come from limited and seasonally biased observations of species distributions from which their environmental preferences are derived. Uncertainties are also transferred from the driving climate models (e.g., Figure 5 compared to Figure 8).
5.1.4. Uncertainty in the Economic Model
Estimates of the value of current and future fisheries are derived from current/recent (2001–2010) average global prices of each species and weighted by catch tonnage. This assumes that prices received for landings in the Arctic would be comparable to the global market. Constant average 2001–2010 prices were applied to estimate future potential landed values of Arctic commercial fisheries. Therefore, this estimate does not take into account changes in real prices due to supply-demand effects. In addition, landed values are gross revenues collected at the first point of sale; estimating profits would require estimates of the cost of fishing, including fuel, labor, and maintenance (Lam et al., 2011). While the economic model estimates potential amounts and values of the fishing resources, feasibility of fisheries in the Arctic depends on several other factors, including the potentially increased costs due to more difficult access, limited capacity (shipping, processing), resource rights, governance and policies.
5.2. Law and Governance Context
Laws and policies relevant to addressing the potential impacts of climate change and ocean acidification on marine species and coastal communities in the Western Canadian Arctic appear on global, regional and national levels. Globally, the Paris Agreement continues to set the agenda for advancing mitigation and adaptation responses to climate change and ocean acidification (Klein et al., 2017; Oral, 2018). This agreement establishes an overall objective of keeping the global average temperature rise this century to well below 2°C above pre-industrial levels and to pursue efforts to limit the temperature increase even further to 1.5°C above pre-industrial levels, which is represented as low emission scenario (RCP2.5) in this study. A key to mitigation is the requirement for Parties to submit nationally determined contributions (NDCs) which set out planned domestic mitigation measures; successive NDCs are expected to become increasingly progressive and ambitious (Winkler, 2017).
National mitigation commitments to date have been lagging. Current NDCs submitted by Parties imply a global warming of about 3°C by 2100 (Masson-Delmotte et al., 2018; UNEP, 2018). While Canada has pledged a reduction of greenhouse gas emissions by 30% below 2005 levels by 2030 and has adopted the Pan-Canadian Framework on Clean Growth and Climate Change (Canada, 2016), Canada is reportedly not on track to meet its reduction target (UNEP, 2018), and Canada is facing considerable opposition from some provinces to the federal government's role and decision to impose a price on carbon pollution across Canada (McGregor, 2018).
The research results of this paper indicate that effective implementation and future strengthening of national mitigation commitments under the Paris Agreement are critical for decreasing the potential negative effects on Arctic cod based on temperature related habitat loss and for reducing the impact of the northwards-expanding lower-priced capelin species (Table 3). Arctic ocean acidification might be significantly reduced, although at this point the effects on Arctic cod are suggested to be minor albeit with high uncertainties in physiological species responses.
Climate change and ocean acidification impacts in the Arctic threaten various internationally recognized human and Indigenous rights (Duyck, 2015; de Windt et al., 2016). These rights, some set out in the United Nations Declaration on the Rights of Indigenous Peoples (2007) include, among others, the rights to food, subsistence, culture and human health (McCrimmon, 2016; Rapporteur, 2017). Hence, projects assessing potential climate change impacts on subsistence fisheries as presented in this study are highly relevant.
The study highlights that effects of temperature and sea-ice retreat alone cause significant changes in the distribution and abundance of forage species, however uncertainties are high with respect to ocean acidification impacts. The impacts on subsistence species are still unclear, as reductions in one species might mean increased availability of another species, but their nutritional value might be different. E.g., in 2014 beluga whales appeared at unusual locations in the Amundsen Gulf with sandlance in their stomachs rather than Arctic cod and Inuvialuit harvesters indicated lower body conditions for those whales (Loseto et al., 2018). Harvesters also indicated different flesh color and taste in Arctic char. Changes in ice conditions currently seem to favor zooplankton production, which could lead to an overall positive impact on subsistence fisheries, if they can provide a suitable food base for those species. However, ocean acidification might pose negative effects on some Arctic zooplankton species, suggesting an uncertain future. E.g., Arctic pteropods are suggested to be negatively impacted by temperature and ocean acidification (Comeau et al., 2010, 2012; Bednaršek et al., 2012; Lischka and Riebesell, 2012) and for the Arctic copepod Calanus glacialis ocean acidification effects seem to vary with developmental stage. Earlier copepodite stages show increases in metabolic rates and decreased scope for growth at high pCO2 levels (Thor et al., 2017).
The inclusion of impacted communities into such assessments is highly important to understand the full impacts and to develop effective mitigation and adaptation strategies. In the ISR, collaboration with local communities is active and evolving. The CEE model approach has been presented to and received support from the Inuvialuit Game Council and Inuvialuit Regional Corporation. A continued collaborative effort to assess climate and other stressor impacts on Arctic Marine ecosystems in the ISR is now linked to the Beaufort Sea Regional Strategic Environmental Assessment (RSEA) and intends to synthesize indigenous and scientific knowledge of forage species, links to higher trophic levels and observed changes due to a rapidly changing Arctic, and expand community based monitoring.
Adaptation initiatives have been encouraged on a regional level. They include the recent Agreement to Prevent Unregulated High Seas Fisheries in the Central Arctic Ocean, opened for signature in October 2018 (Schatz et al., 2018), the Arctic Council's Framework for a Pan-Arctic Network of Marine Protected Areas (PAME, 2015), and the promotion of other area-based conservation measures (PAME, 2017).
In Canada, pursuant to an Oceans Act mandate, the Beaufort Sea region was chosen as a pilot site for a large ocean management area integrated planning initiative. The resulting Integrated Ocean Management Plan for the Canadian Beaufort Sea was a collaborative work of people representing aboriginal, territorial and federal governmental departments, management bodies, and northern coastal community residents with interests in the Beaufort Sea, and includes input also from industry and other interested parties. The plan is voluntary and is intended to facilitate integrated planning and sustainability among all Beaufort Sea resource users and managers. The plan has served as a support tool for MPA network planning in the region (Cobb et al., 2008). Canada's commitment to protecting 10% of marine and coastal areas by 2020 under the Convention on Biological Diversity provides further support for MPA development. In Canada the establishment of MPAs includes the implementation of monitoring and management plans, which are currently being developed for the two MPAs in the ISR, TNMPA and ANMPA. Both MPAs have been established to support the conservation of beluga populations and led to enhancement of the existing longterm beluga harvest monitoring program (Loseto et al., 2018). Results of the monitoring program indicate that shifts in beluga metrics such as relative abundance, arrival to summering locations, diet and health appear to be responding to habitat changes and a shifting prey base (with lower Arctic cod content) resulting from climate change drivers. While these shifts have been identified, the underlying ecosystem processes and mechanisms that drive those shifts remain poorly known and hence provide only limited guidance for management actions (Loseto et al., 2018). Hence, Loseto et al. (2018) and Harwood et al. (2015) highlight the need to pair higher trophic species monitoring with concurrent direct (stomach contents) or indirect (isotopes, fatty acids) monitoring of diet, detailed studies of movements and seasonal ranges, as well as monitoring of ecosystem parameters. Continued food chain monitoring is also essential to track adaptation capacity of higher trophic levels to shifts in prey species and hence evaluate their adaptation capacity to environmental changes.
The ongoing marine conservation planning efforts are aiming at including climate change and ocean acidification into their assessments. The presented high resolution model represents a tool to identify high risk areas (areas likely experiencing high change under a changing climate, e.g., temperature, acidification, sea-ice loss), climate change refugia (areas likely experiencing limited change under a changing climate), as well as changes to hotspots of biodiversity and primary production. Current uncertainties in the designations of priority conservation areas arise from limited data availability and potential biases toward socially, culturally and economically important species and areas. Hence the presented CEE model approach linking changing environmental conditions to species distribution, abundance and fisheries catch potential provides valuable additional information to be used in MPA as well as community planning processes.
Finally, Canada has established a policy framework to ensure future commercial fisheries in the Western Beaufort Sea Bioregion would be subject to precautionary and adaptive approaches. The Beaufort Sea Integrated Fisheries Management Framework for the Inuvialuit Settlement Region (BSP, 2014) establishes a multi-step decision process for any future commercial fisheries applications, which would consider, among other factors, possible adverse affects on existing Inuvialuit subsistence fisheries and preferential rights of the Inuvialuit to harvest fish in the ISR (Ayles et al., 2016). Future commercial fisheries would be subject to other DFO sustainable fisheries policies including those on the precautionary approach (DFO, 2009a) and on managing the impacts of fishing on sensitive benthic areas (DFO, 2009b). Underpinning any such decisions requires solid research on environmental changes and species impacts in the region. The outlined approach is designed to provide such input.
Another issue is the unresolved ocean boundary dispute between Canada and the United States in the Beaufort Sea. Canada maintains the 141st west meridian line serves as both a land and maritime boundary while the U.S. argues for an equidistance line (Byers, 2013). An area of some 6250 square nautical miles is contested (McDorman, 2009). Thus, which country has jurisdiction over the disputed area and corresponding responsibilities for climate change adaptation in that area remains uncertain.
6. Summary
In this case study a framework combining multiple modeling and analysis tools has been introduced and applied to identify potential climate change and ocean acidification effects on forage fish and impacts on subsistence fisheries in the Western Canadian Arctic. Since lower trophic level prey species such as copepods and forage fish respond more directly to primary production, they allow linkages with regional climate models that can aid in our understanding of causalities for observed shifts in distribution, abundance and prey shifts in higher trophic level species.
Arctic regions and communities are some of the most susceptible to climate changes. Changing environmental conditions affect marine species distribution and abundance as well as access to fishing grounds. Ocean acidification is progressing here faster than anywhere in the world and adds a high factor of uncertainty to marine species responses in this fast changing environment, i.e., the model suggests that by 2066–2085 all of the central CPS is projected to be undersaturated with respect to ΩA. These changes may potentially alter associated cultural and traditional practices.
Regional climate model results provide information on longterm trends and interannual variability and indicate increasing trends for ice algae and pelagic primary production with large interannual variability particularly for ice algae on the Canadian Polar Shelf. These fundamental changes are linked to decreases in ice and snow thickness allowing more light to penetrate the ice. More ice algae suggest larger amphipod abundance and good conditions for Arctic cod early life stages, hence high interannual variability in ice algal vs. pelagic primary production might be a significant contributor to interannual changes in forage fish distribution and abundances and might partially mask a longer term trend. Such interannual variability in forage species abundance has been indicated in scientific and Indigenous observations (pers. communication, Inuvialuit Game Council). The regional climate model also indicates increases in ice mobility which impedes cross-ice travel and hence access to traditional fishing grounds.
Species distribution (DBEM) simulations suggest that northward migration constrains Arctic cod to the higher Arctic, but leads to an influx of other forage species such as capelin, sandlance and zooplankton. The large decline in abundance of Arctic cod projected by the DBEM suggests that they may already be at their northern limits and thus their distributional range may be shrinking as it is compressed from the south (Frainer et al., 2017). The DBEM predicts spatial movements based solely on habitat and environmental suitability/preference and does not include trophic interactions. However, the Ecopath model also shows a reduction in Arctic cod, based primarily on changes in prey and predation, suggesting that both habitat changes and trophic interactions play a role in the Arctic cod decline.
So far empirical evidence of the effects of ocean acidification on Arctic cod remains limited. DBEM simulations which include potential effects of ocean acidification on life history traits, such as growth and survival suggest only an additional -1% decrease for Arctic cod on top of a 17% decrease based on habitat loss. However, much higher decreases are simulated for invertebrate species (AMAP, 2018).
Harwood et al. (2015) suggest higher trophic level species with a high preference for Arctic cod already exhibit a decrease in body condition, including beluga whales and ringed seals, while species with more flexibility in food choices including bowhead whales and Arctic char exhibit increased body condition. These are all important subsistence species in the ISR. While the simulated impact on Arctic cod is projected to be negative for the high emission scenario, other forage species are suggested to increase, e.g., zooplankton species and capelin. Hence, a demise of Arctic cod populations could impact subsistence and commercial fisheries (Thorsteinson and Love, 2016) but if subsistence species can adapt to alternative prey, the overall impact on the species may be reduced or even positive.
Some optimism for the Arctic to serve as a possible refugia for many species and fisheries relies heavily on the assumption that species will invade and integrate successfully to new regions. The caveat is our still very limited knowledge of physiological responses to temperature increases, acidification and cumulative stressors. Enhanced monitoring and physiological testing on local species is required to better understand physiological species responses and improve predictive models. Developing the CEE modeling system further with strong links among the components will allow for more integrated results and understanding of key stressors for each species group within the ecosystem.
The application of multiple models as well as multiple emission scenarios allows for estimates of the range of uncertainty. Global earth system models still show large differences in their projections of e.g., primary production which affects the DBEM and Ecopath projections. These model uncertainties can be reduced with enhanced process understanding and parameterization development which is an active area of research. Scenario uncertainty in climate models also remains high. While international commitments to reduce carbon emissions, as proposed in the Paris Agreement, suggest a more unified pathway, implementation time lines are still uncertain.
In addition to uncertainties linked to model assumptions and the representation of complex ecological dynamics, data availability and quality can be highly variable across regions and research themes. The Arctic in particular has less available scientific assessments compared to other Canadian oceans (Canada, 2015), with a particular lack of information regarding resource use by Indigenous communities (Cisneros-Montemayor et al., 2017). These challenges are partly due to operational difficulties for research, but also to historical marginalization of Indigenous communities. In the near future continued and culturally-appropriate collaboration between academics, communities, and managers is essential to integrate existing indigenous and scientific knowledge into relevant policies (Friddell et al., 2013). In the ISR researchers and communities are slowly moving toward this goal. E.g., longterm monitoring programs such as the beluga monitoring program (running since 1970, Loseto et al., 2018) are now including IK data collections (Ostertag et al., 2018). In addition, the Joint Secretariat, Fisheries Joint Management Council and Inuvialuit Regional Corporation are actively working toward accessible databases for Indigenous Knowledge and collaborative studies (e.g., via the ISR traditional and local knowledge catalogue, ISRTLK.com). Larger scale efforts also exist, e.g., via ArcticNet (http://www.arcticnet.ulaval.ca/), to include indigenous knowledge in research projects and use common data repositories such as the Polar Data Catalogue (https://www.polardata.ca/) for scientific and indigenous data.
Adaptation actions in the Arctic should be directed toward funding collaborative climate change and ocean acidification research, expediting and establishing pan-Arctic MPA networks and supporting unified monitoring programmes. Arctic communities should be provided with the tools and training to conduct local, unified research and food chain monitoring. Future decisions regarding commercial fisheries will need to be precautionary and adaptive in light of the many uncertainties still surrounding ocean acidification and species responses to cumulative changes.
Author Contributions
NS lead the project and writing of the article and contributed to the climate modeling efforts and analysis. WC and URS contributed to the DBEM and economic models and evaluation. AC-M contributed information on indigenous Arctic fisheries and databases. HD contributed specific information on Arctic cod and physiological species responses. HH contributed to the development and analysis of the high resolution regional model and created figures. CH implemented the EwE model for the Beaufort Sea and contributed to the analysis, provided the EwE uncertainty analysis uncertainty, and created the CEE figure. JL provided community input for the ISR. TS contributed to the development and analysis of the high resolution regional model and future projections and created figures. TT contributed to the development and analysis of the DBEM and economic models and created figures. PS implemented the Ecopath model and contributed to the analysis. DV contributed the law and policy component. All authors contributed to the writing and review of the paper.
Funding
The authors acknowledge funding from the Canadian Social Sciences and Humanities Research Council (SSHRC) partnership grant OceanCanada, the Marine Environmental Observation Prediction and Response (MEOPAR) Network, ArcticNet, the Manitoba Centre of Excellence Funding, the Fisheries Joint Management Committee, and the Departments of Fisheries and Oceans Canada and Environment and Climate Change Canada.
Conflict of Interest Statement
The authors declare that the research was conducted in the absence of any commercial or financial relationships that could be construed as a potential conflict of interest.
Acknowledgments
The publication is a product of the OceanCanada partnership. The analysis was inspired and guided by the Arctic Monitoring and Assessment Program (AMAP) 2nd assessment on Arctic Ocean Acidification. We acknowledge the valuable input from two reviewers which greatly helped to improve the structure of the manuscript. We also would like to thank Adam Monahan and Eric Mortenson for helpful discussion and contributions to supplementary figures. Figures modified or reproduced from AMAP (2018) are following the AMAP Usage Policy (https://www.amap.no/swipa2017). Extracts from Suprenand et al. (2018) relevant to this study are derived from Http://scholarcommons.usf.edu/msc_facpub/261.
Supplementary Material
The Supplementary Material for this article can be found online at: https://www.frontiersin.org/articles/10.3389/fmars.2019.00179/full#supplementary-material
References
AMAP (2017). Adaptation Actions for a Changing Arctic: Perspectives from the Bering-Chukchi-Beaufort Region. Tech. rep., Arctic Monitoring and Assessment Programme (AMAP), Oslo.
AMAP (2018). Arctic Ocean Acidification. Arctic Monitoring and Assessment Program (AMAP). Tech. rep., AMAP Secretariat.
Anttila, K., Casselman, M., Schulte, P., and Farrell, A. (2013). Optimum temperature in juvenile salmonids: connecting subcellular indicators to tissue function and whole-organism thermal optimum. Physiol. Biochem. Zool. 86, 245–256. doi: 10.1086/669265
Arora, V. K., Scinocca, J., Boer, G. J., Christian, J. R., Denman, K. L., Flato, G. M., et al. (2011). Carbon emission limits required to satisfy future representative concentration pathways of greenhouse gases. Geophys. Res. Lett. 38:L05805. doi: 10.1029/2010GL046270
Astthorsson, O. (2015). Distribution, abundance and biology of polar cod, boreogadus saida, in iceland-east greenland waters. Polar Biol. 39, 995–1003. doi: 10.1007/s00300-015-1753-5
Aumont, O., Maier-Reimer, E., Blain, S., and Monfray, P. (2003). An ecosystem model of the global ocean including Fe, Si, P colimitations. Global Biogeochem. Cycles 17:1060. doi: 10.1029/2001GB001745
Ayles, B., Porta, L., and Clarke, R. M. (2016). Development of an integrated fisheries co-management framework for new and emerging commercial fisheries in the Canadian Beaufort Sea. Mar. Policy 72, 246–254. doi: 10.1016/j.marpol.2016.04.032
Bain, H., and Sekerak, A. (1978). Aspects of the biology of arctic cod, Boreogadus saida, in the central Canadian Arctic. Tech. Rep. 104, Unpubl. Rep. by LGL Ltd, Toronto, ON. For Polar Gas Project.
Baumann, H., Talmage, S., and Gobler, C. (2012). Reduced early life growth and survival in a fish in direct response to increased carbon dioxide,. Nat. Clim. Chang. 2, 38–41. doi: 10.1038/nclimate1291
Bednaršek, N., Tarling, G., Bakker, D., Fielding, S., Cohen, A., Kuzirian, A., et al. (2012). Description and quantification of pteropod shell dissolution: a sensitive bioindicator of ocean acidification. Global Change Biol. 18, 2378–2388. doi: 10.1111/j.1365-2486.2012.02668.x
Berkes, F. (1990). Native subsistence fisheries: a synthesis of harvest studies in Canada. Arctic 43, 35–42. doi: 10.14430/arctic1588
Bluhm, B., and Gradinger, R. (2008). Regional variability in food availability for arcticx marine mammals. Ecol. Appl. 18, S77–S96. doi: 10.1890/06-0562.1
Bradstreet, M., and Cross, W. (1982). Trophic relationships at high arctic ice edges. Arctic 35, 1–2. doi: 10.14430/arctic2303
Bradstreet, M., Finley, K., Sederak, A., Griffiths, W., Evans, C., Fabijan, M., et al. (1986). Aspects of the Biology of Arctic Cod (Boreogaduc saida) and Its Importance in Arctic Marine Food Chains. Canadian technical report of fisheries and aquatic sciences, DFO.
Brown, J., Gillooly, J., Allen, A., Savage, V., and West, G. (2004). Toward a metabolic theory of ecology. Ecology 85, 1771–1789. doi: 10.1890/03-9000
BSP (2014). Beaufort Sea Integrated Management Framework for the Inuvialuit Settlement Region. Tech. rep., Fisheries and Oceans Canada and Fisheries Joint Management Committee and Inuvialuit Game Council and Inuvialuit Regional Corporation, Inuvialuit Settlement Region, 64.
Canada (2015). State of Environmental Monitoring in Canada. Tech. rep., Government of Canada, Polar Knowledge Canada. Available online at: https://www.canada.ca/en/polar-knowledge/publications/cpc-stateofenv.html. (accessed January, 2019).
Canada (2016). Pan-Canadian Framework on Clean Growth and Climate Change: Canada's Plan to Address Climate Change and Grow the Economy. Tech. rep., Government of Canada, Ottawa, ON, 77.
Cheung, W., Dunne, J. P., Sarmiento, J. L., and Pauly, D. (2011). Integrating ecophysiology and plankton dynamics into projected maximum fisheries catch potential under climate change in the Northeast Atlantic. ICES J. Mar. Sci. 68, 1008–1018. doi: 10.1093/icesjms/fsr012
Cheung, W., Jones, M., Reygondeau, G., Stock, C., Lam, V., and Froelicher, T. (2016). Structural uncertainty in projecting global fisheries catches under climate change. Ecol. Modell. 325, 57–66. doi: 10.1016/j.ecolmodel.2015.12.018
Cheung, W., Lam, V. W., and Pauly, D. (2008). Modelling present and climate-shifted distribution of marine fishes and invertebrates. Fish. Cent. Res. Rep. 16:72.
Choy, E., Roth, J., and Loseto, L. (2016). Lipid removal and acidification affect nitrogen and carbon stable isotope ratios of beluga whales (delphinapterus leucas) and their potential prey species in the Beaufort Sea ecosystem. Mar. Biol. 163. doi: 10.1007/s00227-016-2992-x
Christensen, V., and Walters, C. (2004). Ecopath with ecosim: methods, capabilities and limitations. Ecol. Model. 172, 109–139. doi: 10.1016/j.ecolmodel.2003.09.003
Christensen, V., Walters, C., Pauley, D., and Forrest, R. (2007). Ecopath With Ecosim Version 6.0: User Manual/Help Files Guide. Lenfest Oceans Futures Project, University of British Columbia, British Columbia.
Christian, J. R., Arora, V. K., Boer, G. J., Curry, C. L., Zahariev, K., Denman, K. L., et al. (2010). The global carbon cycle in the Canadian Earth System Model (CanESM1): preindustrial control simulation. J. Geophys. Res. 115:G03014. doi: 10.1029/2008JG000920
Christiansen, J., Dalmo, R., and Ingebrigtsen, K. (1996). Xenobiotic excretion in fish with aglomerular kidneys. Mar. Ecol. Prog. Ser. 136, 303–304. doi: 10.3354/meps136303
Christiansen, J., Hop, H., Nilssen, E., and Joensen, J. (2012). Trophic ecology of sympatric arctic gadoids, arctogadus glacialis (Peters, 1872) and boreogadus saida (Lepechin, 1774), in NE Greenland. Polar Biol. 35, 1247–1257. doi: 10.1007/s00300-012-1170-y
Cisneros-Montemayor, A., Pauly, D., Weatherdon, L., and Ota, Y. (2016). A global estimate of seafood consumption by coastal indigenous peoples. PLoS ONE 11:e0166681. doi: 10.1371/journal.pone.0166681
Cisneros-Montemayor, A. M., Cheung, W. W., Bodtker, K., Teh, L., Steiner, N. S., Bailey, M., et al. (2017). Towards an integrated database on canadian ocean resources: benefits, current states, and research gaps. Can. J. Fish. Aquat. Sci. 74, 65–74. doi: 10.1139/cjfas-2015-0573
Coad, B., and Reist, J. (2004). “Annotated list of the arctic marine fishes of canada,” in Canadian Manuscript Reports Fish and Aquatic Science, 2674.
Cobb, D., Fast, H., Papst, M., Rosenberg, D., Rutherford, R., and Sareault, J. (2008). Beaufort Sea Large Ocean Management Area: Ecosystem Overview and Assessment Report. Canadian Technical Report of Fisheries and Aquatic Sciences 2780, DFO, 188.
Collins, M., Knutti, R., Arblaster, J., Dufresne, J.-L., Fichefet, T., Friedlingstein, P., et al. (2013). “Long-term climate change: projections, commitments and irreversibility,” in Climate Change 2013: The Physical Science Basis. Contribution of Working Group I to the Fifth Assessment Report of the Intergovernmental Panel on Climate Change (New York, NY: Cambridge University Press).
Comeau, S., Alliouane, S., and Gattuso, J.-P. (2012). Effects of ocean acidification on overwintering juvenile arctic pteropods limacina helicina. Mar. Ecol. Prog. Ser. 456, 279–284. doi: 10.3354/meps09696
Comeau, S., Jeffree, R., Teyssié, J.-L., and Gattuso, J.-P. (2010). Response of the arctic pteropod limacina helicina to projected future environmental conditions. PLoS ONE 5:e11362. doi: 10.1371/journal.pone.0011362
Crawford, R., and Jorgenson, J. (1996). Quantitative studies of arctic cod (Boreogadus saida) schools: important energy stores in the arctic food web. Arctic 49, 181–193. doi: 10.14430/arctic1196
Cubasch, U., Wuebbles, D., Chen, D., Facchini, M., Frame, D., Mahowald, N., et al. (2013). “Introduction,” in Climate Change 2013: The Physical Science Basis. Contribution of Working Group I to the Fifth Assessment Report of the Intergovernmental Panel on Climate Change (New York, NY: Cambridge University Press).
David, C., Lange, B., Krumpen, T., Schaafsma, F., van Franeker, J., and Flores, H. (2016). Under-ice distribution of polar cod Boreogadus saida in the central arctic ocean and their association with sea-ice habitat properties. Polar Biol. 39, 981–994. doi: 10.1007/s00300-015-1774-0
David, C., Lange, B., Rabe, B., and Flores, H. (2015). Community structure of under-ice fauna in the eurasian central arctic ocean in relation to environmental properties of sea-ice habitats. Mar. Ecol. Prog. Ser. 522, 15–32. doi: 10.3354/meps11156
de Windt, C., Campos, M., Peña, A. S., and Jimenez, E. (2016). Climate Change: A Comparative Overview of the Rights Based Approach in the Americas. Tech. rep., Department of Sustainable Development, General Secretariat of the Organization of American States, Washington, DC.
Deutsch, C., Ferrel, A., Seibel, B., Pörtner, H.-O., and Huey, R. (2015). Climate change tightens a metabolic constraint on marine habitats. Science 348, 1132–1135. doi: 10.1126/science.aaa1605
DFO (2009a). A Fishery Decision-Making Framework Incorporating the Precautionary Approach. Tech. rep., Fisheries and Oceans Canada, Ottawa, ON.
DFO (2009b). Policy for Managing the Impacts of Fishing on Sensitive Benthic Areas. Tech. rep., Fisheries and Oceans Canada, Ottawa, ON.
Divoky, G., Lukacs, P., and Druckenmiller, M. (2015). Effects of recent decreases in arctic sea ice on an ice-associated marine bird. Prog. Oceanogr. 136, 151–161. doi: 10.1016/j.pocean.2015.05.010
Drost, H., Carmack, E., and Farrell, A. (2014). Upper thermal limits of cardiac function for Arctic cod boreogadus saida, a key food web fish species in the Arctic Ocean. J. Fish Biol. 84, 1781–1792. doi: 10.1111/jfb.12397
Drost, H., Carmack, E., and Farrell, A. (2016). Acclimation potential of Arctic cod Boreogadus saida from the rapidly warming Arctic Ocean. J. Exp. Biol. 219, 3114–3125. doi: 10.1242/jeb.140194
Dufresne, J.-L., Foujols, M.-A., Denvil, S., Caubel, A., Marti, O., Aumont, O., et al. (2013). Climate change projections using the IPSL-CM5 earth system model: from CMIP3 to CMIP5. Clim. Dyn. 40, 2123–2165. doi: 10.1007/s00382-012-1636-1
Dunne, J. P., John, J., Shevliakova, E., Stouffer, R. J., Krasting, J. P., Malyshev, S., et al. (2013). GFDL's ESM2 global coupled climate-carbon earth system models part II: Carbon system formulation and baseline simulation characteristics. J. Clim. 26, 2247–2267. doi: 10.1175/JCLI-D-12-00150.1
Dunne, J. P., John, J. G., Adcroft, A. J., Griffies, S. M., Hallberg, R. W., Shevliakova, E., et al. (2012). GFDL's ESM2 global coupled climate-carbon earth system models. Part I: physical formulation and baseline simulation characteristics. J. Clim. 25, 6646–6665. doi: 10.1175/JCLI-D-11-00560.1
Duyck, S. (2015). The Paris Agreement and the protection of human rights in a changing climate. Yearb. Int. Environ. Law 26, 3–45. doi: 10.1093/yiel/yvx011
Egeland, G., Johnson-Down, L., Cao, Z., Sheikh, N., and Weiler, H. (2011). Food insecurity and nutrition transition combine to affect nutrient intakes in canadian arctic communities. J. Nutr. 141, 1746–1753. doi: 10.3945/jn.111.139006
Farrell, A. (2016). Pragmatic perspective on aerobic scope: peaking, plummeting, pejus and apportioning. J. Fish Biol. 88, 322–343. doi: 10.1111/jfb.12789
Farrell, A., Altimiras, J., Franklin, C., and Axelsson, M. (2013). Niche expansion of the shorthorn sculpin to Arctic waters is supported by a thermal independence of cardiac performance at low temperature. Can. J. Zool. 91, 1–8. doi: 10.1139/cjz-2013-0038
Farrell, A., and Franklin, C. (2016). Recognizing thermal plasticity in fish. Science 351, 132–133. doi: 10.1126/science.351.6269.132-b
Farrell, A., Hinch, S., Cooke, S., Crossin, D. P. G., Lapointe, M., and Mathes, M. (2008). Pacific salmon in hot water: applying aerobic scope models and biotelemetry to predict the success of spawning migrations. Physiol. Biochem. Zool. 81, 697–708. doi: 10.1086/592057
Ferreira, E., Anttila, K., and Farrell, A. (2014). Thermal optima and tolerance in the eurythermic goldfish (Carassius auratus): relationships between whole-animal aerobic capacity and maximum heart rate. Physiol. Biochem. Zool. 87, 599–611. doi: 10.1086/677317
Ford, J. (2009). Dangerous climate change and the importance of adaptation for the arctic's inuit population. Environ. Res. Lett. 4:9. doi: 10.1088/1748-9326/4/2/024006
Ford, J., McDowell, G., and Jones, J. (2014). The state of climate change adaptation in the arctic. Environ. Res. Lett. 9:104005. doi: 10.1088/1748-9326/9/10/104005
Ford, J., and Pearce, T. (2010). What we know, do not know, and need to know about climate change vulnerability in the western canadian arctic: a systematic literature review. Environ. Res. Lett. 5:9. doi: 10.1088/1748-9326/5/1/014008
Fortier, L., and Leggett (1985). A drift study of larval fish survival. Mar. Ecol. Prog. Ser. 25, 245–257. doi: 10.3354/meps025245
Frainer, A., Primicerio, R., Kortsch, S., Aune, M., Dolgov, A., Fossheim, M., et al. (2017). Climate-driven changes in functional biogeography of arctic marine fish communities. Proc. Natl. Acad. Sci. U.S.A. 114, 12203–12207. doi: 10.1073/pnas.1706080114
Franklin, C., Davison, W., and Seebacher, F. (2007). Antarctic fish can compensate for rising temperatures: thermal acclimation of cardiac performance in pagothenia borchgrevinki. J. Exp. Biol. 210, 3068–3074. doi: 10.1242/jeb.003137
Friddell, J., Michaud, J., Warwick, V., and LeDew, E. (2013). “The polar data catalogue: best practices for sharing and archiving Canada's polar data,” in Proceedings of the International Forum on Polar Data Activities in Global Data Systems, ed W. I. P. Office (Tokyo), 6–8.
Froese, R., and Pauly, D. (2018). Fishbase. World Wide Web Electronic Publication. version (02/2018). Available online at: https://www.fishbase.org. (accessed February, 2018).
Galloway, T., Young, K., and Egeland, G. (2010). Emerging obesity among preschool-aged canadian inuit children: results from the nunavut inuit child health survey. Int. J. Circumpolar Health 69, 151–157. doi: 10.3402/ijch.v69i2.17437
Gaston, A., Woo, K., and Hipfner, J. (2003). Trends in forage fish populations in northern hudson bay since 1981, as determined from the diet of nestling thick-billed murres uria lomvia. Arctic 56, 227–233. doi: 10.14430/arctic618
Gilbert, M., Fortier, L., and Ponton, D. (1992). Feeding ecology of marine fish larvae across the great whale river plume in seasonally ice-covered southeastern hudson bay. Mar. Ecol. Prog. Ser. 84, 19–30. doi: 10.3354/meps084019
Giorgetta, M. A., Jungclaus, J. H., Reick, C. H., Legutke, S., Brovkin, V., Bader, J., et al. (2013). Climate and carbon cycle changes from 1850 to 2100 in MPI-ESM simulations for the coupled model intercomparison project phase 5. J. Adv. Model. Earth Syst. 5, 572–597. doi: 10.1002/jame.20038
Hansen, M., Nielsen, T., Stedmon, C., and Munk, P. (2012). Oceanographic regime shift during 1997 in Disko Bay, Western Greenland. Limnol. Oceanogr. 57, 634–644. doi: 10.4319/lo.2012.57.2.0634
Harwood, L., Smith, T., George, J., Sandstrom, S., Walkusz, W., and Divoky, G. (2015). Change in the beaufort sea ecosystem: diverging trends in body condition and/or production in five marine vertebrate species. Prog. Oceanogr. 136, 263–273. doi: 10.1016/j.pocean.2015.05.003
Hayashida, H. (2018). Modelling Sea-Ice and Oceanic Dimethylsulfide Production and Emissions in the Arctic. Ph.D. thesis, School of Earth and Ocean Sciences, University of Victoria.
Hayashida, H., Christian, J., Holdsworth, A., Hu, X., Monahan, A., Mortenson, E., et al. (2018). CSIB v1: a sea-ice biogeochemical model for the NEMO community ocean modelling framework. Geosci. Model Dev. Discuss. doi: 10.5194/gmd-2018-191
Hoover, C., Pitcher, T., and Christensen, V. (2013a). Effects of hunting, fishing and climate change on the Hudson Bay marine ecosystem: I. re-creating past changes 1970-2009. Ecol. Modell. 264, 130–142. doi: 10.1016/j.ecolmodel.2013.02.005
Hoover, C., Pitcher, T., and Christensen, V. (2013b). Effects of hunting, fishing and climate change on the hudson bay marine ecosystem: II. Ecosystem model future projections. Ecol. Modell. 264, 130–142.
Hop, H., and Gjøsæter, H. (2013). Polar cod (boreogadus saida) and capelin (Mallotus villosus) as key species in marine food webs of the arctic and the barents sea. Mar. Biol. Res. 9, 878–894. doi: 10.1080/17451000.2013.775458
Hop, H., and Tonn, W. (1998). Gastric evacuation rates and daily rations of arctic cod (Boreogadus saida) at low temperatures. Polar Biol. 19, 293–330. doi: 10.1007/s003000050249
Hu, X., and Myers, P. (2013). A lagrangian view of pacific water inflow pathways in the arctic ocean during model spin-up. Ocean Model. 71, 66–80. doi: 10.1016/j.ocemod.2013.06.007
Hu, X., and Myers, P. (2014). Changes to the Canadian Arctic Archipelago sea ice and freshwater fluxes in the 21st century under the IPCC A1B climate scenario. Atmosphere-Ocean 52, 331–350. doi: 10.1080/07055900.2014.942592
Ilyina, T., Six, K. D., Segschneider, J., Maier-Reimer, E., Li, H., and Nunez-Riboni, I. (2013). The global ocean biogeochemistry model HAMOCC: model architecture and performance as component of the MPI-Earth System Model in different CMIP5 experimental realizations. J. Adv. Model. Earth Syst. 5, 287–315. doi: 10.1029/2012MS000178
Kirtman, B., Power, S., Adedoyin, J., Boer, G., Bojariu, R., Camilloni, I., et al. (2013). “Near-term climate change: projections and predictability,” in Climate Change 2013: The Physical Science Basis. Contribution of Working Group I to the Fifth Assessment Report of the Intergovernmental Panel on Climate Change (New York, NY: Cambridge University Press).
Klein, D., Carazo, M., Doelle, M., Bulmer, J., and Higham, A. (eds.) (2017). The Paris Agreement on Climate Change: Analysis and Commentary. New York, NY; Croydon: CPI Group Ltd.
Knutti, R., and Sedlláçek, J. (2013). Robustness and uncertainties in the new CMIP5 climate model projections. Nat. Clim. Change 3, 369–373. doi: 10.1038/nclimate1716
Kohlbach, D., Graeve, M., Lange, B., David, C., Peeken, I., and Flores, H. (2016). The importance of ice algae- produced carbon in the central arctic ocean ecosystem: food web relationships revealed by lipid and stable isotope analyses. Limnol. Oceanogr. 61, 2027–2044. doi: 10.1002/lno.10351
Kohlbach, D., Schaafsma, F., Graeve, M., Lebreton, B., Lange, B., David, C., et al. (2017). Strong linkage of polar cod (Boreogadus saida) to sea ice algae-produced carbon: evidence from stomach content, fatty acid and stable isotope analyses. Prog. Oceanogr. 152, 62–74. doi: 10.1016/j.pocean.2017.02.003
Kroeker, K., Kordas, R., Crim, R., Hendriks, I., Ramajo, L., Singh, G., et al. (2013). Impacts of ocean acidification on marine organisms: quantifying sensitivities and interaction with warming. Glob. Chang. Biol. 19, 1884–1896. doi: 10.1111/gcb.12179
Kunz, K., Claireaux, G., Pörtner, H.-O., Knust, R., and Mark, F. (2018). Aerobic capacities and swimming performance of polar cod (Boreogadus saida; lepechin) under ocean acidification and warming conditions. J. Exp. Biol. 221:jeb184473. doi: 10.1242/jeb.184473
Kunz, K., Frickenhaus, S., Hardenberg, S., Johansen, T., Leo, E., Pörtner, H.-O., et al. (2016). New encounters in arctic waters: a comparison of metabolism and performance of polar cod (Boreogadus saida) and atlantic cod (Gadus morhua) under ocean acidification and warming. Polar Biol. 39, 1137–1153. doi: 10.1007/s00300-016-1932-z
Lam, V., Sumaila, U., Dyck, A., Pauly, D., and Watson, R. (2011). Construction and potential applications of a global cost of fishing database. ICES J. Mar. Sci. 68, 1–9. doi: 10.1093/icesjms/fsr121
Lanning, G., Storch, D., and Pörtner, H. (2015). Aerobic mitochondrial capacities in antarctic and temperate eelpout (zoarcidae) subjected to warm versus cold acclimation. Polar Biol. 28, 575–584. doi: 10.1007/s00300-005-0730-9
Laurel, B., Spencer, M., Iseri, P., and Copema, L. (2015). Temperature-dependent growth and behavior of juvenile arctic cod (boreogadus saida) and co-occurring north pacific gadids. Polar Biol. 39, 1127–1135. doi: 10.1007/s00300-015-1761-5
Lawson, J., Magalhaes, A., and Miller, E. (1998). Important prey species of marine vertebrate predators in the northwest atlantic: proximate composition and energy density. Mar. Ecol. Prog. Ser. 164, 13–20. doi: 10.3354/meps164013
Leo, E., Kunz, K., Schmidt, M., Storch, D., Pörtner, H.-O., and Mark, F. (2017). Mitochondrial acclimation potential to ocean acidification and warming of polar cod (Boreogadus saida) and atlantic cod (Gadus morhua). Front. Zool. 14:21. doi: 10.1186/s12983-017-0205-1
Lischka, S., and Riebesell (2012). Synergistic effects of ocean acidification and warming on overwintering pteropods in the arctic. Global Change Biol. 18, 3517–3528. doi: 10.1111/gcb.12020
Loder, J., and van der Baaren, A. (2013). Climate Change Projections for the Northwest Atlantic From Six CMIP5 Earth System Models. Canadian Technical Report of Hydrography and Ocean Sciences 286; Fisheries and Oceans Canada.
Lønne, O., and Gulliksen, B. (1989). Size, age and diet of polar cod, boreogadus saida (lepechin 1773), in ice covered waters. Polar Biol. 9, 187–191. doi: 10.1007/BF00297174
Loseto, L., Hoover, C., Ostertag, S., Whalen, D., Pearce, T., Paulic, J., et al. (2018). Beluga whales (delphinapterus leucas), environmental change and marine protected areas in the Western Canadian Arctic. Estuar. Coast. Shelf Sci. 212, 128–137. doi: 10.1016/j.ecss.2018.05.026
Loseto, L., Stern, G., Connelly, T., Deibel, D., Gemmill, B., Prokopowicz, A., et al. (2009). Summer diet of beluga whales inferred by fatty acid analysis of the eastern beaufort sea food web. J. Exp. Mar. Biol. Ecol. 374, 12–18. doi: 10.1016/j.jembe.2009.03.015
Lowry, L., Frost, K., and Burns, J. (1978). Food of ringed seals and bowhead whales near point barrow, Alaska. Can. Field-Naturalist 92, 67–70.
Majewski, A., Atchison, S., MacPhee, S., Eert, J., Niemi, A., Michel, C., et al. (2017). Marine fish community structure and habitat associations on the Canadian Beaufort shelf and slope. Deep-Sea Res. Part I 121, 169–182. doi: 10.1016/j.dsr.2017.01.009
Majewski, A., Lynn, B., Lowdon, M., Williams, W., and Reist, J. (2013). Community composition of demersal marine fishes on the Canadian Beaufort shelf and at Herschel Island, Yukon Territory. J. Mar. Syst. 127, 55–64. doi: 10.1016/j.jmarsys.2013.05.012
Majewski, A., Walkusz, W., Lynn, B., Atchison, S., Eert, J., and Reist, J. (2015). Distribution and diet of demersal arctic cod, (Boreogadus saida), in relation to habitat characteristics in the Canadian Beaufort Sea. Polar Biol. 39, 1087–1098. doi: 10.1007/s00300-015-1857-y
Masson-Delmotte, V., Zhai, P., Pörtner, H., Roberts, D., Skea, J., Shukla, P., et al. (eds.). (2018). “Summary for policymakers,” in Global Warming of 1.5°C. An IPCC Special Report on the Impacts of Global Warming of 1.5°C Above Pre-industrial Levels and Related Global Greenhouse Gas Emission Pathways, in the Context of Strengthening the Global Response to the Threat of Climate Change, Sustainable Development, and Efforts to Eradicate Poverty (Geneva: World Meteorological Organization), 32.
McCrimmon, D. (2016). The athabaskan petition to the inter- american human rights commission: Using human rights to respond to climate change. Polar J. 6, 398–416. doi: 10.1080/2154896X.2016.1241484
McDorman, T. (2009). Salt Water Neighbours: International Ocean Law Relations Between Canada and the United States. New York, NY: Oxford University Press.
McGregor, J. (2018). Premiers Vent Over Climate Change ‘Goal Posts’ and Internal Trade at First Ministers Meeting. CBC News. Available online at: https://www.cbc.ca/news/politics/friday-first-ministers-montreal-1.4936364. (accessed January, 2019).
Mcnicholl, D., Walkusz, W., Davoren, G., Majewski, A., and Reist, J. (2016). Dietary characteristics of co-occurring polar cod (Boreogadus saida) and capelin (Mallotus villosus) in the Canadian arctic. Polar Biol. 39, 1099–1108. doi: 10.1007/s00300-015-1834-5
Miller, L., Macdonald, R., Mucci, A., Yamamoto-Kawai, M., Giesbrecht, K., McLaughlin, F., et al. (2014). Changes in the marine carbonate system of the western arctic: patterns in a rescued data set. Polar Res. 33:20577. doi: 10.3402/polar.v33.20577
Moore, S., and Gulland, F. (2014). Linking marine mammal and ocean health in the 'new normal' arctic. Ocean Coast. Manag. 102, 55–57. doi: 10.1016/j.ocecoaman.2014.08.011
Moss, R. H., Edmonds, J. A., Hibbard, K. A., Manning, M. R., Rose, S. K., van Vuuren, D. P., et al. (2010). The next generation of scenarios for climate change research and assessment. Nature 463, 747–756. doi: 10.1038/nature08823
Munday, P., Crawley, N., and Nilsson, G. (2009). Interacting effects of elevated temperature and ocean acidification on the aerobic performance of coral reef fishes. Mar. Ecol. Prog. Ser. 388, 235–242. doi: 10.3354/meps08137
Nelson, R., C.J, C. A., Bluhm, N., Conlan, K., and Gradinger, R. (2014). “Biodiversity and biogeography of the lower trophic taxa of the Pacific Arctic region: sensitivities to climate change,” in The Pacific Arctic Region: Ecosystem Status and Trends in a Rapidly Changing Environment eds J. M. Grebmeier and W. Maslowski (Dordrecht: Springer Publishing), 269–336.
Nelson, R., Carmack, E., McLaughlin, F., and Cooper, G. (2009). Penetration of pacific zooplankton into the western arctic ocean tracked with molecular population genetics. Mar. Ecol. Prog. Ser. 381, 129–138. doi: 10.3354/meps07940
Oral, N. (2018). Ocean acidification: falling between the legal cracks of UNCLOS and the UNFCCC? Ecol. Law Q. 45, 10–30.
Ostertag, S., Loseto, L., Snow, K., Lam, J., Hynes, K., and Gillman, D. (2018). “that's how we know they're healthy”: the inclusion of traditional ecological knowledge in beluga health monitoring in the inuvialuit settlement region. Arctic Sci. 4, 292–320.
Osuga, D., and Feeney, R. (1978). Antifreeze glycoproteins from arctic fish. J. Biol. Chem. 253, 5338–5343
Palomares, M., and Pauly, D. (2018). Sealifebase. World Wide Web Electronic Publication. Available online at: https://www.sealifebase.org. (accessed February, 2018).
PAME (2015). Framework for a Pan-Arctic Network of Marine Protected Areas. Tech. rep., PAME International Secretariat, Akureyri.
PAME (2017). PAME MPA-network Toolbox (2015-2017): Area-Based Conservation Measures and Ecological Connectivity. Tech. rep., PAME International Secretariat, Akureyri.
Panasenko, L., and Soboleva, M. (1980). Food interrelations between the barents sea capelin and polar cod. ICES CM 1980:15
Pauly, D. (1980). On the interrelationships between natural mortality, growth parameters, and mean environmental temperature in 175 fish stocks. J. du Cons. CIEM 39, 175–192. doi: 10.1093/icesjms/39.2.175
Pauly, D., Christensen, V., and Walters, C. (2000). Ecopath, ecosim, and ecospace as tools for evaluating ecosystem impact of fisheries. ICES J. Mar. Sci. 57, 697–706. doi: 10.1006/jmsc.2000.0726
Peck, L., Morley, S., Richard, J., and Clark, M. (2014). Acclimation and thermal tolerance in antarctic marine ectotherms. J. Exp. Biol. 217, 16–22. doi: 10.1242/jeb.089946
Pershing, A., Alexander, M., Hernandez, C., Kerr, L., Bris, A. L., Mills, K., et al. (2015). Slow adaptation in the face of rapid warming leads to collapse of the gulf of maine cod fishery. Science 350, 809–812. doi: 10.1126/science.aac9819
Popova, E., Yool, A., Coward, A., Dupont, F., Deal, C., Elliott, S., et al. (2012). What controls primary production in the arctic ocean? Results from an intercomparison of five general circulation models with biogeochemistry. J. Geophys. Res. 117:C00D12. doi: 10.1029/2011JC007112
Pörtner, H. O., and Farrell, A. P. (2008). Ecology, physiology and climate change. Science 322, 690–692. doi: 10.1126/science.1163156
Pörtner, H. O., van Dijk, P. L. M., Hardewig, I., and Sommer, A. (2000). “Levels of metabolic cold adaptation: tradeoffs in eurythermal and stenothermal ectotherms,” in Antarctic Ecosystems: Models for Wider Ecological Understanding, eds W. Davison and C. Howard Williams (Christchurch: Caxton Press).
Qi, D., Chen, L., Chen, B., Gao, Z., Zhong, W., Feely, R. A., et al. (2016). Increase in acidifying water in the Western Arctic Ocean. Nat. Clim. Change 7, 195–199. doi: 10.1038/nclimate3228
Rand, K., and Logerwell, E. (2010). The first demersal trawl survey of benthic fish and invertebrates in the Beaufort Sea since the late 1970s. Polar Biol. 34, 475–488. doi: 10.1007/s00300-010-0900-2
Rapporteur, S. (2017). Report of the Special Rapporteur on the Issue of Human Rights Obligations Relating to the Enjoyment of a Safe, Clean, Healthy and Sustainable Environment. Tech. Rep. A/HRC/34/49.
Robinson, E., and Davison, W. (2008). Antarctic fish can survive prolonged exposure to elevated temperatures. J. Fish Biol. 73, 1676–1689. doi: 10.1111/j.1095-8649.2008.02041.x
Rose, G. (2005). Capelin (Mallotus villosus) distribution and climate: a sea “canary” for marine ecosystem change. ICES J. Mar. Sci. 62, 1524–1530. doi: 10.1016/j.icesjms.2005.05.008
Rose, G., and Leggitt, W. (1990). Predicting variability in catch-per-unit effort in atlantic cod, gadus morhua, trap and gillnet fisheries. J. Fish Biol. 35, 155–161. doi: 10.1111/j.1095-8649.1989.tb03057.x
Saudny, H., Leggee, D., and Egeland, G. (2012). Design and methods of the adult inuit health survey 2007-2008. Int. J. Circumpolar Health 71:19752. doi: 10.3402/ijch.v71i0.19752
Schatz, V., Proelss, A., and Liu, N. (2018). The 2018 agreement to prevent unregulated high seas fisheries in the central arctic ocean: a primer. Eur. J. Int. Law. Available online at: https://www.ejiltalk.org/the-2018-agreement-to-prevent-unregulated-high-seas-fisheries-in-the-central-arctic-ocean-a-primer/ (accessed January, 2019).
Schmidt, M., Gerlach, G., Leo, E., Kunz, K., Swoboda, S., Pörtner, H.-O., et al. (2017). Impact of ocean warming and acidification on the behaviour of two co-occurring gadid species, boreogadus saida and gadus morhua, from svalbard. Mar. Ecol. Prog. Series 571, 183–191. doi: 10.3354/meps12130
Scinocca, J., Kharin, V., Jiao, Y., Qian, M., Lazare, M., Solheim, L., et al. (2015). Coordinated global and regional climate modelling. J. Clim. 29, 17–35. doi: 10.1175/JCLI-D-15-0161.1
Seebacher, F., Davison, W., Lowe, C., and Franklin, C. (2005). A falsification of the thermal specialization paradigm: compensation for elevated temperatures in antarctic fishes. Biol. Lett. 1, 151–154. doi: 10.1098/rsbl.2004.0280
Sibert, J., Hampton, J., Fournier, D., and Bills, P. (1999). An advection-diffusion-reaction model for the estimation of fish movement parameters from tagging data, with application to skipjack tuna (Katsuwonus pelamis). Can. J. Fish. Aquat. Sci. 56, 925–938.
Steiner, N., Azetsu-Scott, K., Hamilton, J., Hedges, K., Hu, X., Janjua, M., et al. (2015a). Observed trends and climate projections affecting marine ecosystems in the canadian arctic. Environ. Rev. 23, 191–239. doi: 10.1139/er-2014-0066
Steiner, N., Drost, H., and Hunter, K. (2018). A Physiological Limits Database for Arctic and Subarctic Aquatic Species. Can. Tech. Rep. Fish. Aquat. Sci. 3256, Fisheries and Oceans Canada.
Steiner, N., Sou, T., Deal, C., Jackson, J., Jin, M., Popova, E., et al. (2015b). The future of the subsurface chlorophyll-a maximum in the canada basin - a model intercomparison. JGR Oceans 121, 387–409.
Steiner, N. S., Christian, J. R., Six, K., Yamamoto, A., and Yamamoto-Kawai, M. (2014). Future ocean acidification in the canada basin and surrounding arctic ocean from cmip5 earth system models. JGR Oceans 119, 332–347. doi: 10.1002/2013JC009069
Stock, C., Alexander, M., Bond, N., Brander, K., Cheung, W., Curchitser, E., et al. (2011). On the use of ipcc-class models to assess the impact of climate on living marine resources. Prog. Oceanogr. 88, 1–27. doi: 10.1016/j.pocean.2010.09.001
Sumaila, U., Marsden, A., Watson, R., and Pauly, D. (2007). A global ex-vessel fish price database: construction and applications. J. Bioeconomics 9, 39–51. doi: 10.1007/s10818-007-9015-4
Sumaila, U., Tai, T., Lam, V., Cheung, W., Bailey, M., Cisneros-Montemayor, A., et al. (2019). Benefits of the paris agreement to ocean life, economies, and people. Sci. Adv. 5:eaau3855. doi: 10.1126/sciadv.aau3855
Suprenand, P. M., Ainsworth, C. H., and Hoover, C. (2018). Ecosystem Model of the Entire Beaufort Sea Marine Ecosystem: A Temporal Tool for Assessing Food-Web Structure and Marine Animal Populations from 1970 to 2014. Marine Science Faculty Publications. 261. Available online at: https://scholarcommons.usf.edu/msc_facpub/261
Swart, N. C., Fyfe, J. C., Hawkins, E., Kay, J. E., and Jahn, A. (2015). Influence of internal variability on arctic sea-ice trends. Nat. Clim. Change 5, 86–89. doi: 10.1038/nclimate2483
Tai, T., Cashion, T., Lam, V., Swartz, W., and Sumaila, U. R. (2017). Ex-vessel fish price database: disaggregating prices for low-priced species from reduction fisheries. Front. Mar. Sci. 4:363. doi: 10.3389/fmars.2017.00363
Taylor, K. E., Stouffer, R. J., and Meehl, G. A. (2012). An overview of CMIP5 and the experiment design. Bull. Amer. Meteor. Soc. 93, 485–498. doi: 10.1175/BAMS-D-11-00094.1
Thor, P., Bailey, A., Dupont, S., Calosi, P., Søreide, J., Wit, P. D., et al. (2017). Contrasting physiological responses to future ocean acidification among arctic copepod populations. Global Change Biol. 24, e365–e377. doi: 10.1111/gcb.13870
Thorsteinson, L., and Love, M. (2016). Alaska Arctic Marine Fish Ecology Catalog: Scientific Investigations Report 2016-. Tech. rep., Bureau of Ocean Energy Management. doi: 10.3133/sir20165038
UNEP (2018). The Emissions Gap Report 2018. Tech. rep., United Nations Environment Programme, Nairobi.
Vancoppenolle, M., Bopp, L., Madec, C., Dunne, J., Ilyina, T., Halloran, P., et al. (2013). Future Arctic primary productivity from CMIP5 simulations: uncertain outcome, but consistent mechanisms. Global Biogeochem. Cycles 27, 605–619. doi: 10.1002/gbc.20055
Walkusz, W., Majewski, A., and Reist, J. (2013). Distribution and diet of the bottom dwelling arctic cod in the canadian beaufort sea. J. Mar. Syst. 127, 65–75. doi: 10.1016/j.jmarsys.2012.04.004
Walkusz, W., Paulic, J., WJ, W. W., Kwasniewski, S., and Papst, M. (2011). Distribution and diet of larval and juvenile arctic cod (Boreogadus saida) in the shallow canadian beaufort sea. J. Mar. Syst. 84, 78–84. doi: 10.1016/j.jmarsys.2010.09.001
Walkusz, W., Williams, W., Harwood, L., Moore, S., Stewart, B., and Kwasniewski, S. (2012). Composition, biomass and energetic content of biota in the vicinity of feeding bowhead whales (Balaena mysticetus) in the cape bathurst upwelling region (south eastern beaufort sea). Deep-Sea Res. I 69, 25–35. doi: 10.1016/j.dsr.2012.05.016
Welch, H., Crawford, R., and Hop, H. (1993). Occurrence of arctic cod (Boreogadus saida) schools and their vulnerability to predation in the canadian high arctic. Arctic 46, 331–339. doi: 10.14430/arctic1361
Winkler, H. (2017). “Mitigation,” in The Paris Agreement on Climate Change: Analysis and Commentary (New York, NY; Croydon: CPI Group Ltd.), 141–165.
Woods, H., and Harrison, J. (2001). The beneficial acclimation hypothesis versus acclimation of specific traits: physiological change in water-stressed manduca sexta caterpillars. Physiol. Biochem. Zool. 74, 32–44. doi: 10.1086/319302
Zahariev, K., Christian, J., and Denman, K. (2008). A global ocean carbon model with parameterizations of iron limitation, calcification and N2 fixation; preindustrial, historical and fertilization simulations. Prog. Oceanogr. 77, 56–82. doi: 10.1016/j.pocean.2008.01.007
Zeller, D., Booth, S., Pakhomov, E., Swartz, W., and Pauly, D. (2011). Arctic fisheries catches in Russia, USA, and Canada: baselines for neglected ecosystems. Polar Biol. 34, 955–973. doi: 10.1007/s00300-010-0952-3
Zhou, Y., Kubow, S., and Egeland, G. M. (2011). Highly unsaturated n-3 fatty acids status of canadian inuit: international polar year inuit health survey, 2007-2008. Int. J. Circumpolar Health 70, 498–510. doi: 10.3402/ijch.v70i5.17864
Keywords: climate change, Arctic cod, subsistence fisheries, Canadian Arctic, Arctic change, Arctic ecosystems
Citation: Steiner NS, Cheung WWL, Cisneros-Montemayor AM, Drost H, Hayashida H, Hoover C, Lam J, Sou T, Sumaila UR, Suprenand P, Tai TC and VanderZwaag DL (2019) Impacts of the Changing Ocean-Sea Ice System on the Key Forage Fish Arctic Cod (Boreogadus Saida) and Subsistence Fisheries in the Western Canadian Arctic—Evaluating Linked Climate, Ecosystem and Economic (CEE) Models. Front. Mar. Sci. 6:179. doi: 10.3389/fmars.2019.00179
Received: 26 September 2018; Accepted: 20 March 2019;
Published: 10 April 2019.
Edited by:
Benjamin Allen Lange, Freshwater Institute, Fisheries and Oceans Canada, CanadaReviewed by:
Maria Vernet, University of California, San Diego, United StatesUte Daewel, Helmholtz Centre for Materials and Coastal Research (HZG), Germany
Copyright © 2019 Steiner, Cheung, Cisneros-Montemayor, Drost, Hayashida, Hoover, Lam, Sou, Sumaila, Suprenand, Tai and VanderZwaag. This is an open-access article distributed under the terms of the Creative Commons Attribution License (CC BY). The use, distribution or reproduction in other forums is permitted, provided the original author(s) and the copyright owner(s) are credited and that the original publication in this journal is cited, in accordance with accepted academic practice. No use, distribution or reproduction is permitted which does not comply with these terms.
*Correspondence: Nadja S. Steiner, bmFkamEuc3RlaW5lckBkZm8tbXBvLmdjLmNh