 Jacob Carstensen
 Anna Olszewska
 Slawomir Kwasniewski
- 1Department of Bioscience, Aarhus University, Roskilde, Denmark
- 2Arctic Research Centre, Aarhus University, Aarhus C, Denmark
- 3Institute of Oceanology, Polish Academy of Sciences, Sopot, Poland
Marine ecosystems in Arctic regions are expected to undergo large changes, driven by sea ice retreat and increasing influence of warmer and saline waters. We examined changes in the hydrography and mesozooplankton from a 14-year long time series in the West Spitsbergen Current during the summer period. The aim was to provide a contemporary description of spatial and temporal variations in the zooplankton community inhabiting the surface layer (0–60 m), over an area extending 6 latitudinal degrees and nearly 20 longitudinal degrees. A total of 296 samples were partitioned into three groups, based on salinity and temperature signatures, representing the western, eastern, and coastal branches of the West Spitsbergen Current. Only the waters of the eastern branch, influenced by north-flowing Atlantic water, showed significant temporal trend in salinity, whereas no significant time trend was found for temperature in any of the three branches in the surface layer studied. Zooplankton biomass generally decreased from south to north in the western and eastern branches, suggesting poleward net loss of zooplankton, whereas relatively constant biomass in the coastal branch was likely sustained by higher production at the shelf break. The biomass remained constant over the study period for all three branches. Four species (Calanus finmarchicus, Calanus glacialis, Calanus hyperboreus, and Eukrohnia hamata) contributed almost 90% of the mesozooplankton biomass in all branches, with C. hyperboreus and C. glacialis being relatively important in the western and coastal branches, respectively. Calanus finmarchicus became increasingly important over time in the eastern branch, almost doubling its biomass and contributing more than 50% of the total biomass at the end of the study period. This increase was not associated with a general tendency toward more mature stages. C. finmarchicus copepodid CV and adults constituted > 80% of this species biomass in the western and eastern branches. In general, the relatively long time series, for Arctic standards, could not confirm expected drastic trends, but showed subtle changes over time overlaid by considerable interannual variability. Given the large inherent variability in zooplankton data, time series extending more than 14 years are needed for assessing trends in the West Spitsbergen Current.
Introduction
Sea ice is rapidly retreating and thinning in the Arctic (Carstensen and Weydmann, 2012), potentially rendering the area ice-free in summer by 2030 (Stroeve et al., 2012). Increasing area and period with open water has enhanced primary production in the Arctic, particularly along shelf breaks where upwelling of nutrient-rich waters stimulate phytoplankton growth (Arrigo and van Dijken, 2015). Since phytoplankton constitute the base of the Arctic food web, changes in the spatial and temporal distribution of primary production will essentially affect all organisms at higher trophic levels. Mesozooplankton plays a central mediating role in the Arctic food webs as grazers of the primary production and food source for fish (e.g., Gislason and Astthorsson, 2002), bird (e.g., Karnovsky et al., 2003) and whale populations (e.g., Heide-Jørgensen and Acquarone, 2002). However, whereas spatial and temporal changes in surface primary production largely can be assessed through remote sensing (Matrai et al., 2013), this is not possible for mesozooplankton yet and consequently, our knowledge on the distribution of the mesozooplankton community remains limited.
Over the past 2–3 decades, research cruises have been the main vehicle for studying mesozooplankton in the Arctic and sub-Arctic, but such isolated expeditions are not optimal for quantifying distribution pattern over time and space. There are only few examples of consistent monitoring in the Arctic region, suitable for analyzing changes in biological communities over time. The Hausgarten observatory is probably the most well-known Arctic research infrastructure that has delivered insight into seasonal and long-term changes in numerous biological variables in Fram Strait, the only deep-water connection between the Arctic Ocean and the Nordic Seas (Soltwedel et al., 2015). Another long-term monitoring effort in this region is carried out by the Institute of Oceanology of the Polish Academy of Sciences (IO PAN), where zooplankton has been sampled along a number of latitudinal transects across the West Spitsbergen Current (WSC) since 2001. For Arctic standards, this data set is unique due to its spatial and temporal coverage. While these data have been used to analyze how environmental variables shape the distribution of key Calanus species (Carstensen et al., 2012), zooplankton community structure (Weydmann et al., 2014; Gluchowska et al., 2017a), zooplankton structural and functional diversity (Gluchowska et al., 2017b), and population development of Calanus finmarchicus (Gluchowska et al., 2017a; Weydmann et al., 2018), the spatial and temporal variability in the zooplankton community has not yet been fully explored.
The importance of Atlantic Water (AW) in the WSC varies substantially among years, and many studies suggest its increasing role signified by rising temperature and salinity (Beszczynska-Möller et al., 2012; Gluchowska et al., 2017a). Associated with this trend, Gluchowska et al. (2017a) also found increasing biomass of C. finmarchicus and zooplankton in total in the WSC, but this was analyzed for a single transect located at 76°30′ N. The WSC is the main conduit of AW into the Arctic Ocean (Rudels et al., 2004, 2005; Walczowski et al., 2012), and the combination of increasing primary production, stronger AW transport in the WSC, and increasing zooplankton biomass and dominance of expatriate Atlantic species (e.g., C. finmarchicus) may drastically change the functioning of the Arctic Ocean in the future (Wassmann et al., 2015). Given that the Arctic Ocean most probably will undergo large changes, describing current spatial and temporal variations in the zooplankton community in the WSC will constitute a baseline for future studies.
Therefore, the main objective of this study was to describe temporal variations in the zooplankton community over a 14-year period (2001–2014) across a broad spatial domain (from 73°30′ N to 78°50′ N) in the WSC during the summer period. In particular, we addressed the questions:
(1) What are the key species, in terms of biomass, and how are they distributed over time and space in this large area?
(2) Is there supporting evidence for increasing contribution of AW associated species in the WSC zooplankton community?
(3) Is the WSC a simple conduit of zooplankton or are there sources/sinks along the northbound transport?
(4) Are there consistent time trends in the zooplankton community over the 14-year period?
Materials and Methods
Zooplankton Sampling
Zooplankton was sampled across six latitudinal transects (A–F) spanning across the core of the WSC (Figure 1). A total of 44 stations were sampled over the 14-year period, although only a subset of these were sampled each year. On a few occasions, zooplankton was sampled at locations next to each other and these were associated to the same station name. The number of zooplankton samples ranged from 15 in 2002 to 28 in 2009, and the six transects were sampled with similar intensity over the study period, with each transect typically represented by 3–5 samples from a given year, although there were four occasions where a transect was characterized by one station only or none.
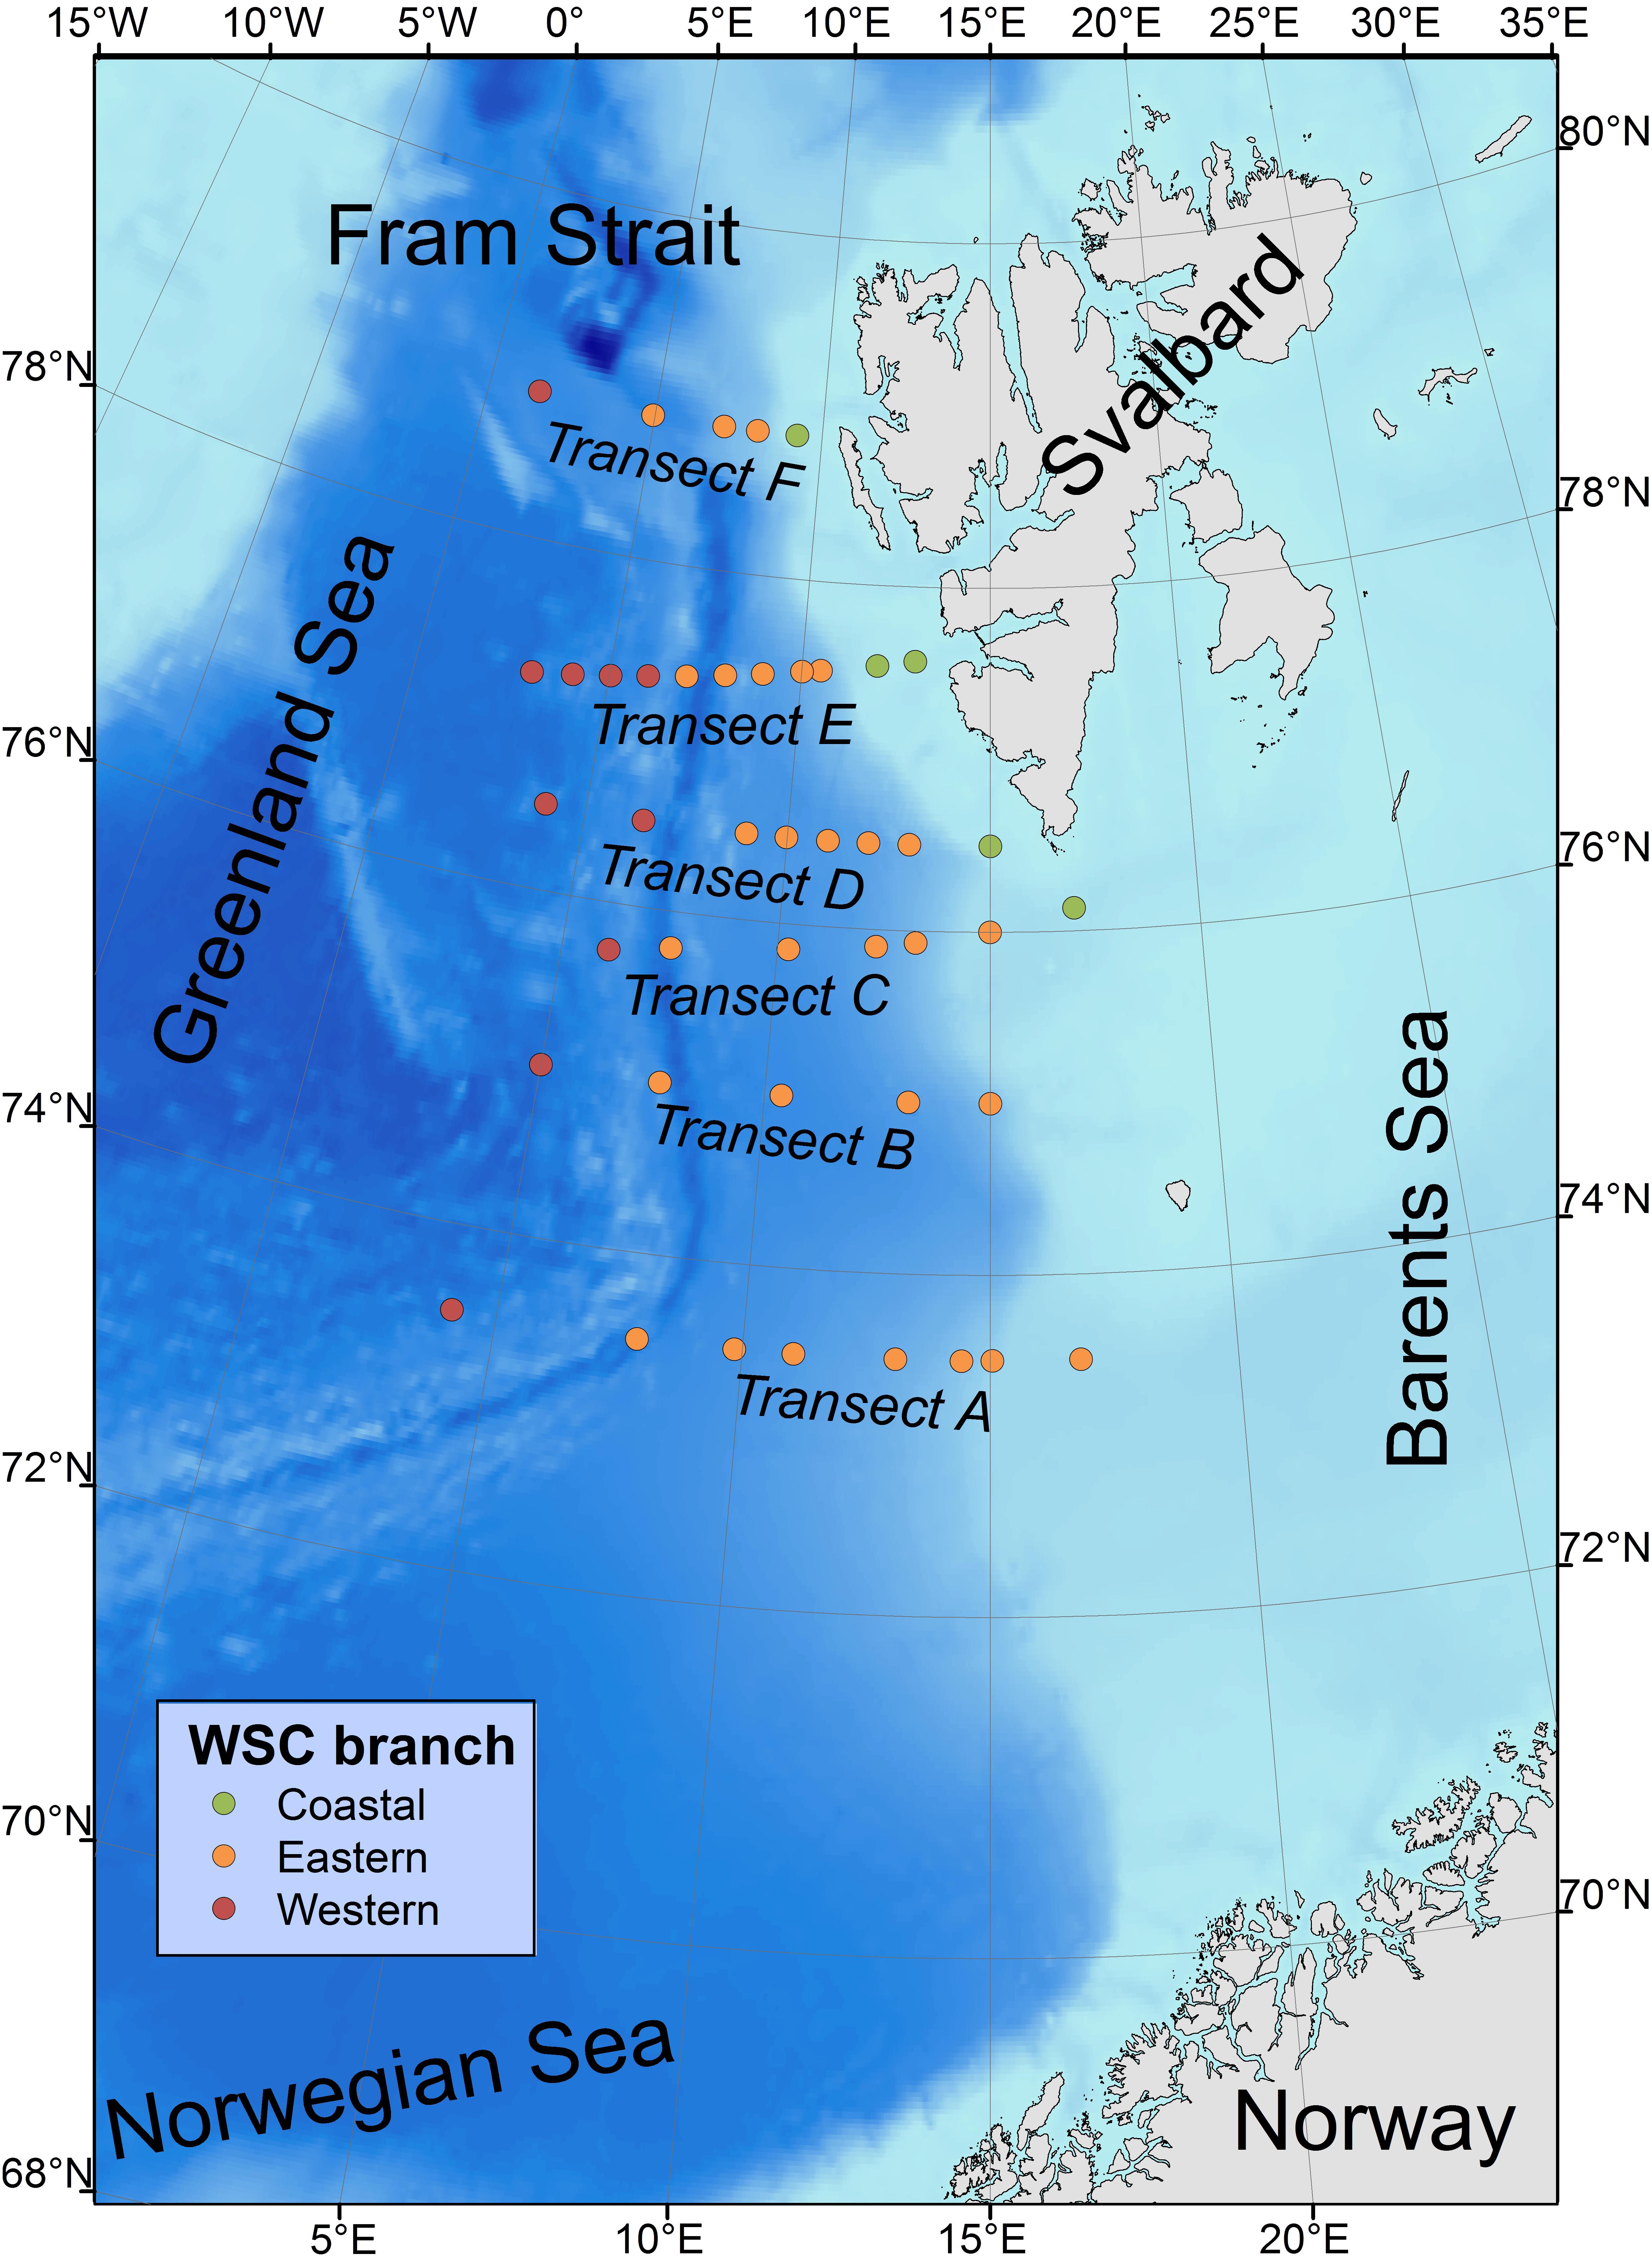
Figure 1. Location of zooplankton sampling stations (2001–2014) in the West Spitsbergen area. Stations are separated into the western, eastern, and coastal branches. Sampling stations are located along transect across the main northward flow direction of the West Spitsbergen Current. Bathymetry is the ETOPO2 from the NOAA National Geophysical Data Center (www.ngdc.noaa.gov).
Sampling typically took place over a 3-week period from end of June to mid-July, and the timing of the cruise was relatively consistent over years shifting by less than 10 calendar days.
At each station, depth-stratified hauls were made using a standard mesozooplankton net of WP-2 type with 0.25 m2 square opening and 0.180 mm mesh size gauze, equipped with mechanical closing device (UNESCO, 1968). The depth stratification of sampling was determined on every station, based on the temperature-salinity distribution profile taken prior to collecting zooplankton. Sampling was conducted in three layers within the epipelagial (the upper 200 m of the sea), the layer within which most of the zooplankton in oceanic waters of the higher latitudes concentrates during summer (Wiborg, 1955; Longhurst and Williams, 1979, Gluchowska et al., 2017b). The depth-stratified net sampling was meant to provide data on vertical distribution patterns of zooplankton in relation to water mass structure, however, this study concerns only the upper mixed layer and the pycnocline (typically 0–60 m), where the zooplankton abundance was the highest. The WP-2 net with 0.180 mm mesh samples typically mesozooplankton (by definition multicellular, heterotrophic organisms with linear size between 0.2–20 mm), therefore we do not have data on smaller (microzooplankton, protoplankton) or larger (macrozooplankton) organisms, but we will refer to our data as zooplankton.
Immediately after sampling, zooplankton were preserved in a 4% solution of formaldehyde in seawater buffered with borax. The samples were analyzed afterward in the laboratory at IO PAN, and zooplankton were identified to the lowest possible taxonomic level, including distinguishing the copepodids developmental stages for C. finmarchicus, Calanus glacialis, Calanus hyperboreus, Pseudocalanus acuspes/minutus, and Paraeuchaeta norvegica (Kwasniewski et al., 2003; Weydmann and Kwasniewski, 2008). Nauplii of Calanoida were also counted, although not identified to species level. Due to the mesh size of the gauze, they were representing predominately Calanus species, and therefore assumed to be distributed among the three species proportionally to relative abundances of their copepodid stages I and II. Zooplankton carbon biomass (mg C m-3) was calculated from abundances using taxon- and stage-specific dry mass values and factors for dry mass to carbon conversion (references in Gluchowska et al., 2017a and unpublished data).
The physical properties of the water column were determined with a Sea-Bird 911 + CTD instrument (for details see Walczowski et al., 2012). Salinity and temperature of the upper mixed layer were found by averaging the CTD profiles taken at each station, over the depth stratum used for zooplankton sampling (here 0–60 m).
Data Analyses
Zooplankton samples were categorized into three different groups according to water mass types present at the station, characteristic for western, eastern and coastal WSC branches, based on visual inspection of temperature and salinity (T-S plots) of the water mass (Supplementary Figure S1). This separation into different branches follows the approaches in previous studies (Carstensen et al., 2012; Weydmann et al., 2014; Gluchowska et al., 2017b), but in contrast to these studies, that used fixed station-specific associations, a flexible approach was applied using transect-specific thresholds for salinity and temperature to identify the eastern branch (Table 1), located in between the two other branches. The WSC eastern branch is characterized by higher temperature and salinity that gradually decrease toward north. Samples not fulfilling these criteria were allocated to either western branch or coastal branch, depending on whether they were located to the west or east, respectively, of those samples on the given transect fulfilling the criteria for the eastern branch. This classification approach was adopted because the eastern branch has a highly distinctive T-S signature, whereas the ones of the two other branches are more variable.
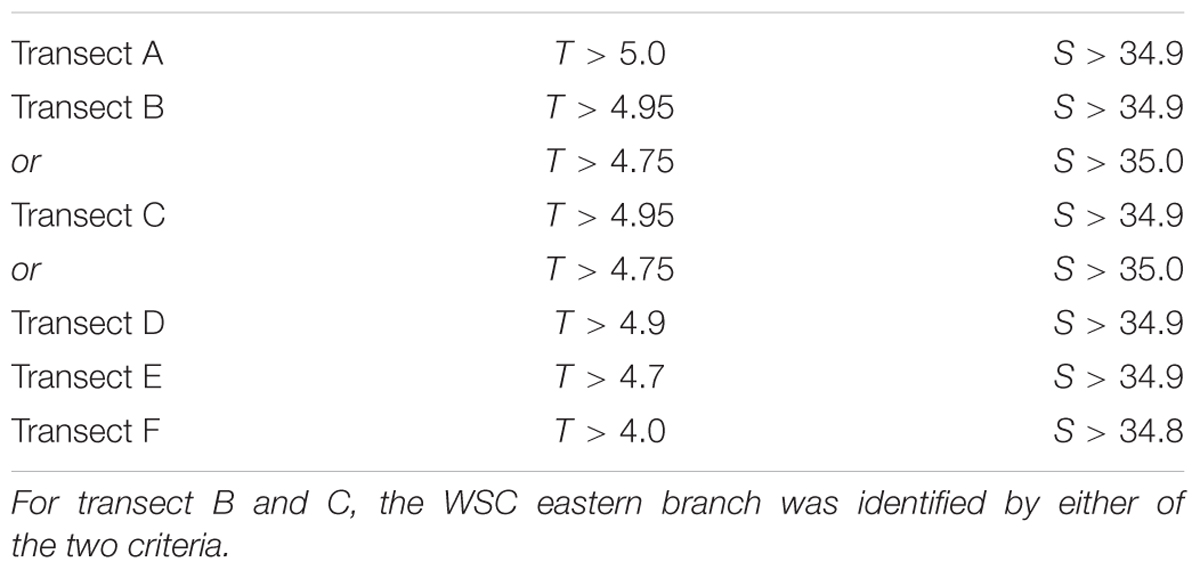
Table 1. Transect-specific criteria for temperature (T) and salinity (S) to identify the WSC eastern branch.
Spatial variation among transects and temporal variation among years for temperature, salinity, and various zooplankton variables (see below) were investigated with a linear mixed model for the three WSC branches separately.
The model described the common spatial (ti, i = 1,..,6) and temporal (yj, j = 1,..,14) trends and assessed the significance of these against the random variation among stations within transects (Sk (ti)), interannual changes in the spatial variation among transects (Ti × Yj), interannual changes in the spatial variation among stations within transects [Yj × Sk (ti)] and residual variation (eijk). The residual variation described the variation between samples within the same year from nearby locations associated with the same station name. Since this sampling pattern only occurred on rare occasions (five in total), the degrees of freedom for estimating residual variation were low and hence, variance estimates for the residual variation relatively uncertain. However, test statistics for common spatial (ti) and temporal (yj) variations depended more strongly on the other sources of random variation [Sk (ti), Ti × Yj, and Yj × Sk (ti)] and were relatively unaffected by residual variation.
In addition to temperature and salinity, the mixed model was employed to the log-transform of biomass of the entire zooplankton community and the most dominant species as well as the logistic transformation of the biomass proportion of the most dominant species. Marginal means of ti (representing transect means across all years) and yj (representing yearly means across all transects) were computed from the parameter estimates of the mixed model. For the log-transformed zooplankton variables, marginal means were back-transformed with the exponential function representing geometric means. Similarly, the inverse logistic transformation was used for calculating geometric means of biomass proportions. Finally, the marginal means of yj were analyzed for systematic trends using linear regression.
Since C. finmarchicus was the predominant species in all three WSC branches, we further analyzed the biomass proportion of different developmental stages over time and transects. Biomass proportions of nauplii, CI to CV, and adults were modeled as nominal variables (i.e., representing consecutive development stages) using a multinomial logistic regression model with the same structure as Eq. 1. Essentially, the model estimated the maturity of the C. finmarchicus population across transects and years based on biomass proportions. Marginal means for the stage-specific biomass proportion were computed from the parameter estimates of the model. Systematic time trends in the stage development were investigated by linear regression of the yj parameters from the model.
Results
A total of 296 samples were grouped into 59, 198, and 39 observations for the WSC western, eastern and coastal branches with distinct T and S signatures (Supplementary Figure S1). These distinctive characteristics were quite clear for all transects except the northernmost Transect F, where the three branches converge (Supplementary Figure S1). The eastern branch had the highest temperature and salinity, whereas the western and coastal branches had similar and lower temperature, but differed from each other in salinity, with the coastal branch having lower salinity among the three branches (Figure 2). The eastern branch exhibited significant spatial trends of decreasing temperature and salinity from south to north, which was partly mirrored for salinity in the western branch. No significant spatial patterns were observed for temperature and salinity in the coastal branch as well as temperature in the western branch (Table 2).
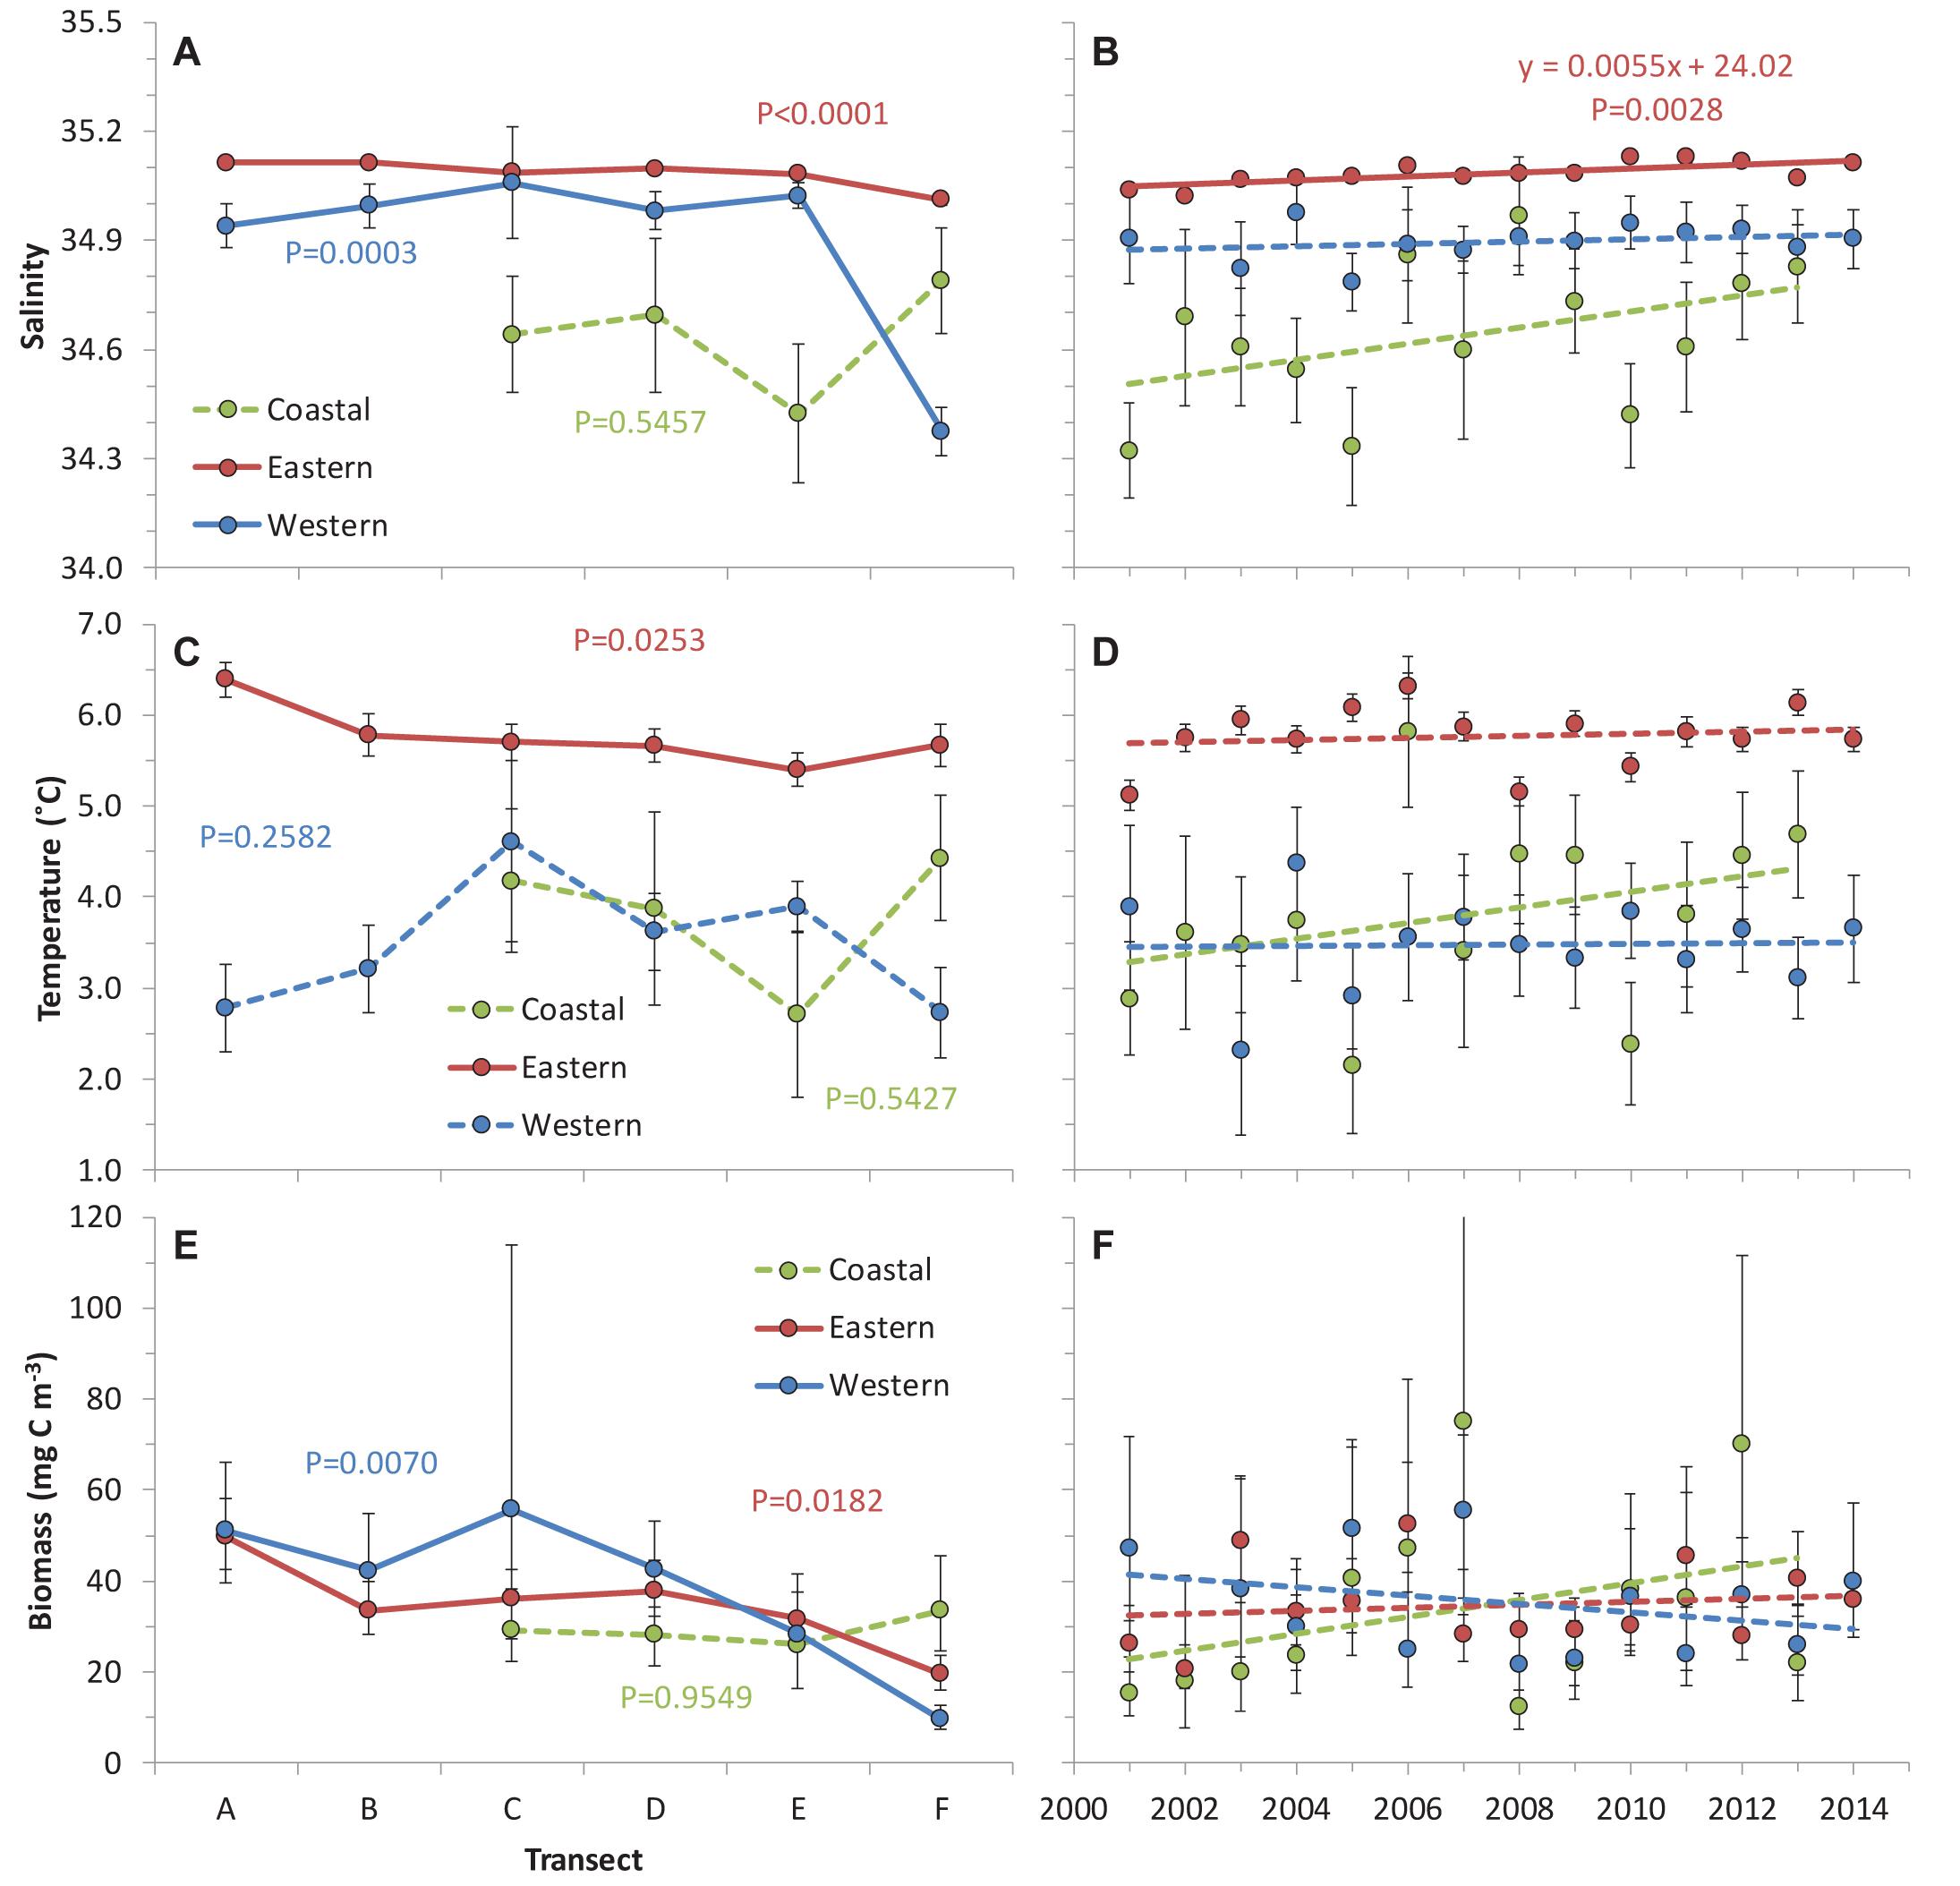
Figure 2. Spatial and temporal trends for salinity (A,B), temperature (C,D) and total mesozooplankton biomass (E,F) for the three branches of the West Spitsbergen Current. Error bars represent the standard error of the marginal means. Significance of the spatial variation from the mixed model (Eq. 1) and linear regression of annual means (only for regression with P < 0.05) are inserted. Non-significant spatial trends and linear time trends are indicated with dashed lines.
Interannual variations among years were significant for both temperature and salinity in the eastern branch (Table 2), exhibiting a significant increase of 0.0055 yr-1 (± 0.0015) for salinity (Figure 2B) and no linear trend for temperature (P = 0.5984) (Figure 2D). There were no systematic temporal trends in the western and coastal branches for neither temperature nor salinity. However, the relatively low number of observations for the western and coastal branches could impede the analysis of temporal and spatial variations.
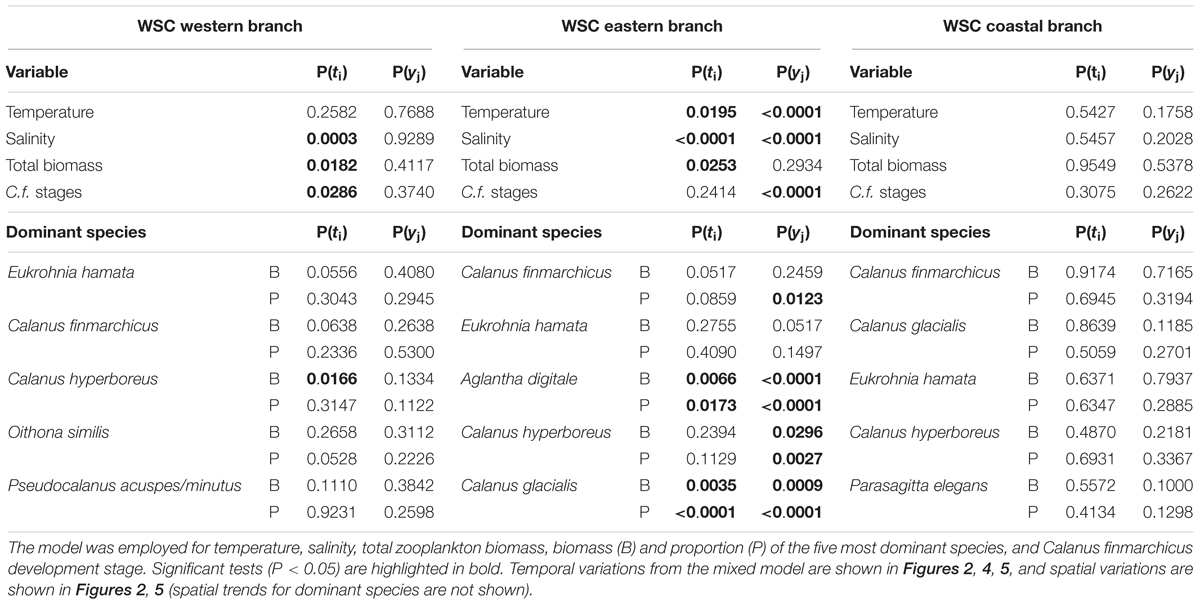
Table 2. Statistical tests (P-values) for variation among transects (ti) and years (yj) in the WSC branches using Eq. 1.
Biomass of the entire zooplankton community attained similar levels across the three branches, but exhibited different spatial gradients (Figure 2E). The western and eastern branches had significant variation across transects, showing declining biomass in the northward direction. The coastal branch did not display significant variation among transects. Moreover, there was no significant variation among years for any of the three branches, despite that marginal means for yj varied by factors 2–4 (Figure 2F). The large standard error of the marginal means and the lack of significance was mainly caused by large random variation in the spatial patterns across years [random factors Ti × Yj and Yj × Sk (ti)] (Supplementary Table S1), i.e., spatial trends in zooplankton biomass were not consistent but highly variable across the 14 years (Supplementary Figure S2).
Zooplankton Community
There were 68 species or genera and 20 taxa of higher rank identified in the zooplankton samples from the West Spitsbergen Current (Supplementary Table S2), representing all important marine zooplankton taxa (at the rank of phylum and class). Most speciose were Copepoda Calanoida (24 species/genera), several taxa were less diverse, among them Amphipoda (7), Cyclopoida (6), Hydromedusae (6), and Euphausiacea (4). The remaining zooplankters were represented by yet less species/genera, for example, Pteropoda (3) and Chaetognatha (3); however, in some cases, species level identification was challenging or impossible due to difficulties in recognizing taxonomic features of specimens fixed in formaldehyde solution (Oikopleura), because of lack of species descriptions (Polychaeta larvae) or because of lack of taxonomic expertise at the time of sample processing (Harpacticoida).
Three Calanus copepods (C. finmarchicus, C. glacialis, and C. hyperboreus) and chaetognatha E. hamata constituted the bulk of the zooplankton biomass in the WSC (Table 3). Zooplankton biomass was almost equally dominated by E. hamata, C. finmarchicus, and C. hyperboreus in the western branch, tallying almost 90% of the total biomass, whereas C. finmarchicus dominated in the eastern and coastal branches, constituting there about half of the biomass. E. hamata was also important for the zooplankton biomass in the eastern branch, whereas C. glacialis contributed about one-third biomass in the coastal branch. In addition to the differences regarding the four bulk biomass species, there were also well-defined spatial patterns across the three branches for other zooplankton species. In the western branch, other important species were Oithona similis, Pseudocalanus (most probably P. minutus), and Themisto abyssorum. In the eastern branch, the two main zooplankton species (C. finmarchicus and E. hamata) were seconded by hydromedusae Aglantha digitale and copepods C. hyperboreus, C. glacialis, and O. similis. In the coastal branch, Parasagitta elegans, Oikopleura, and O. similis were also important biomass contributors in addition to the four bulk biomass species.
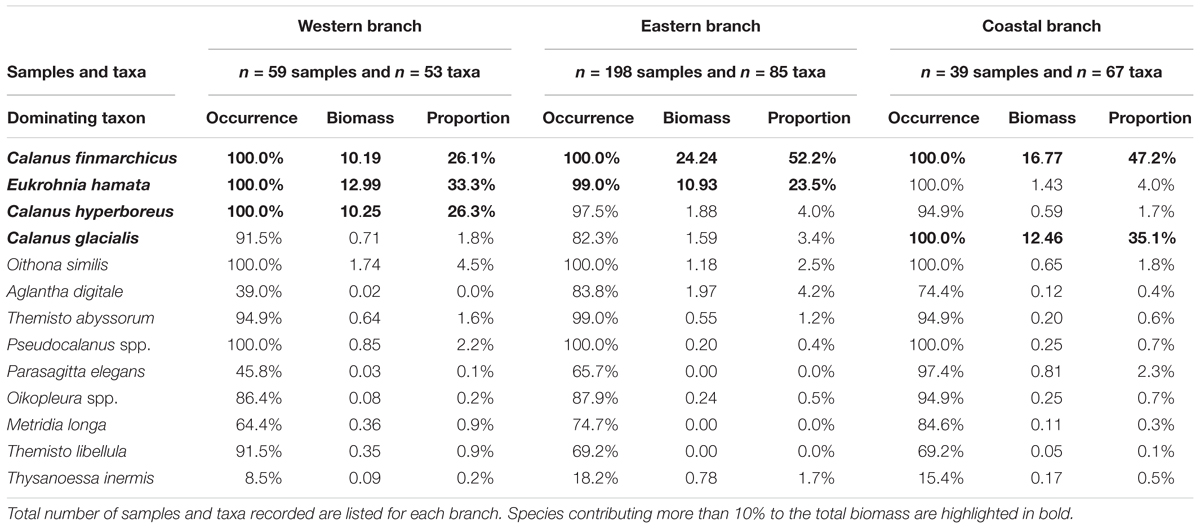
Table 3. Frequency of occurrence, average biomass (mg C m-3) and proportion for the most dominant mesozooplankton species in samples from the West Spitsbergen Current (2001–2014).
In the western branch, C. hyperboreus showed significant latitudinal differences (Table 2), although the significance was not particularly strong. C. hyperboreus was relatively more dominant at the three southern transects (∼30% of biomass) and less dominant at the three northern transects (∼10% of biomass) (Figure 3A). Variations among years were not significant for any of the five most dominating species (Table 2), yet the biomass proportion of Pseudocalanus acuspes/minutus decreased significantly over time due to relatively high biomass in the first years of the study period (Figure 4P). The most pronounced change over time was the increasing biomass (both absolute and relative) of C. glacialis, increasing its presence in the western branch from almost absent to ∼2% in recent years (Figure 4D).
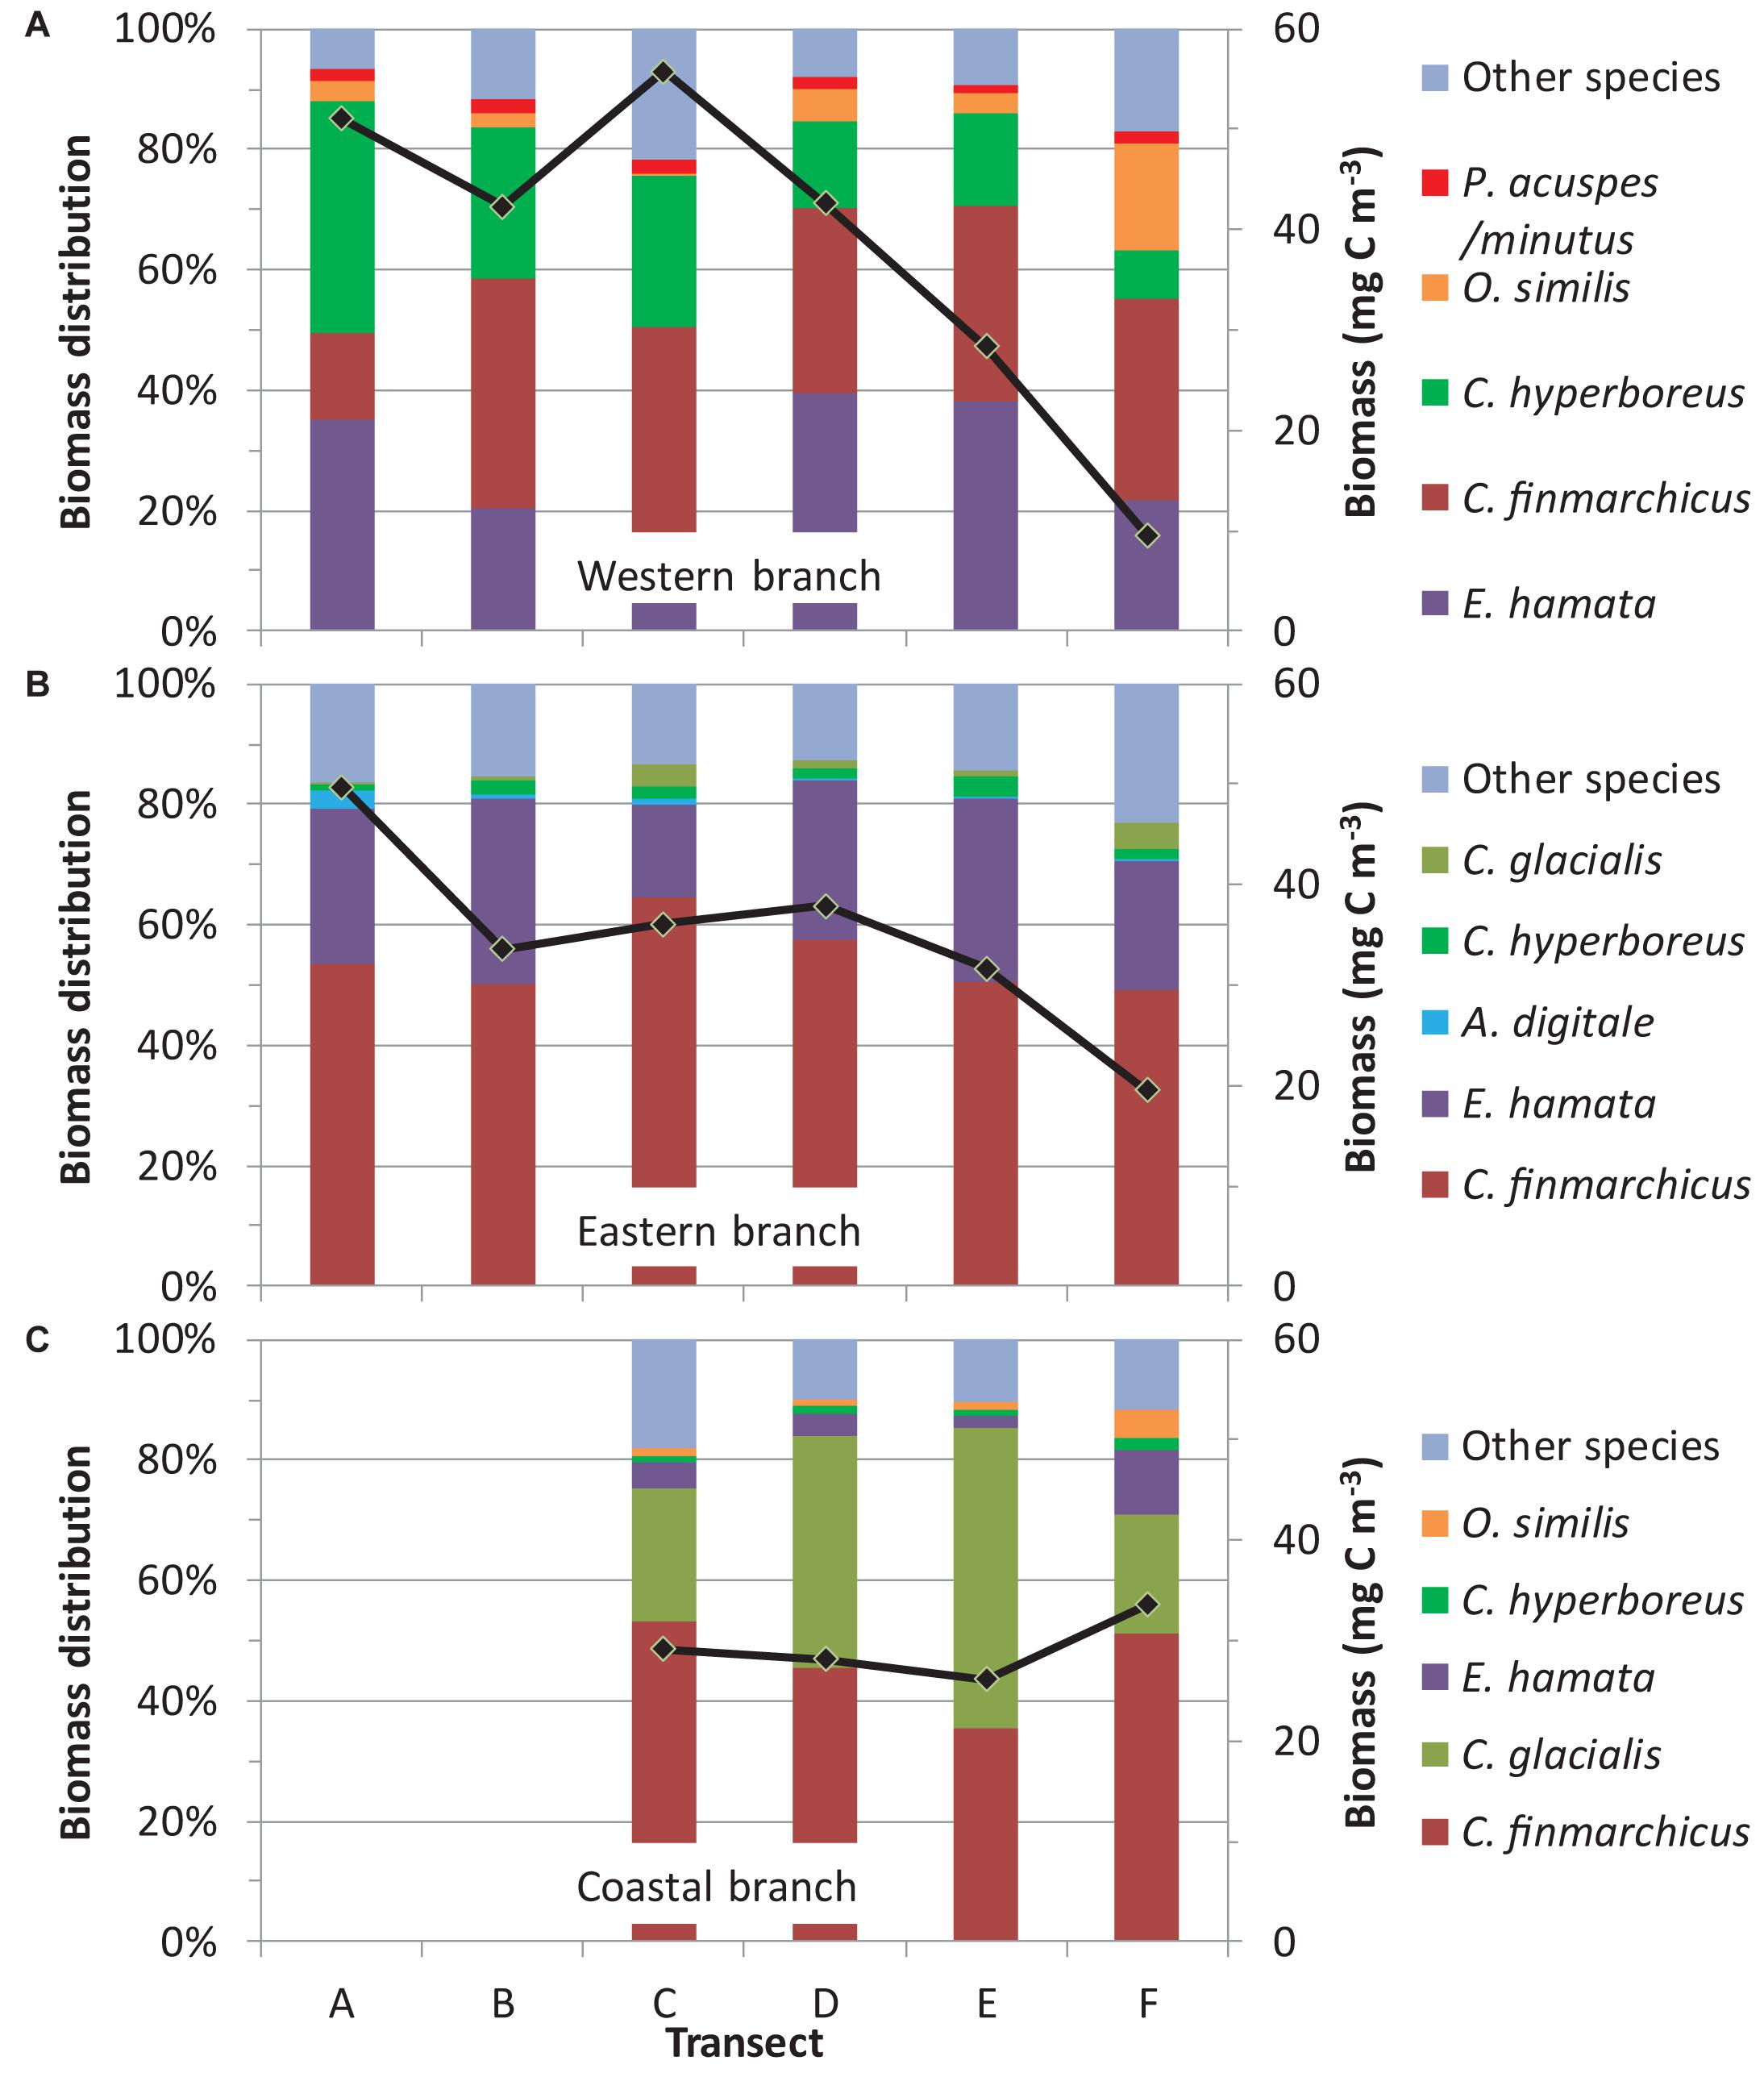
Figure 3. Spatial distribution of dominant mesozooplankton species for the three branches of the West Spitsbergen Current (A: western branch, B: eastern branch, and C: coastal branch). Biomass proportions were modeled using Eq. 1 for the five dominant species in each branch as well as all other species. For comparison with the species distribution the total mean biomass for the different transects is also plotted (cf. Figure 2).
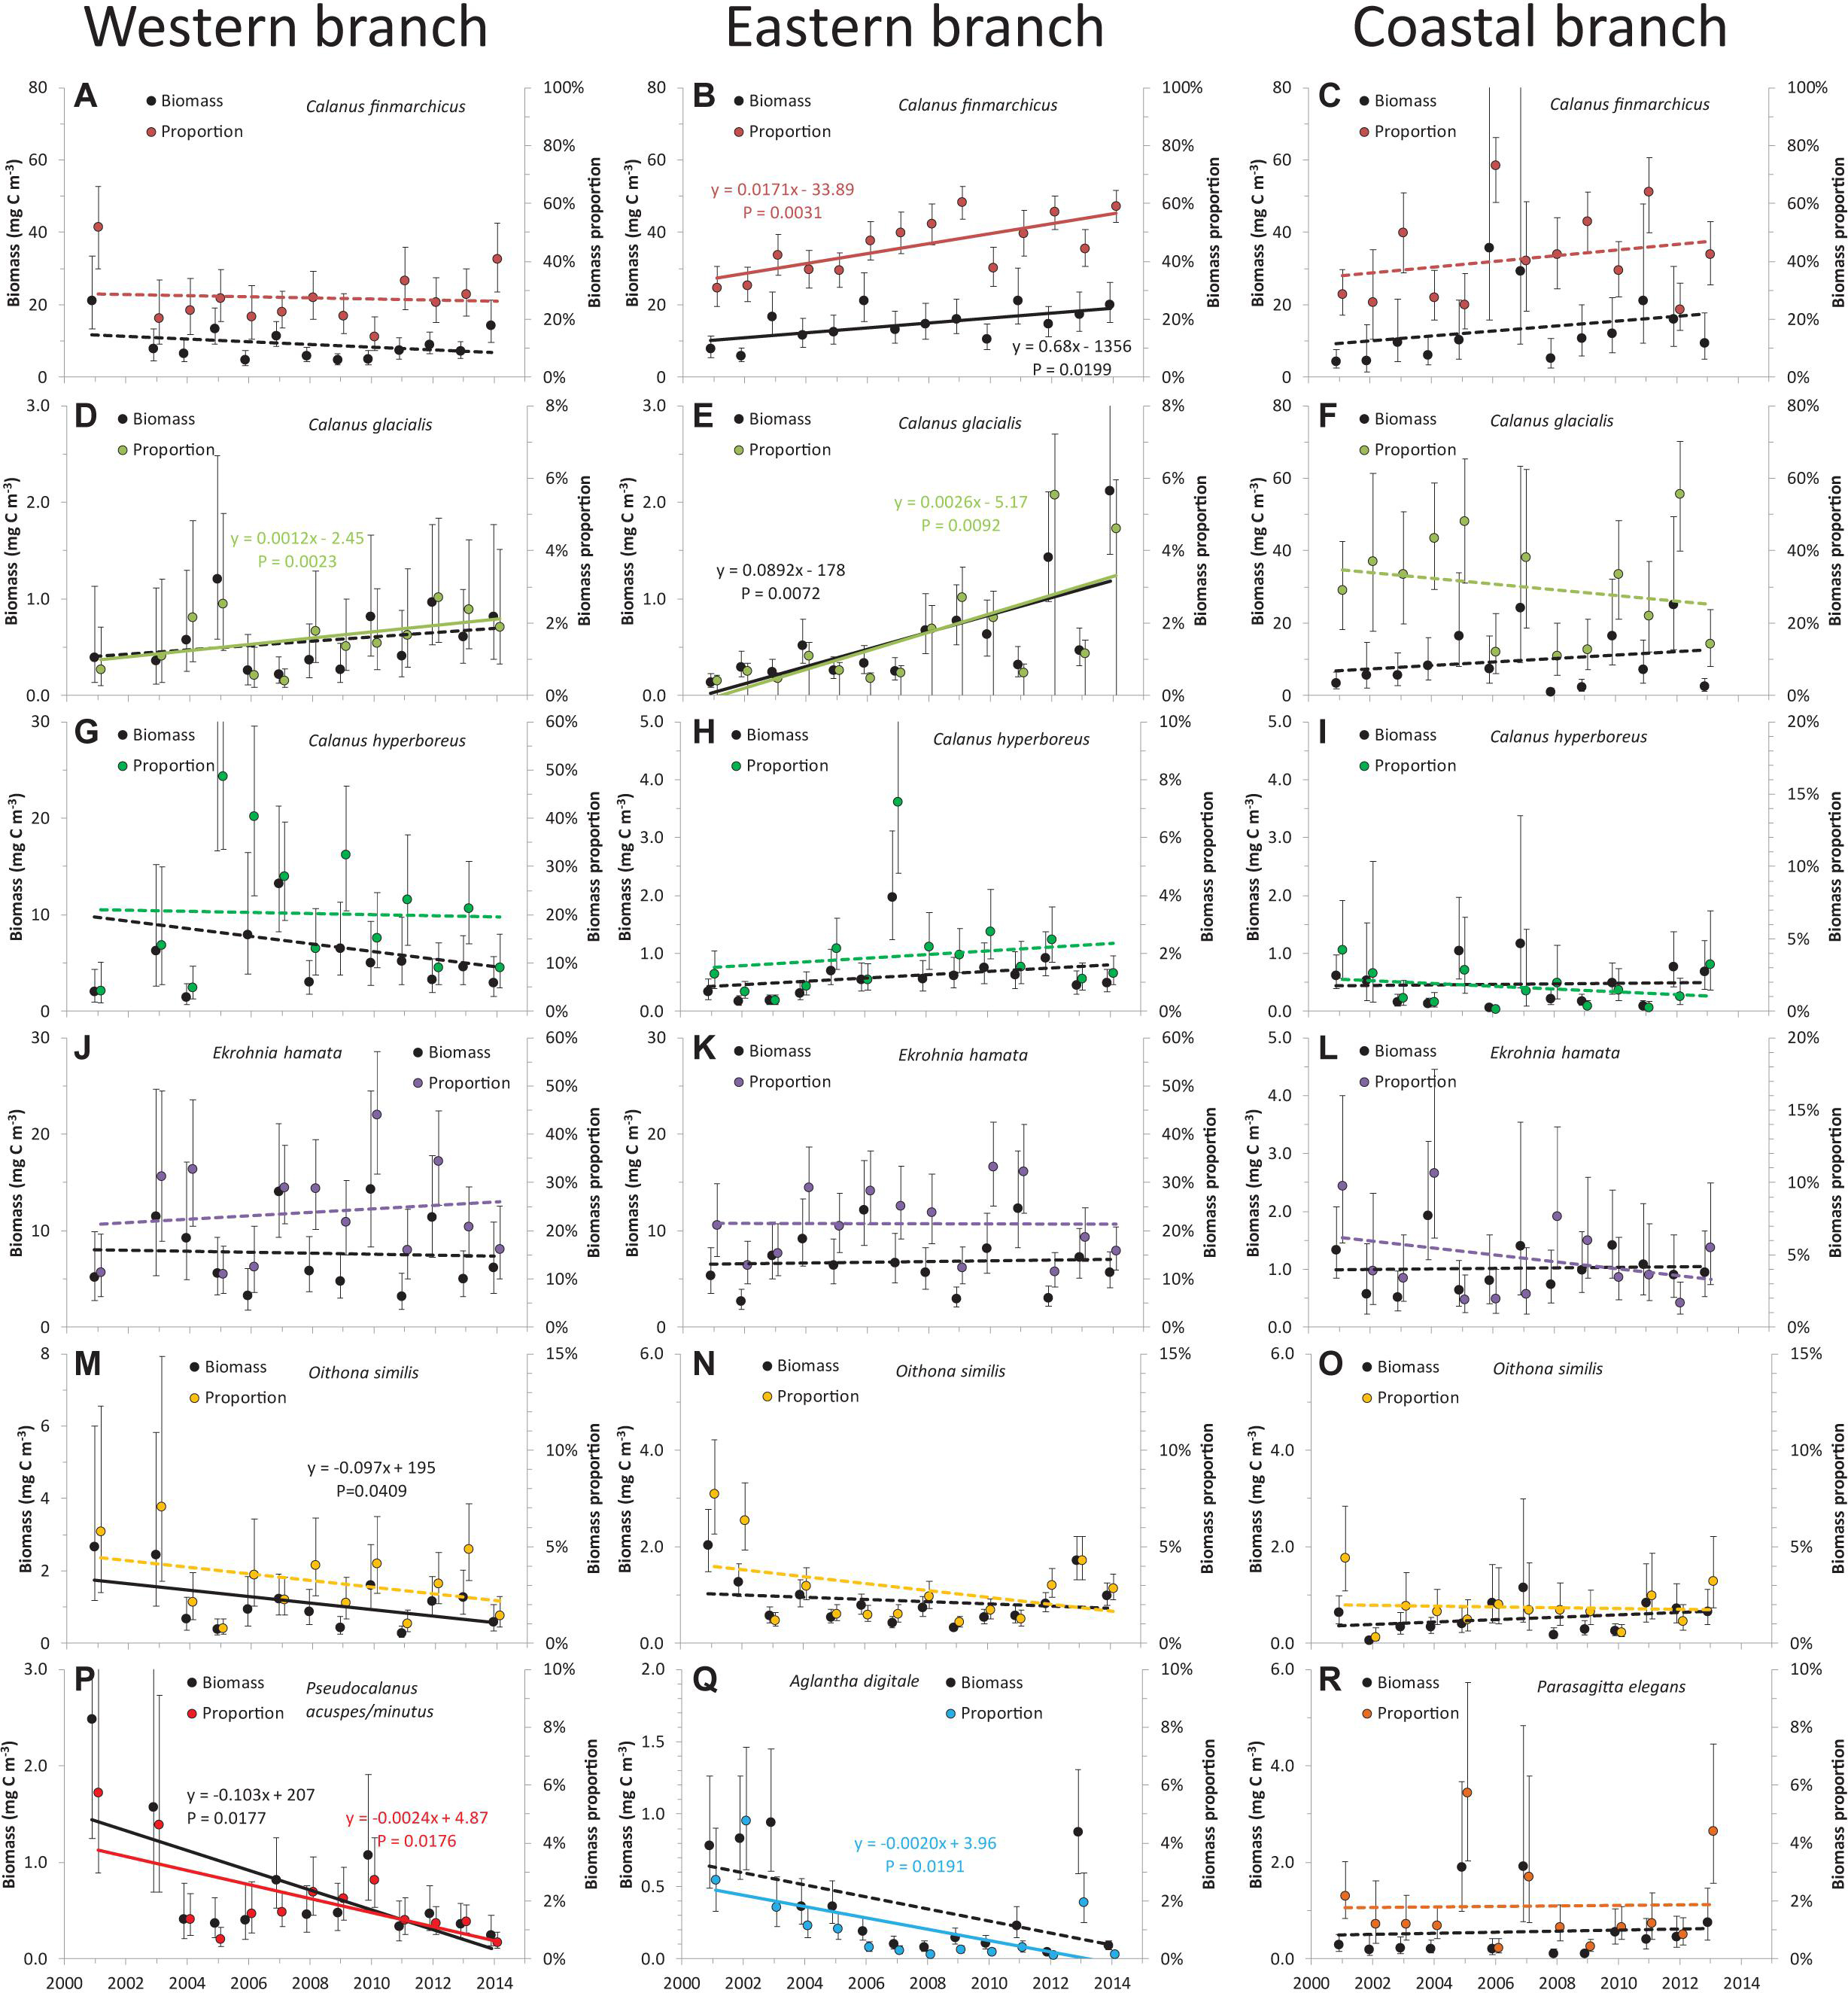
Figure 4. Changes in biomass and relative proportion of five dominant mesozooplankton species over time for the three branches of the West Spitsbergen Current (A–R: combinations of dominant species and branches). Error bars represent the standard error of the means. Significant linear regressions of annual means (P < 0.05) are shown with solid lines and statistics inserted, whereas non-significant linear trends are indicated with dashed lines. Note the different scaling on the y-axes.
In the eastern branch, significant and opposing spatial trends were observed for A. digitale and C. glacialis (Figure 3 and Table 2). The proportion of A. digitale was around 2.5% at the southernmost transect, but less than 1% further north. On the other hand, the proportion of C. glacialis was less than 1% at transect A and B, but increased to ∼2% at transects C–F. These two species, together with C. finmarchicus and C. hyperboreus, also exhibited significant interannual variations (Table 2). However, systematic temporal trends were observed only for C. finmarchicus, increasing from ∼40 to ∼60% (Figure 4B), C. glacialis, increasing from almost 0 to ∼3% (Figure 2E), and A. digitale, decreasing from ∼2% to almost 0% in recent years (Figure 4Q).
In the coastal branch, none of the dominant species exhibited significant variations among transects or years (Table 2). Moreover, no systematic time trends were observed for the dominant species (Figure 4), and only C. finmarchicus showed somewhat consistent tendencies of increasing biomass if the high biomasses in 2006 and 2007 were disregarded. However, it should be noted that the yearly estimates for the coastal branch were relatively uncertain due to the lower number of samples (n = 39).
Development of Calanus finmarchicus
Calanus finmarchicus copepodid CV and adults made up > 80% of the species biomass in the western and eastern branches, and only 50–60% in the coastal branch suggesting a less mature population over the shelf. Among these older stages, mature individuals (mostly females) constituted approximately 50% of the C. finmarchicus biomass in the western and eastern branches, whereas they only constituted 20–30% of the biomass in the coastal branch (Figure 5). An exception from this pattern was observed on transect F in the western branch. However, the variability in biomass proportions of the different developmental stages was considerable and no significant differences among transects were found (Table 2). For the same reason, interannual variation was only significant for the eastern branch, with about four times as many samples as the two other branches. In the eastern branch, the C. finmarchicus population was relatively more mature from 2005 to 2009, compared to years both before and after. Less developed populations were sampled in 2001 and 2003 in the western branch, but these proportion means were based on one observation in 2001 and two in 2003 only. However, there were no systematic trends over time found in relative proportion of C. finmarchicus developmental stages in none of the three branches.
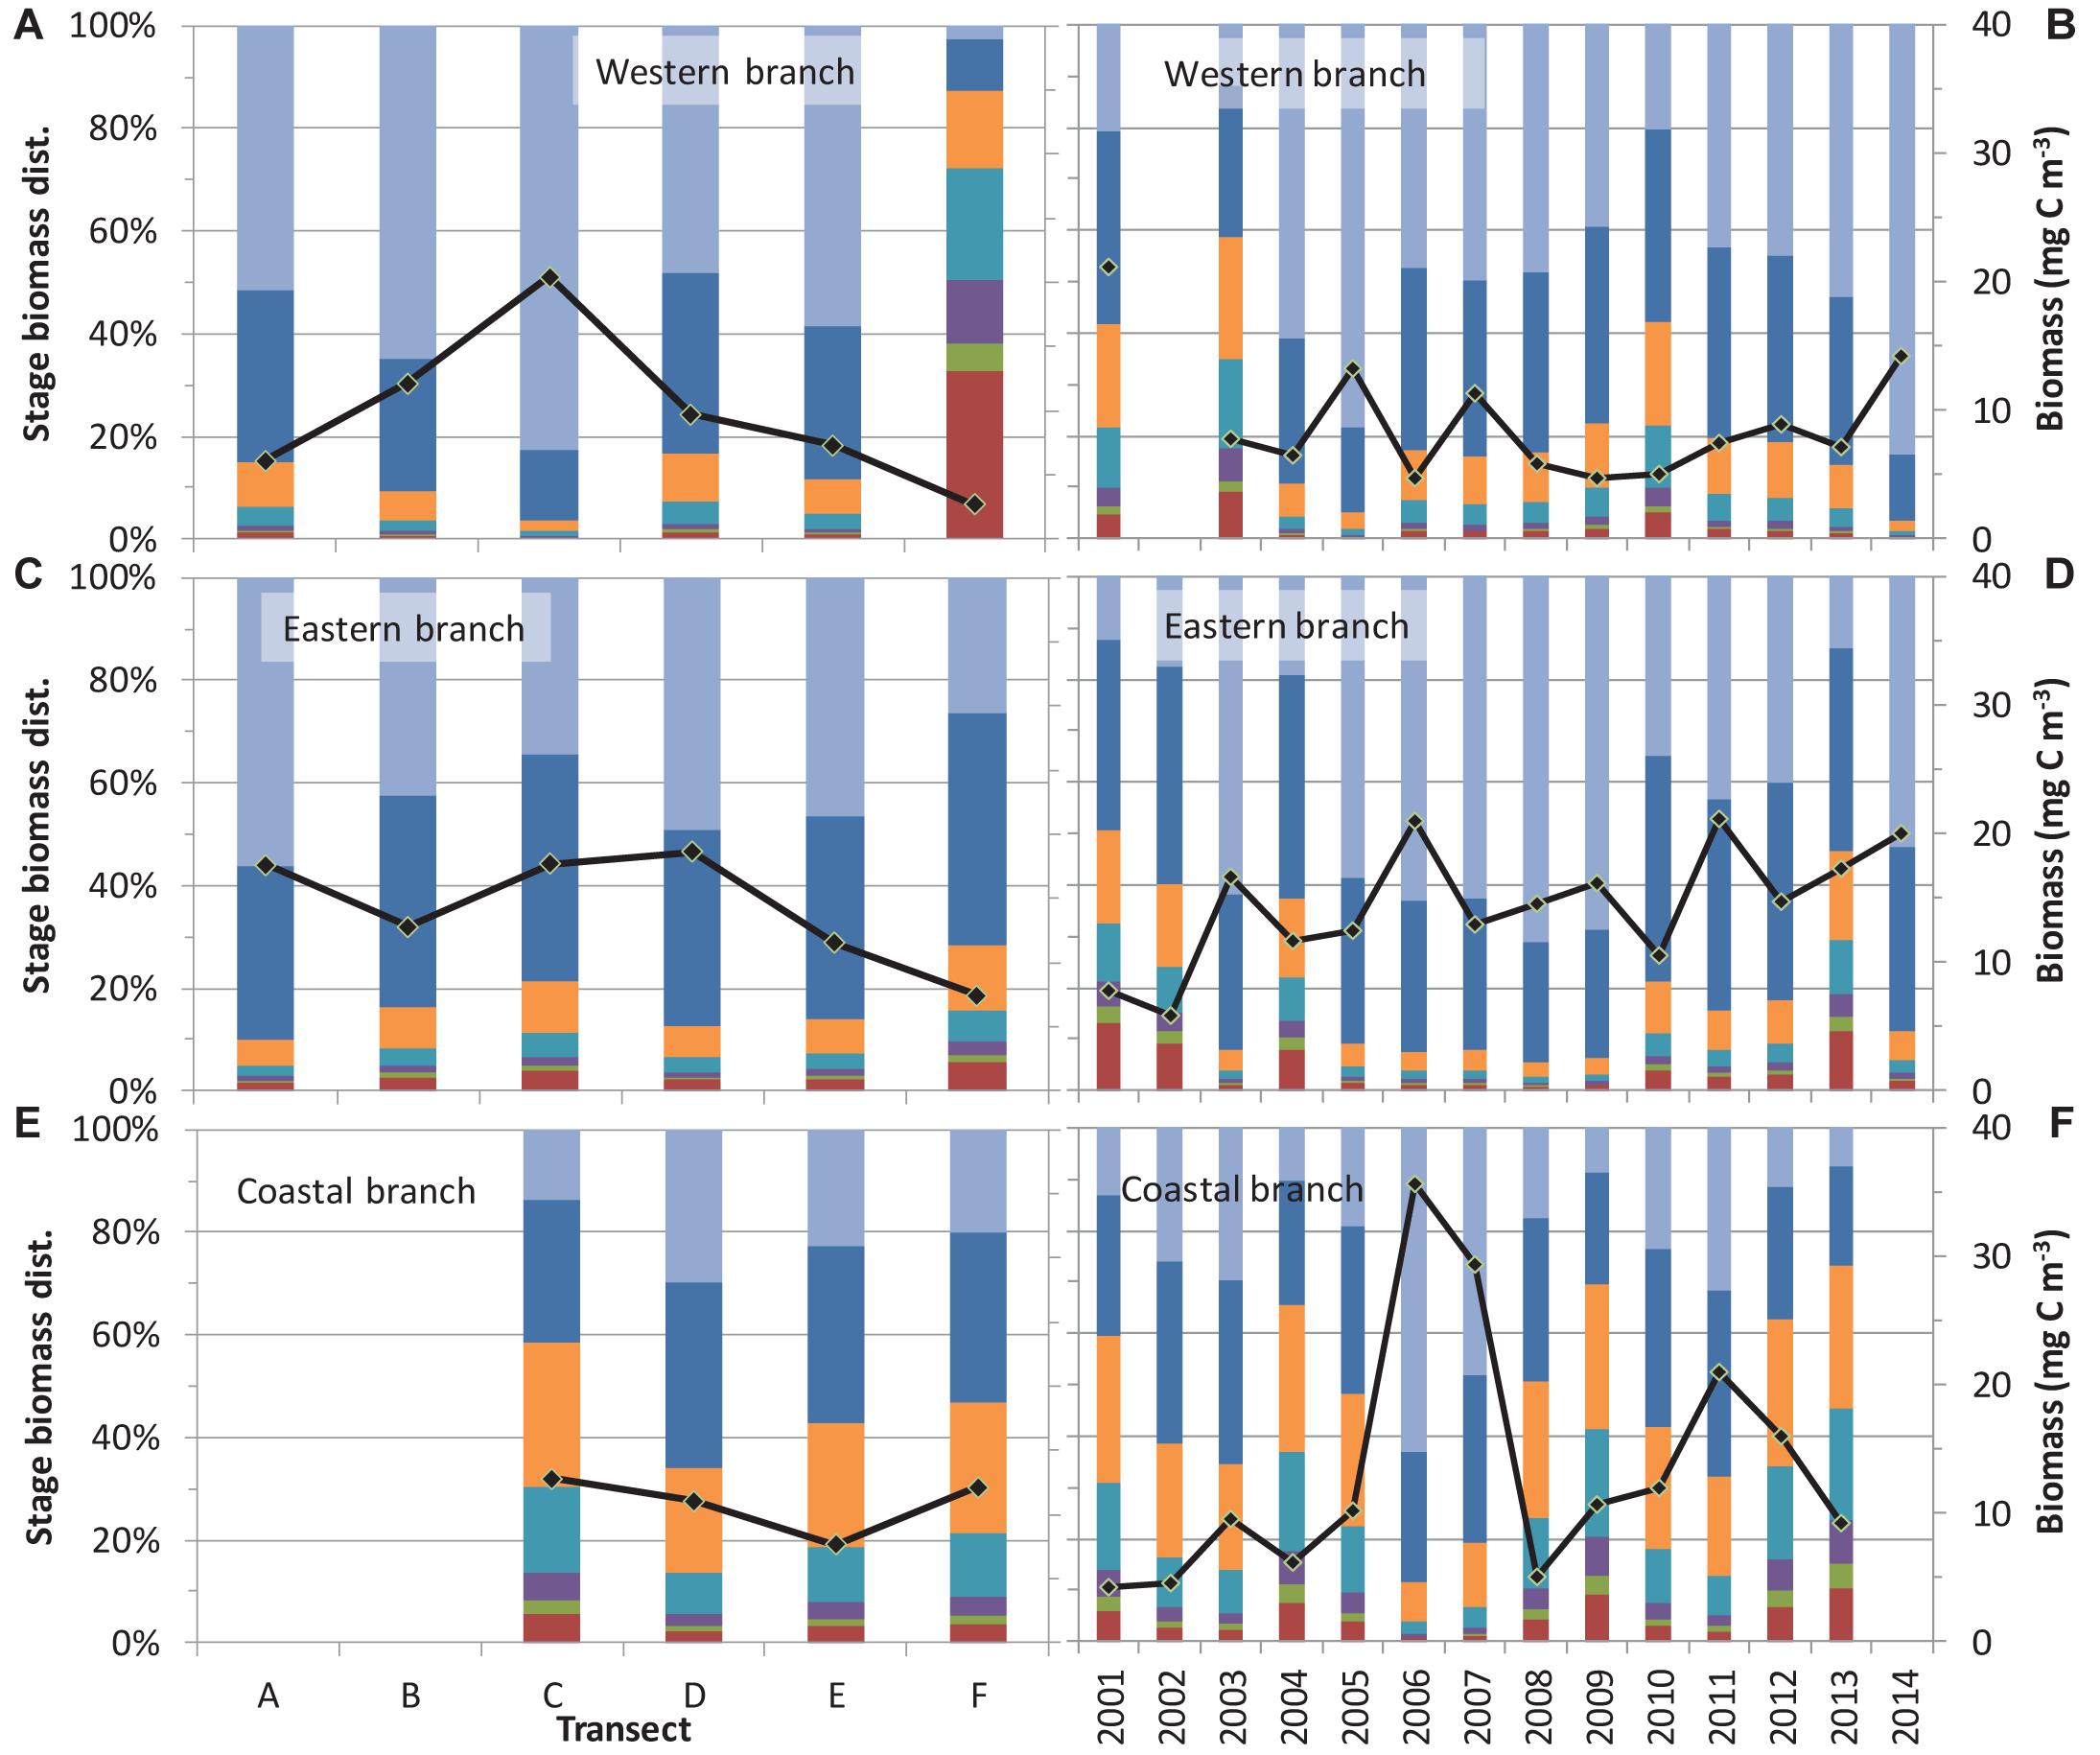
Figure 5. Spatial distribution and temporal trends of Calanus finmarchicus stages for the three branches of the West Spitsbergen Current (A,B: western branch, C,D: eastern branch, and E,F: coastal branch). Biomass proportions were modeled using Eq. 2. For comparison the mean biomass of C. finmarchicus is plotted for the different transects.
Discussion
The data in this study represents one of the longest and most extensive biological time series in the Arctic region. However, clear patterns of spatial and temporal variability did not emerge for all the zooplankton variables, which could be due to that such patterns did not occur or alternatively, that any such patterns were overridden by even larger random fluctuations. Partitioning variations with the mixed model (Eq. 1) also provides insight into the magnitude of uncertainty present in data. Using the variance estimates from the eastern branch with the most data, we found that uncertainties associated with temperature and salinity were less than 0.5°C and 0.04, respectively (Supplementary Table S1). Thus, transect and annual means were relatively well determined, most precise for the data-richer eastern branch and less precise for the two other branches (Figure 2). However, random variations associated with the zooplankton data were much larger for the biomass of the entire zooplankton community (∼50–100%) and even larger for the biomass and proportion of dominant species (data not shown). Consequently, transect and annual means of zooplankton variables were considerably more uncertain than for temperature and salinity, implying that only large spatial and temporal trends were found significant. Nevertheless, despite the large variability in zooplankton data significant changes over time and latitudes were found for some variables.
It should be stressed that our results are limited to a narrow seasonal window from late June to mid July. Unfortunately, seasonal studies of the zooplankton community are rare for the Arctic region, and for practical reasons only coastal areas have been studied seasonally. Only recently, Basedow et al. (2018) published results on zooplankton variability in Fram Strait and the Nansen Basin of the Arctic Ocean, north of our study area. They showed that high abundances of carbon-rich copepods were present in the AW inflow during all seasons (January, May, and August); however, that there was also variability in zooplankton transport between seasons, most likely resulting from the seasonal changes in the vertical distribution of zooplankton. Their study confirmed that the main zooplankton taxa tend to concentrate in the upper layers, particularly in spring and summer; however, they also found patches of unexpectedly high abundances of zooplankton, including C. finmarchicus, in winter (January). Seasonal studies are, regrettably, mostly restricted to a single year (e.g., Astthorsson and Gislason, 2003), assuming that particular year to represent the general seasonal variation. At present, multi-annual seasonal studies of open-ocean zooplankton communities are only available for the mid-latitude Atlantic Ocean (Planque et al., 1997; Helaouët and Beaugrand, 2007). Our long-term study demonstrates high interannual variability in the Arctic region and confirms that general inference is not possible with a study period of a single or few years of data.
Similar to our study, long-term studies in the Arctic typically focus on a specific seasonal window related to a specific successional stage of key species, typically Calanus species. Espinasse et al. (2017) studied decadal changes in C. finmarchicus and C. hyperboreus in three coastal locations, but the sampling window changed from May in Northern Iceland, July in Svalbard to October in northern Norway, and therefore the time series represented different phases of these species’ life cycle. In the Barents Sea, Tande et al. (2000) studied C. finmarchicus in spring (April, May) and summer (June, July) across nine non-consecutive years (1979–1992) and Dvoretsky and Dvoretsky (2013) analyzed the mesozooplankton community in July–August over a 7-year period (2003–2009). Common to most of the multi-annual studies of zooplankton in the Arctic region is that the sampling time window is chosen to represent the period following the phytoplankton spring bloom, characterized by the highest zooplankton biomass (Søreide et al., 2010). This sampling strategy also applied to our data and our results are likely to represent the zooplankton community at peak biomass in the WSC in the upper part of the ocean.
Key Species Distribution
The number of zooplankton species and taxa of higher rank found in the WSC samples was similar to those reported from other studies. As far as taxonomic affiliation is concerned, the list of identified species includes the majority of those recorded in the study area in previous studies (Hop et al., 2006; Gluchowska et al., 2017a,b). The main differences, both in terms of the number of taxa and individual species present, result primarily from the limitation of this study to the upper 60-m layer. For this reason, it is understandable that only some meso- and bathypelagic species known to occur in the WSC waters were found in the study collection. This can also explain the relatively low frequency of occurrence and the low biomass proportion found for species such as Metridia longa, P. norvegica or Microcalanus. The location of the study in a relatively narrow time window (end of June to mid-July) can explain why the predominant biomass species are Calanus copepods, which during this time typically conclude their development and growth in surface waters before migration to greater depths to diapause.
The zooplankton communities of the WSC branches were clearly different, and the observed distribution patterns and community structures can be interpreted in the context of environmental conditions characteristic for the habitats in which the individual communities were observed, in this case limited to temperature and salinity of water masses constituting separate branches of the WSC. In the western branch, the characteristic zooplankton community was made up of E. hamata, C. finmarchicus and C. hyperboreus. Other important species included O. similis, Pseudocalanus (most likely mainly P. minutus), T. abyssorum, C. glacialis, Metridia longa, and T. libellula. The high biomass of C. hyperboreus in the western branch and the considerable presence of P. minutus, M. longa, and T. libellula is most likely related to low temperature and high salinity of the western branch, which can result from the location of these stations in the Arctic Front zone, separating warmer Atlantic waters of the WSC from colder waters of the Greenland Sea Gyre. These species are generally considered to prefer lower water temperature (Frost, 1989; Auel and Werner, 2003; Daase et al., 2008), and are regarded as main zooplankton components in the Greenland Sea (Conover, 1988; Hirche, 1991; Richter, 1994). However, it is interesting that C. hyperboreus was more dominant at the three southernmost transect, as it is an expatriate species of Arctic origin that is transported southward mainly with the East Greenland Current (Conover, 1988). This current was not monitored in our transects, but gyres from this current could recirculate C. hyperboreus into the WSC. Thus, the observed higher proportion of C. hyperboreus in the south is related to the fact that sampling stations at the southern transects of the western branch were in closer proximity to the Arctic Front, where mixing of Arctic waters of the Greenland Sea and their fauna, including C. hyperboreus, with Atlantic waters of the Norwegian Sea takes place.
In the eastern branch, the zooplankton community was dominated by C. finmarchicus and E. hamata, but species like A. digitale, C. hyperboreus, C. glacialis, and O. similis were also found in most samples with a considerable biomass contribution. The dominance of characteristic boreal species (C. finmarchicus, A. digitale), as well as a noteworthy share of Euphausiids, is in agreement with warm and saline characteristics of the water masses in this branch; waters possessing a clear Atlantic signature. The eastern branch of the WSC recognized in this study represents undoubtedly the surface water fragment of the WSC core flow (Walczowski et al., 2005; Walczowski et al., 2012). Interestingly, however, there was a declining of A. digitale in the eastern branch over the study period (Figure 4Q), despite indications of stronger influence of AW. It is possible that this temporal trend could be associated with changes in the seasonal reproduction and development of A. digitale, relative to the time window of the cruises, resulting in younger individuals with less biomass or with deeper distribution of the medusae in recent years (Williams and Conway, 1981). Another explanation of this trend in A. digitale could be competition with another predator, E. hamata, which biomass was not declining over time. Both the jellyfish A. digitale and the chaetognatha E. hamata are known as copepod predators (Øresland, 1990; Pagés et al., 1996), so maybe, in the instance of increasing population abundance of prey of these predators (i.e., copepods), and changes in phenology of the zooplankton, caused by changes in the environment induced by climate change, the competitive conditions became more in favor for E. hamata. Last but not least, the abundance of A. digitale could decrease because of increasing pressure of its predators such as scyphozoan medusae Cyanea capillata or larvae and juvenile of fish, for example Atlantic mackerel Scomber scombrus (Runge et al., 1987; Båmstedt et al., 1997; Purcell, 2003). Increased abundances of pelagic predators have been observed in recent years migrating northward following the Atlantic water pathways (Dalpadado et al., 2012; Renaud et al., 2012).
In the coastal branch, flowing off the Spitsbergen coast along the slope and shelf edge, the most important contribution to the biomass of the zooplankton community was made by C. finmarchicus and C. glacialis. A high proportion of C. glacialis, as well as an important contribution of P. elegans, species typically characterized as cold-water, Arctic shelf seas species, matches with the temperature and salinity properties of this branch (Falk-Petersen et al., 1999, 2009; Grigor et al., 2014). The coastal branch had both low temperature and low salinity, which indicates that this water mass is influenced by Arctic water, most likely originating from the Barents Sea. Thus, the physical characteristics and the zooplankton composition, including both Arctic and boreal species, strongly support that the coastal branch is comprised by a mix of Arctic and Atlantic waters.
Conduit or Productive Area
The Arctic Ocean is believed to be net heterotrophic with large inputs of organic material, including zooplankton, from Atlantic and Pacific waters (Olli et al., 2007). The largest input of zooplankton to the Arctic Ocean enters with the WSC through Fram Strait (Kosobokova and Hirche, 2009; Wassmann et al., 2015), where it supports numerous fish, birds and whales. The extent to which the WSC acts as a simple conduit of zooplankton biomass originating from further south or actually constitutes a productive zone for mesozooplankton, enhancing the northward zooplankton flux has not been investigated yet.
Primary production is restricted in strongly stratified systems, where nutrients are mainly supplied through shear and micro-turbulence (Tremblay and Gagnon, 2009). The western and eastern WSC branches are strongly stratified, which would suggest that these two branches operate mainly as conduits of zooplankton since primary production is expectedly low and unlikely to support zooplankton growth. Both branches displayed decreasing zooplankton biomass in the northward direction (Figures 3A,B). However, there was an increase in zooplankton biomass at transect C for the western branch and transects C and D for the eastern branch. In this area, at the latitude of southern Spitsbergen, the western WSC branch and outflow from the Barents Sea converge with the eastern branch, which follows the shelf break (Walczowski et al., 2012). It is therefore possible that mixing associated with eddies in this area enhances primary production and consequently, zooplankton biomass.
Continuous nutrient supply along the shelf break, on the other hand, supports high levels of primary production (Arrigo and van Dijken, 2015), which can maintain or even enhance zooplankton biomass with the northward flow. Zooplankton biomass in the coastal branch remained constant across latitudes (Figure 3C), supporting this hypothesis. The influence of Barents Sea outflow mixing with the eastern branch was also apparent from the appearance of C. glacialis at transect C in the eastern branch. C. glacialis is abundant in the Barents Sea, in contrast to Atlantic waters (Falk-Petersen et al., 1999; Wassmann et al., 2015), and its appearance in the eastern branch from transect C and northward is probably caused by mixing with Barents Sea outflow.
Zooplankton biomass in the WSC surface layer is determined by growth and mortality in addition to advective transport and seasonal vertical migration. Loss processes most likely dominated the western and eastern branches along the northward flow, suggesting that these two branches were mainly operating as conduits of zooplankton from south to north. Loss of zooplankton biomass could be due to mortality exceeding growth and descending of key copepods as a part of their seasonal, ontogenetic vertical migration, following the development during the spring (utilizing the spring bloom) and the early summer. The strong dominance of C. finmarchicus CV and adults in the eastern and western branches signify a well-matured zooplankton community that may have been ready to descend into greater depths for entering the diapause. Less mature (and therefore of low biomass) C. finmarchicus population at transect F may suggest that this is a different population, probably sharing characteristics with the population of coastal branch, which is still in growing stage (Figure 5). At the latitude of transect F (approximately 79°N) the individual branches of the WSC are most likely strongly mixed with each other, due to confluence of the individual flows primarily because of the local bathymetry (Walczowski, 2013). It is likely that the decrease in zooplankton biomass from south to north at the western and eastern branches is due to seasonal migration or to low food availability that cannot maintain sufficient growth to outbalance mortalities. Alternatively, perhaps the regions more to the north are already border areas of optimal development, primarily for the boreal C. finmarchicus, which is responsible for the gross biomass of zooplankton in the studied waters. In both cases, insufficient primary production associated with strong stratification can explain the conduit behavior in the two branches.
The coastal branch behaved differently with a constant biomass and younger C. finmarchicus stages across the latitudes. The spring bloom in this branch is expected to start later and last longer due to presence of sea ice (Carstensen et al., 2012). A continuous supply of nutrients associated with upwelling and turbulent mixing at the shelf break further enhances primary production, sustaining a relatively high zooplankton biomass along the Spitsbergen coast. Another possible explanation of higher biomass in the coastal branch, particularly in the northern part of the region, could be associated with physical concentration of zooplankton, as a result of advancement of the eastern branch toward the shallower shelf. In this way, our results support the hypothesis of shelf regions and frontal zones as productivity hot spots (Basedow et al., 2014; Trudnowska et al., 2016).
Potential Effects of Climate Change
The expected poleward movement of enhanced primary production (Arrigo and van Dijken, 2015) may potentially have a large influence on zooplankton distribution and advection into the Arctic Ocean. In a modeling study, Slagstad et al. (2011) estimated a drastic shift in primary productivity from south to north of Svalbard over the 21st century. This change in productivity is likely to sustain high zooplankton biomasses at higher latitudes in the western and eastern WSC branches, assuming spatial patterns of secondary producers follow that of the primary producers, and it will potentially increase the flux of zooplankton into the Arctic Ocean. Our time series did not confirm any significant increase over time in zooplankton biomass within the different WSC branches as a whole (Figure 2F) and we did not observe any particular northwards shifts in zooplankton biomass over the study period (Supplementary Figure S2). Hence, the drastic shift predicted by models could not be confirmed with our relatively long time series. Gluchowska et al. (2017a) reported a small increase over the same period for the D transect, but this trend was small relative to the large interannual variations. Given this large interannual variability, time series of multiple decades are needed to identify systematic time trends in this area.
Although our data could not confirm the expected poleward movement of zooplankton in general, our analyses demonstrated significant changes in the community structure (Figure 4). The increasing proportion of C. finmarchicus in the WSC, particularly the eastern branch, testify to stronger influence of Atlantic zooplankton communities. This finding is consistent with the increasing salinity in the WSC (Figure 2B). Interestingly, the year with the highest C. finmarchicus biomass in the coastal branch (2006) was also the warmest year (Figure 2). Whereas the increase in C. finmarchicus is expected with increasing influence of Atlantic water, the significant increase in C. glacialis biomass over time in the western and eastern branches is more intriguing. The successful life strategy of C. glacialis is connected with early spawning, and nauplii and younger copepodid stages feeding on ice algae to better take advantage of the spring production (Falk-Petersen et al., 2009; Søreide et al., 2010; Leu et al., 2011). Retreating sea ice over the study area (Arrigo and van Dijken, 2015) could imply a competitive disadvantage to C. glacialis over other species not relying on ice algae, in contrast to the observed temporal trends (Figure 4). Furthermore, the increasing trends in C. glacialis were observed in the open-ocean branches that are mostly free of sea ice, whereas no change over time was observed in the coastal branch where sea ice is more prominent. This apparent discrepancy could be explained with increasing outflow from the Barents Sea, which hosts a high concentration of C. glacialis (Wassmann et al., 2015). Increasing inflow of Atlantic water has significantly reduced sea ice in the Barents Sea (Årthun et al., 2012), but this “Atlantification” may also have enhanced the general circulation in the Barents Sea and hence, promoted the outflow of Arctic water and C. glacialis south of Svalbard and into the WSC. Although the outflow from the Barents Sea is about one of magnitude smaller than the WSC, the effect of an increased outflow could significantly affect biomass in the western and eastern branches, where C. glacialis was almost absent in the beginning of the study period. However, longer time series are needed to assess changes in the zooplankton community over time given the large inherent variability of such data and the potential existence of decadal oscillations.
Author Contributions
JC led the study design, carried out statistical analyses, and wrote the first draft of the manuscript. AO analyzed the zooplankton samples and contributed to the data discussion. SK contributed to the study design, participated in field sampling, contributed to the sample examination, and discussion and wrote the manuscript.
Funding
This study is a contribution from the CarbonBridge project funded by the Norwegian Research Council (project 226415/E10).
Conflict of Interest Statement
The authors declare that the research was conducted in the absence of any commercial or financial relationships that could be construed as a potential conflict of interest.
Acknowledgments
We thank Waldemar Walczowski from IO PAN for providing CTD data and useful discussions on the hydrography. We thank the crew of the research ship s/y “Oceania” for their invaluable help throughout the years of collecting samples. We also thank the unnamed, numerous participants of the research team of the Plankton Ecology Laboratory at the IO PAN, for their contribution during the cruises and in the laboratory, without which creating this publication would not be possible.
Supplementary Material
The Supplementary Material for this article can be found online at: https://www.frontiersin.org/articles/10.3389/fmars.2019.00202/full#supplementary-material
References
Arrigo, K. R., and van Dijken, G. L. (2015). Continued increases in Arctic Ocean primary production. Progr. Oceanogr. 136, 60–70. doi: 10.1016/j.pocean.2015.05.002
Årthun, M., Eldevik, T., Smedsrud, L. H., Skagseth,Ø, and Ingvaldsen, R. B. (2012). Quantifying the influence of Atlantic heat on Barents Sea ice variability and retreat. J. Clim. 25, 4736–4743. doi: 10.1175/JCLI-D-11-00466.1
Astthorsson, O. S., and Gislason, A. (2003). Seasonal variations in abundance, development and vertical distribution of Calanus finmarchicus, C. hyperboreus and C. glacialis in the east icelandic current. J. Plankton Res. 25, 843–854. doi: 10.1093/plankt/25.7.843
Auel, H., and Werner, I. (2003). Feeding, respiration and life history of the hyperiid amphipod Themisto libellula in the Arctic marginal ice zone of the Greenland Sea. J. Exp. Mar. Biol. Ecol. 296, 183–197. doi: 10.1016/S0022-0981(03)00321-6
Båmstedt, U., Ishii, H., and Martinussen, M. B. (1997). Is the scyphomedusa Cyanea capillata (L.) dependent on gelatinous prey for its early development? Sarsia 82, 269–273. doi: 10.1080/00364827.1997.10413654
Basedow, S. L., Sundfjord, A., von Appen, W.-J., Halvorsen, E., Kwasniewski, S., and Reigstad, M. (2018). Seasonal variation in transport of zooplankton into the Arctic Basin through the Atlantic gateway, Fram Strait. Front. Mar. Sci. 5:194. doi: 10.3389/fmars.2018.00194
Basedow, S. L., Zhou, M., and Tande, K. S. (2014). Secondary production at the polar front, Barents Sea, August 2007. J. Mar. Syst. 130, 147–159. doi: 10.1016/j.jmarsys.2013.07.015
Beszczynska-Möller, A., Fahrbach, E., Schauer, U., and Hansen, E. (2012). Variability in Atlantic water temperature and transport at the entrance to the Arctic Ocean, 1997–2010. ICES J Mar. Sci. 69, 852–863. doi: 10.1093/icesjms/fss056
Carstensen, J., and Weydmann, A. (2012). Tipping points in the Arctic: eyeballing or statistical significance? Ambio 41, 34–43. doi: 10.1007/s13280-011-0223-8
Carstensen, J., Weydmann, A., Olszewska, A., and Kwasniewski, S. (2012). Effects of environmental conditions on the biomass of Calanus spp. in the Nordic Seas. J. Plankton Res. 34, 951–966. doi: 10.1093/plankt/fbs059
Conover, R. J. (1988). Comparative life histories in the genera Calanus and Neocalanus in high latitudes of the northern hemisphere. Hydrobiologia 167, 127–142. doi: 10.1007/BF00026299
Daase, M., Eiane, K., Aksnes, D. L., and Vogedes, D. (2008). Vertical distribution of Calanus spp. and Metridia longa at four Arctic locations. Mar. Biol. Res. 4, 193–207. doi: 10.1080/17451000801907948
Dalpadado, P., Ingvaldsen, R. B., Stige, L. C., Bogstad, B., Knutsen, T., Ottersen, G., et al. (2012). Climate effects on Barents Sea ecosystem dynamics. ICES J. Mar. Sci. 69, 1303–1316. doi: 10.1093/icesjms/fss063
Dvoretsky, V. G., and Dvoretsky, A. G. (2013). Epiplankton in the Barents sea: Summer variations of mesozooplankton biomass, community structure and diversity. Cont. Shelf Res. 52, 1–11. doi: 10.1016/j.csr.2012.10.017
Espinasse, M., Halsband, C., Varpe,Ø, Gislason, A., Gudmundsson, K., Falk-Petersen, S., et al. (2017). The role of local and regional environmental factors for Calanus finmarchicus and C. hyperboreus abundances in the Nordic Seas. Polar Biol. 40, 2363–2380. doi: 10.1007/s00300-017-2150-z
Falk-Petersen, S., Mayzaud, P., Kattner, G., and Sargent, J. R. (2009). Lipids and life strategy of Arctic Calanus. Mar. Biol. Res. 5, 18–39. doi: 10.1080/17451000802512267
Falk-Petersen, S., Pedersen, G., Kwasniewski, S., Hegseth, E. N., and Hop, H. (1999). Spatial distribution and life cycle timing of zooplankton in the marginal ice zone of the Barents Sea during the summer melt season in 1995. J. Plankton Res. 21, 1249–1264. doi: 10.1093/plankt/21.7.1249
Frost, B. (1989). A taxonomy of the marine calanoid copepod genus Pseudocalanus. Can. J. Zool. 67, 525–551. doi: 10.1139/z89-077
Gislason, A., and Astthorsson, O. S. (2002). The food of Norwegian spring-spawning herring in the western Norwegian Sea in relation to the annual cycle of zooplankton. Sarsia 87, 236–247. doi: 10.1080/00364820260294860
Gluchowska, M., Dalpadado, P., Beszczynska-Möller, A., Olszewska, A., Ingvaldsen, R. B., and Kwasniewski, S. (2017a). Interannual zooplankton variability in the main pathways of the Atlantic water flow into the Arctic Ocean (Fram Strait and Barents Sea branches). ICES J. Mar. Sci. 74, 1921–1936. doi: 10.1093/icesjms/fsx033
Gluchowska, M., Trudnowska, E., Goszczko, I., Kubiszyn, A. M., Blachowiak-Samolyk, K., Walczowski, W., et al. (2017b). Variations in the structural and functional diversity of zooplankton over vertical and horizontal environmental gradients en route to the Arctic Ocean through the Fram Strait. PLoS One 12:e0171715. doi: 10.1371/journal.pone.0171715
Grigor, J. J., Søreide, J. E., and Varpe, Ø (2014). Seasonal ecology and life-history strategy of the high-latitude predatory zooplankter Parasagitta elegans. Mar. Ecol. Progr. Ser. 499, 77–88. doi: 10.3354/meps10676
Heide-Jørgensen, M. P., and Acquarone, M. (2002). Size and trends of the bowhead, beluga and narwhal stocks wintering off West Greenland. Sci. N. Atl. Mar. Mamm. Commun. 4, 191–210. doi: 10.7557/3.2844
Helaouët, P., and Beaugrand, G. (2007). Macroecology of Calanus finmarchicus and C. helgolandicus in the North Atlantic Ocean and adjacent seas. Mar. Ecol. Progr. Ser. 345, 147–165. doi: 10.3354/meps06775
Hirche, H.-J. (1991). Distribution of the dominant calanoid copepod species in the Greenland Sea during late fall. Polar Biol. 11, 351–362. doi: 10.1007/BF00239687
Hop, H., Falk-Petersen, S., Svendsen, H., Kwasniewski, S., Pavlov, V., Pavlova, O., et al. (2006). Physical and biological characteristics of the pelagic system across Fram Strait to Kongsfjorden. Progr. Oceanogr. 71, 182–231. doi: 10.1016/j.pocean.2006.09.007
Karnovsky, N., Kwasniewski, S., Weslawski, J. M., Walkusz, W., and Beszczynska-Möller, A. (2003). The foraging behaviour of little auks in a heterogeneous environment. Mar. Ecol. Prog. Ser. 253, 289–303. doi: 10.3354/meps253289
Kosobokova, K., and Hirche, H.-J. (2009). Biomass of zooplankton in the eastern Arctic ocean – a base line study. Progr. Oceanogr. 82, 265–280. doi: 10.1016/j.pocean.2009.07.006
Kwasniewski, S., Hop, H., Falk-Petersen, S., and Pedersen, G. (2003). Distribution of Calanus species in Kongsfjorden, a glacial fjord in Svalbard. J. Plankton Res. 25, 1–20. doi: 10.1007/s10482-015-0580-6
Leu, E., Søreide, J. E., Hessen, D. O., and Berge, J. (2011). Consequences of changing sea-ice cover for primary and secondary producers in the European Arctic shelf seas: timing, quantity, and quality. Prog. Oceanogr. 90, 18–32. doi: 10.1016/j.pocean.2011.02.004
Longhurst, A., Williams, R. (1979). Materials for plankton modelling: vertical distribution of Atlantic zooplankton in summer. J. Plankton Res. 1, 1–28. doi: 10.1093/plankt/1.1.1
Matrai, P., Olson, E., Suttles, S., Hill, V., Codispoti, L. A., Light, B., et al. (2013). Synthesis of primary production in the Arctic Ocean: I. Surface waters, 1954–2007. Progr. Oceanogr. 110, 93–106. doi: 10.1016/j.pocean.2012.11.004
Olli, K., Wassmann, P., Reigstad, M., Ratkova, T. N., Arashkevich, E., Pasternak, A., et al. (2007). Suspended concentration and vertical flux of organic particles in the upper 200 m during a 3 week ice drift at 88°N. Progr. Oceanogr. 72, 84–113. doi: 10.1016/j.pocean.2006.08.002
Øresland, V. (1990). Feeding and predation impact of the chaetognath Eukrohnia hamata in Gerlache Strait, Antarctic Peninsula. Mar. Ecol. Progr. Ser. 63, 201–209. doi: 10.3354/meps063201
Pagés, F., Gonzáles, H. E., and Gonzáles, S. R. (1996). Diet of the gelatinous zooplankton in Hardangerfjord (Norway) and potential predatory impact by Aglantha digitale (Trachymedusae). Mar. Ecol. Progr. Ser. 139, 69–77. doi: 10.3354/meps139069
Planque, B., Hays, G. C., Ibanez, F., and Gamble, J. C. (1997). Large scale spatial variations in the seasonal abundance of Calanus finmarchicus. Deep Sea Res. I 44, 315–326. doi: 10.1016/S0967-0637(96)00100-8
Purcell, J. E. (2003). Predation on zooplankton by large jellyfish, Aurelia labiate, Cyanea capillata and Aequorea aequore, in Prince William Sound, Alaska. Mar. Ecol. Progr. Ser. 246, 137–152. doi: 10.3354/meps246137
Renaud, P. E., Berge, J., Varpe,Ø, Lønne, O. J., Nahrgang, J., Ottesen, C., et al. (2012). Is the poleward expansion by Atlantic cod and haddock threatening native polar cod, Boreogadus saida? Polar Biol. 35, 401–412. doi: 10.1007/s00300-011-1085-z
Richter, C. (1994). Regional and Seasonal variability in the vertical distribution of mesozooplankotn in the Greenland Sea. Rep. Polar Res. 154:90.
Rudels, B., Björk, G., Nilsson, J., Winsor, P., Lake, I., and Nohr, C. (2005). The interaction between waters from the Arctic Ocean and the Nordic Seas north of Fram Strait and along the East Greenland current: results from the Arctic Ocean-02 Oden expedition. J. Mar. Syst. 55, 1–30. doi: 10.1016/j.jmarsys.2004.06.008
Rudels, B., Jones, E., Schauer, U., and Eriksson, P. (2004). Atlantic sources of the Arctic ocean surface and halocline waters. Polar Res. 23, 181–208. doi: 10.1021/acs.est.7b00788
Runge, J. A., Pepin, P., and Silvert, W. (1987). Feeding behavior of the Atlantic mackerel Scomber scombrus on the hydromedusa Aglantha digitale. Mar. Biol. 94, 329–333. doi: 10.1007/BF00428238
Slagstad, D., Ellingsen, I. H., and Wassmann, P. (2011). Evaluating primary and secondary production in an Arctic Ocean void of summer sea ice: an experimental simulation approach. Progr. Oceanogr. 90, 117–131. doi: 10.1016/j.pocean.2011.02.009
Soltwedel, T., Bauerfeind, E., Bergmann, M., Bracher, A., Budaeva, N., Busch, K., et al. (2015). Natural variability or anthropogenically-induced variation? Insightsfrom 15 years of multidisciplinary observations at the arctic marineLTER site HAUSGARTEN. Ecol. Indic. 65, 89–102. doi: 10.1016/j.ecolind.2015.10.001
Søreide, J. E., Leu, E., Berge, J., Graeve, M., and Falk-Petersen, S. (2010). Timing of blooms, algal food quality and Calanus glacialis reproduction and growth in a changing Arctic. Glob. Change Biol. 16, 3154–3163. doi: 10.1111/j.1365-2486.2010.02175.x
Stroeve, J. C., Serreze, M. C., Holland, M. M., Kay, J. E., Malanik, J., and Barrett, A. P. (2012). The Arctic’s rapidly shrinking sea ice cover: a research synthesis. Clim. Change 110, 1005–1027. doi: 10.1007/s10584-011-0101-1
Tande, K. S., Drobysheva, S., Nesterova, V., Nilssen, E. M., Edvardsen, A., and Tereschenko, V. (2000). Patterns in the variations of copepod spring and summer abundance in the northeastern Norwegian Sea and the Barents Sea in cold and warm years during the 1980s and 1990s. ICES J. Mar. Sci. 57, 1581–1591. doi: 10.1006/jmsc.2000.0982
Tremblay, J. E., and Gagnon, J. (2009). “The effects of irradiance and nutrient supply on the productivity of arctic waters: a perspective on climate change,” in Influence of Climate Change on the Changing Arctic and Sub-Arctic Conditions, eds J. C. J. Nihoul and A. G. Kostianoy (Dordrecht: Springer), 73–93. doi: 10.1007/978-1-4020-9460-6_7
Trudnowska, E., Gluchowska, M., Beszczynska-Möller, A., Blachowiak-Samolyk, K., and Kwasniewski, S. (2016). Plankton patchiness in the Polar Front region of the West Spitsbergen Shelf. Mar. Ecol. Progr. Ser. 560, 1–18. doi: 10.3354/meps11925
UNESCO (1968). Monographs on Oceanographic Methodology 2. Zooplankton Sampling. Geneve: UNESCO, Imprimeries Populaires, 174.
Walczowski, W. (2013). Frontal structures in the west spitsbergen current margins. Ocean Sci. 9, 957–975. doi: 10.5194/os-9-957-2013
Walczowski, W., Piechura, J., Goszczko, I., and Wieczorek, P. (2012). Changes in Atlantic water properties: an important factor in the European Arctic marine climate. ICES J. Mar. Sci. 69, 864–869. doi: 10.1093/icesjms/fss068
Walczowski, W., Piechura, J., Osinski, R., and Wieczorek, P. (2005). The West Spitsbergen Current volume and heat transport from synoptic observations in summer. Deep Sea Res. I 52, 1374–1391. doi: 10.1016/j.dsr.2005.03.009
Wassmann, P., Kosobokova, K. N., Slagstad, D., Drinkwater, K. F., Hopcroft, R. R., Moore, S. E., et al. (2015). The contiguous domains of Arctic Ocean advection: trails of life and death. Progr. Oceanogr. 139, 42–65. doi: 10.1016/j.pocean.2015.06.011
Weydmann, A., Carstensen, J., Goszczko, I., Dmoch, K., Olszewska, A., and Kwasniewski, S. (2014). Shift towards the dominance of boreal species in the Arctic: inter-annual and spatial zooplankton variability in the West Spitsbergen Current. Mar. Ecol. Progr. Ser. 501, 41–52. doi: 10.3354/meps10694
Weydmann, A., and Kwasniewski, S. (2008). Distribution of Calanus populations in a glaciated fjord in the Arctic (Hornsund, Spitsbergen) – an interplay between biological and physical factors. Polar Biol. 31, 1023–1035. doi: 10.1007/s00300-008-0441-0
Weydmann, A., Walczowski, W., Carstensen, J., and Kwasniewski, S. (2018). Warming of Subarctic waters accelerates development of a key marine zooplankton Calanus finmarchicus. Glob. Change Biol. 24, 172–183. doi: 10.1111/gcb.13864
Wiborg, K. F. (1955). Zooplankton in relation to hydrography in the Norwegian Seas. Bergen: John Griegs Bokrykkeri, 66.
Keywords: Arctic, Atlantic water, Calanus finmarchicus, climate change, copepod, Fram Strait, trends, zooplankton community
Citation: Carstensen J, Olszewska A and Kwasniewski S (2019) Summer Mesozooplankton Biomass Distribution in the West Spitsbergen Current (2001–2014). Front. Mar. Sci. 6:202. doi: 10.3389/fmars.2019.00202
Received: 18 December 2018; Accepted: 01 April 2019;
Published: 24 April 2019.
Edited by:
Rui Rosa, Universidade de Lisboa, PortugalReviewed by:
Kalle Olli, University of Tartu, EstoniaVladimir G. Dvoretsky, Murmansk Marine Biological Institute, Russia
Copyright © 2019 Carstensen, Olszewska and Kwasniewski. This is an open-access article distributed under the terms of the Creative Commons Attribution License (CC BY). The use, distribution or reproduction in other forums is permitted, provided the original author(s) and the copyright owner(s) are credited and that the original publication in this journal is cited, in accordance with accepted academic practice. No use, distribution or reproduction is permitted which does not comply with these terms.
*Correspondence: Jacob Carstensen, amFjQGJpb3MuYXUuZGs=