 Ashneel Ajay Singh1*
 Anish Maharaj1
 Michelle Kumar1Priyatma Singh1
 Sanjay Singh1
 Frank E. Muller-Karger2
 Matthew McCarthy2Lionel Joseph1
 Herve Damlamian3
 Zulfikar Begg3
- 1Department of Science, The University of Fiji, Lautoka, Fiji
- 2College of Marine Science, University of South Florida, Tampa, FL, United States
- 3Geoscience Division, Pacific Community, Suva, Fiji
In Fiji, like most Pacific Island countries, there have been numerous reports of degradation of coastal resources, including adverse changes in abundance and stock distribution of numerous aquatic species associated with the coastal habitat. To develop effective management plans, assessment of existing coastal resources is pertinent. High spatial resolution satellite imagery, combined with geographic information systems allow for efficient and synoptic mapping of coastal resources to provide a baseline for developing effective and improved management plans. The purpose of this study was to develop a baseline habitat map of the intertidal benthic cover in Komave Village, Coral Coast, Sigatoka, Fiji. Resource mapping was based on high resolution (2 m) WorldView-2 imagery. Ground-truthing was attained by means of on-site data logging of the intertidal resources, image capturing and GPS recording. Based on these records, the benthic cover was classified into seven classes: ‘coral,’ ‘algae,’ ‘brown algae,’ ‘volcanic rocks,’ ‘sand and gravel,’ ‘sea grass,’ and ‘bare.’ Ground referencing points were randomly assigned for either supervised classification training or accuracy assessment. A community participatory research approach was used to conduct interviews to assimilate information on fishing sites and coastal land use activities. This exercise explored the social-ecological approach in natural resource management and how it can become an important tool in coastal conservation practices. The coastal resource map generated through this study serves as a baseline for monitoring the status and spatial distribution of the coastal resources in Komave. Annual mapping of the resources and enrichment of maps along with iterative village consultation will enable managers to develop and gauge the effectiveness of coastal management plans. This high resolution map is particularly relevant to Fiji as it is the first of its kind for the country. This work also serves to reduce the global information gap of coastal resource status for Fiji.
Introduction
Changes in climatic conditions and anthropogenic influences are negatively affecting coastal ecosystems and threatening resource availability and food security particularly in developing countries of the globe (Barbier et al., 2011; Rice and Garcia, 2011; Williams et al., 2016). South Pacific Island countries (PICs) including Fiji rely heavily on resources from coastal habitats. Increasing human population, amplified harvesting of coastal resources and land use activities exacerbate the problems of climate variability (rain, wind, temperature, cloud cover, sea level, acidification, and natural disaster frequency among others). Coastal monitoring and coastal research studies conducted previously in Fiji have not been designed to evaluate the difference between impacts due to climate change or due to direct human uses (Mimura, 1999; Ellison, 2000; Moreno and Becken, 2009; Le Cornu et al., 2017). A systematic long-term monitoring program of critical sites in conjunction with existing research-based monitoring would improve the identification of effects that different variables have on mangroves, reefs, and benthic communities in Fiji. This is critical for sustainable management practices of coastal resources (Pandolfi et al., 2003; Wilkinson, 2004). This is essential for developing climate resilience for coastal Pacific communities that depend on natural resources and ecosystem services for their livelihood.
Coastal benthic habitats, such as seaweeds, algae, and coral reefs, have high ecosystem-service value. Such habitats and systems act as carbon sinks, and provide coastal inundation protection, wave energy regulation and nurseries for various aquatic animals (Galparsoro et al., 2014). There is evidence that corals are degrading rapidly and are often used in an indiscriminate manner without consideration of sustainability (Brown et al., 2017; Ruppert et al., 2018). Coastal habitat species have particular optimum conditions by which they survive and thrive. These conditions are dependent upon the interaction of multiple factors (Pakeman et al., 2008). There is also documentation of negative anthropogenic effects on coastal fish abundance and distribution (Sundblad et al., 2011; Sundblad and Bergström, 2014; Ruppert et al., 2018). Global reduction in coastal ecosystems have been documented in a number of studies (Barbier et al., 2011; He et al., 2014; Hernández-Delgado, 2015; Lee et al., 2015; Cloern et al., 2016). Different components of the coastal ecosystems have natural interconnectivity and any change will have effect on different components. Coastal ecosystem degradation has been known to cause significant reduction in viable fisheries, nursery habitats for various marine organisms and filtering capability of various aquatic plants and animals (Worm et al., 2006; Barbier et al., 2011).
It is difficult to effectively encompass the spatially complex heterogeneous distribution of coastal cover with conventional methods (Vanderstraete et al., 2005). Typical field-based study usually covers small and fractionated components of the investigated systems (Hochberg and Atkinson, 2003) and is poorly built to identify spatial alterations over time. GIS is a systematic tool for establishing vital baseline information on the distribution of coastal and aquatic resources. It is widely used in ecosystem management and is particularly effective in creating accurate, high spatial resolution base maps of coastal and shallow-water aquatic resources (Aswani and Lauer, 2006; Friedlander et al., 2007; McCoy et al., 2015; Elliott et al., 2018). Benthic habitat maps, including coral cover maps and maps of coastal land resources also provide critical information needed for the management of coastal ecosystems and are used in numerous research and monitoring activities such as coastal development, fisheries and other resource use, coral reef resiliency, connectivity, sea-level change, climate change and ocean acidification (Le Cornu et al., 2017). High resolution base maps are particularly important research tools for monitoring changes and improving sustainable resource management plans. It is possible to create boundaries for marine protected area’s (MPA) without using detailed resource maps as has been the case in the past for several of the PICs. However, these approaches rely on field based assessments which do not represent the benthic cover information efficiently which is a common approach in Fiji. As a result, such MPA set-ups give mixed results (Weeks and Jupiter, 2013). In order to understand the baseline abundance and distribution of resources and how these resources change over time within any MPA or field site, accurate maps of the resources are essential. Accurate baseline benthic cover information is a crucial initial step in determining the spatial characteristics and the status of aquatic resources. This is essential for the planning of informed management plans including those for MPA formation. These maps help visualize and understand resource inventories, connectivity between habitats and resource threats (Aswani and Lauer, 2006; Friedlander et al., 2007; McCoy et al., 2015; Elliott et al., 2018).
Previous benthic cover mapping studies in Fiji and the South Pacific region have been of limited accuracy and have not incorporated coastal use and benthic cover change information from the locals (Roelfsema et al., 2007; Baleilevuka et al., 2014). Local residents and villagers utilize and manage costal resources and possess important historical information on the coastal zone (Weeks and Jupiter, 2013). Such survey based information can be integrated with resource mapping and can provide important information on the present and past resource use and status. The integration of local knowledge and scientific methods for development of benthic maps is essential for effective management measures such as formation of MPA areas as shown in different studies (Aswani and Lauer, 2006; Aswani et al., 2007; Teixeira et al., 2013; Aswani and Lauer, 2014). The intention of this research is not only to create a baseline resource map, but to also demonstrate a mixed methodology for merging scientific information with local information in efforts to create an all-inclusive map that can be readily used to design conservation strategies.
Satellite imagery and in situ observation are the basis for complex forecasting models and ecosystem-based management (Dowell and Platt, 2009; Beckage et al., 2011; Sherman et al., 2011; Röckmann et al., 2012). One of the key functionalities of GIS is data integration that further enhances visual and digital resource data and provides a detailed understanding of the multifarious nature of the study site. Remote sensing and GIS methods are quite economical in terms of the resources and time involved (Mumby et al., 1999). This is especially advantageous for PICs with limited resources. In Fiji, spatial distribution of the coastal marine habitats and species distribution are poorly understood. The Komave watershed area including the coast had been identified as critical and nationally significant (Atherton et al., 2005). Earlier consultations with Komave village revealed that villagers were experiencing reduced harvest of fisheries and coastal resources over the past 10 years. This study was intended to provide Komave village with benthic cover maps and information on anthropogenic activities for formulating management plans and formation of an MPA area. To facilitate this, the key objective of this study was to develop a high spatial resolution baseline habitat map of the intertidal benthic cover and resources and map out the anthropogenic activities in Komave village’s coastal habitat, Fiji.
Materials and Methods
Study Site
The research was conducted within a shallow-water ecosystem in the Southwestern part of Viti Levu (177° 47′ 48″ E and 177° 50′ 59″ E longitude; 18° 16′ 11″ S and 18° 16′ 11″ S latitude) (Figure 1). A tourist hot spot for many decades, this area is known as Coral Coast locally and is renowned for its beautiful beaches and reefs. The study region included four reef systems (Cakaubalavu, Cakau Lekaleka, Vatumalawa, and Nalumu).
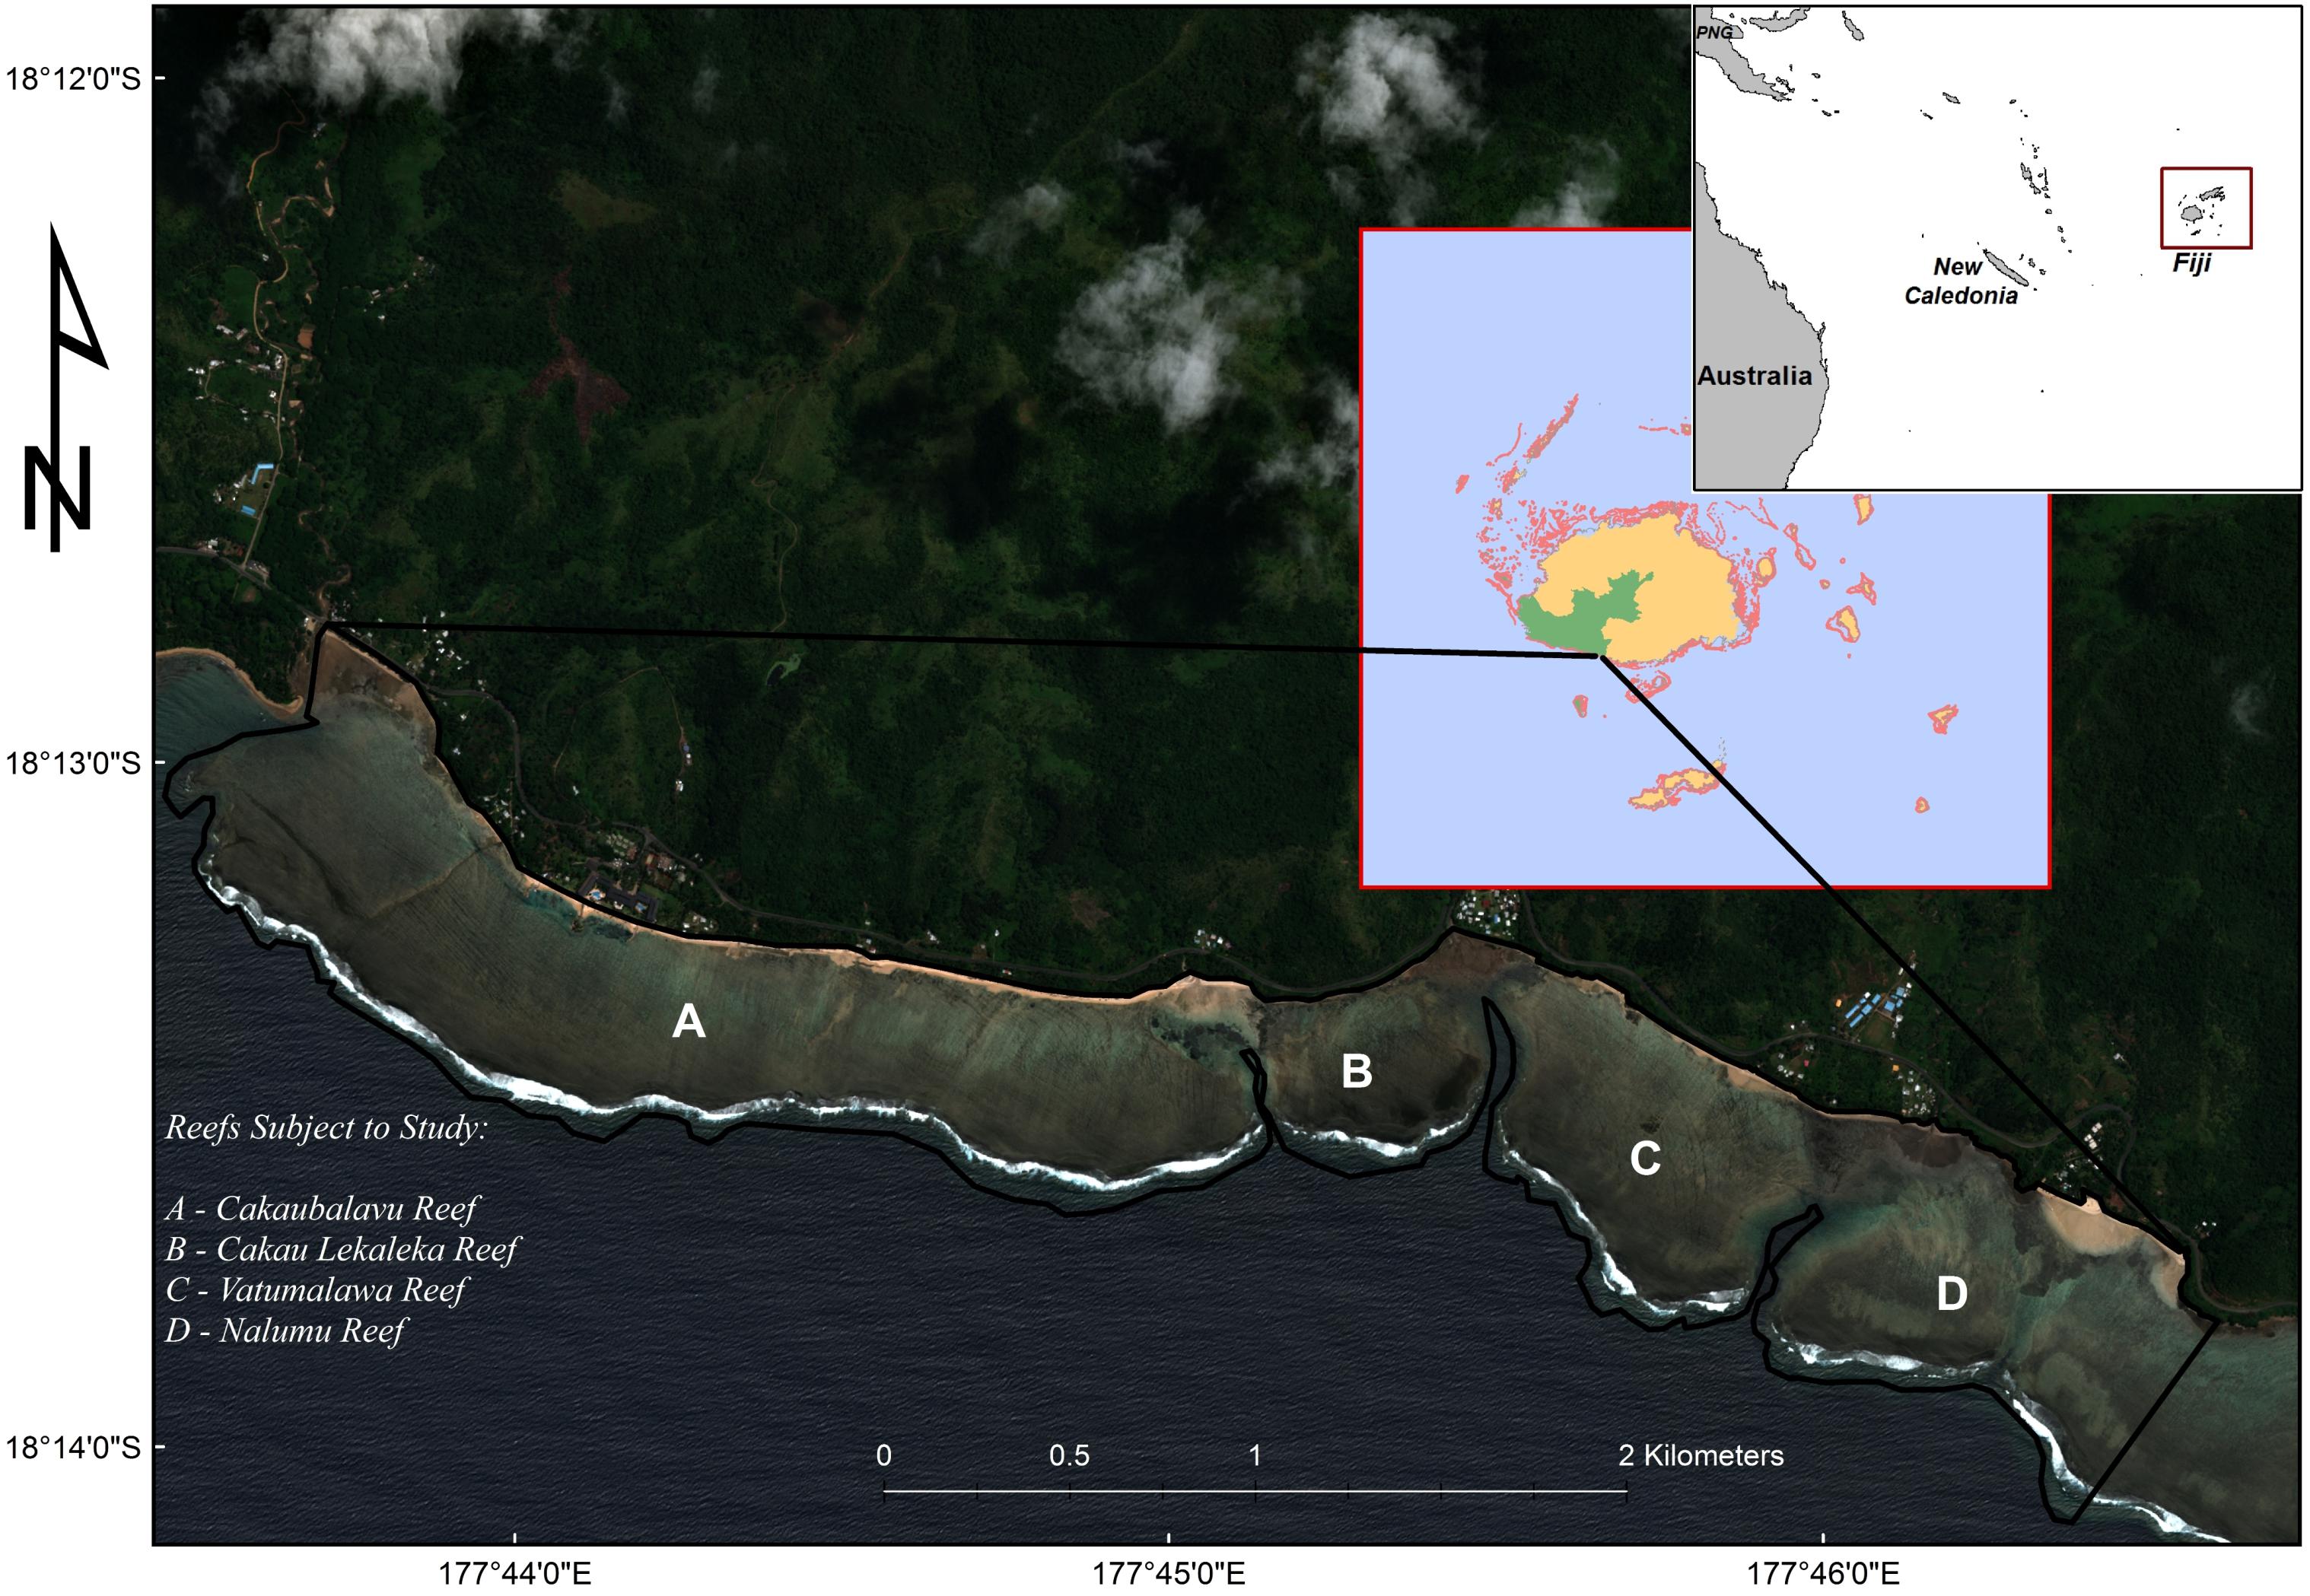
Figure 1. Location of the Komave study site on the southwestern coast of the main Island Viti Levu in Fiji. Komave watershed shown in green in inset of Fiji. Alphabets represent different reefs; (A) Cakaubalavu, (B) Cakau Lekaleka, (C) Vatumalawa, (D) Nalumu.
Field Survey
A field campaign was undertaken to collect ground-reference points (GRPs) for every target habitat class using a Trimble Pro 6T receiver and Juno 3D unit and digital camera with a log sheet to take field notes. Target habitats included coral, algae, brown algae, volcanic rocks, sand and gravel, sea grass, and bare (i.e., the beach area). The survey was carried out from the toe of the beach to the reef crest at low tide from July to November, 2016. Preliminary site visits found that some habitats, especially corals were not uniformly distributed but rather sparsely located throughout the study area. As a result, a survey based on randomized transect samples was not a viable option to capture sufficient GRPs for all classes during a limited field season. Instead, ad hoc transects were determined subjectively in the field to capture as much benthic-habitat heterogeneity as possible. At each GRP, GPS position was stored (and later differentially corrected in the lab), a photo taken, and the habitat and photo number recorded on the log sheet.
Spatial autocorrelation of habitats was minimized by taking GRPs points at least 20 m apart (McCarthy and Halls, 2014). GRPs collected were randomly halved. One half was used as the training sample: a set of data used for classification that is to fit the parameters of the classifier to train the algorithm. The other half was used to validate the classification and compute its accuracy.
Figure 2 shows the seven different types of benthic cover that were targeted for this study. Photos taken at GRPs were analyzed and assessed qualitatively as a quality control check on the initial field determination of habitat. For images with mixed classes, classification was done based on the dominant benthic class.
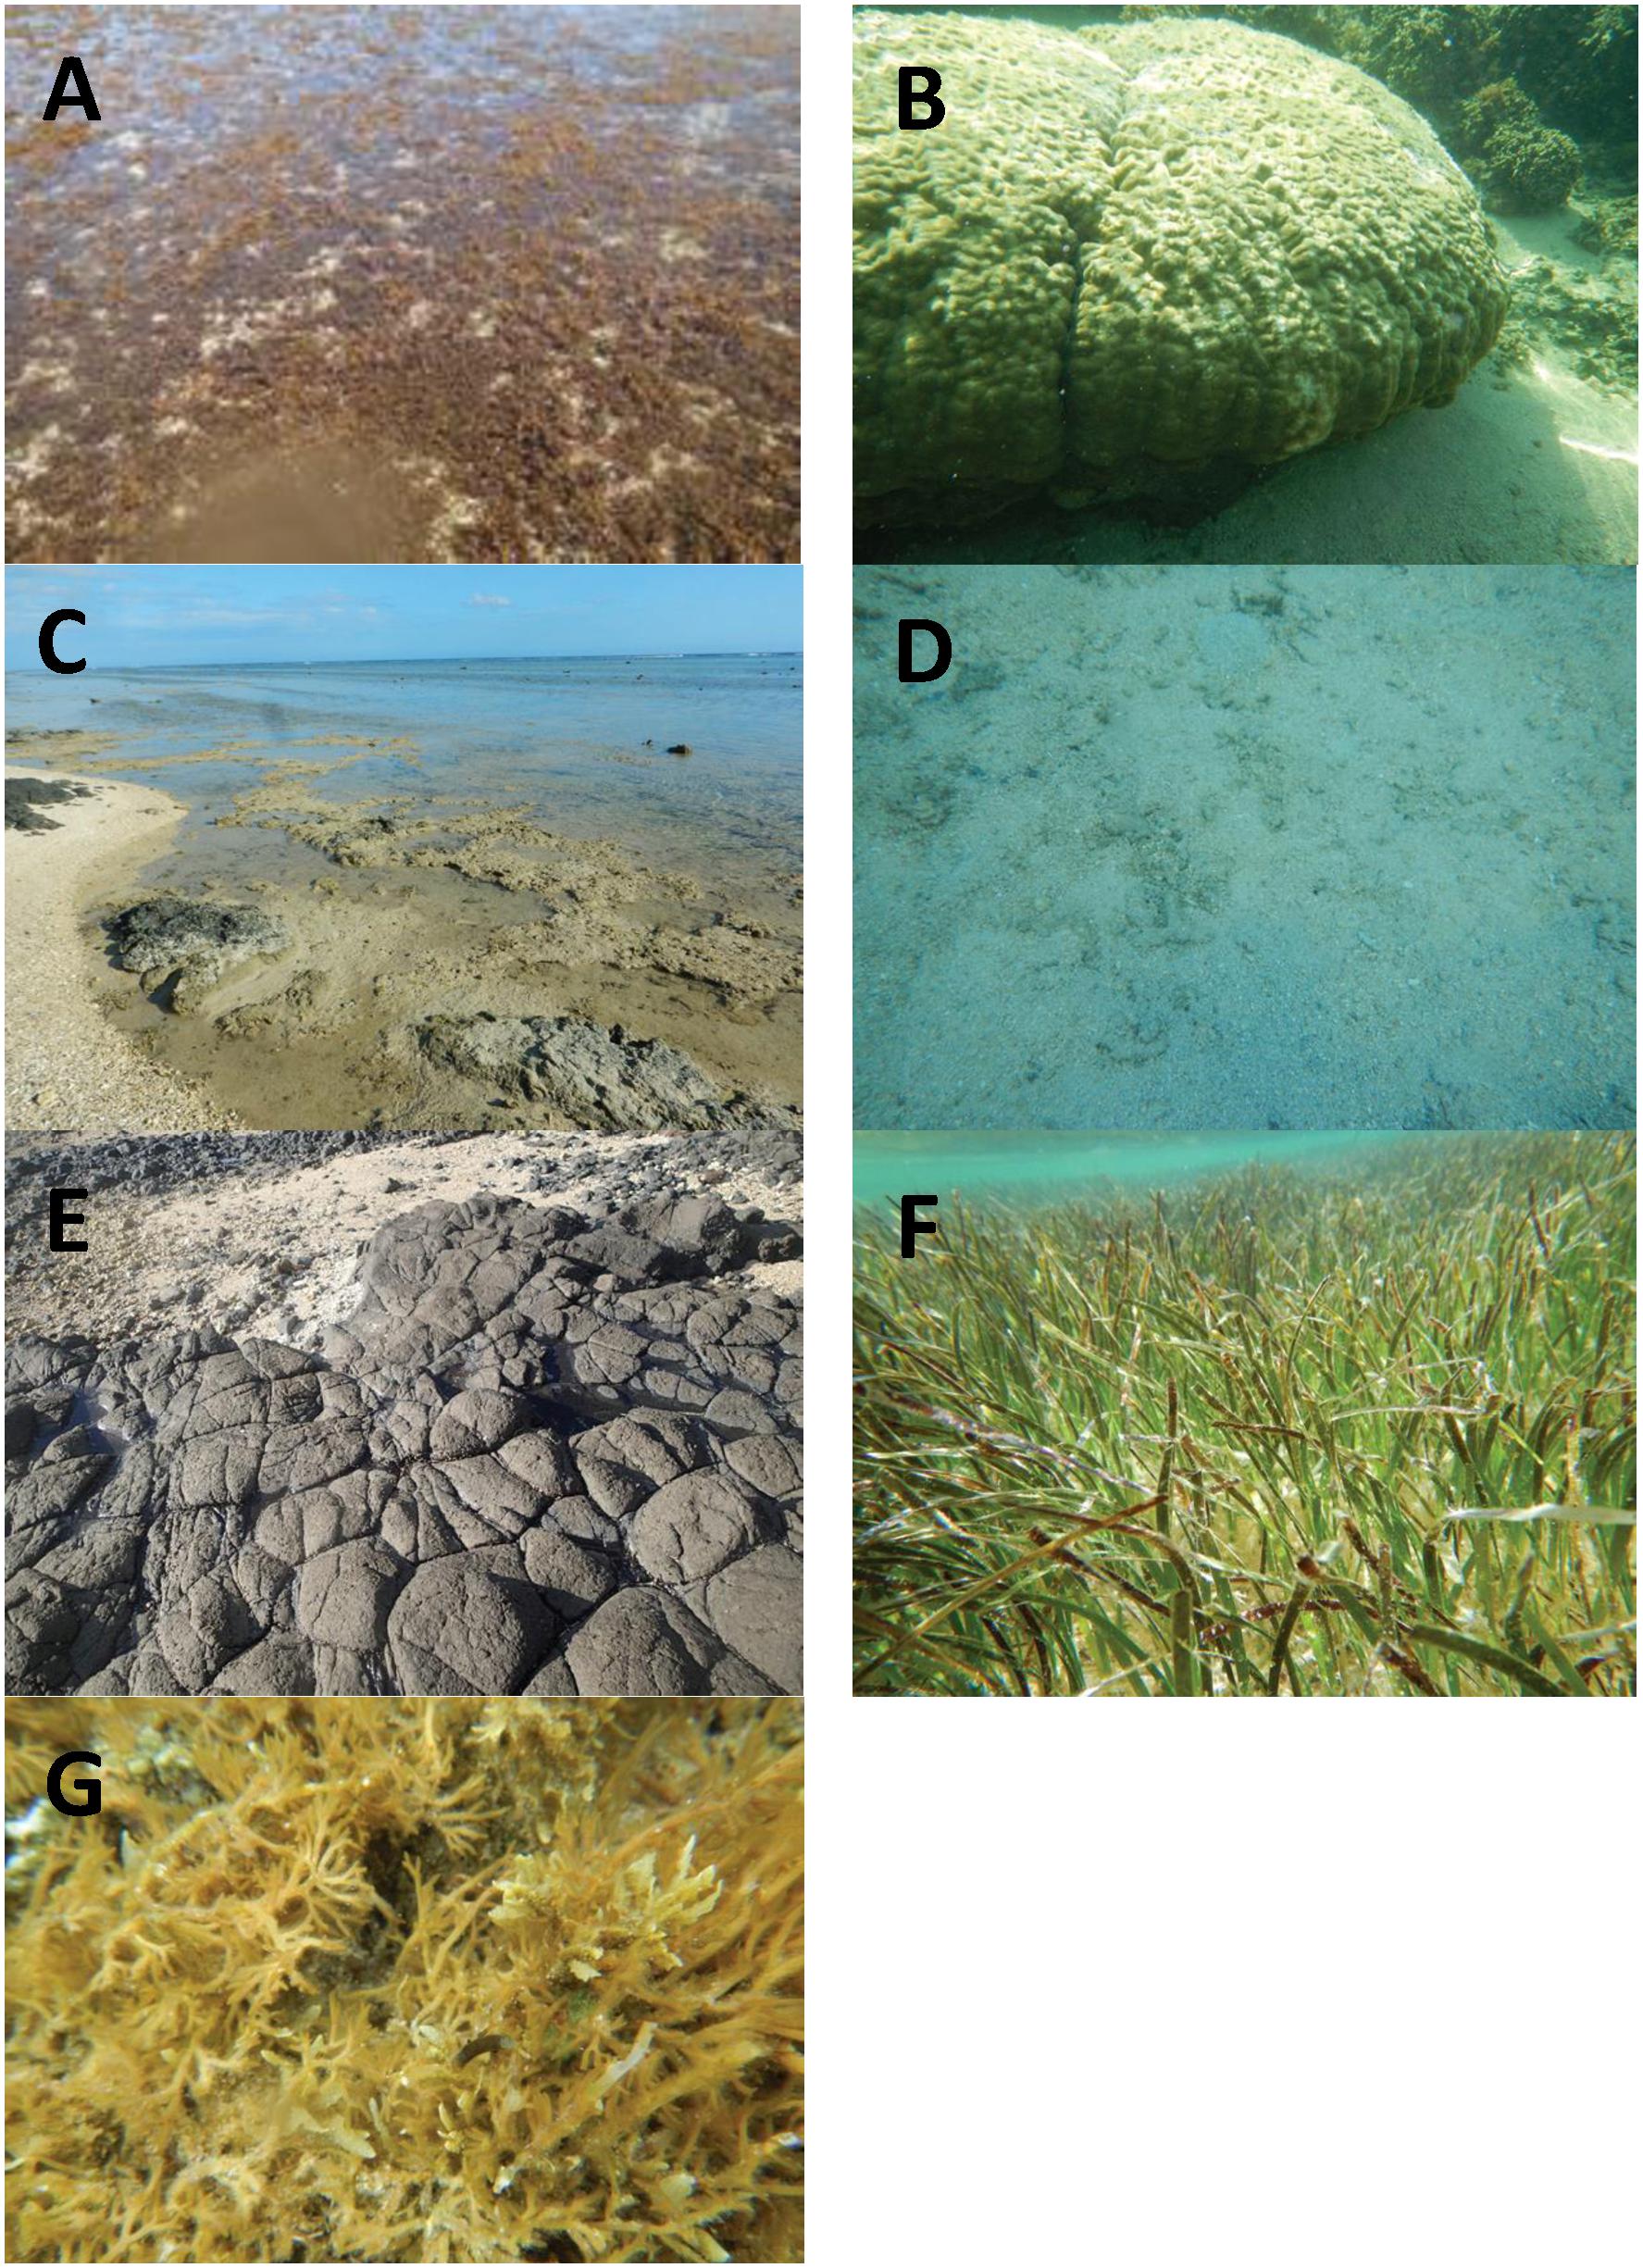
Figure 2. Seven benthic class types based on data collection at Komave. The letters represent each class type: (A) brown algae, (B) coral, (C) bare, (D) sand and gravel, (E) volcanic rocks, (F) sea grass, (G) algae.
Imagery Used
A single WorldView-2 image of the study site was used. The WorldView-2 satellite sensor was launched in 2009 and is operated by DigitalGlobeTM. It collects data in eight multispectral bands of visible and near-infrared at nominal spatial resolution of two meters (Digital Globe, 2009). The image was taken on the 24th of January, 2013. It was acquired through a collaborative partnership with the Institute of Marine Remote Sensing, University of South Florida. The data was delivered as a “LV1B” (i.e., sensor and radiometrically corrected only; Cheng and Chaapel, 2010).
Image Pre-processing
ENVI’s WorldView Radiance tool was used for radiometric calibration. This produced the radiance values by multiplying the metadata-based gain with the pixel value and adding the offset (Harris Geospatial Solution, 2016). Fast Line-of-sight Atmospheric Analysis (FLAASH) was used to radiometrically correct the image. FLAASH reduces the atmospheric effects on the imagery and produces at-the-surface reflectance (Phinn et al., 2012). Geometric corrections were performed for correct alignment of GRPs to the imagery. To maximize the computational capacity, the study site was cropped out of the image. Some areas were masked out of the image to avoid misclassification with target habitats (e.g., “white water” areas of the reef crest).
Supervised Classification and Accuracy Assessment
This classification is based on the assumption that multispectral satellite imagery measures different spectral signatures for different benthic cover. Spectral signatures describe how objects reflect solar radiation and correspond to physical and biological characteristics.
Maximum Likelihood Classifier (MLC) was chosen to carry out the classification since it is the most widely used supervised classification method (Yang et al., 2015). MLC automatically categorizes pixels in an image into a trained (i.e., target) class (Vahtmäe et al., 2012). MLC evaluates the brightness of one band compared to the other (variance and covariance) in the training class and then it categorizes pixels based on its maximum probability of belonging in a class (McCarthy and Halls, 2014).
Quantitative assessment of how accurately the pixels have been grouped into the user-defined classes is very important (Ismail and Jusoff, 2008). This is achieved by conducting an accuracy assessment on the classified image. The remaining half of the GRPs were used to construct a confusion matrix in ENVI. Using the results of the confusion matrix, the accuracy of the map was determined.
Derived Bathymetry
Bathymetric maps are important for understanding more about climate change effects. This type of survey can be used to alert scientists on ongoing and potential impacts including beach erosion, sea level rise and land sinking. Landsat 8 imagery was used to derive the bathymetry profile. The image comes with a coastal band where the wavelength penetrates deeper into the water column than the common blue band. The LANDSAT8 imagery was selected based on three criteria; (1) High sun elevation (ideally greater than 60 degree); (2) High tide to maximize submerged area over the reef flat; (3) Cloud free ratio. The processing was undertaken in Python2.7 for easy sharing and enhancement of the codes used for deriving bathymetry.
Climate Change Perception and Community Participatory Exercise
A qualitative, in-depth individual interview was also conducted at Komave village. The village consists of about 40 households with a population of around 208 individuals with approximately 114 females and 94 males. A total of 40 participations were interviewed between the ages of 25–45 consisting of 18 males (45%) and 22 females (55%). A qualitative research approach was particularly important to ascertain the coastal activities and climate change perception of the villagers. The interviews comprised of ‘yes,’ ‘no,’ and ‘no change’ type responses on fisheries resources, socioeconomic livelihood, climate change perception, tourism and benthic cover change. A participatory action research approach was also employed to fine tune the maps produced. Large color printed maps were provided to the villagers and human use activities were marked by the participants for different aspects including, fishing sites, proposed developments, picnic spots and marine protected areas (MPAs). These maps were later scanned, georeferenced to their real world coordinates and the different human use categories digitized into different layers. These sites were further verified by the villagers physically identifying the different sites and taking of GPS points. This information was used for adding GIS layers for local knowledge to the maps. Fisheries resource information was gathered as the villagers are reliant on a subsistence lifestyle and fisheries harvest for their socioeconomic livelihood.
For assurance of ethical considerations, the research permit was obtained from the Ministry of iTaukei1 Affairs (MIA), Ministry of Fishereis and the Ministry of Education, Fiji. The MIA looks after the affairs of the qoliqoli2 and other locally owned resources through Provincial administration. Each visit to the site was accompanied by provincial council members and village representatives. Sharing and publication of information on the status and use of qoliqoli resources was part of the project and an agreement among the villagers, MIA, The University of Fiji and the donor agency [United States Agency for International Development (USAID)]. Village representatives formed part of data gathering exercise and villagers were continuously updated on the progress of the project and data was shared with them including all the maps that were generated.
Results
The habitat map results, including each of the seven target habitats are shown in Figure 3 along with the site’s bathymetry map. Bathymetry map shows the study site to be quite shallow with most part of the study area below nine meters.
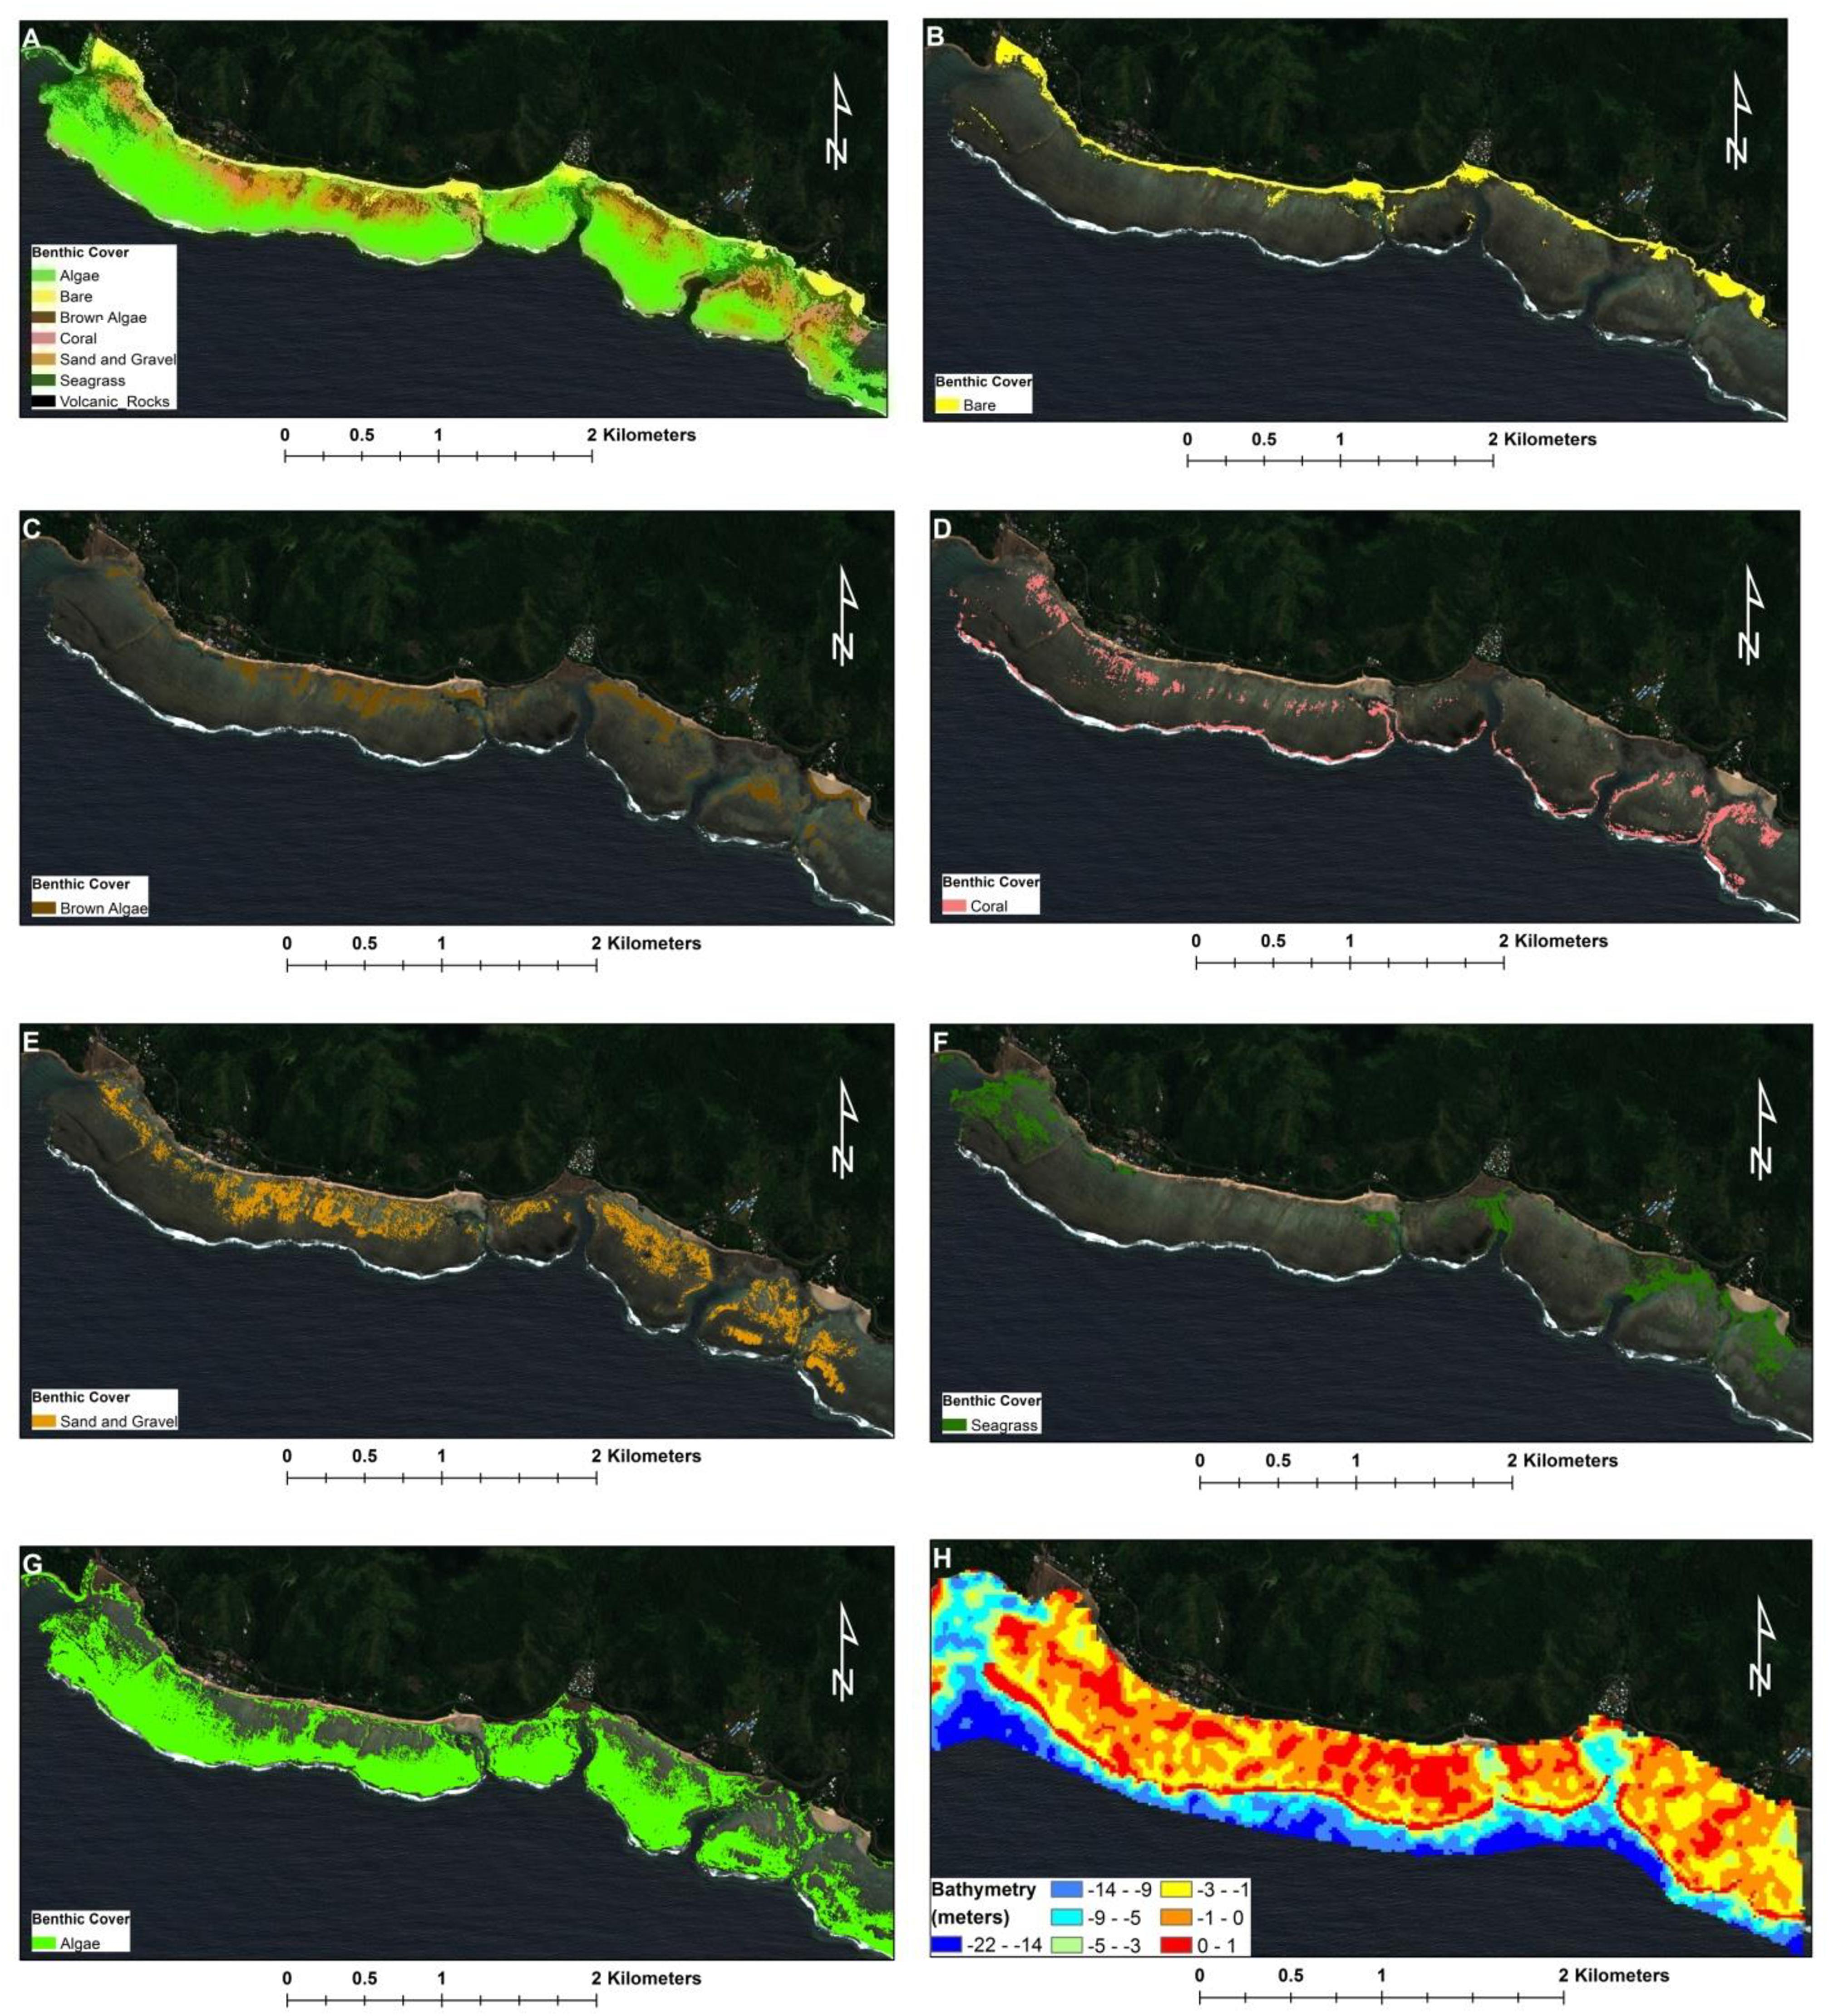
Figure 3. Benthic cover map for Komave coastal habitats. (A) Total benthic cover map with all seven classes represented, (B) bare, (C) brown algae, (D) coral, (E) sand and gravel, (F) sea grass, (G) algae, (H) is the bathymetry3 map showing the depth distribution of the study site.
The confusion matrix of the seven benthic habitat types is represented in Table 1. The matrix shows an overall accuracy of 91.6% with a kappa hat classification value of 0.9. Kappa hat classification is the measure of agreement between the classification map and the reference data. A kappa of 0.8 or above is considered a good classification and a kappa of 0.4 or below is considered a poor classification. Algae were the most dominant habitat type. The most dominant biotic cover was algae followed by sea grass, brown algae, and coral (Table 1).
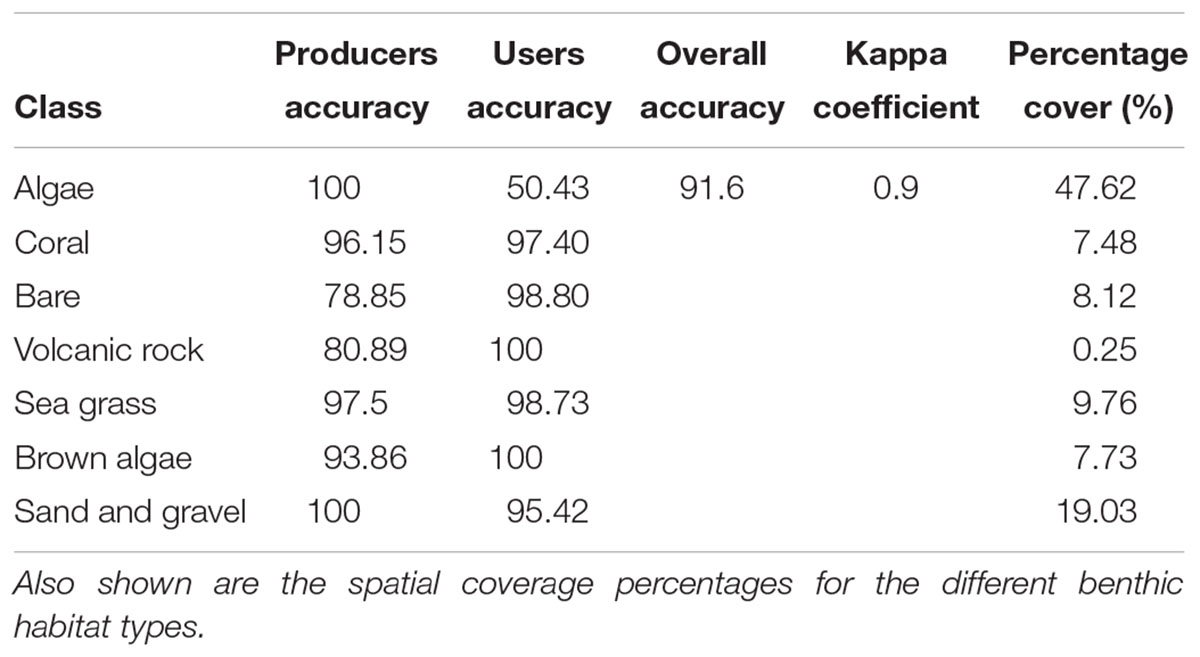
Table 1. Confusion matrix results and accuracy assessment for benthic cover maps at Komave.
Data gathered from semi-constructed questionnaires are summarized in Table 2. Historical fisheries data for Komave area was not available. The questionnaires formed an alternative method of gauging to some extent the past and present situation of fisheries status. The villagers have heavy reliance on access to fishery resources for their socio-economic livelihood. Although it is not quantitative, the data does provide anecdotal indication of fisheries decline over the past 10 years. It can also be seen that most of the interviewed personnel associate the decline in fisheries status with climate change and not land use activities even though there has been no scientific justification yet for the site. Information was also gathered on various aspects including participant’s observation of benthic cover change over time. Figure 4 shows the overlay of human activities over the benthic cover map. Proposed developments, fishing sites, picnic spots, and MPAs are shown. Also shown are the locations of two beach hotels within the Komave coast. A list of all the GIS layers produced is shown in Table 3. Interactive maps and more information is available in the Supplementary Material.
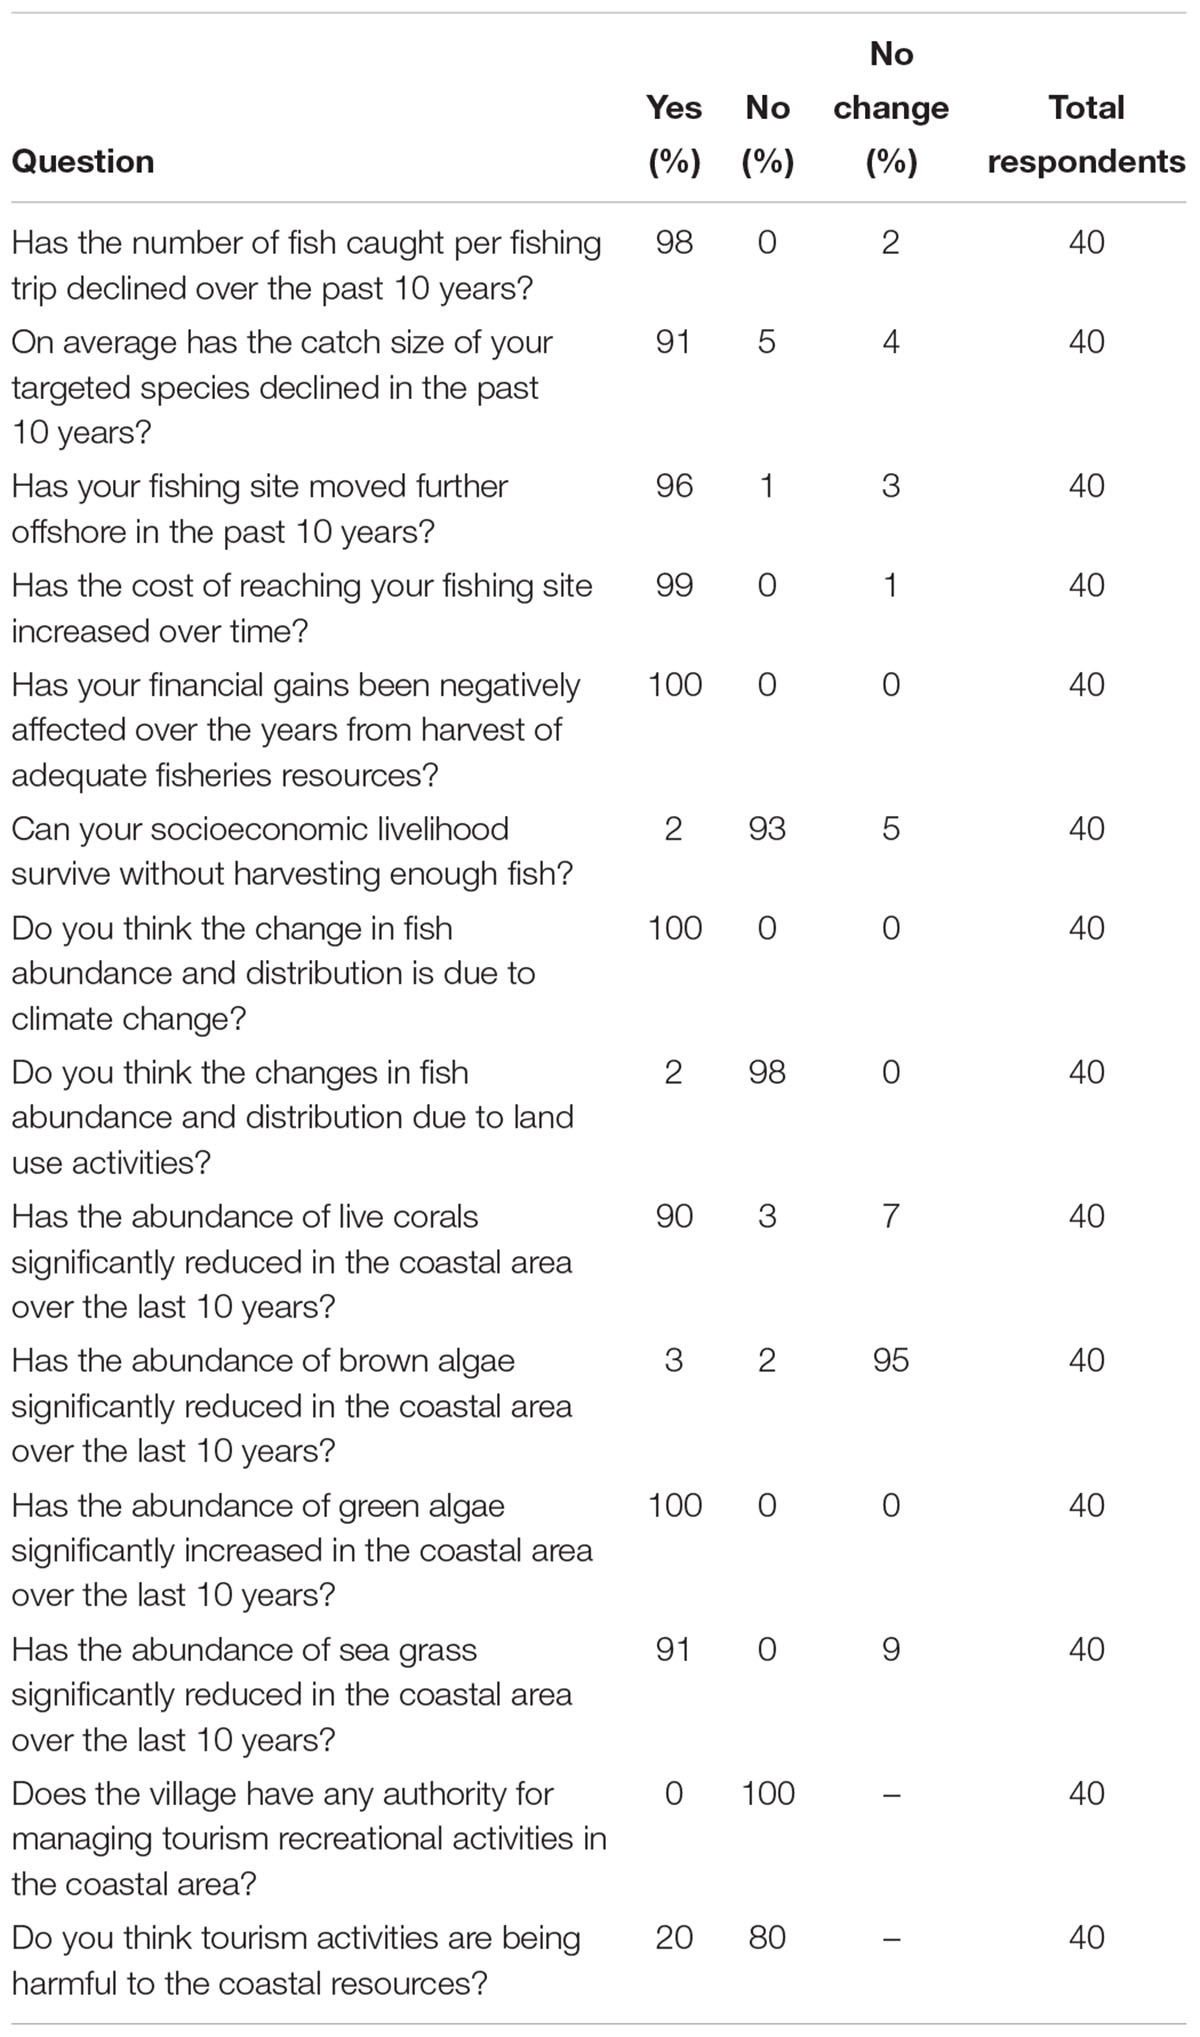
Table 2. Local knowledge information through community participatory approach on fisheries resources, socioeconomic livelihood, climate change perception, tourism and benthic cover change for Komave village.
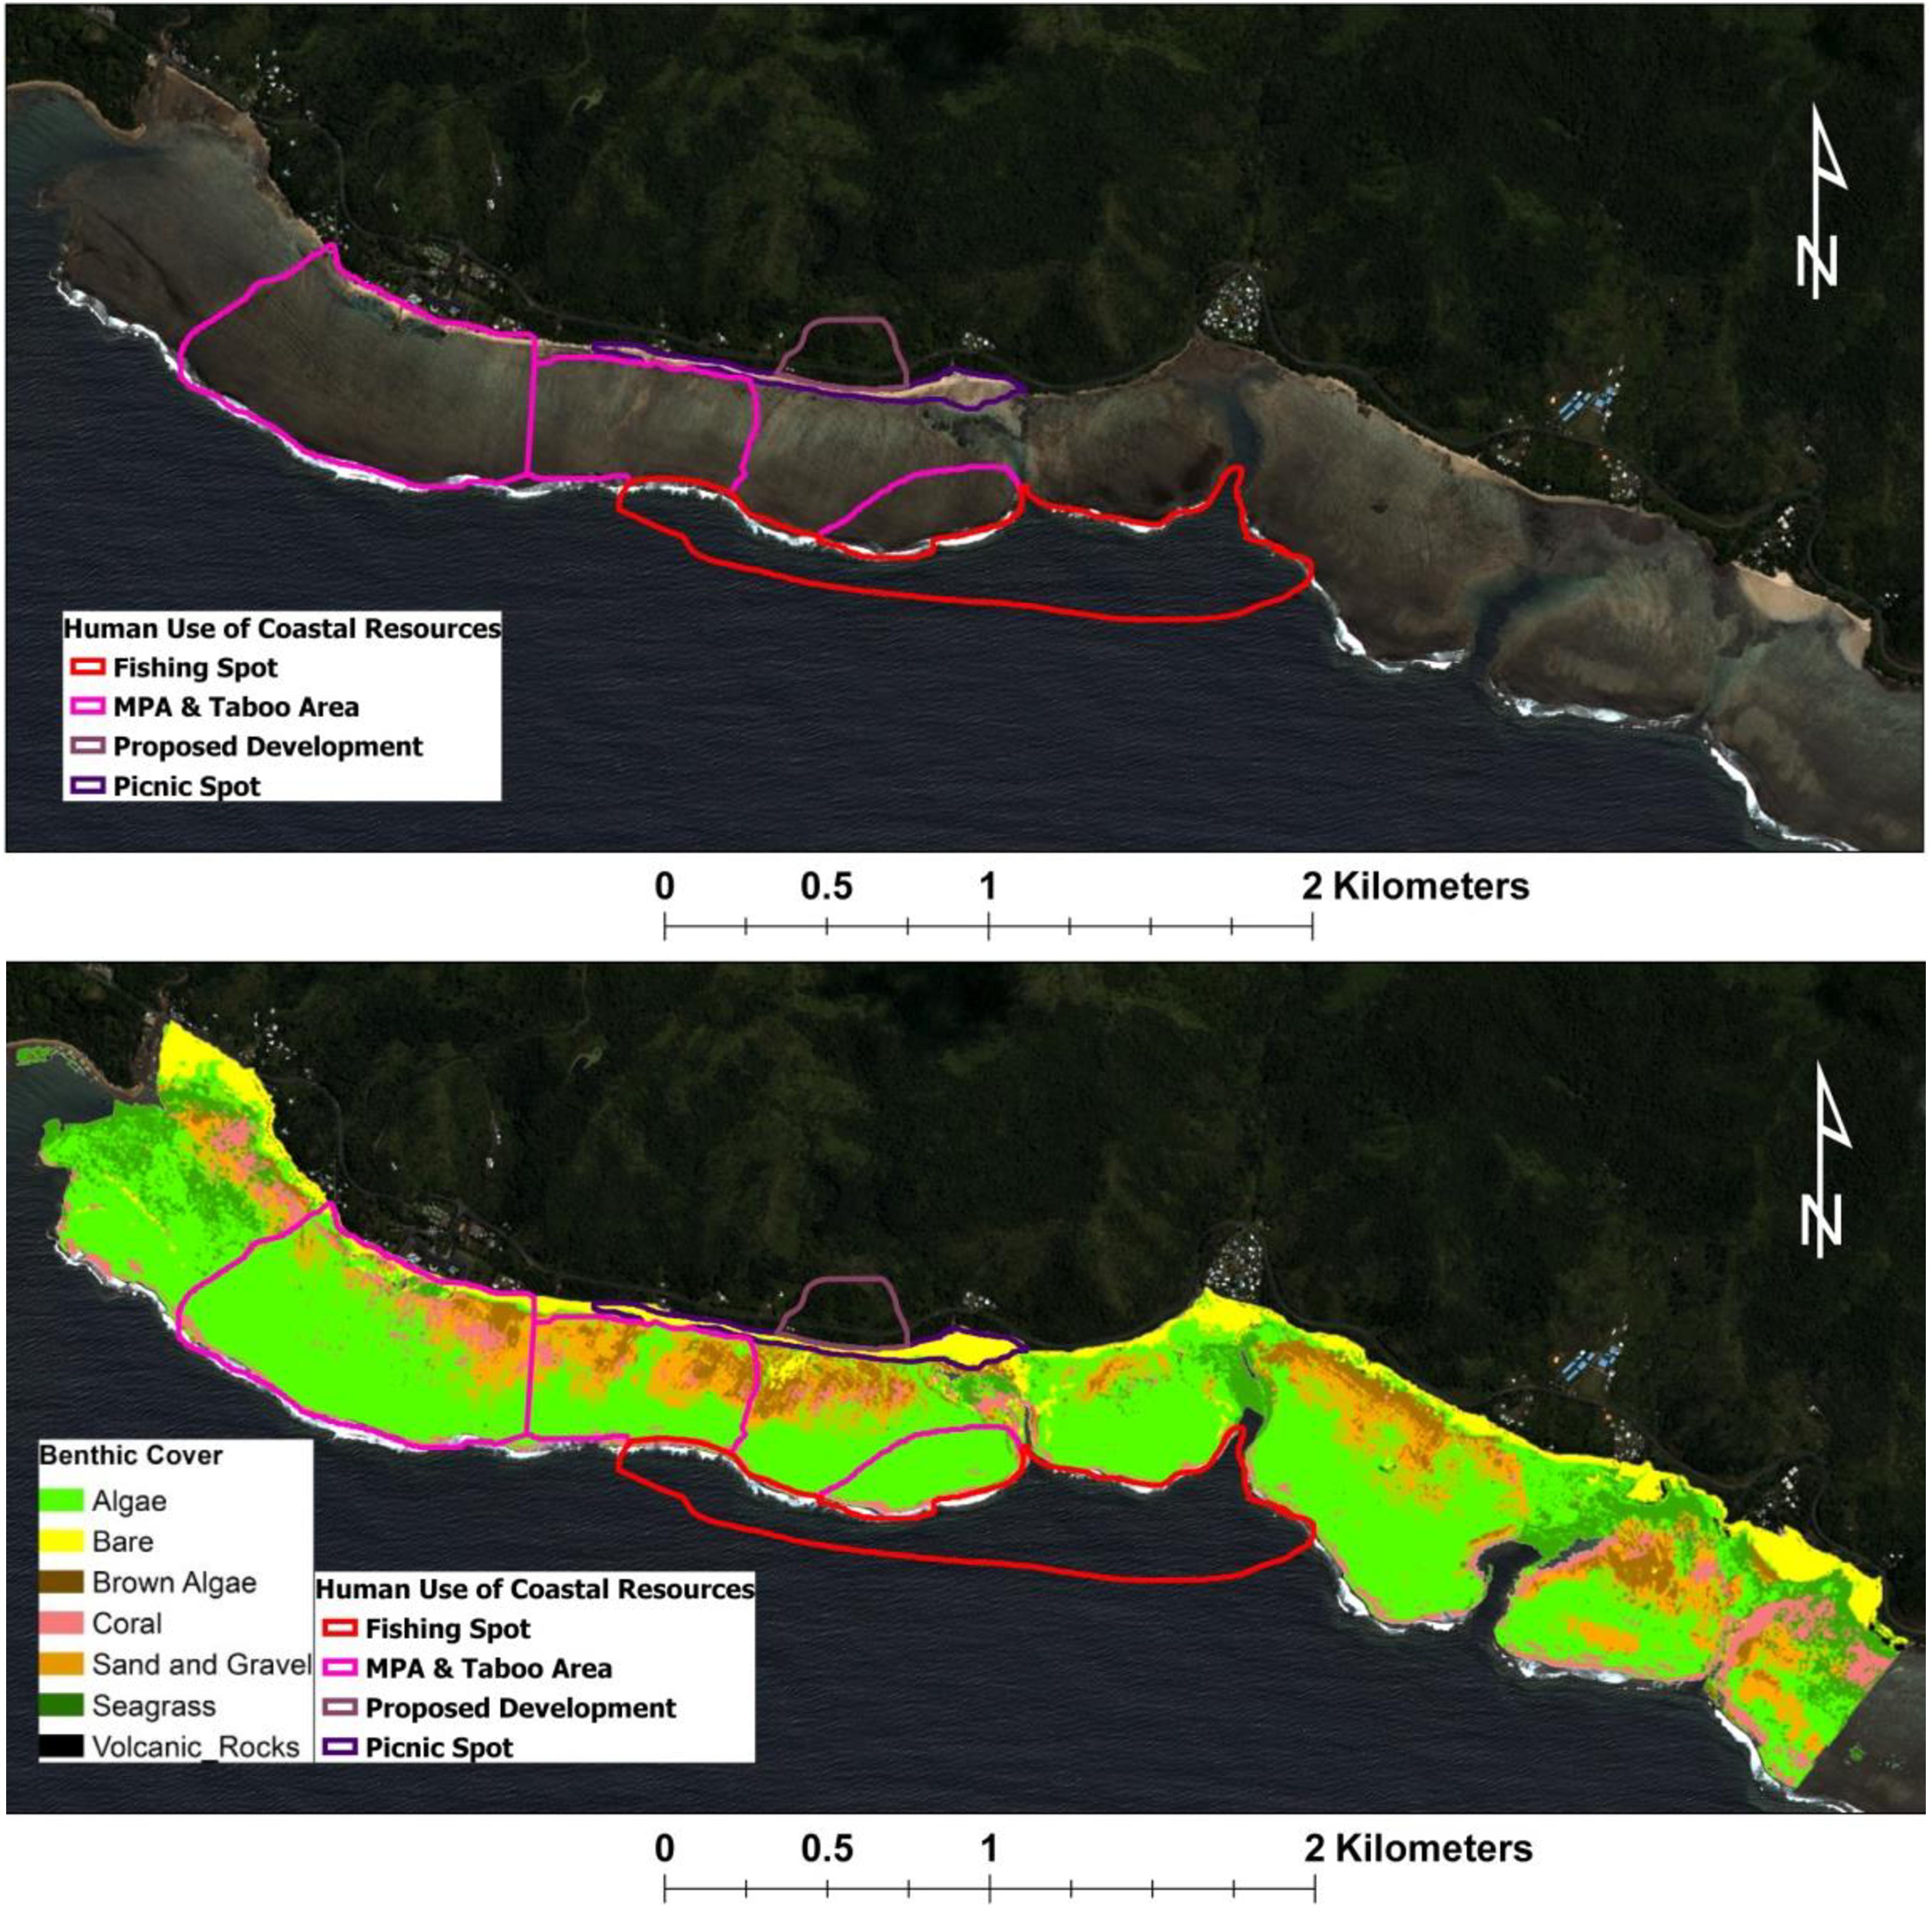
Figure 4. Benthic cover map for Komave coastal habitats overlaid with human use activities; fishing sites, proposed developments, picnic spot and marine protected area (MPA)/taboo area. (Top) Without benthic cover classes; (Bottom) with benthic cover classes.
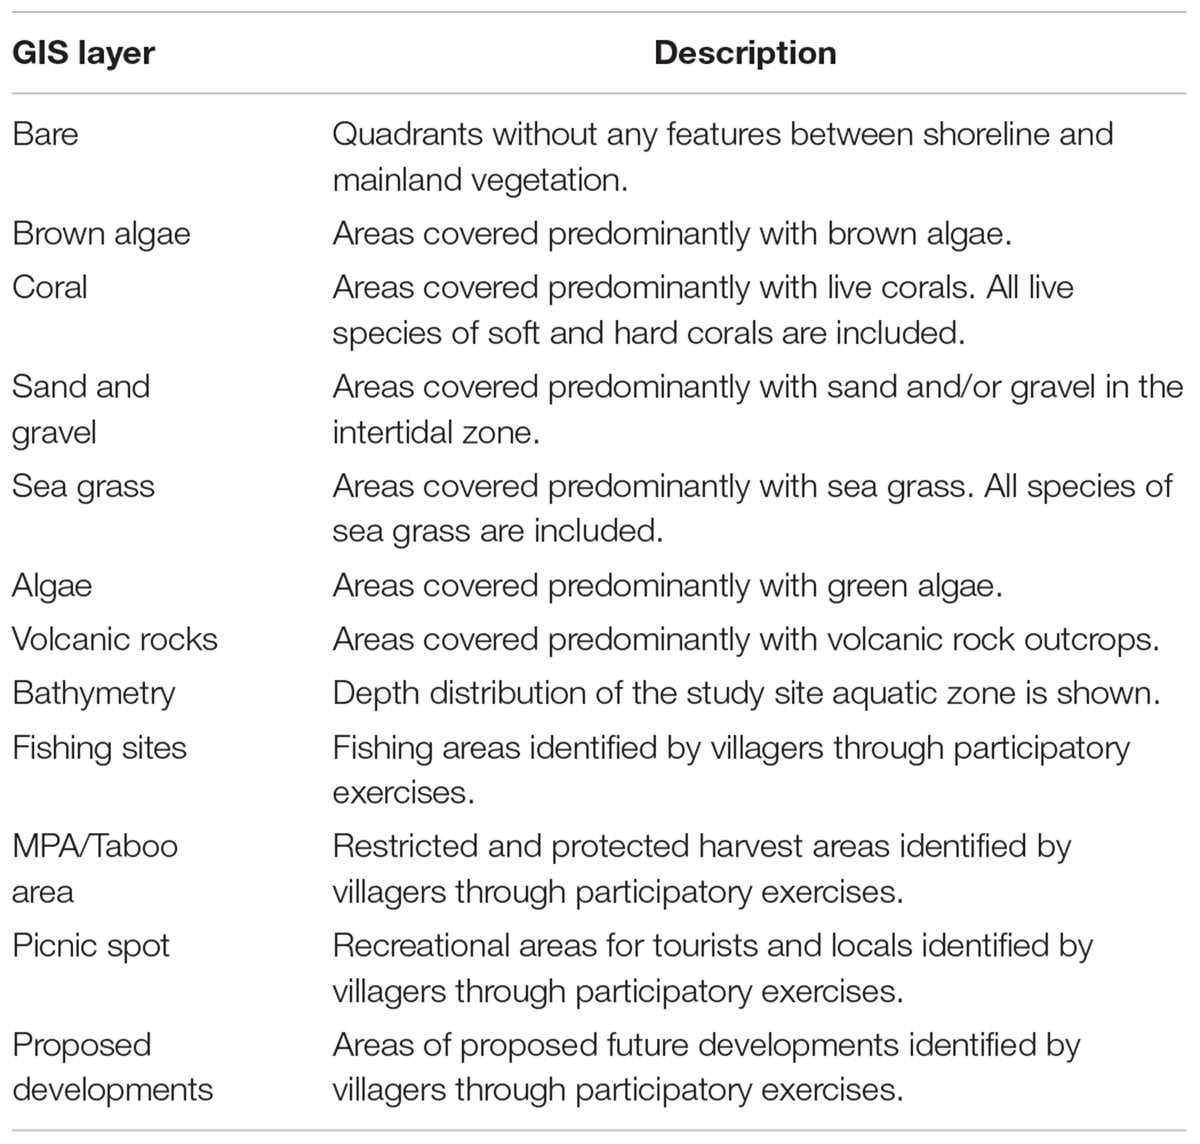
Table 3. GIS layers for benthic habitat and local knowledge for Komave coastal region.
Discussion
Habitat maps provide important information on the distribution and status of natural resources. They provide effective and reliant baseline information for appropriately gauging local management and economic options. Activities such as tourism recreational areas can be planned out based on the attractive natural resources such as coral reefs. Frequently generated maps of the same area can be used as a monitoring tool to keep track of the effectiveness of different management options. Impact of natural disasters, environmental regime shifts and extreme events can be gauged and monitored.
Critically analyzed benthic habitat maps can inform and improve the design of resource assessment surveys, which are routinely conducted to site and evaluate the potential impacts of development projects. Naidu et al. (2018) mapped out five classes of benthic resources in Komave with an overall accuracy of 71%. In this study a total of seven classes were mapped out with an overall accuracy of 91%. These maps can be used for marine and freshwater inventory surveys such as monitoring fish abundance and diversity, monitoring of the coral reef ecosystem, socio-economic analysis of the community, design and evaluation of MPAs and design and monitoring of fisheries management plans. The setting up of marine reserves and proper monitoring have the potential to support mitigation of, and adaptation to, climate change (Roberts et al., 2017). Monitoring of aquatic habitat alteration due to climate change and land use activities can be effectively done over time and targeted management policies can be effectively formulated such as community action plans toward conservation and sustainable management of resources.
The results of benthic cover mapping in Figure 3 serve as baseline information but it does not show changes in the cover over time. The cover change information is shown in Table 2 using community participatory approach. The information is qualitative but is does inform how the benthic cover has generally changed over time. Over a period of 10 years, it is noted that coral and sea grass cover has reduced, brown algae has seen no significant change while green algae cover has significantly increased. These are indications that the coastal resources have seen a decline in the past decade. The changes noted can partially be attributed to anthropogenic activities in Komave. Location of hotels, picnic spots and proposed developments are observed to be in close proximity to the coast (Figure 4). It is evident from Table 2 that the fisheries resources in Komave are facing issues of declining fish sizes and movement of targeted fish stock further away from the shore. This has significant repercussions on catch and costs associated with reaching the fishing sites. With time it costs fishermen more to catch less. Changes in sufficient access to fisheries resources have had significant negative impact on the socioeconomic livelihood of most of the households in the village.
Figure 3 and Table 1 show excessive benthic algal cover in the area and Figure 4 shows anthropogenic activities in the area including tourism and fishing activities. Elevated levels of algal growth have been shown to be strong indication of heavy metal pollution due to anthropogenic activities (Chakraborty et al., 2014; Phillips, 2017). The study conducted by Mosley and Aalbersberg (2003) at Komave, revealed overgrowth of algae due to increased levels of nitrates and phosphates in sea water. Elevated nutrient level resulted in loss of fish and invertebrate biodiversity as a loss of habitat heterogeneity. As a result, fishermen made use of small petroleum based engine boats to move further offshore for the catch. The combustion and possible leakage of petroleum fuel led to release of volatile and organic pollutants and heavy metals in sea water. In addition to this, waste water discharge from hotel and improper waste disposal and natural and anthropogenic activities have significantly contributed to heavy metal discharge in sea water which impairs physiological processes such as fertilization in corals.
Joseph et al. (2019) carried out a study in Komave coast on sea grass abundance and nitrate levels for 2 years between 2016 and 2017. A reduction in cover of five different sea grass species was noted. A significant negative relationship was determined between nitrate levels and total sea grass cover. Mosley and Aalbersberg (2003) reported that the nitrate and phosphate levels at the west of Komave village were 2.12 and 0.15 μM respectively during the beginning of April 2002 and 0.98 and 0.12 μM during the end of June 2002. The mean nitrate level for the water samples at the site was 1.55 μM and the mean phosphate level was 0.135 μM. The mean nitrate and phosphate levels exceeded levels considered to be harmful to coral reef ecosystems (nitrate > 1.0 mM; phosphate > 0.1 mM). Increased nutrient level has significantly increased the growth of phytoplankton and other algae (Sargassum sp.) which form the base of ocean food chain. Moreover, elevated levels of nutrients in coral reef ecosystems in Fiji has been shown to shift species dominance of the slow growing coral reef building (stony calcifying) corals to a larger non-calcifying faster growing corals. This process has resulted in mortality and loss of biodiversity of live corals and loss of settlement sites for coral larvae (Mosley and Aalbersberg, 2003). Increased levels of inorganic phosphorus led to a reduction in density of stony corals causing them to crumble and lose their strength. Elevated levels of Nitrate concentration over the study period indicated possible nutrient run off from anthropogenic and farming activities (crops and livestock) along the huge watershed flow leading to Komave coast (Joseph et al., 2019). With this knowledge, pressing issues such as the declining coastal fisheries resources can be better understood and managed.
A community-based participatory approach was adopted to engage the Komave villagers in the mapping process. The community members consisting of both men and women verified the maps and pointed out important fishing and gleaning zones, MPA areas, picnic spots and proposed development sites. The map was modified based on the information provided by the community members. Corrections were made accordingly in the map produced. Community-based participatory approach turned out to be an important prerequisite to effective data analysis and decision-making. It is particularly important because in several cases, community responses to climate change involve management actions that aim to protect coastal areas (Wiber et al., 2004). The local valuation of traditional ecological knowledge, the familiarity with resource use and distribution, and a sense of ownership of coastal reserves are essential aspects of community social structure that could be creatively integrated with scientific objectives to bring about societal transformations needed for conservation of the coastal resources. In this project, the community-based participants were not merely seen as external stakeholders, but as equal partners with local knowledge that was utilized to evaluate the research findings. Irrefutably, participatory methods can support informed and coordinated decision-making for marine resources. The findings of this study call for a comprehensive method that characterizes stakeholder practices as they relate to specific parts of the ocean using GIS and mapping support technologies. Using an all-inclusive integrated system, authors argue that managers can create meaningful participation for marine spatial planning, but there is an urgent need to overcome the existing complexities in engaging various marine resource users by increasing stakeholder participation and empowerment. It is difficult to understand marine conservation issues through the lens of one discipline only. While the core of this research involved creating high resolution baseline coastal resource maps, the talanoa4 sessions with the community participants provided critical information about the resource use and distribution that gave more insights into the conservation issues. Such integrated approaches that include both social and natural sciences are proving to be an effective tool for marine conservation and management, particularly in traditional coastal villages that rely on ocean resources for their livelihood (Leenhardt et al., 2015).
The maps generated on the seven benthic classes in this study will enable decision makers and stakeholders to use these as reference material for the state of the coastal resources. Annual mapping will allow for monitoring and change detection in the abundance and distribution of the benthic classes. The socioeconomic survey provides a useful tool for filling in data gaps and gauging general change patterns in coastal resources. In the South Pacific, most developing states have very little to no data availability on coastal resources. As is the case for Komave, a combination of benthic cover mapping and local knowledge integration can allow for meaningful baseline information for development of sustainable management plans. The procedure used can be easily replicated for different parts of Fiji as well as other PICs. Such baseline information is essential to gauge the coastal resource status in the PICs region and inform the development of regional management plans. In a global context, coastal resource information for PICs is lacking in many instances and creates information gaps for developing targeted global management plans. The kind of study done here can be used to fill in such data gaps.
Villagers’ perceptions attribute coastal resource changes to the changing climate (Table 1). Upon further query, all respondents advised that they were able to observe changes in the seasons and local media explains the impacts of climate change as such. This study showed to some extent that anthropogenic activities can have significant negative impact on coastal resources. Anthropogenic actions are much more feasible to control compared to the impacts associated with the global phenomenon of climate change. The maps and associated databases generated from the project will enable stakeholders such as government departments, research institutions and universities to carry out further interdisciplinary studies. This includes probable impacts of coral reef geomorphology due to resource use or ocean acidification in response to climate change. Changes in aquatic biodiversity due to expansion or reduction of habitat of different species as a result of ocean warming, sea level change or changes in ocean pH can be monitored and integrated with maps and databases from other regions generated using the same satellites. This will enable researchers to monitor and model global changes in oceanic properties related to climate change such as comparative sea temperature and pH levels.
Conclusion
The maps generated through this project are intended to assist the villagers in the identification of critical areas and the setting up of marine reserves. The integration of local knowledge with benthic cover maps provides improved tools and information for resource management. Different layers provide varied information from land-use and fishing activity to the layout of benthic habitats. Community participatory exercises and regular gathering of benthic cover information will add to the resource maps and possibly show changes over time. These changes can be monitored and managed with management effectiveness can be tracked over time. Policy makers can use the information to improve adaptation strategies currently in place and increase the resilience of communities toward the impacts of climate change leading to a greater food security and enhanced livelihoods.
Ethics Statement
For assurance of ethical considerations, the research permit approving this study was obtained from the Ministry of iTaukei Affairs (MIA), Ministry of Fishereis and the Ministry of Education, Fiji. The MIA looks after the affairs of the qoliqoli and other locally owned resources through Provincial administration. Each visit to the site was accompanied by provincial council members and village representatives. Sharing and publication of information on the status and use of qoliqoli resources was part of the project and an agreement among the villagers, MIA, The University of Fiji and the donor agency [United States Agency for International Development (USAID)]. All participants gave verbal informed consent to participate.
Author Contributions
AS assisted in field data collection and verification. He lead the manuscript write-up. AM lead the data collection, analysis, verification, and mapping exercise. MK assisted in data collection, verification, and analysis. PS assisted with data collection, verification, analysis, and assisted with the write-up. SS contributed to data analysis and manuscript write-up. FM-K motored and guided the methodology, data collection, and analysis. MM assisted in methodology development, data analysis, and manuscript editing. LJ assisted in data collection and analysis. HD and ZB contributed to field data collection, verification, and accuracy assessment.
Funding
This habitat mapping study was made possible through funding provided by USAID to The University of Fiji through the Pacific-American Climate Fund (PACAM) for the project – ‘Developing Base Maps of Tropical Aquatic Resources in the Pacific’. The following are acknowledged for their support: USAID, PACAM, Pacific Community (SPC) – Geoscience Division, University of Fiji, University of South Florida and the people of Komave village for their cooperation, hospitality, and assistance.
Conflict of Interest Statement
The authors declare that the research was conducted in the absence of any commercial or financial relationships that could be construed as a potential conflict of interest.
Supplementary Material
The Supplementary Material for this article can be found online at: https://www.frontiersin.org/articles/10.3389/fmars.2019.00207/full#supplementary-material
Footnotes
- ^Refers to native Fijians.
- ^Traditional Fijian term for natural coastal resources that are owned by locals.
- ^Note: Bathymetry map is not to be used for navigational purposes.
- ^Indigenous Fijian term that describes informal discussions.
References
Aswani, S., Albert, S., Sabetian, A., and Furusawa, T. (2007). Customary management as precautionary and adaptive principles for protecting coral reefs in Oceania. Coral Reefs 26:1009. doi: 10.1007/s00338-007-0277-z
Aswani, S., and Lauer, M. (2006). Benthic mapping using local aerial photo interpretation and resident taxa inventories for designing marine protected areas. Environ. Conserv. 33, 263–273. doi: 10.1017/S0376892906003183
Aswani, S., and Lauer, M. (2014). Indigenous people’s detection of rapid ecological change. Conserv. Biol. 28, 820–828. doi: 10.1111/cobi.12250
Atherton, J., Olson, D., Farley, L., and Qauqau, I. (2005). Fiji Watersheds at Risk: Watershed Assessment for Healthy Reefs and Fisheries. Final Rep to the United States Department of State OESI Grant # SFJ600 04 GR 004. Suva: Wildlife Conservation Society–South Pacific, 1–23.
Baleilevuka, A., Krüger, J., Kumar, S., Begg, Z., and Ngaluafe, P. (2014). Assessing Vulnerability and Adaptation to Sea-Level Rise. Benthic Habitat Mapping. Nouméa: Pacific Community (SPC).
Barbier, E. B., Hacker, S. D., Kennedy, C., Koch, E. W., Stier, A. C., and Silliman, B. R. (2011). The value of estuarine and coastal ecosystem services. Ecol. Monogr. 81, 169–193. doi: 10.1890/10-1510.1
Beckage, B., Gross, L. J., and Kauffman, S. (2011). The limits to prediction in ecological systems. Ecosphere 2, 1–12. doi: 10.1890/ES11-00211.1
Brown, K. T., Bender-Champ, D., Bryant, D. E., Dove, S., and Hoegh-Guldberg, O. (2017). Human activities influence benthic community structure and the composition of the coral-algal interactions in the central Maldives. J. Exp. Mar. Biol. Ecol. 497, 33–40. doi: 10.1016/j.jembe.2017.09.006
Chakraborty, S., Bhattacharya, T., Singh, G., and Maity, J. P. (2014). Benthic macroalgae as biological indicators of heavy metal pollution in the marine environments: a biomonitoring approach for pollution assessment. Ecotoxicol. Environ. Saf. 100, 61–68. doi: 10.1016/j.ecoenv.2013.12.003
Cheng, P., and Chaapel, C. (2010). Pan-sharpening and geometric correction: worldview-2 satellite. GeoInformatics 13, 30–33.
Cloern, J. E., Abreu, P. C., Carstensen, J., Chauvaud, L., Elmgren, R., Grall, J., et al. (2016). Human activities and climate variability drive fast-paced change across the world’s estuarine–coastal ecosystems. Glob. Change Biol. 22, 513–529. doi: 10.1111/gcb.13059
Digital Globe. (2009). Radiometric Use of WorldView-2 Imagery; Technical Note. Westminster, CO: Digital Globe.
Dowell, M., and Platt, T. (2009). “Partition of the ocean into ecological provinces: role of ocean-colour radiometry,” in Reports and Monographs of the International Ocean-Colour Coordinating Group (IOCCG), Vol. 9, eds M. Dowell, T. Platt, and V. Stuart (Dartmouth, NS: IOCCG), 1–98.
Elliott, J. A., Patterson, M. R., Staub, C. G., Koonjul, M., and Elliott, S. M. (2018). Decline in coral cover and flattening of the reefs around Mauritius (1998–2010). Peer J 6:e6014. doi: 10.7717/peerj.6014
Ellison, J. C. (2000). “How South Pacific mangroves may respond to predicted climate change and sea-level rise,” in Climate Change in the South Pacific: Impacts and Responses in Australia, New Zealand, and Small Island States, eds A. Gillespie and W. C. G. Burns (Dordrecht: Springer), 289–300.
Friedlander, A. M., Brown, E. K., and Monaco, M. E. (2007). Coupling ecology and GIS to evaluate efficacy of marine protected areas in Hawaii. Ecol. Appl. 17, 715–730.
Galparsoro, I., Borja, A., and Uyarra, M. C. (2014). Mapping ecosystem services provided by benthic habitats in the European North Atlantic Ocean. Front. Mar. Sci. 1:23. doi: 10.3389/fmars.2014.00023
Harris Geospatial Solution. (2016). Calibrating Images Tutorial. Available at: https://www.harrisgeospatial.com/docs/calibratingimagestutorial.html. (accessed November 22, 2016). doi: 10.3389/fmars.2014.00023
He, Q., Bertness, M. D., Bruno, J. F., Li, B., Chen, G., Coverdale, T. C., et al. (2014). Economic development and coastal ecosystem change in China. Sci. Rep. 4:5995. doi: 10.1038/srep05995
Hernández-Delgado, E. A. (2015). The emerging threats of climate change on tropical coastal ecosystem services, public health, local economies and livelihood sustainability of small islands: cumulative impacts and synergies. Mar. Pollut. Bull. 101, 5–28. doi: 10.1016/j.marpolbul.2015.09.018
Hochberg, E. J., and Atkinson, M. J. (2003). Capabilities of remote sensors to classify coral, algae, and sand as pure and mixed spectra. Remote Sens. Environ. 85, 174–189. doi: 10.1016/S0034-4257(02)00202-X
Ismail, M. H., and Jusoff, K. (2008). Satellite data classification accuracy assessment based from reference dataset. Int. J. Comp. Inform. Sci. Eng. 2, 96–102.
Joseph, L., Singh, P., Singh, A. A., Raj, K., and Maharaj, A. (2019). Implications of seagrass ecosystem degradation on marine resources and people’s livelihood: a case study from Komave Village, Fiji. Asian J. Fish. Aquat. Res. 2, 1–13.
Le Cornu, E., Doerr, A. N., Finkbeiner, E. M., Gourlie, D., and Crowder, L. B. (2017). Spatial management in small-scale fisheries: a potential approach for climate change adaptation in Pacific Islands. Mar. Policy 88, 350–358. doi: 10.1016/j.marpol.2017.09.030
Lee, Y. C., Ahern, J., and Yeh, C. T. (2015). Ecosystem services in peri-urban landscapes: the effects of agricultural landscape change on ecosystem services in Taiwan’s western coastal plain. Landsc. Urban Plan. 139, 137–148. doi: 10.1016/j.landurbplan.2015.02.023
Leenhardt, P., Teneva, L., Kininmonth, S., Darling, E., Cooley, S., and Claudet, J. (2015). Challenges, insights and perspectives associated with using social-ecological science for marine conservation. Ocean Coast. Manag. 115, 49–60. doi: 10.1016/j.ocecoaman.2015.04.018
McCarthy, M. J., and Halls, J. N. (2014). Habitat mapping and change assessment of coastal environments: an examination of WorldView-2, QuickBird, and IKONOS satellite imagery and airborne LiDAR for mapping barrier island habitats. ISPRS Int. J. Geo Inf. 3, 297–325. doi: 10.3390/ijgi3010297
McCoy, K., Ayotte, P., Gray, A. K., Lino, K., Schumacher, B., and Sudnovsky, M. (2015). Coral Reef Fish Biomass and Benthic Cover Along the North Coast of Timor-Leste Based on Underwater Visual Surveys in June 2013. PIFSC Data Report DR-15-004. Honolulu, HI: Pacific Islands Fisheries Science Center.
Mimura, N. (1999). Vulnerability of island countries in the South Pacific to sea level rise and climate change. Clim. Res. 12, 137–143. doi: 10.3354/cr012137
Moreno, A., and Becken, S. (2009). A climate change vulnerability assessment methodology for coastal tourism. J. Sustain. Tour. 17, 473–488. doi: 10.1080/09669580802651681
Mosley, L. M., and Aalbersberg, W. G. (2003). Nutrient levels in sea and river water along the ‘Coral Coast’of Viti Levu, Fiji. South Pac. J. Nat. Appl. Sci. 21, 35–40. doi: 10.1071/SP03007
Mumby, P. J., Green, E. P., Edwards, A. J., and Clark, C. D. (1999). The cost-effectiveness of remote sensing for tropical coastal resources assessment and management. J. Environ. Manag. 55, 157–166. doi: 10.1006/jema.1998.0255
Naidu, R., Muller-Karger, F., and McCarthy, M. (2018). “Mapping of benthic habitats in Komave, coral coast using worldview-2 satellite imagery,” in Climate Change Impacts and Adaptation Strategies for Coastal Communities. Climate Change Management, ed. W. Leal Filho (Cham: Springer).
Pakeman, R. J., Reid, C. L., Lennon, J. J., and Kent, M. (2008). Possible interactions between environmental factors in determining species optima. J. Veg. Sci. 19, 201–208. doi: 10.3170/2007-8-18353
Pandolfi, J. M., Bradbury, R. H., Sala, E., Hughes, T. P., Bjorndal, K. A., Cooke, R. G., et al. (2003). Global trajectories of the long-term decline of coral reef ecosystems. Science 301, 955–958. doi: 10.1126/science.1085706
Phillips, D. J. (2017). “Use of macroalgae and invertebrates as monitors of metal levels in estuaries and coastal waters,” in Heavy Metals in the Marine Environment, ed. R. W. Furness (Boca Raton, FL: CRC Press), 81–99.
Phinn, S. R., Roelfsema, C. M., and Mumby, P. J. (2012). Multi-scale, object-based image analysis for mapping geomorphic and ecological zones on coral reefs. Int. J. Remote Sens. 33, 3768–3797. doi: 10.1080/01431161.2011.633122
Rice, J. C., and Garcia, S. M. (2011). Fisheries, food security, climate change, and biodiversity: characteristics of the sector and perspectives on emerging issues. ICES J. Mar. Sci. 68, 1343–1353. doi: 10.1093/icesjms/fsr041
Roberts, C. M., O’Leary, B. C., McCauley, D. J., Cury, P. M., Duarte, C. M., Lubchenco, J., et al. (2017). Marine reserves can mitigate and promote adaptation to climate change. Proc. Natl. Acad. Sci. U.S.A. 114, 6167–6175. doi: 10.1073/pnas.1701262114
Röckmann, C., Ulrich, C., Dreyer, M., Bell, E., Borodzicz, E., Haapasaari, P., et al. (2012). The added value of participatory modelling in fisheries management–what has been learnt? Mar. Policy 36, 1072–1085. doi: 10.1016/j.marpol.2012.02.027
Roelfsema, C., Phinn, S., and Comley, J. (2007). “Mapping benthic habitats on Fijian coral reefs: evaluating combined field and remote sensing approaches,” in Proceedings of the Asian Conference on Remote Sensing and the 28th Asian Conference on Remote Sensing, (Kuala Lumpur), 12–16.
Ruppert, J. L., Vigliola, L., Kulbicki, M., Labrosse, P., Fortin, M. J., and Meekan, M. G. (2018). Human activities as a driver of spatial variation in the trophic structure of fish communities on Pacific coral reefs. Glob. Change Biol. 24, e67–e79. doi: 10.1111/gcb.13882
Sherman, K., O’reilly, J., Belkin, I. M., Melrose, C., and Friedland, K. D. (2011). The application of satellite remote sensing for assessing productivity in relation to fisheries yields of the world’s large marine ecosystems. ICES J. Mar. Sci. 68, 667–676. doi: 10.1093/icesjms/fsq177
Sundblad, G., and Bergström, U. (2014). Shoreline development and degradation of coastal fish reproduction habitats. AMBIO 43, 1020–1028. doi: 10.1007/s13280-014-0522-y
Sundblad, G., Bergström, U., and Sandström, A. (2011). Ecological coherence of marine protected area networks: a spatial assessment using species distribution models. J. Appl. Ecol. 48, 112–120. doi: 10.1111/j.1365-2664.2010.01892.x
Teixeira, J. B., Martins, A. S., Pinheiro, H. T., Secchin, N. A., de Moura, R. L., and Bastos, A. C. (2013). Traditional ecological knowledge and the mapping of benthic marine habitats. J. Environ. Manag. 115, 241–250. doi: 10.1016/j.jenvman.2012.11.020
Vahtmäe, E., Kutser, T., Kotta, J., Pärnoja, M., Möller, T., and Lennuk, L. (2012). Mapping Baltic Sea shallow water environments with airborne remote sensing. Oceanology 52, 803–809. doi: 10.1134/S0001437012060148
Vanderstraete, T., Goossens, R., and Ghabour, T. K. (2005). “Using remote sensing and GIS for integrated coastal zone management a case study: the coral reefs in the northwestern red sea,” in Proceedings of the 8th International Conference on Remote Sensing for Marine and Coastal Environments, (Hurghada), 17–19.
Weeks, R., and Jupiter, S. D. (2013). Adaptive co-management of a marine protected area network in Fiji. Conserv. Biol. 27, 1234–1244. doi: 10.1111/cobi.12153
Wiber, M., Berkes, F., Charles, A., and Kearney, J. (2004). Participatory research supporting community-based fishery management. Mar. Policy 28, 459–468. doi: 10.1016/j.marpol.2003.10.020
Wilkinson, C. C. (2004). Status of Coral Reefs of the world: 2004, Vol. 2. Crawley, WA: Australian Institute of Marine Science (AIMS).
Williams, G. A., Helmuth, B., Russell, B. D., Dong, Y. W., Thiyagarajan, V., and Seuront, L. (2016). Meeting the climate change challenge: pressing issues in southern China and SE Asian coastal ecosystems. Reg. Stud. Mar. Sci. 8, 373–381. doi: 10.1016/j.rsma.2016.07.002
Worm, B., Barbier, E. B., Beaumont, N., Duffy, J. E., Folke, C., Halpern, B. S., et al. (2006). Impacts of biodiversity loss on ocean ecosystem services. Science 314, 787–790. doi: 10.1126/science.1132294
Keywords: GIS, coastal resource, benthic cover, Fiji, WorldView-2, satellite imagery
Citation: Singh AA, Maharaj A, Kumar M, Singh P, Singh S, Muller-Karger FE, McCarthy M, Joseph L, Damlamian H and Begg Z (2019) Developing High Resolution Baseline Coast Resource Maps Using World View 2 Imagery for a Coastal Village in Fiji. Front. Mar. Sci. 6:207. doi: 10.3389/fmars.2019.00207
Received: 12 September 2018; Accepted: 02 April 2019;
Published: 24 April 2019.
Edited by:
Edward Jeremy Hind-Ozan, Department for Environment, Food and Rural Affairs, United KingdomReviewed by:
Andrew M. Fischer, University of Tasmania, AustraliaKimberly Elaine Baldwin, The University of the West Indies, Cave Hill, Barbados
Copyright © 2019 Singh, Maharaj, Kumar, Singh, Singh, Muller-Karger, McCarthy, Joseph, Damlamian and Begg. This is an open-access article distributed under the terms of the Creative Commons Attribution License (CC BY). The use, distribution or reproduction in other forums is permitted, provided the original author(s) and the copyright owner(s) are credited and that the original publication in this journal is cited, in accordance with accepted academic practice. No use, distribution or reproduction is permitted which does not comply with these terms.
*Correspondence: Ashneel Ajay Singh, YWpheW1zcDFAZ21haWwuY29t