 Nina Bednaršek1*
 Richard Alan Feely2
 Ella L. Howes3
 Brian P. V. Hunt4,5,6
 Faycal Kessouri1
 Pablo León7
 Silke Lischka8
 Amy E. Maas9Karen McLaughlin1Nikolay P. Nezlin1
 Martha Sutula1
 Stephen B. Weisberg1
- 1Southern California Coastal Water Research Project, Costa Mesa, CA, United States
- 2NOAA Pacific Marine Environmental Laboratory, Seattle, WA, United States
- 3Centre for Environment, Fisheries and Aquaculture Science, Marine Climate Change Centre, Lowestoft, United Kingdom
- 4Institute for the Oceans and Fisheries, University of British Columbia, Vancouver, BC, Canada
- 5Hakai Institute, Heriot Bay, BC, Canada
- 6Department of Earth, Ocean, and Atmospheric Sciences, University of British Columbia, Vancouver, BC, Canada
- 7Marine Scotland Science, Aberdeen, United Kingdom
- 8GEOMAR Helmholtz Centre for Ocean Research, Kiel, Germany
- 9Bermuda Institute of Ocean Sciences, St. George's, Bermuda
Interpreting the vulnerability of pelagic calcifiers to ocean acidification (OA) is enhanced by an understanding of their critical thresholds and how these thresholds are modified by other climate change stressors (e.g., warming). To address this need, we undertook a three-part data synthesis for pteropods, one of the calcifying zooplankton group. We conducted the first meta-analysis and threshold analysis of literature characterizing pteropod responses to OA and warming by synthetizing dataset comprising of 2,097 datapoints. Meta-analysis revealed the extent to which responses among studies conducted on differing life stages and disparate geographies could be integrated into a common analysis. The results demonstrated reduced calcification, growth, development, and survival to OA with increased magnitude of sensitivity in the early life stages, under prolonged duration, and with the concurrent exposure of OA and warming, but not species-specific sensitivity. Second, breakpoint analyses identified OA thresholds for several endpoints: dissolution (mild and severe), calcification, egg development, shell growth, and survival. Finally, consensus by a panel of pteropod experts was used to verify thresholds and assign confidence scores for five endpoints with a sufficient signal: noise ratio to develop life-stage specific, duration-dependent thresholds. The range of aragonite saturation state from 1.5–0.9 provides a risk range from early warning to lethal impacts, thus providing a rigorous basis for vulnerability assessments to guide climate change management responses, including an evaluation of the efficacy of local pollution management. In addition, meta-analyses with OA, and warming shows increased vulnerability in two pteropod processes, i.e., shell dissolution and survival, and thus pointing toward increased threshold sensitivity under combined stressor effect.
Introduction
Ocean acidification (OA) is already impacting marine habitats worldwide, with projected changes to become widespread over this century (Bakun et al., 2010). The greatest rate of change is anticipated in the upwelling and polar regions (Bopp et al., 2013; Chavez et al., 2017), where OA is often compounded by co-occurring stressors, such as hypoxia, thermal stress, and increasing pollution sources from urbanizing coastlines. Concern is growing on the possibility that combined stressors may push ecosystems beyond their tipping points and deleteriously impact ecosystem services (Groffman et al., 2006; Crain et al., 2008; Halpern et al., 2008; Barbier et al., 2011). The characterization of ecosystem vulnerability requires knowledge of OA thresholds at which lethal vs. sublethal impacts occur; however, despite rapidly growing literature documenting the biological impacts of OA, scientific consensus on these thresholds is lacking. These thresholds are urgently needed to provide consistent interpretation of monitoring data and regional oceanic model output, as well as to support marine climate change vulnerability assessments. They are also an important precursor to establishing biologically-relevant OA Water Quality Goals (WQG; Aminzadeh et al., 2016; Weisberg et al., 2016).
Pteropods are appropriate indicators for such an assessment for several reasons. First, they are ubiquitous holoplanktonic calcifiers that efficiently transfer energy from phytoplankton to higher trophic levels (Lalli and Gilmer, 1989; Hunt et al., 2008), serving as an important prey group for ecologically and economically important fishes, bird, and whale diets (Armstrong et al., 2005; Aydin et al., 2005; Karpenko et al., 2007). Second, they significantly contribute to carbonate production (Bednaršek et al., 2012a). Third, they have a well-documented and specific sensitivity to OA, ranging from evidence of exposure (e.g., shell dissolution), sublethal (without lethal outcome, e.g., growth, calcification, gut clearance) responses (Lischka et al., 2011; Lischka and Riebesell, 2012; Bednaršek et al., 2017; etc.; Figures 1, 2), occurring through a variety of impairment processes (Figure 1). Experimental results with negative pteropod responses are, in majority of studies, demonstrated against low Ωar, and only in few studies against pH or pCO2. Strong co-linearity among the carbonate chemistry parameters and a subsequent lack of decoupled carbonate chemistry parameters in the experimental set-ups makes it difficult to delineate the exact mechanisms of impairments (Figure 1). In general, Ωar or the availability of , is a driver behind reduced biomineralization processes and growth, CO2 -induced hypercapnia, and low pH alters metabolisms and acid-base balance, while pH seems to be involved in the neurologically induced behavioral changes, and reproductive impairments (Manno et al., 2016; Moya et al., 2016). Overall survival is likely impacted in a cumulative way by a combination of various sublethal processes, and thus not necessarily linked to a single carbonate chemistry parameter (sensu Bednaršek et al., 2017).
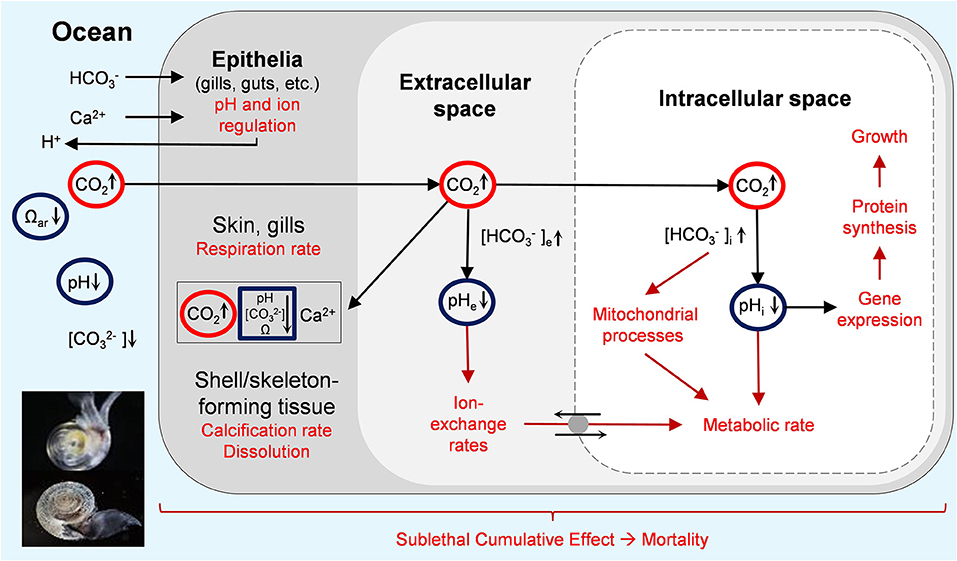
Figure 1. Responses of pteropods to OA. Effects are mediated via diffusive CO2 entry (black arrows) into body and cell compartments, resulting in a rise in intracellular pCO2 (highlighted in red), a drop in compartmental pH (highlighted in blue), and their effects (red arrows) on various biological endpoint (red text) in tissues and cellular compartments. In addition, lower aragonite saturation state (Ωar) and carbonate ions () has an effect on shell dissolution (depicted as pteropod with intact and damaged shell) and reduced calcification. Figure modified from IPCC (2014).
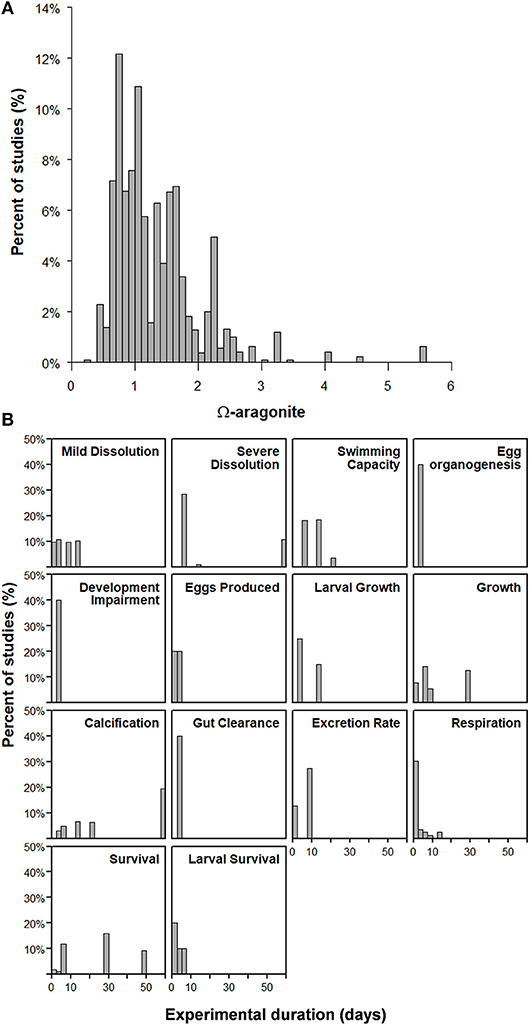
Figure 2. (A) Summary of experimental studies with respect to the Ωar conditions and (B) the duration of experimental exposure used in treatments.
For these reasons, pteropods have been proposed as OA indicators for climate change assessments, ecosystem-based management, and the establishment of WQG (Weisberg et al., 2016; Bednaršek et al., 2017). Comprehensive reviews have recently summarized knowledge of pteropod vulnerability to either OA (Manno et al., 2016) or multiple stressors (Bednaršek et al., 2016). However, despite numerous experimental and field stress-response studies, no synthesis has derived pteropod-specific OA thresholds, which are key to predictions of climate change impacts, habitat suitability, and climate assessment.
Interaction among multiple stressors, where the effect of one stressor is co-dependent on the other stressors, can lead to nonlinear outcomes, such that the combined effects can have outcomes that are more severe than expected. These combined impacts are dependent on how the stressors reinforce (i.e., synergistic) or counter (i.e., antagonistic) one another. Understanding how these responses may change when co-occurring with other climate change stressors, i.e., temperature or low dissolved oxygen (DO), is key for constraining the thresholds and their application. While meta-analyses across different functional groups mostly incorporate one stressor (Dupont et al., 2010), only a few have considered the multiple stressor effect (Kroeker et al., 2013), demonstrating that meta-analyses are an important analytical tool to expand our understanding of pteropod vulnerability to multiple stressors.
This study presents a global literature review, meta-analysis, and consensus of a panel of pteropods experts on thresholds for lethal and sublethal responses to OA stress for calcifying pteropods. Further, using meta-analysis, the magnitude of thermal stress and OA on pteropod responses was investigated for the interactive effect of two stressors potentially changing these thresholds (Figures 1, 2). The review further discusses considerations for the application of thresholds to monitor data and model output in the context of marine climate change vulnerability assessments. Metrics of exposure, such as duration (time interval below the threshold), intensity (magnitude of departure from threshold), and severity were recommended for consistent application across monitoring data and model output (Hauri et al., 2013). To demonstrate their intended use, thresholds were applied to a numerical ocean model simulation from the southern California Current System (CCS). Finally, specific recommendations are provided to increase the confidence in threshold application to demonstrate their applicability in the marine climate change vulnerability assessments.
Materials and Methods
The synthesis was conducted in three parts. The first part was a meta-analysis to determine the extent to which responses among studies conducted on congener species, differing life stages, and disparate geographies could be integrated into a common analysis. The second was a breakpoint analysis to identify thresholds of OA stress for several endpoints. The third was use of professional judgment among pteropod experts to assign an uncertainty level to each threshold based on the data quantity, data quality, and consistency in findings among studies included in the breakpoint analysis. The experts also identified the exposure duration most appropriate to thresholds for each pathway.
Meta-Analysis
The global literature search and review identified 15 pteropod studies (Table 1), based on a minimum criterion of (1) experimental studies with a minimum of three Ωar treatments (control, mid- and high range) or (2) field stress-response studies conducted across a range of Ωar values (e.g., Bednaršek et al., 2014b, 2017). Such criteria are needed because the meta-analyses results provided the base for the threshold analyses; hence, the same studies needed to be evaluated in both meta- and breakpoint-analyses, excluding the studies with only two different treatments. The selection was based on the available datasets that were published up to June 2017, with 9 different species across different areas (west coast, temporal, tropical, and polar) and 22 different pteropod endpoints recorded in the studies. The exception for this was meta-analyses with two stressors, OA and warming, in which the results were not used for threshold analyses, with all of the available data from literature until June 2017 specifically related to Limacina helicina. Studies with temperature and OA reference is included in Table 2. The endpoints were characterized into three effect categories, ranging from indications of exposure response, sublethal and lethal response across various species, life stages, and geographically different locations. A total of 2,097 datapoints were extracted from the raw experimental data provided in published literature or from authors with unpublished data. While some studies used multiple exposure metrics, every one of the studies used aragonite saturation state (Ωar) as the primary exposure metric; as such, all data were placed in the context of this single parameter for this study. Meta-analysis was used to (1) evaluate the robustness and signal-to-noise ratio of pteropod response measures relative to OA stress and (2) evaluate the extent to which disparate endpoints or experimental datasets can be combined given the variation in potentially confounding factors, such as intraspecific differences, the latitudinal ranges, temperature and DO gradients, life stage, duration of treatment, and nutritional/energetic status of experimental organisms. Meta-analysis of pteropod OA response measures generally followed the methods of Arnqvist and Wooster (1995), but the quantitative assessments of the effect size were derived from raw experimental data, in contrast with previous studies using a meta-analysis approach (e.g., Harvey et al., 2013; Kroeker et al., 2013; Meyer and Riebesell, 2015). First, the OA effect observed in all experiments was assessed using a unified approach. For each response measure, the experimental values (Y) were plotted against aragonite saturation state (Ωar). Two Ωar thresholds were selected by optimizing the differences between the “Effect” (low Ωar) and the “Control” (high Ωar) groups of observations. This optimization was achieved by calculating t-statistics of the differences between the “Effect” and “Control” groups across the range of possible thresholds (Supplementary Figure 3). Data points falling between the two Ωar thresholds were excluded from subsequent calculations. For the “Control” group, the averaged values of the experimental measurement (Ycontrol) and saturation state (Ωar) were calculated. Second, all data points in the “Effect” group Yeffect[i] were transformed into a “common currency,” called “Logarithmic response ratios” (LnRR) calculated as LnRR[i] = log (Yeffect[i] / Ycontrol; Hedges et al., 1999), and the mean and standard deviation of saturation state of the “Effect” group (Ωar) were calculated. Significance of the OA effect for each measurement type was assessed using a Student t-statistic (difference from zero at 95% confidence interval) and the differences between the OA effects on various measurement types were demonstrated using forest plots (Lewis and Clarke, 2001). The significance level of the total OA effect, summarizing all response measures, was calculated using the R package “metaphor” (Viechtbauer, 2010). A random-effects model was used, based on the assumption that the OA effect varies between studies. The total effect was assessed as an averaged LnRR with a 95% confidence interval and the null hypothesis of the absence of the OA effect was tested. The total heterogeneity between the response measures was assessed by the coefficients T2 (total amount of heterogeneity) and I2 (the percentage of total variability due to heterogeneity; Higgins and Thompson, 2002). All calculations were conducted in R (Version 2.15.1, R Core Team, 2012). A sufficient amount of data of the combined effect of OA and temperature within global literature review allowed for a similar meta-analysis at co-occurring temperature and Ωar levels, but not for DO. To account for an additional warming effect, we have conducted the same steps as described above for OA meta-analyses (Table 2). In short, we first calculated OA effect independently under ambient temperature, and then compared it with the OA effect under an elevated temperature.
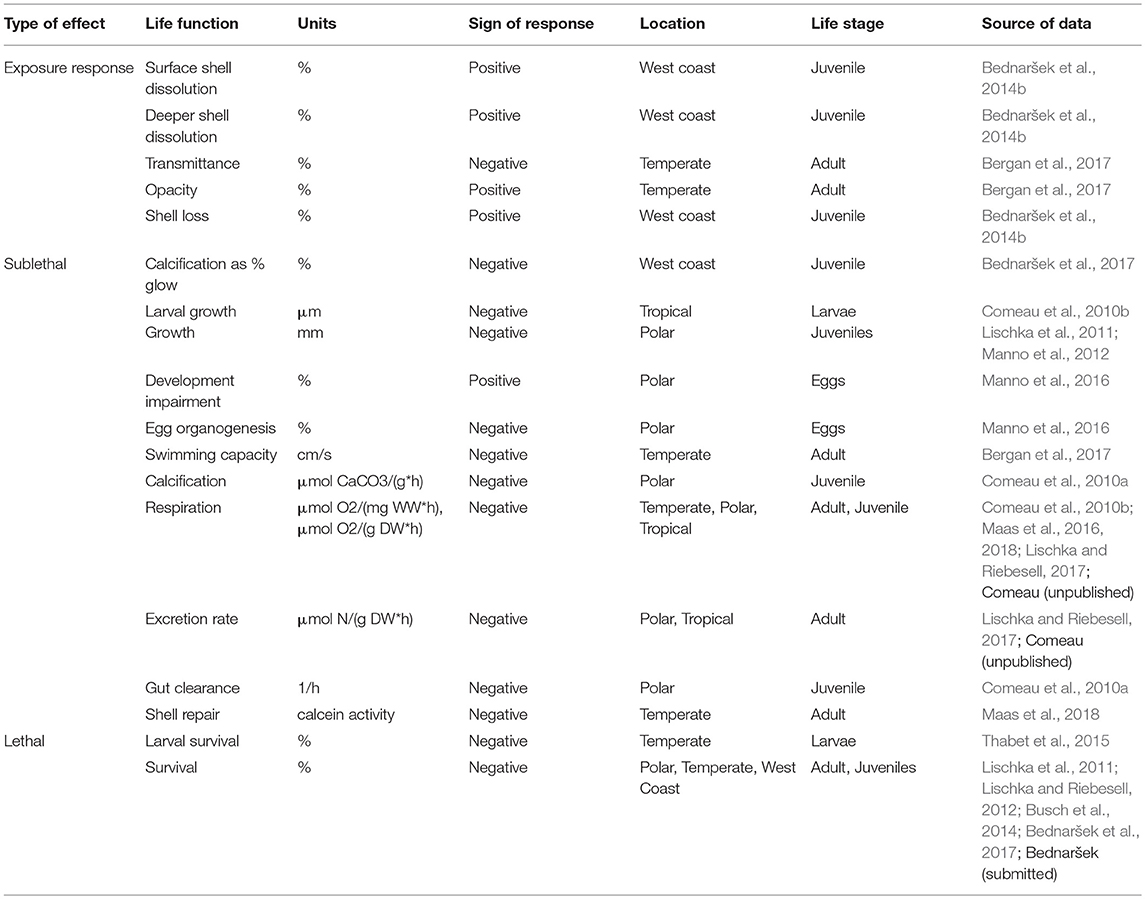
Table 1. Responses considered for threshold analysis.
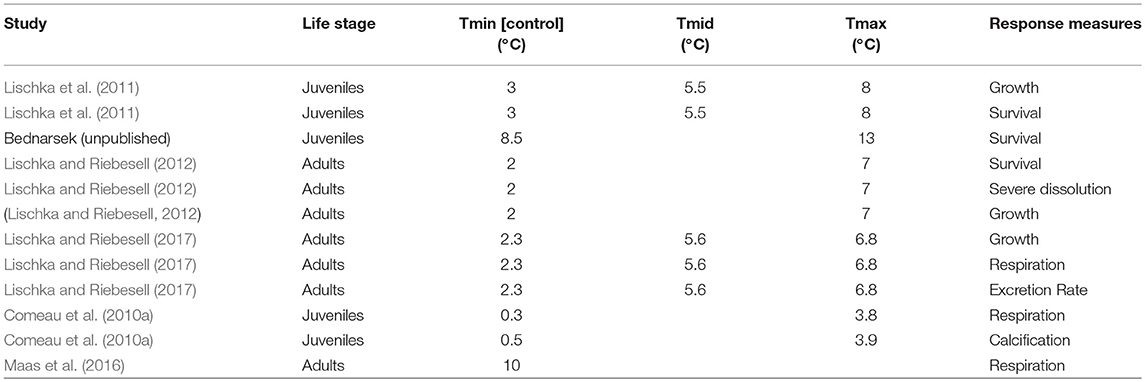
Table 2. Temperatures and response measures of studies used for meta-analysis. Only L. helicina studies have been included.
Breakpoint Analyses
Pteropods experience variable exposure to low Ωar and low DO and occasional thermal stress in their natural environment. As used here, a threshold is defined as the point at which there is a statistically significant change in specific pteropod response (Y-axis) for an incremental change in the environmental stressor (x-axis; e.g., Ωar). The goal of breakpoint analyses was to identify thresholds from each set of published studies, documenting Ωar stress effects on pteropod responses. To link pteropod responses with Ωar stress specifically, we have excluded the remaining responses that showed either insignificant response in meta-analyses, with datapoints from these studies not being included in the subsequent breakpoint analyses. We only focused on the Ωar stress-related threshold derived from negatively affected responses, but throughout the study, we acknowledged that two insignificant results also exist (e.g., excretion, respiration).
For experimental data, we evaluated the transition from no observed effect (experimental control) to statistically significant least observed effects (LOE) and severe observed effect (SOE, Supplementary Figure 1). For field-based stress-response studies, piecewise regression analysis was used to identify the breakpoint in slopes in the response measures over the gradient in OA stress (package “segmented”; version 2.15.1, Muggeo, 2008; R Core Team, 2012). For the same measures, we retained information on duration during threshold derivation for each pathway all thresholds were duration dependent. While meta-analysis was used to study the impact of confounding effects on the threshold, the result of meta-analysis was not directly applied to the breakpoint analyses.
Expert Assessment of Uncertainty and Determination of Appropriate Exposure Duration
An expert working group, with their contributions acknowledged through their co-authorship in this paper, was assembled at the outset of the synthesis process. The scientists that comprised this group were chosen based on depth of knowledge and expertise in pteropod physiology and responses to OA and multiple stressors, as well as their demography, population dynamics, and life history strategies. The expert working group added unpublished studies to the database and provided a review process for both the meta-analysis and threshold analyses (e.g., Teck et al., 2010). This type of check was important because all of the studies were treated equally in the analyses, despite potentially unequal levels of data quality and quantity. The experts were provided with the opportunity to refine the interpretation of the analytical outcomes based on their knowledge of how those studies should be weighted. For each response measure, each expert identified the OA threshold they would assign based on the breakpoint analysis. In cases where the experts disagreed with the analytical result and were divided (which was rare) the threshold value with the most votes was adopted; if there was not a clear majority, the value was discussed amongst the experts until a consensus was reached. Meta-analysis greatly simplified the work of experts, enabling the identification of thresholds from 22 response measures and duration combinations down to five major endpoints represented on the final graphic.
In addition, there was an unequal quantity of study results, as well as differing levels of agreement among studies, for each of the pathways examined. To enhance the applicability for each of the findings, the experts were asked to provide a confidence level for each pathway threshold. This was done using the Intergovernmental Panel on Climate Change (IPCC) confidence model. This metric qualitatively expresses the confidence in the validity of a finding, on the type, amount, quality, and consistency of evidence to assign a confidence level (Supplementary Figure 2). An uncertainty rating was assigned based on IPCC uncertainty guidance that evaluates the confidence of findings in terms of evidence and agreement (low, medium, high; Mastrandrea et al., 2010). Meta-analysis results were used as an aid to discuss the confidence score.
Finally, the experts were asked to identify the most appropriate time frame over which the thresholds should be applied. The range of exposure durations varied among the underlying studies and expert judgment was needed to determine whether these were inherently acute as opposed to chronic exposure responses, and the extent to which fluctuations above and below these thresholds were cumulative.
Applying Thresholds to Biogeochemical Model Outputs
Experts discussed guidance that should be provided in order to achieve a more consistent application of these threshold to ocean observations and ocean numerical model output. They recommended use of measures such as intensity, duration, and severity of departure from the thresholds, based on Hauri et al. (2013). Intensity represents the magnitude of the departure from the threshold, calculated as the negative average deviation from the threshold. The duration represents the number of days below the threshold expressed as a % of the total analysis period. The severity is the product between the intensity and duration, with the % time of Ωar below the threshold deviation. Calculations of duration, intensity, and severity of departure from the derived OA thresholds were carried out through the use of a set of model simulations from the Regional Ocean Modeling System (ROMS; Shchepetkin and McWilliams, 2005, 2009), with biogeochemical elements (Biogeochemical Elemental Cycling; BEC, Moore et al., 2004) that has been developed for the CCS, the Pacific Coast of North America. The thresholds were particularly applied to the southern part of the CCS, particularly for the region of California.
The ROMS-BEC model provides a realistic three-dimensional representation of the physical circulation (Renault et al., n.d.) and the biogeochemical cycles of nutrients, oxygen, inorganic, and organic carbon species, and several plankton functional groups (Deutsch et al., n.d.). Ωar was calculated based on temperature and oxygen fields of the ROMS-BEC model using the Juranek et al. (2009) algorithm. In separate publications, we describe the model set up, and demonstrate that it captures the broad patterns of physical circulation, productivity, dissolved nutrients, and DO along the CCS, and their temporal variability and trends (Deutsch et al., n.d.; Renault et al., n.d.). The simulation analyzed here is a downscaling of a 4 km-resolution US West Coast solution to the southern portion of the California coast (Kessouri et al., n.d.), with data deriving directly from the models. It runs with a spatial resolution of 1 km, submesoscale permitting, and spans the 10-year period from 1997 to 2006 (Deutsch et al., n.d.; Renault et al., n.d.) at 1 km spatial resolution and 1-day average outputs (Kessouri et al., n.d.). Daily Ωar averages of 0–200 m depth in the water column were used either over 2 periods for mild dissolution and survival, respectively over the 10-year period from 1996 to 2007. The threshold diagnostics included two case studies. First, juvenile mild dissolution (Ωar threshold of 1.5 for a duration of 5 days) was applied for a 2-month period, between April and May, which coincides with the presence of early life stages (larval and juvenile) along the southern part of CCS (Wang et al., 2017) that are most susceptible to mild dissolution, for a total of 610 days over the 10-year simulation. Second, threshold for severe dissolution (Ωar threshold of 1.2 for 14 days duration) was applied to the averaged 0–200 m water column over the same time period and across the same spatial scales as the mild dissolution threshold.
Results
Omega Saturation State as the Consensus Measure of OA Stress
All 15 studies selected for the final threshold identification used aragonite saturation state (Ωar) as the chemical measure of organismal stress (Figure 2). The majority of focal endpoints had demonstrated response to Ωar, which was also a preferred proxy because the pH and pCO2 only showed unambiguous responses for a few sublethal endpoints (e.g., metabolic and behavioral responses). Ωar response in experimental treatments spanned a range of under- and super-saturated conditions (Ωar of 0.7–3.2; Figure 2A), with exposure duration varying from days to months (Figure 2B).
Meta-Analysis Informs Evaluation of Response Measures and Evaluation of Confounding Factors
After pooling pteropod data across species, life stages, and geographic locations, a significant negative response to Ωar was found across most exposure responses, physiological and lethal processes, indicating a high signal-to-noise ratio (Figure 3). Severe shell dissolution, egg developmental impairment, larval growth, and survival had the greatest magnitude of Logarithmic Response Ratio (LnRR) response to Ωar, and thus were prioritized for threshold development. In contrast, a few processes had insignificant LnRR, interpreted as either poor signal-to-noise ratio (e.g., excretion rates), or insufficient datapoints (e.g., larval survival), and were excluded from threshold synthesis. Finally, some processes showed either a significant positive response of the stress (gut clearance), or insignificant LnRR response (respiration, excretion rate). The threshold synthesis focused on deriving thresholds only for significant negative biological responses. Our results for pteropods show great uniformity of within-taxa impairment responses to OA, lending support for the decision to pool data across experiments when considering the thresholds during the final synthesis phase. We elaborate on these four aspects of response below.
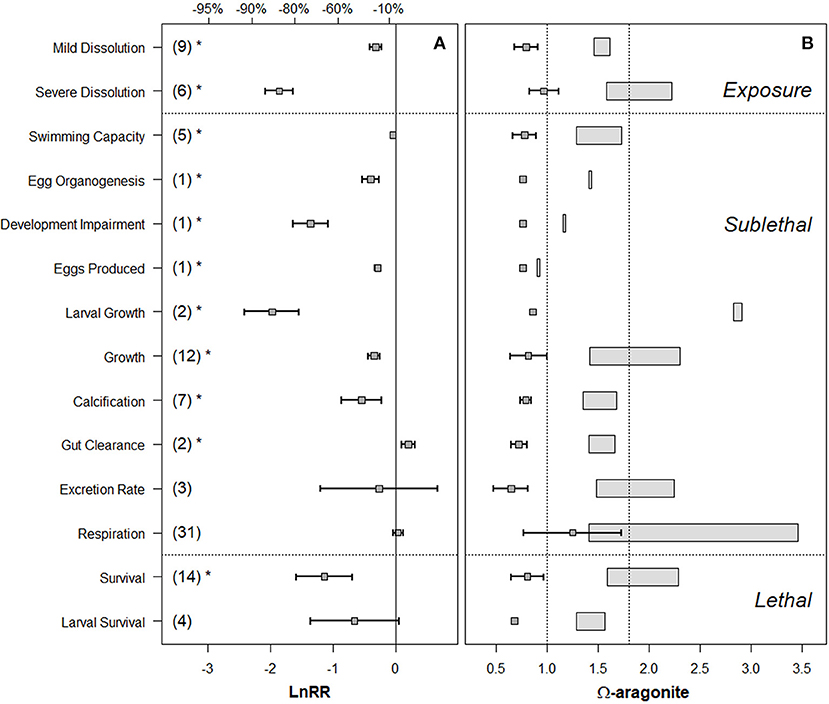
Figure 3. (A) Forest plot of Ωar effect on various biological processes across exposure response, sublethal, and lethal responses in pteropods. The numbers in the parenthesis indicate the number of experiments for each response measure, error bars indicate 95% confidence intervals. LnRR (Logarithmic response ratio) indicates the magnitude of response with its significance (p < 0.05) indicated by the asterisks. Percentage values along the top of the figure indicate percent decrease in the given endpoint, compared to the control. (B) “Effect” (box-and-whiskers) and “control” (rectangles) conditions as used in the experimental conditions, with the dotted line positioned at Ωar = 1 and 1.8 for comparison with known biogeochemical Ωar thresholds.
The magnitude of sublethal and lethal responses was predominantly life-stage specific. Larvae and juveniles were substantially more affected by Ωar than adults, while egg sensitivity was comparable to adults (Figure 4). We observed the greatest reduction in survival in juveniles, and significant for larvae, whereas no effects were detected for adults, consistent with Dupont et al. (2010) and Kroeker et al. (2013). A pronounced sensitivity of larvae and juveniles suggest that the Ωar exposure of early pteropod life stages could represent a population bottleneck, a key consideration to translate effects from individuals to population level (sensu Bednaršek et al., 2016). For this reason, threshold analyses were life stage-specific for individual endpoints, when meta-analysis could not otherwise justify their combination.
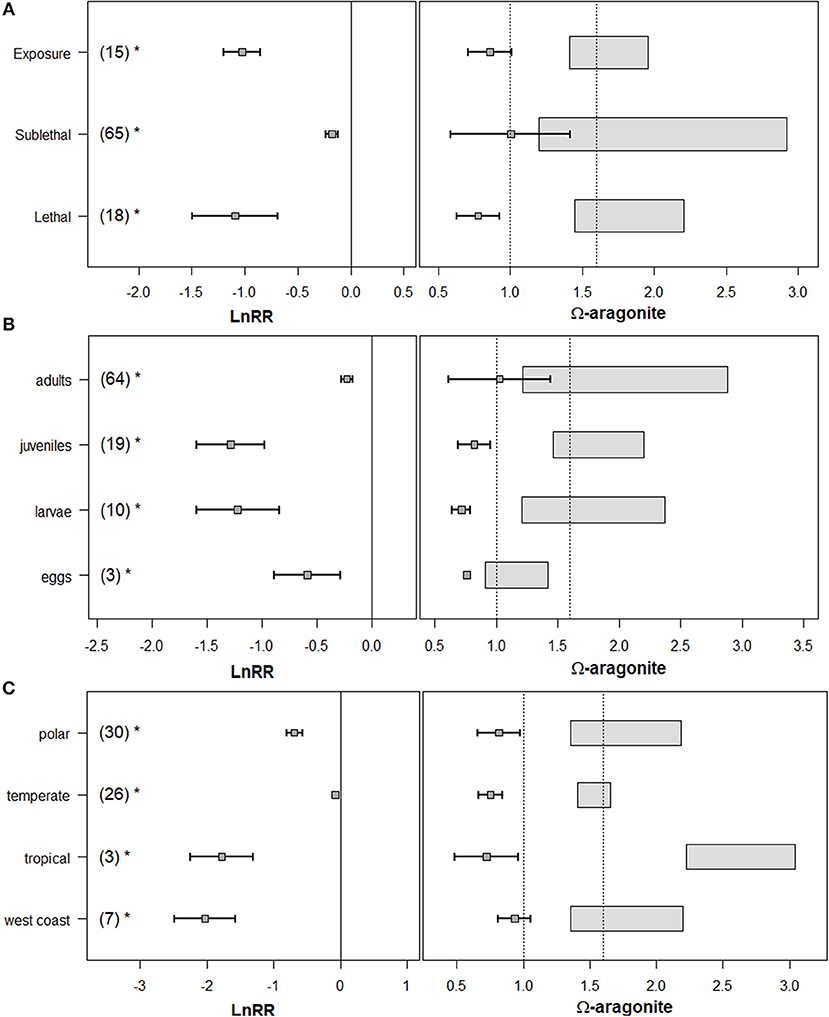
Figure 4. The variability in LnRR responses across (A), exposure response, sublethal, and lethal responses, (B), across various life-stages, and (C), with specific regionality. LnRR (Logarithmic response ratios) indicate the magnitude of the response, with the asterisks indicating its significance (negative associated with negative LnRR values; and positive associated with positive LnRR values). LnRR value crossing zero line indicates the insignificance of the response.
Species-specific responses represent additional sources of variability, as demonstrated by highly variable LnRR, albeit with an overall significant negative response, except for significantly less sensitive temperate species (L. retroversa; Figure 4). Species found in the upwelling and polar regions had the greatest overall OA response, indicating similar vulnerability across habitats with some of the most severe OA gradients. In addition, tropical species also show a significant negative sublethal response, comparable with an LnRR to their west coast counterparts (Figure 4). The LnRR of temperate species was only significant when data on highly variable respiration responses were removed from the meta-analysis. LnRR differences on lethal endpoints between the species of divergent geographic origin suggest local populations may have a differential response to Ωar stress. Despite this, significantly negative LnRR responses across species provided evidence to combine experimental studies during the threshold synthesis stage.
Finally, meta-analysis of six different response measures combining thermal with Ωar stress significantly increased the magnitude of severe dissolution and mortality (Figure 5), changed the direction of the LnRR for the sublethal responses (e.g., increased respiration), or resulted in no significant effect (e.g., calcification, excretion growth). Meta-analyses cannot distinguish between these additive and synergistic effects, but evidence exists that these two stressors can synergistically impact sublethal and lethal endpoints (Lischka and Riebesell, 2012).
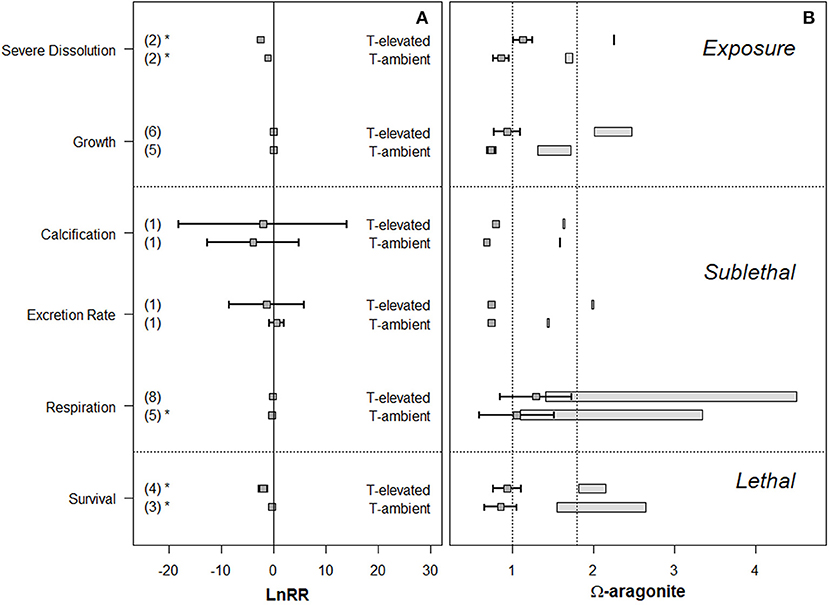
Figure 5. Meta-analysis of OA (Ωar) and warming effects on the variety of response measures at ambient and elevated temperature, with underlying Ωar conditions (A) Forest plot of Ωar and thermal effect across exposure response, sublethal, and lethal responses in pteropods. The numbers in the parenthesis indicate the number of experiments for each response measure. LnRR (Logarithmic response ratios) indicates the magnitude of response with its significance (p < 0.05) indicated by the asterisks. (B) “Effect” (box-and-whiskers) and “control” (rectangles) conditions as used in the experimental conditions, with the dotted line positioned at Ωar = 1 and 1.8 for comparison with known biogeochemical Ωar thresholds.
Synthesis of Thresholds by Endpoints
Expert synthesis identified duration-dependent thresholds for Ωar effects on dissolution, calcification, growth, egg development, and survival (Figure 6), ranging from 1.5–0.9, with assigned uncertainties (Figure 7; Supplementary Figure 2).
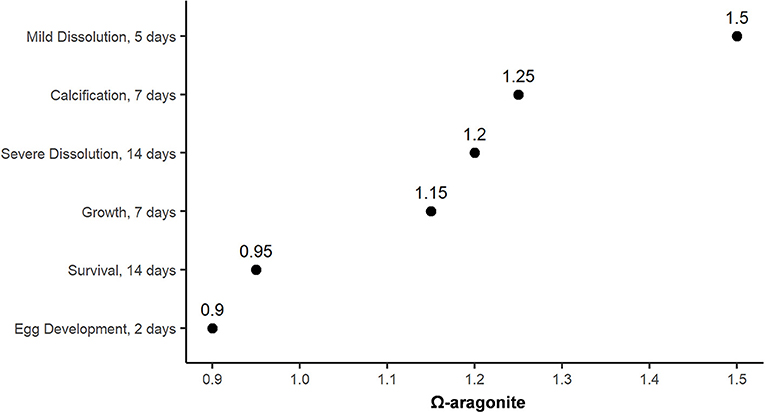
Figure 6. Synthesis of thresholds related to six different endpoints, characterized by its magnitude (Ωar), and duration of exposure response. The thresholds were determined based on experimental and field data using breakpoint analyses and expert consensus.
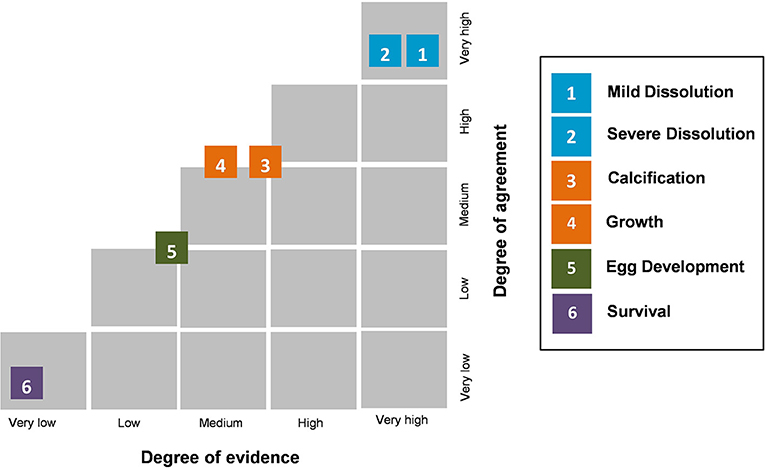
Figure 7. Confidence score based on the combination of evidence and agreement for six different endpoints as determined by the expert consensus. Figure adapted from IPCC 2014 report.
Mild and Severe Shell Dissolution
Five different exposure measures were combined into either mild (including opacity, surface shell dissolution and transmittance) or severe (deeper) shell dissolution (Table 1). Based on comparable magnitude of LnRR across disparate measures of dissolution, life stages and species, meta-analysis provided support for aggregating various measures. The presence of mild shell dissolution is the most sensitive measure, providing an early warning response, while severe dissolution imposes sublethal impairment because it likely requires additional energetic costs for repair and maintenance (Lischka et al., 2011; Bednaršek et al., 2016; Peck et al., 2018).
Mild and severe shell dissolution processes differ substantially in their thresholds, which ranged from 1.06 < Ωar < 1.59 for 2–8 weeks, respectively (Bednaršek et al., 2014a; Bergan et al., 2017; Table 1). These experimentally derived thresholds were independently verified from a field stress-response study, with derived changepoint threshold of Ωar = 1.3 (Bednaršek et al., 2014b; Supplementary Figure 1). There was robust consensus among the experts with high levels of agreement, that dissolution is not species- or life stage-dependent (Figure 7). The thresholds for mild and severe dissolution were set at Ωar = 1.50 for 5 days and Ωar = 1.20 for 14 days, respectively, with the highest confidence score (99%) assigned (Figure 7).
Calcification
In comparison with dissolution, calcification response was less sensitive and less consistent to Ωar, the latter attributable to differences in life history and energetic state characteristics. This implies variable control over calcification processes, likely because calcification is energetically expensive when sustained at low Ωar gradients (Lischka et al., 2011; Bednaršek et al., 2017). While juveniles showed reduced calcification at low Ωar (Comeau et al., 2010a; Bednaršek et al., 2017), an increase in calcification was seen in the less sensitive adults of L. retroversa (Maas et al., 2018). Experimentally derived LOE ranged from Ωar = 1.25 for 3 days (Comeau et al., 2010a) to Ωar = 1.02 for 1-3-week duration (Maas et al., 2018), which coincides with a significant calcification decline also in Heliconoides inflatus (Moya et al., 2016). These duration-dependent thresholds were validated with a field-derived changepoint of Ωar = 1.02 (SE = 0.07; Bednaršek et al., 2017). While calcification processes might still be confounded by the species- and life stage-responses, meta-analysis supported a decision that the thresholds could be used across potentially confounding parameters. As such, calcification was positioned at Ωar = 1.25 for 7 days of exposure. This threshold varied from medium-to-robust evidence and medium-to-high agreement, with final expert consensus giving it an overall medium-high confidence score.
Growth Reduction
Shell growth parameters in juveniles included shell diameter, length, or their ratios (Lischka et al., 2011; Lischka and Riebesell, 2012; respectively), while the larval growth was measured using calcein (Comeau et al., 2010b). Shell growth was negatively correlated to Ωar and showed a uniform response; meta-analysis demonstrated that responses were confounded by life stage but not by species. Larval growth impairment showed a significant difference in the magnitude of response in comparison with adults and was one of the most sensitive to Ωar. Of those studies measuring Ωar growth impacts, data could only be obtained for the study by Manno et al. (2012) but not from Thabet et al. (2015) and Comeau et al. (2010b) because LOE could not be extracted, or the uncertainty was too great, yet both studies demonstrated a significant decrease in larval growth and developmental delay. The derived LOE based on Manno et al. (2012) was Ωar = 1.15 for 7 days. In addition, field and laboratory studies agree with reduced shell length and thickness at Ωar ~ 1 (Lischka et al., 2011; Lischka and Riebesell, 2012; Bednaršek et al., 2017), providing a solid cross-validation of the expert-selected threshold. The growth threshold is readily applicable for slower-growing polar species but might be more difficult to extrapolate at different latitudes, given species-specific growth patterns. An additional uncertainty is attributable to disparate sizes of experimental organisms among the studies. Therefore, the growth threshold was assigned medium evidence and medium-to-high agreement, yielding an overall medium-to-high confidence score. While the uncertainty was too large to identify a threshold specifically for larval growth, we recognized its importance as an independent endpoint.
Severe dissolution, calcification, and growth showed close proximity of the Ωar thresholds, all occurring within ±0.1 unit and within a duration of 7–14 days. This proximity of the thresholds indicated that all of these processes are either simultaneously affected or one process results in a cascade of responses, provided sufficient duration of exposure. For example, while calcification is a more sensitive process, it can affect growth through a trade-off, such that the organisms' use of additional energy for calcification results in a reduced energy scope for growth. The threshold for mild dissolution is much higher than for severe dissolution, indicating this to be predominantly a geochemical process that is initiated by changes in Ωar in external conditions rather than organismal response.
Pre-larval Development
Maternal OA exposure during only the egg-brood phase resulted in smaller eggs with lower carbon content, while embryonic OA exposure during the embryonic development phase retarded the development rate. Combined maternal and embryonic exposure to Ωar < 0.90 for 3–5 days reduced the percentage of eggs successfully reaching the organogenesis stage by 80% (Manno et al., 2016). Although this study demonstrated the effect of maternal exposure on egg development, the threshold was at Ωar < 0.90 for 2 days. Given the limited evidence, the overall confidence score for this threshold was medium-to-low. As such, use of the egg development threshold is caveated, particularly with respect to species difference; it is relevant for species (e.g., L. helicina) in which shell development occurs within the egg capsule, but not for other species (e.g., L. retroversa) that hatch to unshelled larvae after spawning and develop into veligers with a cup-shaped shell or are egg brooders with a protected egg development phase, as in the case of H. inflatus (Lalli and Gilmer, 1989).
Survival
The final consideration of survival thresholds was based on L. helicina juveniles from polar and upwelling regions (Lischka et al., 2011; Bednaršek et al., 2017). The LOEs ranged from Ωar = 0.94 for a 4-week lab experiment (Lischka et al., 2011) to Ωar = 1.06 for 6-week exposure in a field experiment (Bednaršek et al., 2017). The juvenile and adult survival threshold was set to Ωar = 0.95 for 14 days. Meta-analysis results showed significant variation of LnRR in survival between the juveniles and adults, as well as for the species-specific response with greater lethality in upwelling species.
Although several studies examined the survival of pteropods, the range of responses varied. No effect on survival was found when the experimental duration was <1 week (Seibel, unpublished data; Manno et al., 2012). Survival rates across studies depended on the difference in nutritional and energetic status of organisms (Seibel et al., 2012) and their history of exposure (Bednaršek et al., 2017). This affected the intercept on the Y-axis (% survival) but neither the slope of the relationship nor the threshold, which was comparable for both studies. In addition, a significant decrease in larval survival was reported in only one study (Thabet et al., 2015), but due to the high variability of this study, it was excluded from the threshold synthesis. Because survival responses are life-stage specific and attributed to a variety of confounding parameters, such as food availability, temperature, or exposure history, and a well-documented captivity effect of cultured pteropods, the survival threshold was designated a low confidence score.
Demonstration of Threshold Application to Ocean Model Numerical Simulations
Application of the duration, intensity, and severity of departure of the mild dissolution and survival thresholds to ROMS-BEC numerical simulations of the CCS illustrates key points in their application (Figure 8). First, a comparison of thresholds of mild (Figures 8A–C) vs. severe dissolution (Figures 8D–F) applied to modeled Ωar represents bookends of the range of impacts related to shell processes. While conditions appear to exist that frequently induces mild dissolution in pteropod vertical habitat, the incidence of crossing severe dissolution threshold was less common, mostly along the onshore region at a lower part of the 200 m vertical habitat. Second, each panel provides spatially explicit information on the magnitude of departure from the threshold (Figures 8A,D), the percent of time it occurs (Figures 8A,E) and the severity of those departures, combining the magnitude and duration of exposure into one metric (Figures 8C,F).
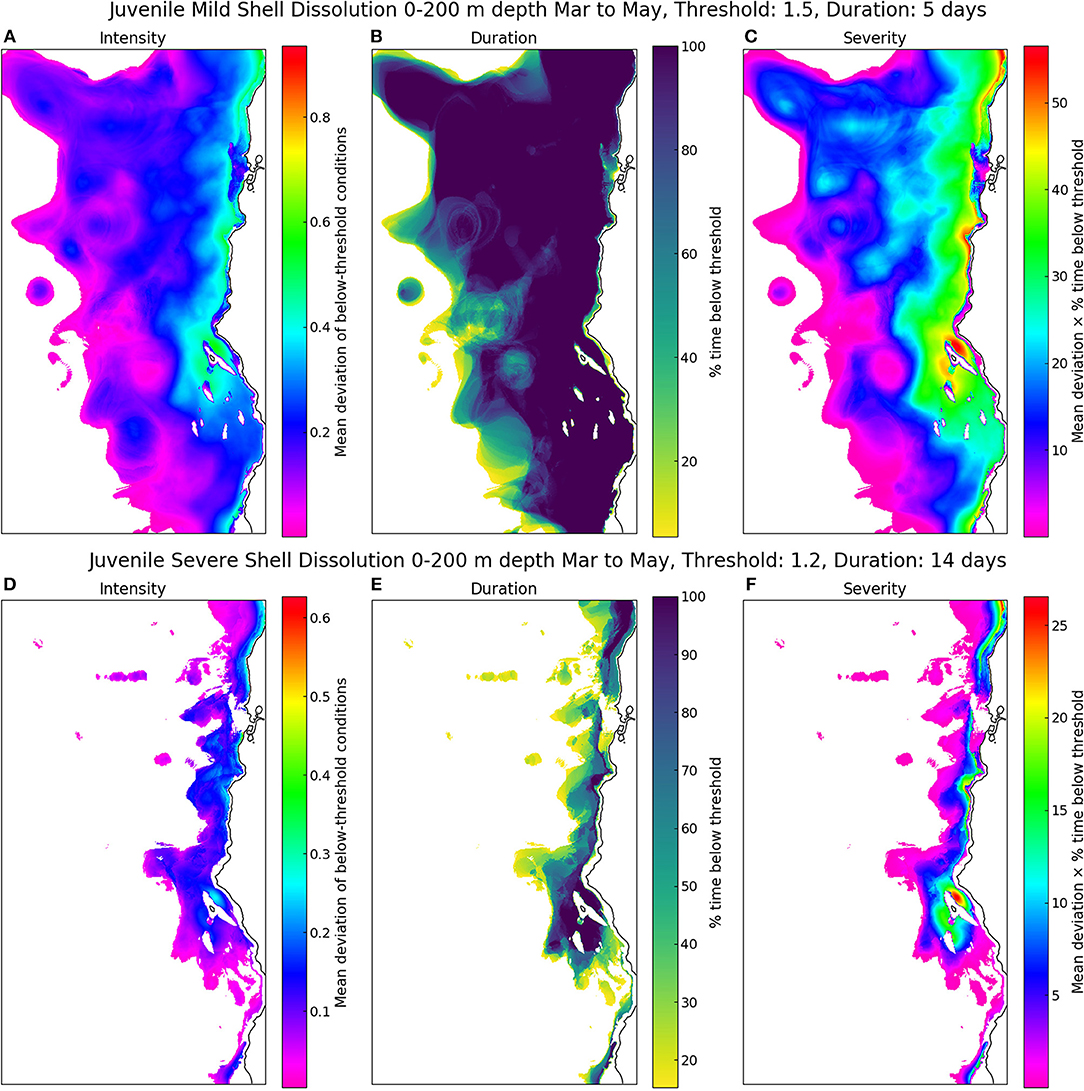
Figure 8. Examples of threshold applications to modeled estimates of Ωar at 200 m off the entire California coast. Magnitude, duration, and severity of exposure were calculated for two thresholds, respectively: (A–C), Mild dissolution threshold of juvenile pteropods (Ωar = 1.5; applied for 5 days over the period of March to May); (D–F), severe dissolution of juvenile pteropods (Ωar = 1.2; applied for 14 days over the period of March to May).
As illustrated here, there is a consistent pattern of increasing magnitude, duration, and severity from offshore to onshore. For both processes (mild and severe dissolution), the threshold represented on the 2-dimensional maps of the saturation state of Ωar show deviations from the threshold in the magnitude, duration, and severity of the seasonal exposure that coincided with pteropod spawning. The model shows that, on average, the greatest magnitude, and severity of exposure is in the shelf regions, with approximately 80 and 20% time exposure below the threshold; and 30 and 20% deviation below the threshold for the mild and severe dissolution, respectively. This implies that the early life stages are most susceptible to dissolution during their most vulnerable periods.
Discussion
Global Synthesis of the Effects of OA on Pteropods: Synthesis and Comparison With Other Organism Groups
Meta-analysis and global literature review of threshold demonstrated the high sensitivity of pteropods across multiple responses to OA. The meta-analysis demonstrated (1) significant, negative responses to decreasing Ωar across most response measures, (2) the magnitude of response was duration and life-stage specific, and (3) temperature enhanced the magnitude of two responses negatively impacted by Ωar, shell dissolution, and survival. Comparison of pteropod meta-analyses across broader marine organisms (Kroeker et al., 2013) shows that pteropods bore very similar responses with most calcifying groups, including negative responses across survival, calcification, growth, and development. The greatest comparable magnitude of responses were with the diverse group across the entire mollusk group, especially the sensitivity of the early-life stages. In comparison with the other groups, pteropods show more sensitivity in developmental response. When temperature responses are included in the meta-analysis, the trend is noticeable toward lower survival in both pteropods (this study) and the other calcifiers (Kroeker et al., 2013); however, the difference between OA effects of control and elevated temperature does not explain the significant amount of variation in those responses.
With respect to the threshold comparison with previous studies, oysters (Pacific, Olympia and Eastern oyster) and mussels showed great similarity in the magnitude of thresholds with our current study, although the exposure duration for these species have not been defined. Pteropod mild shell dissolution at Ωar = 1.5, an early warning response, is comparable to sublethal thresholds for oysters or mussel larvae in the Ωar range of 1.4 and 2 (Barton et al., 2012; Hettinger et al., 2012) and Ωar = 1.8 (Gaylord et al., 2011). In terms of acute responses, the pteropod survival threshold of Ωar = 0.95 was lower (i.e., occurring at higher Ωar stress), yet analogous to bivalve larvae sublethal acute threshold at Ωar = 1.2 (Waldbusser et al., 2015). The differences are life-stage specific; larval oyster stages have the greatest sensitivity, while pteropod thresholds reflects a sensitivity across all life stages. Higher threshold values (Ωar > 1.5) are referenced in consideration with the cumulative effects of all biological processes that can compromise the overall biological status (Gimenez et al., 2018). As such, our pteropod thresholds are valid, yet conservative estimates for individual endpoints, but do not address the cumulative impact of impairment pathways.
Advantages to Applying Thresholds to Biogeochemical Model Output
Scientific consensus on OA thresholds is key for their application to OA status and trend assessments, predictions of the effects of climate change, assessment of impact of local pollution inputs, proposed remediation strategies, and as the foundation for OA water quality goals (Weisberg et al., 2016). However, guidance is required for their consistent application, particularly with respect to decisions on how data should be aggregated to assess the spatial extent and temporal duration needed to trigger a biological endpoint. Numerical model simulations were used to illustrate the basic metrics of duration-dependent threshold applications (magnitude, duration, severity; Hauri et al., 2013) and can be used to indicate reduced habitat suitability for pteropods. Appropriate vertical aggregation of observations or modeled output remains a key question. In our particular case, experts delineated the maximum depth limit to which these thresholds should be applied (<500 m), noting that the most abundant pteropod species are typically limited to the upper 200 m of the water column (Bednaršek et al., 2012a); however, the experts were challenged to provide simple guidance on what statistical approaches to use when aggregating the data across the vertical or spatial scales to demonstrate the reduction in suitable habitat that would result in population level effects. The challenge lies in a variety of complex factors that can impact population response that work across time scales not necessarily aligned with the observed responses.
One of the most important considerations is to understand these thresholds within the context of the pteropod life cycle, particularly the timing of reproduction and growth against the seasonal Ωar settings, related to upwelling cycles (Feely et al., 2008), primary productivity, freshwater runoff patterns, and ice melt (Harris et al., 2013). Thresholds for survival, growth, and egg development are life stage specific, while dissolution and calcification can be applied across life stages. Different life stages can withstand different levels of mortality without significant long-term impacts to the population (Batiuk et al., 2009), so identification of the critical conditions under which population-level effects are predicted will depend on stage sensitivities and cumulative effects of co-occurring environmental conditions. For example, the reproduction of L. helicina in the northeast Pacific occurs in the spring and fall (Wang et al., 2017). With the early-life stages having the highest sensitivity to survival and development, exceeding the Ωar threshold during these periods will determine the population outcomes. In addition, a prolonged duration of exposure across several life stages might first carry-over through maternal effects toward higher juvenile vulnerability, followed by cumulative effects throughout the life history to lead toward the population effects, particularly where pteropod reproduction is continuous throughout much of the year, e.g., in the Southern Ocean (Bednaršek et al., 2012b). Demographics modeling can help identify the most critical life stages in a population (e.g., Bednaršek et al., 2016) that, in combination with the predicted seasonal changes in Ωar and their regional variability (Kwiatkowski and Orr, 2018), help identify critical timing and regional aspects of the population bottlenecks. It can also be used to develop more precise recommendations for the vertical aggregation of output or observation or spatial extent needed to estimate a population impact.
Limits of This Synthesis and of Threshold Analysis
On several occasions, experts did not support assigning the thresholds to a specific process, or thresholds had high uncertainty. These instances were due to insufficient or poorly-curated data, disparity in response measures or equivocal responses with a poor signal-to-noise ratio, or data gaps that did not allow for the extrapolation across spatial scales or life stages. Furthermore, interpreting the large variability in responses (poor signal-to-noise ratio) proved difficult. An example of this is the variation in metabolic rate; several confounding parameters could have impacted metabolism processes, yet they were not sufficiently defined or understood during the experimental stage, such as the nutritional or energetic status. As such, consideration of respiration thresholds was eliminated from the final synthesis (Comeau et al., 2009; Moya et al., 2016; Lischka and Riebesell, 2017). We also recognized some additional caveats from the experimental studies that need to be considered; for example, experimental datasets were skewed toward shorter experiments, which made inferences of chronic effects less certain, or insufficient feeding that might have generated more acute responses that would have otherwise occurred in their natural environment. Finally, an insufficient number of experiments have explicitly tested multiple stressor effects on pteropods (e.g., Lischka and Riebesell, 2012, 2017; Manno et al., 2012; Maas et al., 2018), making the stated thresholds only representative of Ωar in a single stressor future ocean. Approaches such as regional-specific habitat suitability indices that consider multiple stressors may represent a useful complementary approach. Experts agreed that currently synthesized thresholds are globally applicable to calcifying pteropods across varying spatial scales. Additional field and experimental data can refine these thresholds over time, particularly if conducted in a way to extract or identify thresholds rather than simply document OA adverse effects.
Currently, insufficient experimental data exist to characterize DO and thermal stress effects on OA thresholds. Several thermal and OA stress studies allowed for meta-analysis to be conducted as a first step but that was not feasible for an OA- low DO combination. Furthermore, the breakpoint analyses were not feasible for Ωar in combination with either thermal or low oxygen data. The stress response is expected to occur at lower stress under multiple stress conditions that will result in higher threshold values. It is extremely important to account for all possible co-occurring stressors in the species' natural habitat to yield accurate predictions of impaired biological processes. The single Ωar thresholds generated in this study are likely biased with respect to the less detrimental responses and will need to be upgraded within the multiple stressor context when more data is available. However, a few field studies of pteropod vulnerability are available to provide insights into potential changes of the threshold sensitivity due to multiple stressor effects. Under combined low DO and OA, some species showed metabolic depression (Maas et al., 2016), while this was a prevalent response for all the species under low DO and warming (Maas et al., 2012). In addition, increased pteropod mortality and shell dissolution was demonstrated for pteropods under the combined effect of warming under marine heat wave and OA. OA stress in combination with low salinity also impacted pteropod behavior (Manno et al., 2012). Based on these studies, potentially higher threshold values indicative of induced stress at less unfavorable conditions under combined stressors are expected for the most sensitive processes, such as dissolution and survival, and possibly neurologically induced behavioral impairments that is already negatively affected under OA alone (cf. Moya et al., 2016; Bergan et al., 2017).
These kinds of integrated analyses provide an opportunity for identifying information gaps; here we identified three areas where future research investments would substantially improve our ability to define OA thresholds. First, most of the experiments measure effects based on static Ωar conditions, which are not representative of realistic conditions. As such, variable exposure studies are needed to evaluate the impact of Ωar natural variability, especially because there is a complete lack of understanding of how dynamic Ωar exposure effects the level of resiliency. Resiliency may occur if the relaxation periods between stressor exposure events are of sufficient length to allow partial recuperation before the next exposure event, thereby lessening its susceptibility. Second, since the bulk of the studies were experiments conducted on individual organisms, thresholds derived from field-based stress-response observations are needed to validate the relationship between OA exposure and biological endpoint or population measures (e.g., percent individuals affected, abundance, etc.). This should be tested across life stages and species found at various latitudes to validate the applicability of thresholds on a global scale. Third, process studies and population modeling are needed to provide an integrated view of how the physiological responses to environmental stressors, coupled with seasonality exposure, translate to population-level effects. These studies are central to developing a solid scientific foundation for multi-trophic level ecosystem models to support investigations of climate change related ecological tipping points.
Author Contributions
NB conducted the literature review, statistical analyses, and data syntheses. NB and NN conducted meta-analyses. FK performed modeling and provided model outputs. NB led manuscript writing, with the other co-authors RF, EH, BH, PL, SL, AM, KM, MS, and SW contributing to writing and editing.
Funding
This research was supported by California Ocean Protection Council, grant number C0302500. RF was supported by the NOAA Ocean Acidification Program.
Conflict of Interest Statement
The authors declare that the research was conducted in the absence of any commercial or financial relationships that could be construed as a potential conflict of interest.
Acknowledgments
We thank Dana Shultz for her assistance in manuscript preparation. NOAA PMEL Contribution number is 4969.
Supplementary Material
The Supplementary Material for this article can be found online at: https://www.frontiersin.org/articles/10.3389/fmars.2019.00227/full#supplementary-material
References
Aminzadeh, M., Roderick, M.L., and Or, D. (2016). A generalized complementary relationship between actual and potential evaporation defined by a reference surface temperature. Water Resour. Res. 52, 385–406. doi: 10.1002/2015WR017969
Armstrong, J.L., Boldt, J.L., Cross, A.D., Moss, J.H., Davis, N.D., and Myers, K.W., et al. (2005). Distribution, size, and interannual, seasonal and diel food habits of northern Gulf of Alaska juvenile pink salmon, Oncorhynchus gorbuscha. Deep Sea Res. Part II Top. Stud. Oceanogr. 52, 247–265. doi: 10.1016/j.dsr2.2004.09.019
Arnqvist, G., and Wooster, D. (1995). Meta-analysis: synthesizing research findings in ecology and evolution. Trends Ecol. Evol. 10, 236–240. doi: 10.1016/S0169-5347(00)89073-4
Aydin, K.Y., McFarlane, G.A., King, J.R., Megrey, B.A., and Myers, K.W. (2005). Linking oceanic food webs to coastal production and growth rates of Pacific salmon (Oncorhynchus spp.), using models on three scales. Deep Sea Res. Part II: Top. Stud. Oceanogr. 52, 757–780. doi: 10.1016/j.dsr2.2004.12.017
Bakun, A., Field, D.B., Redondo-Rodriguez, A., and Weeks, S.J. (2010). Greenhouse gas, upwelling-favorable winds, and the future of coastal ocean upwelling ecosystems. Glob. Chang. Biol. 16, 1213–1228. doi: 10.1111/j.1365-2486.2009.02094.x
Barbier, E.B., Hacker, S.D., Kennedy, C., Koch, E.W., Stier, A.C., and Silliman, B.R. (2011). The value of estuarine and coastal ecosystem services. Ecol. Monogr. 81, 169–193. doi: 10.1890/10-1510.1
Barton, A., Hales, B., Waldbusser, G.G., Langdon, C., and Feely, R.A. (2012). The Pacific oyster, Crassostrea gigas, shows negative correlation to naturally elevated carbon dioxide levels: implications for near-term ocean acidification effects. Limnol. Oceanogr. 57, 698–710. doi: 10.4319/lo.2012.57.3.0698
Batiuk, R.A., Breitburg, D.L., Diaz, R.J., Cronin, T.M., Secor, D.H., and Thursby, G. (2009). Derivation of habitat-specific dissolved oxygen criteria for Chesapeake Bay and its tidal tributaries. J. Exp. Mar. Biol. Ecol. Ecol. Impacts Hyp. Living Resour. 381, S204–S215. doi: 10.1016/j.jembe.2009.07.023
Bednaršek, N., Feely, R.A., Reum, J.C.P., Peterson, B., Menkel, J., and Alin, S.R., et al. (2014b). Limacina helicina shell dissolution as an indicator of declining habitat suitability owing to ocean acidification in the California Current Ecosystem. Proc. R. Soc. B 281:20140123. doi: 10.1098/rspb.2014.0123
Bednaršek, N., Feely, R.A., Tolimieri, N., Hermann, A.J., Siedlecki, S.A., and Waldbusser, G.G., et al. (2017). Exposure history determines pteropod vulnerability to ocean acidification along the US West Coast. Scient. Rep. 7:4526. doi: 10.1038/s41598-017-03934-z
Bednaršek, N., Harvey, C.J., Kaplan, I.C., Feely, R.A., and MoŽina, J. (2016). Pteropods on the edge: cumulative effects of ocean acidification, warming, and deoxygenation. Prog. Oceanogr. 145, 1–24. doi: 10.1016/j.pocean.2016.04.002
Bednaršek, N., MoŽina, J., Vogt, M., O'Brien, C., and Tarling, G.A. (2012a). The global distribution of pteropods and their contribution to carbonate and carbon biomass in the modern ocean. Earth Syst. Sci. Data 4, 167–186. doi: 10.5194/essd-4-167-2012
Bednaršek, N., Tarling, G.A., Bakker, D.C.E., Fielding, S., and Feely, R.A. (2014a). Dissolution dominating calcification process in polar pteropods close to the point of aragonite undersaturation. PLoS ONE 9:e109183. doi: 10.1371/journal.pone.0109183
Bednaršek, N., Tarling, G.A., Fielding, S., and Bakker, D.C.E. (2012b). Population dynamics and biogeochemical significance of Limacina helicina antarctica in the Scotia Sea (Southern Ocean). Deep Sea Res. Part II Top. Stud. Oceanogr. 59–60, 105–116. doi: 10.1016/j.dsr2.2011.08.003
Bergan, A.J., Lawson, G.L., Maas, A.E., and Wang, Z.A. (2017). The effect of elevated carbon dioxide on the sinking and swimming of the shelled pteropod Limacina retroversa. ICES J. Mar. Sci. 74, 1893–1905. doi: 10.1093/icesjms/fsx008
Bopp, L., Resplandy, L., Orr, J.C., Doney, S.C., Dunne, J.P., and Gehlen, M., et al. (2013). Multiple stressors of ocean ecosystems in the 21st century: projections with CMIP5 models. Bioeosciences 10, 6225–6245. doi: 10.5194/bg-10-6225-2013
Busch, S.D., Maher, M., Thibodeau, P., McElhany, P., and Hofmann, G.E. (2014). Shell condition and survival of Puget Sound pteropods are impaired by ocean acidification conditions. PANGAEA, Supplement to: Busch, SD et al. (2014): shell condition and survival of puget sound pteropods are impaired by ocean acidification conditions. PLoS ONE 9:e105884. doi: 10.1371/journal.pone.0105884
Chavez, F.P., Pennington, J.T., Michisaki, R.P., Blum, M., Chavez, G.M., and Friederich, J., et al. (2017). Climate variability and change: response of a coastal ocean ecosystem. Oceanography 30, 128–145. doi: 10.5670/oceanog.2017.429
Comeau, S., Gorsky, G., Alliouane, S., and Gattuso, J.-P. (2010b). Larvae of the pteropod Cavolinia inflexa exposed to aragonite undersaturation are viable but shell-less. Mar. Biol. 157, 2341–2345. doi: 10.1007/s00227-010-1493-6
Comeau, S., Gorsky, G., Jeffree, R., Teyssié, J.-L., and Gattuso, J.-P. (2009). Impact of ocean acidification on a key Arctic pelagic mollusc (Limacina helicina). Biogeosciences 6, 1877–1882. doi: 10.5194/bg-6-1877-2009
Comeau, S., Jeffree, R., Teyssié, J.-L., and Gattuso, J.-P. (2010a). Response of the arctic pteropod Limacina helicina to projected future environmental conditions. PLoS ONE 5:e11362. doi: 10.1371/journal.pone.0011362
Crain, C.M., Kroeker, K., and Halpern, B.S. (2008). Interactive and cumulative effects of multiple human stressors in marine systems. Ecol. Lett. 11, 1304–1315. doi: 10.1111/j.1461-0248.2008.01253.x
Deutsch, C., Frenzel, H., McWilliams, J.C., Renault, L., Kessouri, F., and Howard, E., et al. (n.d.). Biogeochemical variability in the California Current System. In preparation.
Dupont, S., Dorey, N., and Thorndyke, M. (2010). What meta-analysis can tell us about vulnerability of marine biodiversity to ocean acidification? Estuar. Coast. Shelf Sci. 89, 182–185. doi: 10.1016/j.ecss.2010.06.013
Feely, R.A., Sabine, C.L., Hernandez-Ayon, J.M., Ianson, D., and Hales, B. (2008). Evidence for upwelling of corrosive “acidified” water onto the continental shelf. Science 320, 1490–1492. doi: 10.1126/science.1155676
Gaylord, B., Hill, T.M., Sanford, E., Lenz, E.A., Jacobs, L.A., and Sato, K.N., et al. (2011). Functional impacts of ocean acidification in an ecologically critical foundation species. J. Exp. Biol. 214, 2586–2594. doi: 10.1242/jeb.055939
Gimenez, I., Waldbusser, G.G., and Hales, B. (2018). Ocean acidification stress index for shellfish (OASIS): Linking Pacific oyster larval survival and exposure to variable carbonate chemistry regimes. Elem. Sci. Anth. 6:51. doi: 10.1525/elementa.306
Groffman, P.M., Baron, J.S., Blett, T., Gold, A.J., Goodman, I., and Gunderson, L.H., et al. (2006). Ecological thresholds: the key to successful environmental management or an important concept with no practical application? Ecosystems. 9, 1–13. doi: 10.1007/s10021-003-0142-z
Halpern, B.S., Walbridge, S., Selkoe, K.A., Kappel, C.V., Micheli, F., and D'Agrosa, C., et al. (2008). A global map of human impact on marine ecosystems. Science 319, 948–952. doi: 10.1126/science.1149345
Harris, K.E., DeGrandpre, M.D., and Hales, B. (2013). Aragonite saturation state dynamics in a coastal upwelling zone. Geophys. Res. Lett. 40, 2720–2725. doi: 10.1002/grl.50460
Harvey, B.P., Gwynn-Jones, D., and Moore, P.J. (2013). Meta-analysis reveals complex marine biological responses to the interactive effects of ocean acidification and warming. Ecol. Evol. 3, 2782–2782. doi: 10.1002/ece3.728
Hauri, C., Gruber, N., Vogt, M., Doney, S.C., Feely, R.A., and Lachkar, Z., et al. (2013). Spatiotemporal variability and long-term trends of ocean acidification in the California Current System. Biogeosciences 10, 193–216. doi: 10.5194/bg-10-193-2013
Hedges, L.V., Gurevitch, J., and Curtis, P.S. (1999). The meta-analysis of response ratios in experimental ecology. Ecology 80, 1150–1156. doi: 10.1890/0012-9658(1999)080[1150:TMAORR]2.0.CO;2
Hettinger, A., Sanford, E., Hill, T.M., Russell, A.D., Sato, K.N.S., and Hoey, J., et al. (2012). Persistent carry-over effects of planktonic exposure to ocean acidification in the Olympia oyster. Ecology 93, 2758–2768. doi: 10.1890/12-0567.1
Higgins, J.P.T., and Thompson, S.G. (2002). Quantifying heterogeneity in a meta-analysis. Stat. Med. 21, 1539–1558. doi: 10.1002/sim.1186
Hunt, B.P.V., Pakhomov, E.A., Hosie, G.W., Siegel, V., Ward, P., and Bernard, K. (2008). Pteropods in southern ocean ecosystems. Prog. Oceanogr. 78, 193–221. doi: 10.1016/j.pocean.2008.06.001
IPCC (2014). Climate Change 2014: Synthesis Report. Contribution of Working Groups I, II and III to the Fifth Assessment Report of the Intergovernmental Panel on Climate Change. Geneva: IPCC.
Juranek, L.W., Feely, R.A., Peterson, W.T., Alin, S.R., Hales, B., and Lee, K., et al. (2009). A novel method for determination of aragonite saturation state on the continental shelf of central Oregon using multi-parameter relationships with hydrographic data. Geophys. Res. Lett. 36, 1–6. doi: 10.1029/2009GL040778
Karpenko, V.I., Volkov, A.F., and Koval, M.V. (2007). Diets of pacific salmon in the sea of okhotsk, bering sea, and northwest pacific ocean. N. Pac. Anadr. Fish Comm. 105–116.
Kessouri, F., McWilliams, J.C., Bianchi, D., Renault, L., Frenzel, H., and Deutsch, C. (n.d.). Modulation of the seasonal cycle of nutrients productivity by submesoscale currents in the California Current System. In prep for submission to Global Biogeochemical Cycles.
Kroeker, K.J., Kordas, R.L., Crim, R., Hendriks, I.E., Ramajo, L., and Singh, G.S., et al. (2013). Impacts of ocean acidification on marine organisms: quantifying sensitivities and interaction with warming. Glob. Chang. Biol. 19, 1884–1896. doi: 10.1111/gcb.12179
Kwiatkowski, L., and Orr, J.C. (2018). Diverging seasonal extremes for ocean acidification during the twenty-first century. Nat. Clim. Chang. 8, 141–145. doi: 10.1038/s41558-017-0054-0
Lalli, C.M., and Gilmer, R.W. (1989). Pelagic Snails: The Biology of Holoplanktonic Gastropod Mollusks, 1 edition. Stanford, CA: Stanford University Press.
Lewis, S., and Clarke, M. (2001). Forest plots: trying to see the wood and the trees. BMJ 322, 1479–1480. doi: 10.1136/bmj.322.7300.1479
Lischka, S., Büdenbender, J., Boxhammer, T., and Riebesell, U. (2011). Impact of ocean acidification and elevated temperatures on early juveniles of the polar shelled pteropod Limacina helicina: mortality, shell degradation, and shell growth. Biogeosciences 8, 919–932. doi: 10.5194/bg-8-919-2011
Lischka, S., and Riebesell, U. (2012). Synergistic effects of ocean acidification and warming on overwintering pteropods in the Arctic. Glob. Chang. Biol. 18, 3517–3528. doi: 10.1111/gcb.12020
Lischka, S., and Riebesell, U. (2017). Metabolic response of Arctic pteropods to ocean acidification and warming during the polar night/twilight phase in Kongsfjord (Spitsbergen). Polar Biol. 40, 1211–1227. doi: 10.1007/s00300-016-2044-5
Maas, A.E., Lawson, G.L., Bergan, A.J., and Tarrant, A.M. (2018). Exposure to CO2 influences metabolism, calcification and gene expression of the thecosome pteropod Limacina retroversa. J. Exp. Biol. 221:jeb164400. doi: 10.1242/jeb.164400
Maas, A. E., Lawson, G. L., and Wang, Z. A. (2016). The metabolic response of thecosome pteropods from the North Atlantic and North Pacific Oceans to high CO2 and low O2. Biogeosciences, 13:6191–6210. doi: 10.5194/bg-13-6191-2016
Maas, A. E., Wishner, K. F., and Seibel, B. A. (2012). Metabolic suppression in thecosomatous pteropods as an effect of low temperature and hypoxia in the eastern tropical North Pacific. Mar. Biol. 159, 1955–1967. doi: 10.1007/s00227-012-1982-x
Manno, C., Morata, N., and Primicerio, R. (2012). Limacina retroversa's response to combined effects of ocean acidification and sea water freshening. Estuar. Coast. Shelf Sci. 113, 163–171. doi: 10.1016/j.ecss.2012.07.019
Manno, C., Peck, V.L., and Tarling, G.A. (2016). Pteropod eggs released at high pCO2 lack resilience to ocean acidification. Scient. Rep. 6:25752. doi: 10.1038/srep25752
Mastrandrea, M.D., Field, C.B., Stocker, T.F., Edenhofer, O., Ebi, K.L., and Frame, D.J., et al. (2010). Guidance Note for Lead Authors of the IPCC Fifth Assessment Report on Consistent Treatment of Uncertainties. Intergovernmental Panel on Climate Change (IPCC).
Meyer, J., and Riebesell, U. (2015). Reviews and Syntheses: Responses of coccolithophores to ocean acidification: a meta-analysis. Biogeosciences 12, 1671–1682. doi: 10.5194/bg-12-1671-2015
Moore, J.K., Doney, S.C., and Lindsay, K. (2004). Upper ocean ecosystem dynamics and iron cycling in a global three-dimensional model. Global Biogeochem. Cycles 18, 1–21. doi: 10.1029/2004GB002220
Moya, A., Howes, E.L., Lacoue-Labarthe, T., Forêt, S., Hanna, B., and Medina, M., et al. (2016). Near-future pH conditions severely impact calcification, metabolism and the nervous system in the pteropod Heliconoides inflatus. Glob. Chang. Biol. 22, 3888–3900. doi: 10.1111/gcb.13350
Muggeo, V. (2008). Segmented: an r package to fit regression models with broken-line relationships. R News 8, 20–25.
Peck, V.L., Oakes, R.L., Harper, E.M., Manno, C., and Tarling, G.A. (2018). Pteropods counter mechanical damage and dissolution through extensive shell repair. Nat. Commun. 9:264. doi: 10.1038/s41467-017-02692-w
Renault, L., McWilliams, J.C., Jousse, A., Deutsch, C., Frenzel, H., and Kessouri, F., et al. (n.d.). Revisiting the California Current System using uncoupled oceanic atmospheric models. In preparation.
Seibel, B.A., Maas, A.E., and Dierssen, H.M. (2012). Energetic plasticity underlies a variable response to ocean acidification in the pteropod, Limacina helicina antarctica. PLoS ONE 7:e30464. doi: 10.1371/journal.pone.0030464
Shchepetkin, A.F., and McWilliams, J.C. (2005). The regional oceanic modeling system (ROMS): a split-explicit, free-surface, topography-following-coordinate oceanic model. Ocean Model. 9, 347–404. doi: 10.1016/j.ocemod.2004.08.002
Shchepetkin, A.F., and McWilliams, J.C. (2009). Correction and commentary for “Ocean forecasting in terrain-following coordinates: Formulation and skill assessment of the regional ocean modeling system” by Haidvogel et al., J. Comp. Phys. 227, pp. 3595–3624. J. Comp. Phys. 228, 8985–9000. doi: 10.1016/j.jcp.2009.09.002
Teck, S.J., Halpern, B.S., Kappel, C.V., Micheli, F., Selkoe, K.A., and Crain, C.M., et al. (2010). Using expert judgment to estimate marine ecosystem vulnerability in the California Current. Ecol Appl 20, 1402–1416. doi: 10.1890/09-1173.1
Thabet, A.A., Maas, A.E., Lawson, G.L., and Tarrant, A.M. (2015). Life cycle and early development of the thecosomatous pteropod Limacina retroversa in the Gulf of Maine, including the effect of elevated CO2 levels. Mar. Biol. 162, 2235–2249. doi: 10.1007/s00227-015-2754-1
Viechtbauer, W. (2010). Conducting meta-analyses in R with the metafor package. J. Stat. Softw. 36, 1–48. doi: 10.18637/jss.v036.i03
Waldbusser, G.G., Hales, B., Langdon, C.J., Haley, B.A., Schrader, P., and Brunner, E.L., et al. (2015). Saturation-state sensitivity of marine bivalve larvae to ocean acidification. Nat. Clim. Chang. 5, 273–280. doi: 10.1038/nclimate2479
Wang, K., Hunt, B.P.V., Liang, C., Pauly, D., and Pakhomov, E.A. (2017). Reassessment of the life cycle of the pteropod Limacina helicina from a high resolution interannual time series in the temperate North Pacific. ICES J. Mar. Sci. 74, 1906–1920. doi: 10.1093/icesjms/fsx014
Keywords: ocean acidification, warming, water quality criteria, thresholds, pteropods, meta-analyses, synthesis, expert consensus
Citation: Bednaršek N, Feely RA, Howes EL, Hunt BPV, Kessouri F, León P, Lischka S, Maas AE, McLaughlin K, Nezlin NP, Sutula M and Weisberg SB (2019) Systematic Review and Meta-Analysis Toward Synthesis of Thresholds of Ocean Acidification Impacts on Calcifying Pteropods and Interactions With Warming. Front. Mar. Sci. 6:227. doi: 10.3389/fmars.2019.00227
Received: 12 December 2018; Accepted: 11 April 2019;
Published: 09 May 2019.
Edited by:
Daniel Rittschof, Duke University, United StatesReviewed by:
Shiguo Li, Research Center for Eco-environmental Sciences (CAS), ChinaGary H. Dickinson, The College of New Jersey, United States
Copyright © 2019 Bednaršek, Feely, Howes, Hunt, Kessouri, León, Lischka, Maas, McLaughlin, Nezlin, Sutula and Weisberg. This is an open-access article distributed under the terms of the Creative Commons Attribution License (CC BY). The use, distribution or reproduction in other forums is permitted, provided the original author(s) and the copyright owner(s) are credited and that the original publication in this journal is cited, in accordance with accepted academic practice. No use, distribution or reproduction is permitted which does not comply with these terms.
*Correspondence: Nina Bednaršek, bmluYWJAc2Njd3JwLm9yZw==